1. Introduction
Energy production technologies based on fossil fuel combustion are the main source of energy production in the world, causing pollution and degradation of the natural environment [
1,
2]. Based on the European Commission’s environment and energy laws, it is possible to conclude that the EU strongly supports the decarbonisation of the energy sector by increasing the production of hydrogen. Another target is the integration of the EU energy networks. The driving force of changes in the energy sector in Europe will be a new EU legislative framework for hydrogen networks, comparable to those that already exist for natural gas and electricity. It is necessary to develop new clean technologies to generate energy based on renewable sources [
3,
4]. The development of these technologies is fostered by social pressure, carbon neutrality requirements, the political environment and appropriate legal regulations. It fits into the main theme of the decarboxylation approach as it has the potential to reduce CO
2 and CH
4 emissions into the air and improve the quality of life for future generations. The increase in the expenditure on new renewable energy technologies, including the energy use of biomass to bio-hydrogen, may constitute a solution to these challenges [
5]. Although there exist several methods of hydrogen production, e.g., by emptying different technologies such as water electrolysis or thermochemical and biological process [
6], 95% of hydrogen production is based on fossil fuels. Biological hydrogen production offers many benefits, such as clean gas, simple technology and cheap high-density energy (123 kJ/g). In addition, its utilization does not generate any greenhouse gases, and it has some major economic and environmental advantages. Biofuels are considered to be liquid, gas, and solid fuels predominantly produced using biomass. A variety of fuels can be obtained from biomass, such as ethanol, methanol, hydrogen and methane [
7]. The plant biomass from which biofuels are produced accumulates solar energy. First-generation biofuels are produced using conventional methods, such as fermentation or esterification, which do not require large amounts of energy. In the case of the first generation of biofuels, the so-called conventional ones, the production is based on edible plants, such as sugar beet root, corn, sugar cane, cereals, potatoes (starch) or vegetable oils (rapeseed, palm or jatropha), whereas bioethanol is produced by means of alcoholic fermentation, and biodiesel is produced by the esterification of vegetable oils. Biohydrogen production can be carried out in batch, fed-batch, and continuous modes. The types of reactors for biohydrogen production can be divided into open and closed systems. Closed fermentation systems can be tubular reactors, bubble columns or airlifts. A bioreactor used in hydrogen production significantly affects the efficiency and effectiveness of hydrogen production.
Decellulosic biomass constitutes the main raw material for the production of second-generation biofuels. These biofuels are bio-based products that come from non-food feedstock that is lignocellulosic biomass, such as agricultural and forestry feedstock. It includes residues produced by agricultural and food processing systems (discarded biomass). The advantage of the second-generation biofuels is the ability to use the entire plant (including the stem, leaves and husk) and not just parts of it (e.g., seeds), such as in the case of the first-generation raw materials. The second-generation biofuels convert cellulose to liquid fuel, allowing the utilization of the entire plant, which is predominantly made up of cellulose [
8,
9]. The third-generation biofuels are produced from cultivated aquatic feedstock (i.e., algae) after the fuel refining process [
10,
11]. Various sources of biomass carbon, including glucose, galactose, sucrose, and different feedstocks, such as municipal wastewater cheese, yeast or oat straw, can be applied in hydrogen production.
The biological methods enable us to produce cost-effective hydrogen by means of dark fermentation; in addition, the process of photo-fermentation may also be applied in the production of hydrogen from various sources [
12,
13]. However, the production efficiency, to a large extent, depends on the temperature, the pH and the light intensity. Another method worth mentioning is the combined photo and dark fermentation method for bio-hydrogen production, which can be increased by 20–189% [
14]. Two-step hybrid processes were implemented to produce hydrogen from diluted solid waste. Typically, bio-hydrogen production is based on a continuously stirred tank reactor; a tube anaerobic packed bed reactor may be considered a promising technology for BioH
2 production because a high organic loading rate can be achieved using recirculation and a large surface area to provide better microorganism contact [
15]. This bio-hydrogen production CFD simulation tool is used to simulate all kinds of complex problems resulting from the variability of the parameters of biological models. The CFD methods enable the determination of variables, such as volume fraction, shear strain rate or turbulence kinetic energy. They also facilitate the reliable prediction of the relevant hydrodynamic variables, the computational times and fluid dynamics coupling, as well as mass transfer and kinetic variables. Additionally, the influence of inner geometry and mass phase transfer can be used in numerical simulations [
16].
The integration of physical and biological processes still poses great challenges. Despite the fact that it is essential to develop and apply new methods to enhance our understanding of reactor hydrodynamics, heat and mass transfer [
17], there are very few publications concerning the modelling in packed bed bio-hydrogen production [
18,
19]. The CFD methods can be used to optimize the reactor configuration and, thus, improve the performance of a bio-hydrogen production reactor. Computational fluid dynamics (CFD) software can predict the hydrodynamics of fluid flow, heat and mass transfer, chemical reactions in a reactor, and other related phenomena by solving a set of partial differential equations. Processes describing mass, momentum, energy and species balances are advanced methods that have been widely and successfully employed [
20,
21]. CFD is an efficient tool for hydrodynamics-biokinetics analysis of anaerobic digestion of partial differential equations [
22]. It is complicated because it demands a complex biological kinetics process using UDF function written in C language. It also allows for optimizing performance costs without increasing the cost of prototyping [
23]. To see a flow pattern of liquid, CFD could be employed, focusing on predicting hydrodynamics patterns through porous media. Flow dispersity patterns through a packed bed reactor resulted in arranged spherical particles using the DEM method coupling with a biokinetics model, which is an efficient method to predict bio-hydrogen concentration in a continuous tube reactor [
24]. Parameters such as hydraulic retention time, hydrogen production rate, substrate conversion, pressure drop, and flow dispersity can be calculated by CFD to see the flow pattern of liquid through porous media [
25].
Therefore, this study investigates a full-transient three-phase CFD of a new design project continuous plug flow reactor model to analyze the heat and mass transfer, the reaction kinetics and fluid dynamics of bio-hydrogen production by means of fermentation. The reaction kinetics model was taken from Frascari et al. using T.neapolitana microorganisms with the Andrews model of substrate inhibition [
26]. The effect of different operating parameters, such as the HRT, the pH and the feed rate on the bio-hydrogen production rate, were also considered in this study. Future reactor optimization and modification will be employed.
2. Materials and Methods
In this research work, we used a three-dimensional, unsteady, incompressible, multiphase CFD tube reactor model to simulate bio-hydrogen production. The Lagrangian–Eulerian approach was adopted with a two-phase model using appropriate Reynolds stress closure solved by boundary conditions. The liquid flow was laminar based on Reynolds number general criteria (Re) at the inlet. The fluid properties were constant except for the formulation of the buoyancy term.
The governing equations of continuity Equation (1) and momentum Equation (2) can be written as follows:
where
is the volume average density,
is the flow velocity,
is the static pressure,
is the stress tensor,
represents the gravitational body force and
represents the external force.
The continuity equation for the gas phase is:
where
is the gas density,
is the gas velocity,
is the interphase mass transfer terms for the gas-solid interface reactions, and
is the volume fraction of the gas phase.
The energy equation for a fluid region is given by Equation (4):
where
, k,
and
Sh are the density, molecular conductivity, temperature and the volumetric heat source, respectively;
is the flow velocity, while k
l is the heat conductivity due to turbulent transport.
The momentum equation for the gas phase is:
where
is the second order stress tensor of the gas,
is the interaction force representing momentum transfer between the gas and solid phase,
is the gravitational force, and
is the mass source.
The gas species is:
where
is the effective mass diffusion coefficient, Y
i is the mass fraction of gas species I,
is the species source term from the particle, and
is the species source term from reactions.
The liquid phase of continuity and momentum equations is:
where
is the void fraction of the fluid phase,
is the density of the fluid phase,
is the velocity of the fluid phase,
is the momentum viscous tensor,
is the Reynolds tensor and
is the momentum of the source term.
2.1. Reactor Design (Geometry and Mesh) and Operations
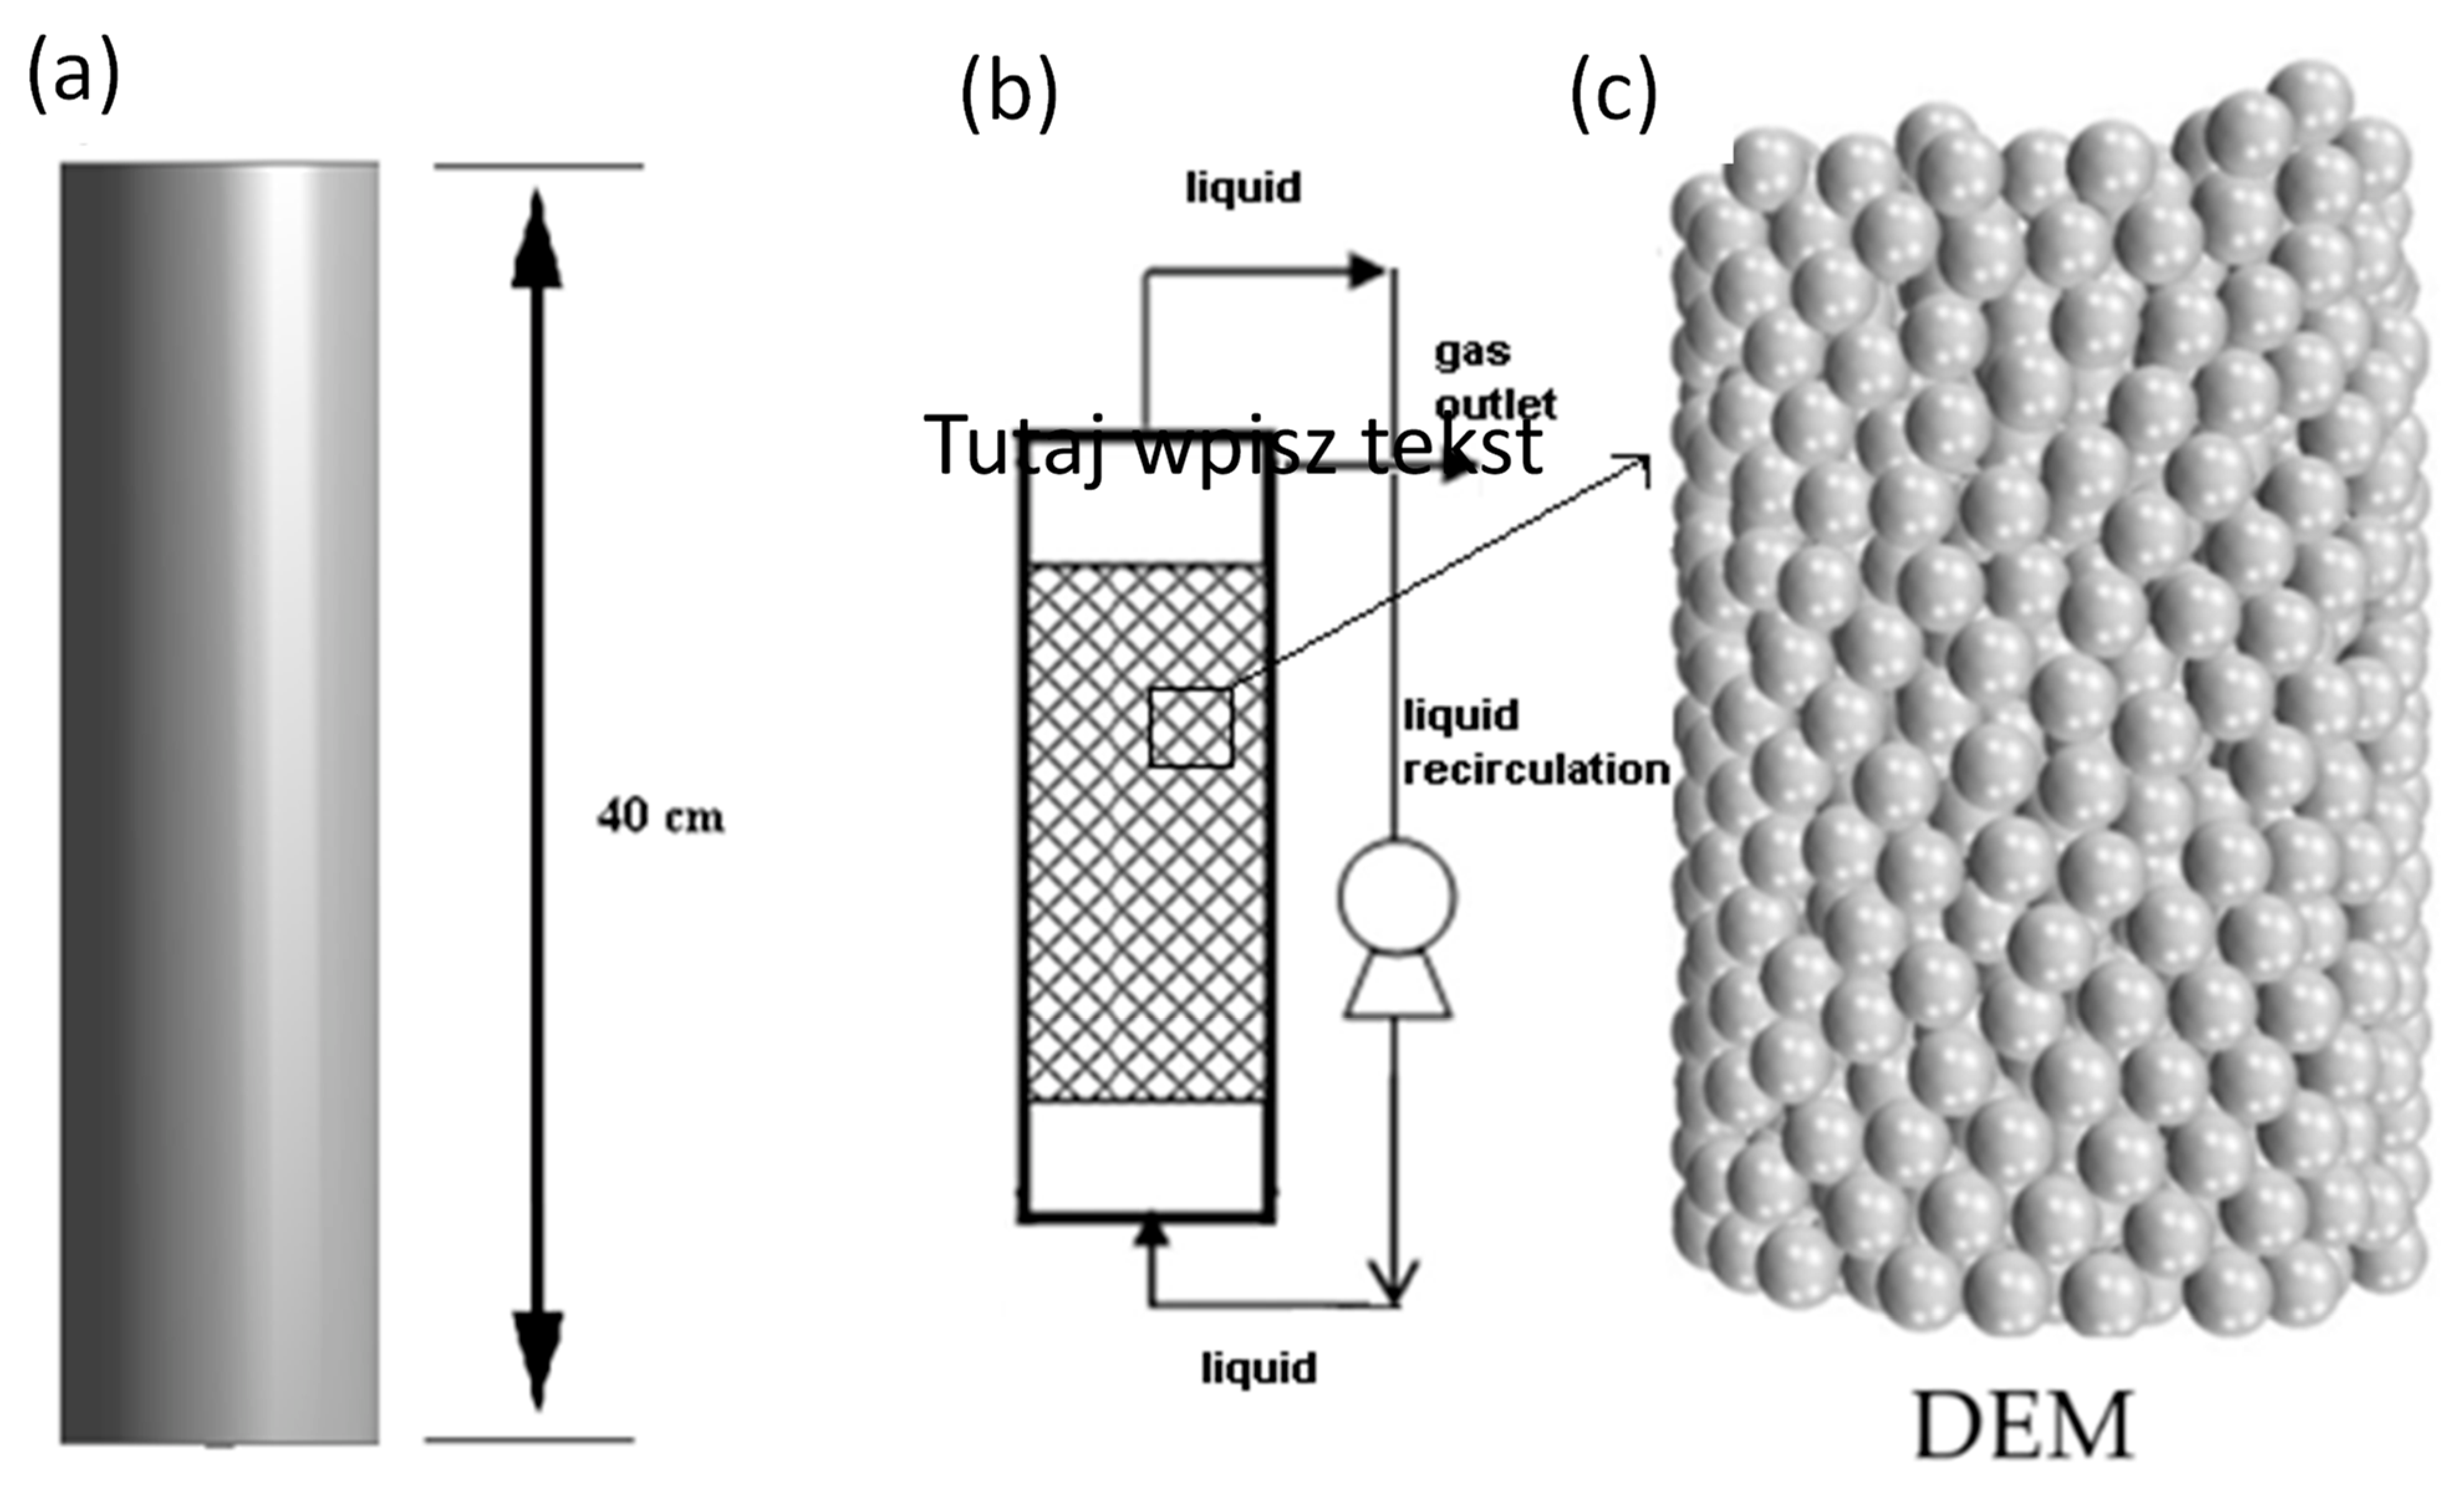
The 3D geometry of the tube reactor was drawn using ANSYS WB (Cannonsburg, PA, US) and exported to ANSYS Fluent 15.0 (Cannonsburg, PA, US)
Figure 1. The tube reactor diameter was 10 cm, whereas the length of the reactor was 40 cm to achieve a total working volume of 3.14 L. The outer shell, which is a cylinder with a central rotation axis, was also considered. A packed bed reactor should have 4 times more length than diameter to achieve the best-packed biofilm composition. The volume of the reactor was 3140 cm
3 (3.14 L). The packed bed reactor density was 0.92 g/cm
3, and its porosity was 84%. The geometry was divided into a number of discrete cells, and the governing equations were solved numerically until the time-step horizon was converged for a transient study. The DEM (discrete element method) coupled with CFD was used to create a packed bed with a spherical particle tube reactor. Biohydrogen production on the immobilized culture was via a continuously operated biofilm as a 2 mm thickness layer on the packed bed. The inlet was a liquid, while gaseous effluent was collected at the top side of the reactor. A mesh refinement study was made during grid spacing by reducing the factor from 0.5 to 0.002 mm until the results were unremarkably changed with the grid size reduction. It was found that 0.015 mm is fine enough to obtain grid-independent results. The total number of mesh elements was 0.15863 mL. Overall, the mesh provided the best accuracy and was adopted for the CFD simulation. To estimate the grid convergence uncertainty of the CFD solution, this study used the grid convergence index (GCI) method based on the Richardson extrapolation. The initial wall boundary y + spacing remained the same for each grid refinement level.
2.2. Kinetics Model of Bio-Hydrogen Production
The kinetic model of bio-hydrogen production was taken from Frascari [
22] using T. neapolitana bacteria with the Andrews model of substrate inhibition:
where
is the maximum H
2 specific production rate (mmol
H2g
−1 h
−1),
is the substrate concentration (g/L) and
is the inhibition constant (g/L).
The kinetics conservation equation was implemented in the CFD software by UDF function written in C code. The model contains protein, which makes up about 27–30% of the dry weight of T. neapolitana. A numerical CFD study of hydrodynamics-biokinetics aspects for interactions between multiphase is an important part of how hydrodynamics influence biokinetics for biohydrogen production. This numerical model contains kinetics information, which is applicable to a set of process parameters, thereby complicating process analysis and the design of the fermentation system. Adoption of kinetics models is also complicated across different studies making application of process analysis and design of fermentation system.
2.3. Numerical Simulations
The Lagrangian–Eulerian approach was adopted to describe the biomass slurry flow behavior of the liquid-gas phase in laminar flow. Both phases were treated as continua interpenetrating and interacting with each other in the computational domain. The recirculation flow rate coefficient was 0.3. The initial and boundary conditions are presented in
Table 1. The temperature was 30–42 °C. This long-term simulation lasted 30 days. The concentration of gas products and soluble metabolites (volatile fatty acid) were evaluated during all the operation phases at designated time intervals.
All terms of the governing equations are discrete using the second-order upwind scheme. The PRESTO (pressure staggering option) algorithm was employed for the pressure–velocity coupling. The Green–Gauss cell-based method was used for the discretization of the gradient. Each case was simulated in ANSYS Fluent 2016 software (Cannonsburg, PA, US) with the initialization procedure for simulations with second-order schemes. Convergence was judged based on the low mass flow rate imbalance below 1.0 × 10⁴ (kg/s). The second step was to generate an ANSYS Fluent (Cannonsburg, PA, US) journal file to automatically run the flow case with the prescribed boundary conditions from the algorithm for the pressure, flow rate and temperature. The numerical simulations were performed on an i7-3770 CPU 3.70 GHz processer Intel computer with 16 GB RAM and a 64-bit operating system.
3. Results and Discussion
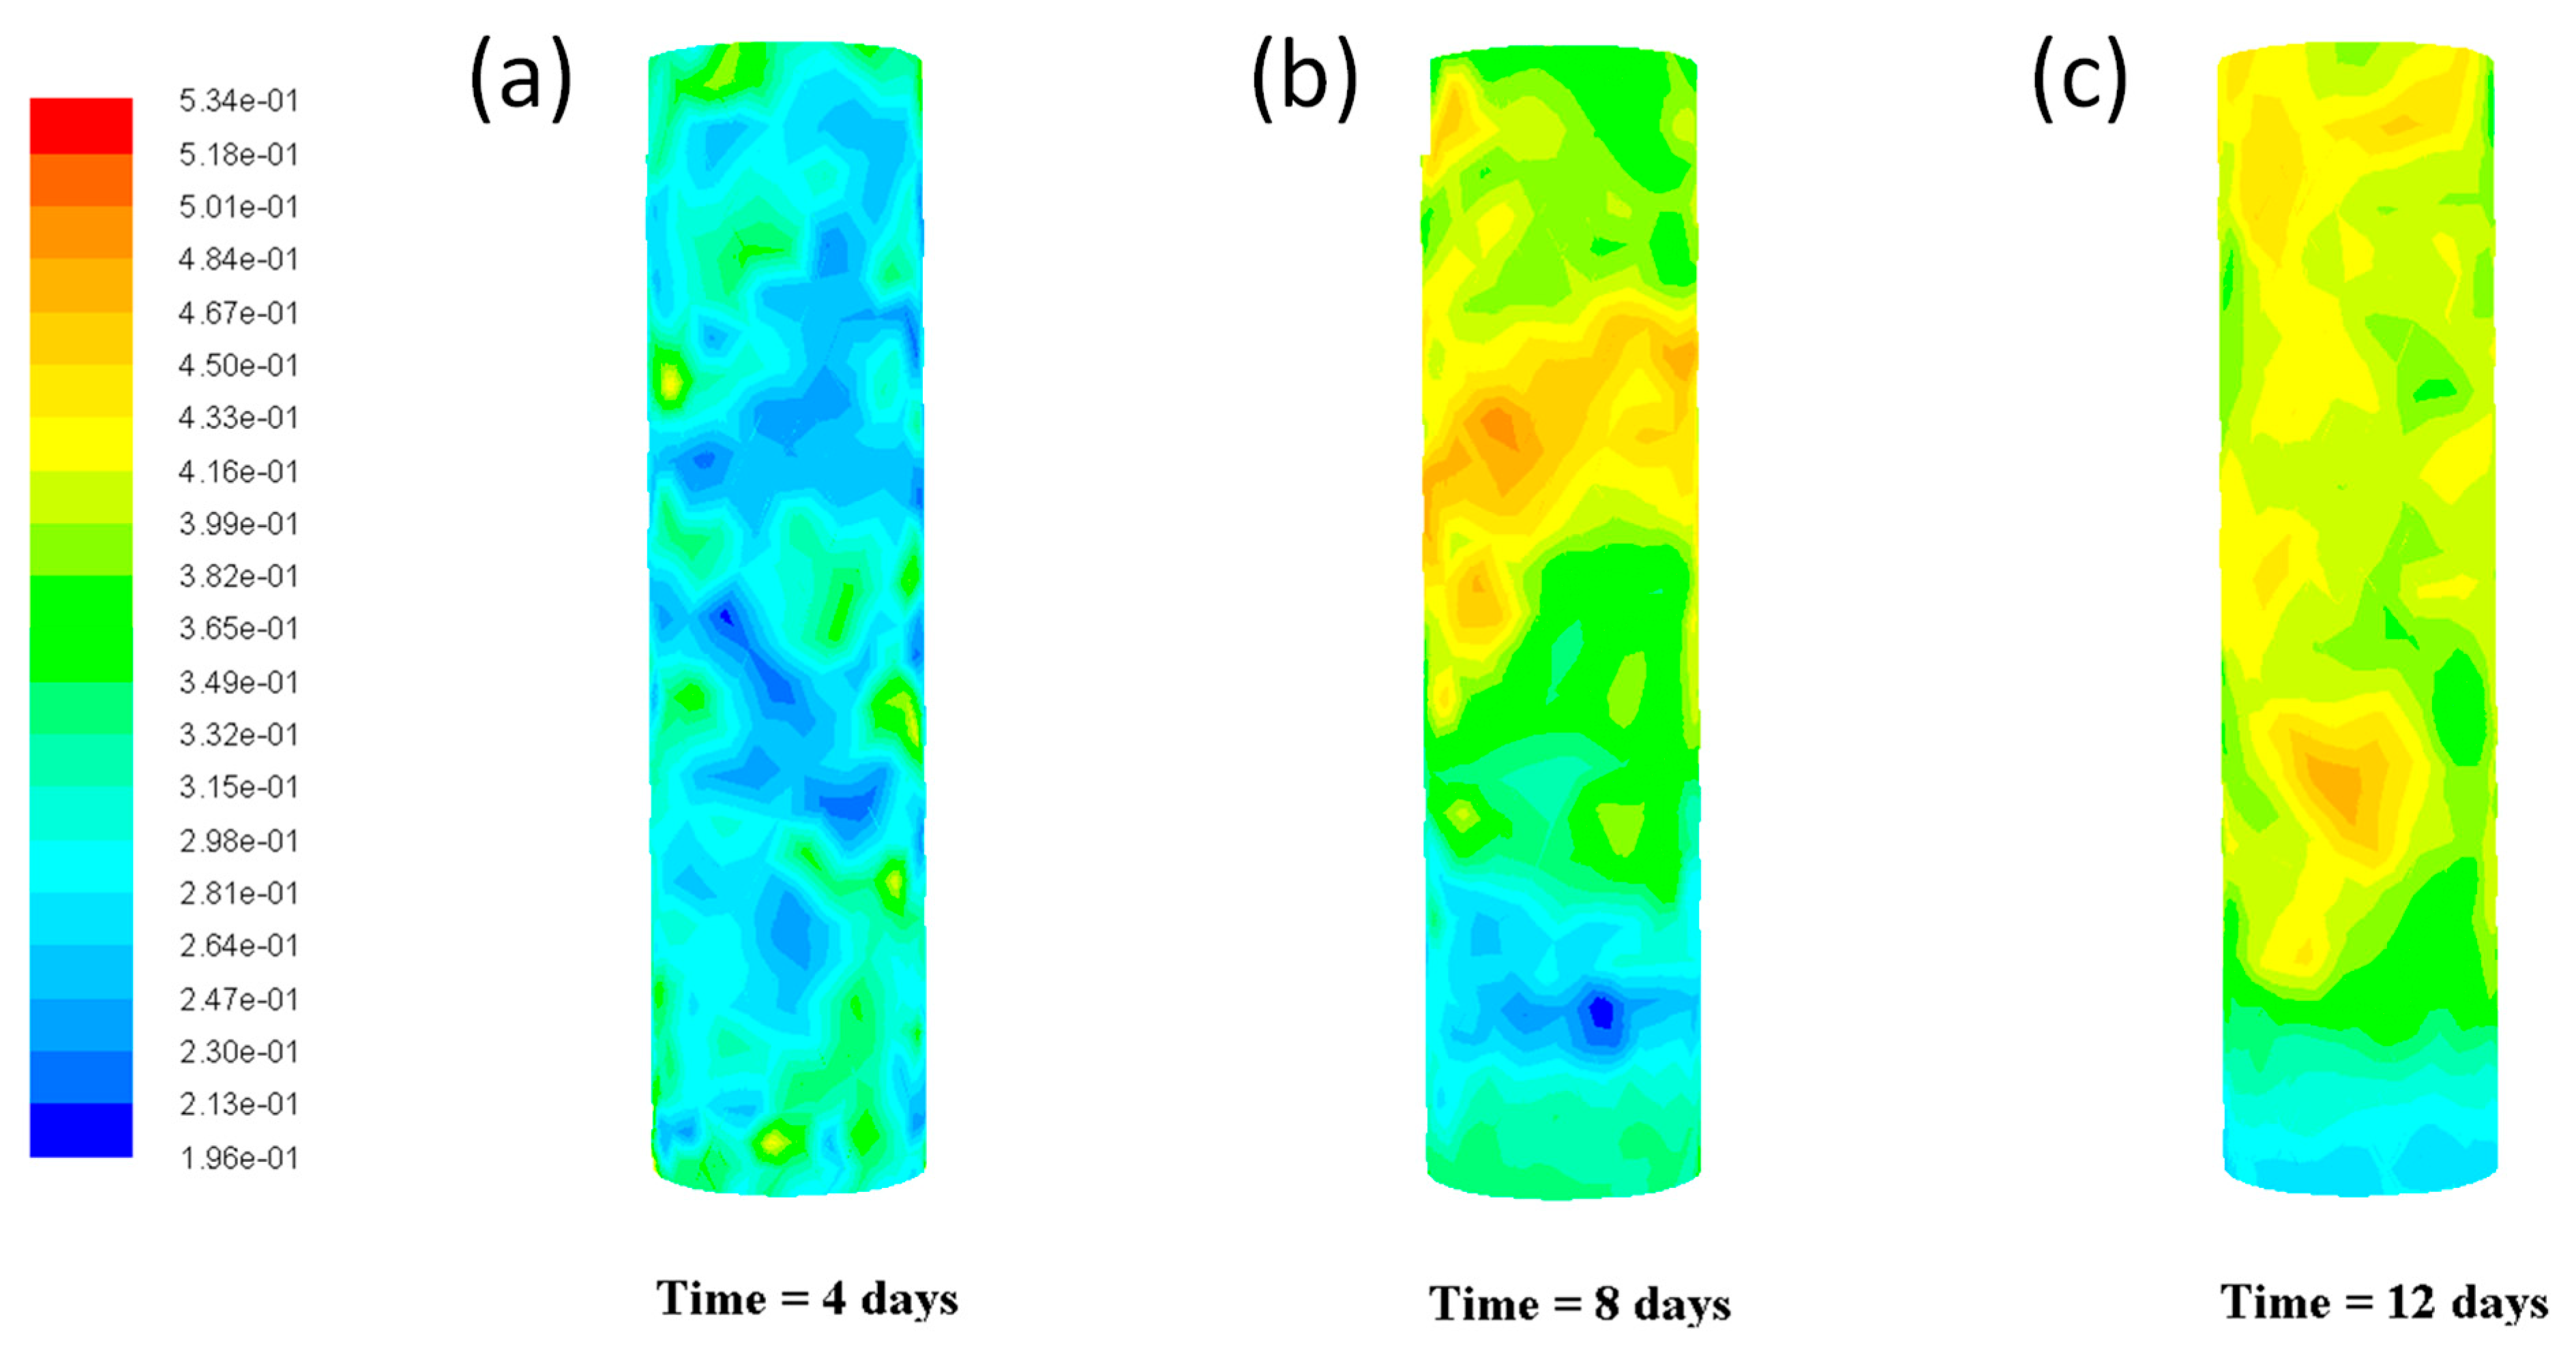
Figure 2 shows the effects on bio-hydrogen production during the fermentation process for different times (4–12 days). It was found that the predictions of bio-hydrogen concentration increase with the number of days. The yield of bio-hydrogen was 0.196–0.534 mg/h/L in different parts of the reactor. The reactor temperature was 298 K, and the HRT was 2 h. Concentrations of biohydrogen filled the packed bed differently. The fluid velocity profile is laminar, where the maximum velocity occurs in the center of the reactor. It was observed that the temperature gradient occurs only at the reactor inlet due to the heat transfer from the reactor wall.
Figure 3 presents the metabolite proportions (acetic, propionic and butyric fatty acid) in the substrate fermentation process for different HRT values. Acetic and butyric acids are the main metabolites produced by fermentation and constitute the main products at the end of bio-hydrogen production. The proportions of these metabolites change with days and are associated with higher Bio-H
2 production when the value of the Bu/Ac ratio is 0.4–0.9. The acetic fermentative pathway was the main route for bio-hydrogen production. The fermentative pathway implied hydrogen in reduced metabolites. The low biomass retention may contribute to the changing metabolic pathways of acetogenic bacteria.
Figure 4a,b shows the bio-hydrogen production rates and yield during the fermentation process for various HRT in a transient simulation lasting 12 days. It can be seen that the bio-hydrogen concentration changes. Hydrogen production fluctuated strongly for carbon sources of glucose. HY (mol H
2 produced/mol substrate consumed) and HPR (volume H
2 produced/H
2 evolution time/ reactor volume) during all the reaction operations enabled us to estimate the potential of the produced bio-hydrogen. Oscillation behaviour is observed in continuous culture caused by a dynamic system of bacterial growth kinetics model. The continuous fermentation process manifests oscillating behaviour by self-sustained oscillation, including key process variables such as biomass/product concentration for feed and culture conditions in oscillatory mode, which changes in substrate concentration. The difficulty in obtaining stable H
2 productivity was caused by the homoacetogenic Wood–Ljumgdahl pathway.
The content of bio-hydrogen was the highest in the period of 4–6 days, and then it started to decrease by approximately 23.87%. A systematic decrease in H2 concentration was observed throughout the whole process. The instability of bio-hydrogen production occurs during long-term operations of systems inoculated with mixed bacteria cultures. The HTR has an important influence on bio-hydrogen production, and an increase in HTR for 5 h causes a 78% decrease in bio-hydrogen production.
Figure 5 presents the influence of the HRT on the Bio-H
2 production rate and yield depending on the Ac/Bu ratio. It was observed that the HRT has a significant influence on the average concentration values of acetic and butyric acids. When the Ac/Bu ratio decreases from 5 to 1 h, the production of butyric and acetic acids decreases drastically. This is due to the fact that at low HRT values, the substrate residence time in APBR was too short for the degradation of organic matter. The determination of the composition of soluble microbial products (SMP) implied increased efficiency of the fermentation pathway, which, depending on the Ac/Bu ratio, has an important influence on the H
2 yield and production rate. HRT strongly affects bio-hydrogen production, the optimum values of which is between 2–3 h. Reduced H
2 content is caused by the production of CO
2 by bacteria species that do not produce biohydrogen. Moreover, short HRT increases the rate of substrate conversion and generates higher substrate flow. For HTR equal to 1 h, acetic acid dominates because the productivity of metabolites decreases with decreasing HRT with decreasing substrate conversion. The acetic pathway is the most effective pathway in the dark fermentation process.
Figure 6 shows the total suspended solids in the effluent of the packed bed tube reactor. The TSS is a parameter depending on the HRT. A decrease in the HTR value causes an increase in the amount of biohydrogen leaving the reactor. The decrease in the HRT parameter from 5 to 1 h corresponds to an increase in the flow velocity at the inlet to the reactor of 0.3–4.6 L/h. After 12 days of continuous operations, about 2.89 g of TSS and 3.02 g of TVS were gathered in the packed bed reactor. Limited biohydrogen production at the reactor could be due to a lower value of pH and fermentation product accumulation.
As can be seen in
Figure 7a, the process shows nonlinear behavior. The dilution rate strongly influences biohydrogen production, with an optimum dilution rate between 0.2 and 0.4 L/h for pH 6. Additionally, substrate/biomass ratio (SBR) is an important parameter of BioH2 production.
Figure 7b shows the influence of pH and substrate concentration (gCOD/L) on bio-H
2 production. Finally, the model of dark fermentation shows that the most optimal pH for the hydrogen production process is around 5–6. Lowering pH effectively reduces the process of methanogenesis, simultaneously increasing bio-hydrogen production. At lower HRTs, the most important parameter affecting the hydrogen yield was butyrate concentration.


