Article

Discrete Element Simulation on Sand-Bed Collision Considering Surface Moisture Content

1
Key Laboratory of Mechanics on Disaster and Environment in Western China, Lanzhou University, Lanzhou 730000, China
2
College of Civil Engineering and Mechanics, Lanzhou University, Lanzhou 730000, China
3
Key Laboratory of Service Environment and Intelligent Operation and Maintenance of Rail Transit, Lanzhou Jiaotong University, Lanzhou 730070, China
4
School of Mechanical Engineering, Lanzhou Jiaotong University, Lanzhou 730070, China
*
Author to whom correspondence should be addressed.
These authors contributed equally to this work.
Processes 2022, 10(1), 52; https://doi.org/10.3390/pr10010052
Submission received: 20 November 2021 / Revised: 20 December 2021 / Accepted: 23 December 2021 / Published: 28 December 2021
(This article belongs to the Special Issue DEM Simulations and Modelling of Granular Materials)

Abstract

:
The process of aeolian sand transport is an important mechanism leading to the formation and evolution of local landforms in coastal areas and desert lakes. For a long time, the role of surface moisture in incipient motion of sand grains by wind stress has been extensively studied but, in fact, sand-bed collision is the main mechanism in steady aeolian sand flow. At present, the lack of understanding of surface moisture content on sand-bed collision limits the application of aeolian sand transport models in wet coastal areas. In this paper, we adopt numerical simulations to discuss and analyze the effect of cohesive forces formed by surface moisture content on the sand-bed collision process based on discrete element method. High density contact forces appear with the surface moisture increasing, and form a closed structure around the edge of crater to resist the avulsion in horizontal direction. Under high moisture condition, even though the ejected sand grains saltate away from the surface, the tension forces will prevent from leaving. The ejected number trend with incident velocity shows some nonlinear characteristics due to the unequally distributed force chains and liquid bridges in the unsaturated sand bed surface.

1. Introduction

Coastal aeolian sand transport is a first-order control on growth of local dunes and ripples, shaping the landforms and resulting in the generation and evolution of desertification [1,2,3,4]. The temporal variability of surface moisture on beaches plays a critical role in the process of aeolian sand transport, and the incorporation of cohesive forces formed by surface moisture into wind blown sediment transport models is an important issue in the field of aeolian physics [5,6,7]. The role of surface moisture in the incipient motion of sand grains by the wind has been extensively studied, and numerous empirical and physical models have been proposed to quantify this effect [8,9,10,11,12,13,14,15,16]. However, the sand-bed collision formed by saltation is the main mechanism in steady aeolian sand flow, in which sand grains move forward by nearly ballistic trajectories under the forces of gravity and wind drag, collide with the loose sand surface and eject new sand particles [17,18] (Figure 1). The almost complete lack of knowledge about the effect on sand-bed collision precludes the deep understanding of aeolian physics and improving numerical simulation accuracy.
A relatively small number of researchers have been reported to explain the saltation behaviour considering surface moisture in field and wind tunnel environments [19,20,21,22,23,24,25,26,27]. Many researchers suggest that small amounts of surface moisture content restrain the saltation in two ways: reducing the number of incipient motions of sand particles due to wind stress and decreasing the total number of particles ejected from the sand-bed collision subsequently. However, surface moisture also enhances the cohesive forces among sand particles and produces a harder surface, which results in sand particles saltate higher with increasing moisture content and ultimately increasing the aeolian sand transport rate [19,20]. Until now, none of the current aeolian sand models can express the effect of surface moisture on sand-bed collision in saltation under coastal conditions, where enhanced cohesive force due to high moisture content appears to be a critical parameter and greatly reduces the range of application of simple transport formulations [2].
The wetted coastal surface is composed of discrete sand grains which are drawn together by a large amount of interparticle cohesive forces. Recently, significant studies have been undertaken to develop closed-form formulations for various cohesive forces and other mechanical behaviours at the solid–liquid interface, such as auto-adhesion, friction, liquid binding and so on [28,29,30,31,32,33], but knowledge of their impact on the macroscopic behaviour of the wetted sand surface is still lacking. From the viewpoint of the microscopic surface structure, the movements of collided sand particles are determined by the cohesive forces among them, which can be presented as functions of their relative positions and velocities. In consideration of this multi-body system involved in the particles collision and energy dissipation, a numerical simulation scheme is required to reproduce this complex process.
As a widely used numerical simulation method of a dense multi-body system, the Discrete Element Method (DEM) can resolve the mechanical behaviour of sand grains under consideration of various relevant cohesive forces acting on individual grains [34,35,36]. Lian et al. [37] simulate the pair-wise collisions of wet agglomerates considering cohesive forces supplied by liquid bridges among neighbouring particles, and discuss the effect of impact velocity and fluid viscosity on the energy dissipation and agglomerates broken processes. Yin et al. [38] investigate the sand-bed collision under inclined bed conditions, and offer a quantified formula to describe the number and velocity of ejected sand grains as a function of the impact grain velocity.
The present paper investigates this sand-bed collision using the Discrete Element Method, under consideration of the sand grain size distribution associated with aeolian sand in nature and the cohesive forces formed by liquid bridges among neighbouring sand grains. Our aim is to explore the evolution of the movement behaviour of sand grains in the air and the microstructure under the sand surface, as characterized by the force chains in the dense multi-body system.

2. Model Description

2.1. Cohesive Force Equations

In this work, we consider the interstitial liquid bridges among sand particles as the main form of cohesive forces. All discussion about the inviscid liquid bridge must be limited to a certain scope, the critical separation distance S c ; it is a limit value that can maintain the existence of liquid bridge [39]
S c = ( 1 + 0.5 α ) V 1 / 3 ,
where V is the liquid bridge volume and α is the contact angle of solid and liquid.
Generally, the liquid bridge exists in a form of pendular, funicular or capillary according to degree of saturation, and the attractive capillary force is the primary mechanism of cohesive force when the relative velocity between two particles is small [30,40]. The capillary forces are static and can be solved by the Laplace–Young equation using the reduced Laplace pressure Δ p and the surface tension γ of liquid bridge [9,11]. Figure 2 shows the the liquid bridge arc radius ρ 1 and the neck radius ρ 2 , the geometry formulas can be expressed as
ρ 1 = s i + R i ( 1 cos ϕ i ) cos ( ϕ i + α ) ,
ρ 2 = R i sin ϕ i ρ 1 [ 1 sin ( ϕ i + α ) ] ,
where i = 1 , 2 presents the serial number of two spheres, s i is the half-separation distances, R i is the radii and ϕ i is the half-filling angles.
The mean curvature of the liquid bridge at the neck H can be shown as
H = Δ p 2 γ = ( ρ 2 ρ 1 ) 2 ρ 2 ρ 1 ,
and the static capillary force can be simply given by
F c = 2 π γ ρ 2 ( 1 + H ρ 2 ) ,

2.2. Particle Motion Equations

There is a broad range of inter-particle contact force models for application in DEM, e.g., the linear spring model, HertzMindlin and JKR model, and linear spring–dashpot model. The linear spring–dashpot model is adopted in this study as it has proven to accurately represent collisional behaviour in the framework of particle-based simulations of Aeolian transport [38]. Each sand particle’s motion during sand-bed collision can be solved by Newton’s equations, and the translation and rotation of each grain can be expressed as
m i d 2 x i d t 2 = j i F n , i j + j i F τ , i j · e 1 ,
m i d 2 y i d t 2 = j i F n , i j + j i F τ , i j + G i · e 2 ,
I i d 2 θ i d t 2 = j i r 0 , i j × F τ , i j · e 3 ,
where x i and y i present the centroid coordinates of grain i, m i is its mass, e 1 and e 2 are unit vectors in the directions x and y, and e 3 = e 1 × e 2 . I = 2 m R 2 / 5 is the rotation inertia, θ i is the angle of rotation, r 0 , i j is the direction vector from the centroid of grain i to j.
F n , i j and F τ , i j are the normal and tangential forces, respectively, acting on grain i due to contact with grain j. The expression for the contact forces read,
F n , i j = k n δ i j n i j β n δ ˙ i j n i j , δ i j 0 , F c , i j , S c δ i j < 0 , 0 , δ i j < S c ,
F τ , i j = μ | F n , i j | t i j , | F t , i j | μ | F n , i j | , k t ξ i j t i j β t ξ ˙ i j t i j , | F t , i j | < μ | F n , i j | ,
where δ i j and ξ i j are the grain deformation in the normal and tangential directions to the contact plane associated with the inter-particle collision, respectively. δ i j ˙ and ξ i j ˙ are derivatives of δ i j and ξ i j with respect to time, n i j is unit vector from the mass centre of grain i to j, and t i j is the unit tangent vector. F c , i j and S c are the capillary force and critical separation distance mentioned above. k n = E · min ( R i , R j ) / ( R i + R j ) and k t = k n / ( λ ν ) are the moduli of elasticity of normal and tangential overlap, E is the Young’s modulus, ν is the Poisson’s ratio, and λ is the empirical coefficient [41]. β n = 4 k n m i m j m i + m j ln 2 ε ln 2 ε + π 2 and β t = 4 k t m i m j m i + m j are the normal and tangential damping coefficients, respectively. ε is the coefficient of restitution and μ is the coefficient of friction.

2.3. Simulation Procedures

First, a mixed sand granular bed should be generated before the simulation of a sand-bed collision process. In order to obtain a sand bed as similar to nature as possible in the simulation, we use the random number generator to generate the mixed granular system [42]. A Gaussian distribution f = p ( d ) is chosen to character the probability density of grain diameter d [43,44], as shown in Figure 3. In total, 5000 grains are dropped into the box and the grain cooling technique to make the bed surface to become stable under gravity and cohesive forces [45]. We generate a flat sand surface of 100 <d> long and 50 <d> high until the maximum velocity of each sand particle is less than 10 5   m / s .
Next, a incident sand grain is shot to sand bed at initial 10 <d> high, and the incident angle of sand grain θ i n is set as 11 . 5 , which is the most frequent in aeolian sand transport [38]. A value of 0.05 s was chosen as the final moment of calculation, because the ejected sand grains saltate to the air and the distances among them are big enough to avoid mid-air collision at that moment. Information about the position, velocity and force of each sand grain is recorded during the numerical simulation process to analyse the movement behaviour, microstructure, energy dissipation and statistical characteristics of sand grains.
Finally, we carried out 280 simulations; the parameters are incident velocity V i n ( m / s ) (1, 2, 3, 4, 5, 6, 7) and the mass moisture content w ( g / g ) (0, 0.01, 0.02, 0.03), each case being repeated 10 times for statistical analysis. The values of moisture content used in this work can ensure that the water is in an unsaturated state under the surface and form liquid bridges and attractive capillary forces among sand grains [46]. The liquid bridges are evenly distribute between neighbouring sand grains [37].
A particle flow analysis program Particle Flow Code (PFC) is used to simulate the sand-bed collision process in this work. The saltation sand grains in aeolian sand transport process move mainly downwind and vary in non-obvious way along the spanwise direction, which can be approximated as a two-dimensional motion [47]. By comparing with the experimental results, the 2D simulation method has proved to be highly accurate and are widely performed in the numerical simulation of sand-bed collision [34,35,38], so do this work.
The mechanical properties parameters of sand grains for computer simulations were set as sand grain density ρ p = 2650 kg / m 3 , Poisson’s ratio ν = 0.3 , Young’s modulus E = 70 GPa and the coefficient of friction μ = 0.3 . For properties of the liquid bridge, liquid density ρ p = 1000 kg / m 3 , contact angle between liquid and solid α = 0 , surface tension γ = 0.025 N / m and fluid viscosity η = 10 m Pa s . The volume of each liquid bridge can be calculated by the volumes of two spheres as V = 0.4 / 3 π ( R 1 3 + R 2 3 ) .

3. Results and Discussion

In this section, our aim is to explore the evolution of the movement behaviour of sand grains in the air and the microstructure under sand surface. Meanwhile, we also compare the numerical simulation results with theoretical and experimental data under the dry sand surface condition.

3.1. Motion and Force Characteristics

Figure 4 presents the motion behaviours of sand grains in sand-bed collision under different surface moistures in time increments of 0.15 s, and we emphatically introduce the V i n = 5 m / s cases because they happen most often in nature. Information about the position and velocity of each sand grain is shown in the form of circles and colour. The incident grains move from the top left to the bottom right direction in the box, collide roughly in the centre of the sand surface bed and rebound into the air on the right side. A large amount of sand grains originally belong to the surface are ejected into the air, and the total number decreases with the increasing surface moisture. This is reasonable because the combination of moisture and sand grains produces a dense and hard system, resulting in the underlying saltation cascade phenomenon observed by numerous experimental studies [20,21,23,25,26,27]. Simultaneously, largish impact craters are generated near the collision positions similar to craters on Earth or Mars. It is interesting to note that the shape of crater is wide and shallow when the surface moisture is low, and higher moisture content significantly decreases the area and slightly increases the depth of the crater. The shape and volume changes of crater not only affect the ejected grain number from there but also turn the rebound direction of incident grain, which may be an important influencing factor for the structure of drifting sand flux [20,23].
In order to investigate the deep reason for the changes of crater affected by moisture, we draw the distribution of contact forces among sand grains as shown in Figure 5, and the simulation cases are same with Figure 4. Contact forces are represented as a form of lines and the colour indicates magnitudes of forces. Although the positions of sand grains are not shown to make a clear figure, but they can be estimated by observing the endpoints of the segment. The shape and volume changes of crater also can be seen through the partial loss of contact force; however, some very important additional information is provided in this state. The large contact force points are distributed near the bottom of the box in all cases and the small contact force points beside the crater are key influence factors. The contact forces are low density and uniform distributed in low moisture cases, and seem unlikely to build up a strong resistance. High density contact forces appear with the surface moisture increasing, and form a closed structure around the edge of crater, which inevitably has a better performance to resist the avulsion in the horizontal direction.

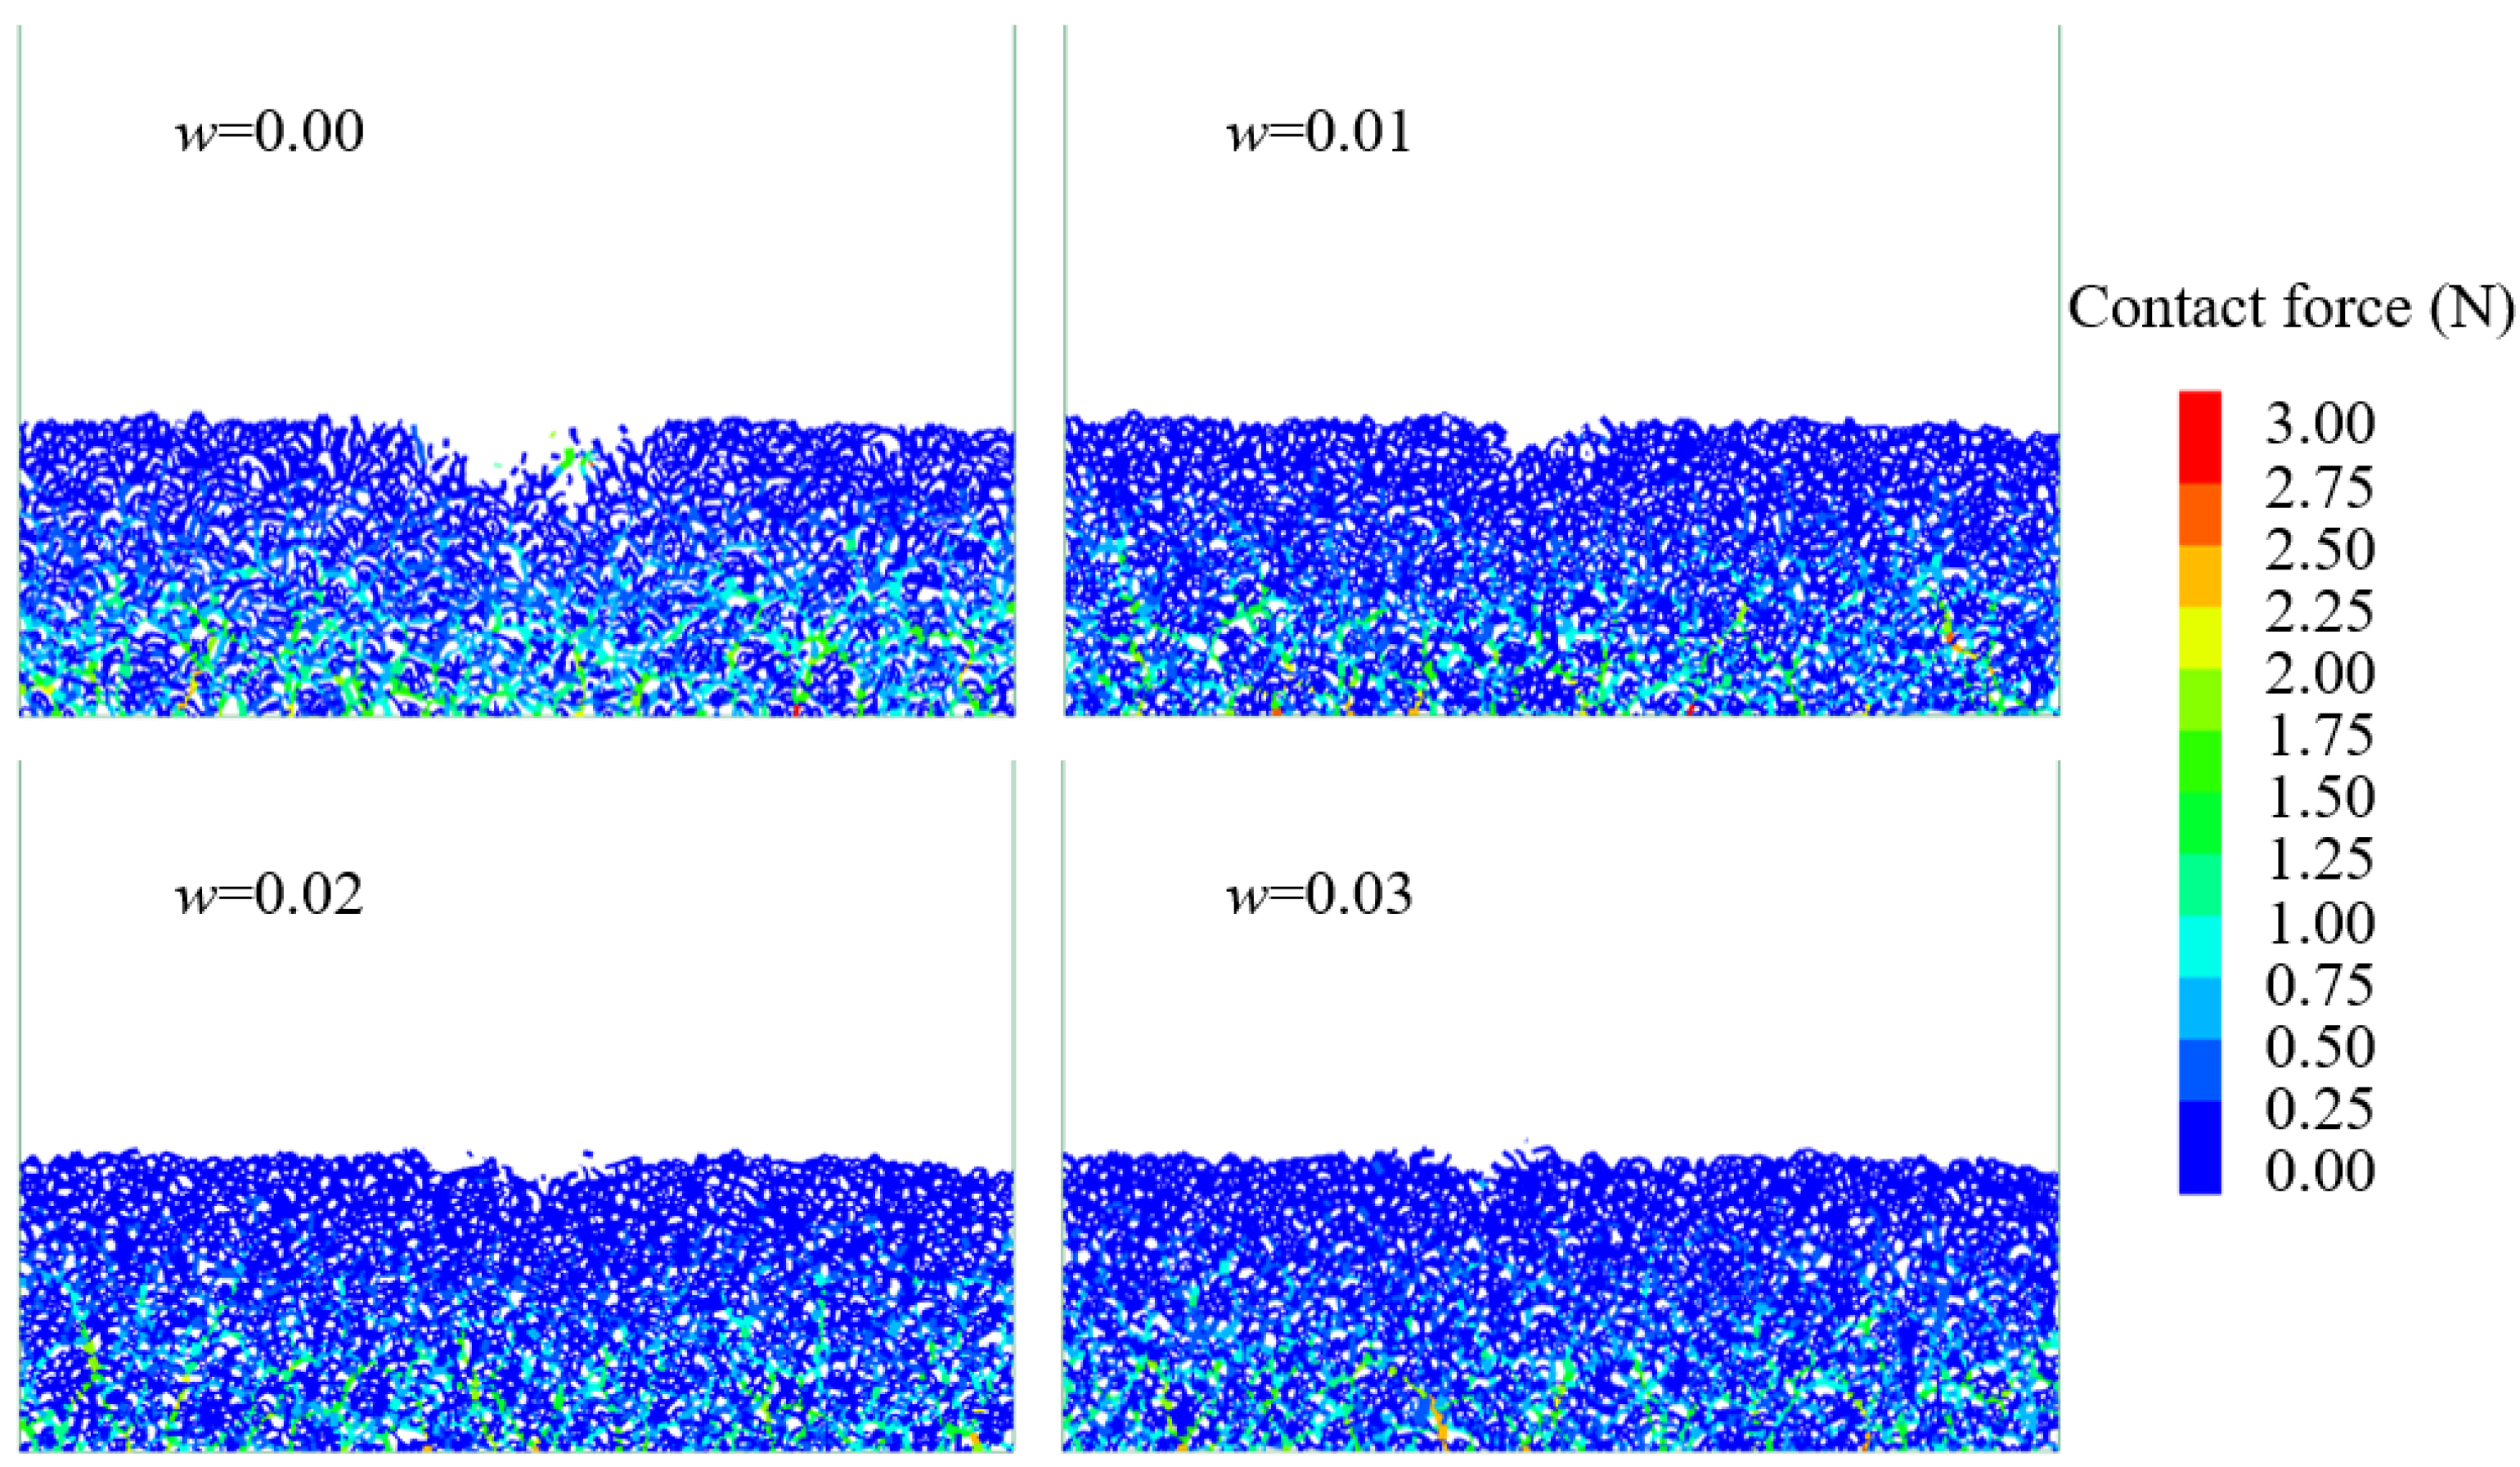
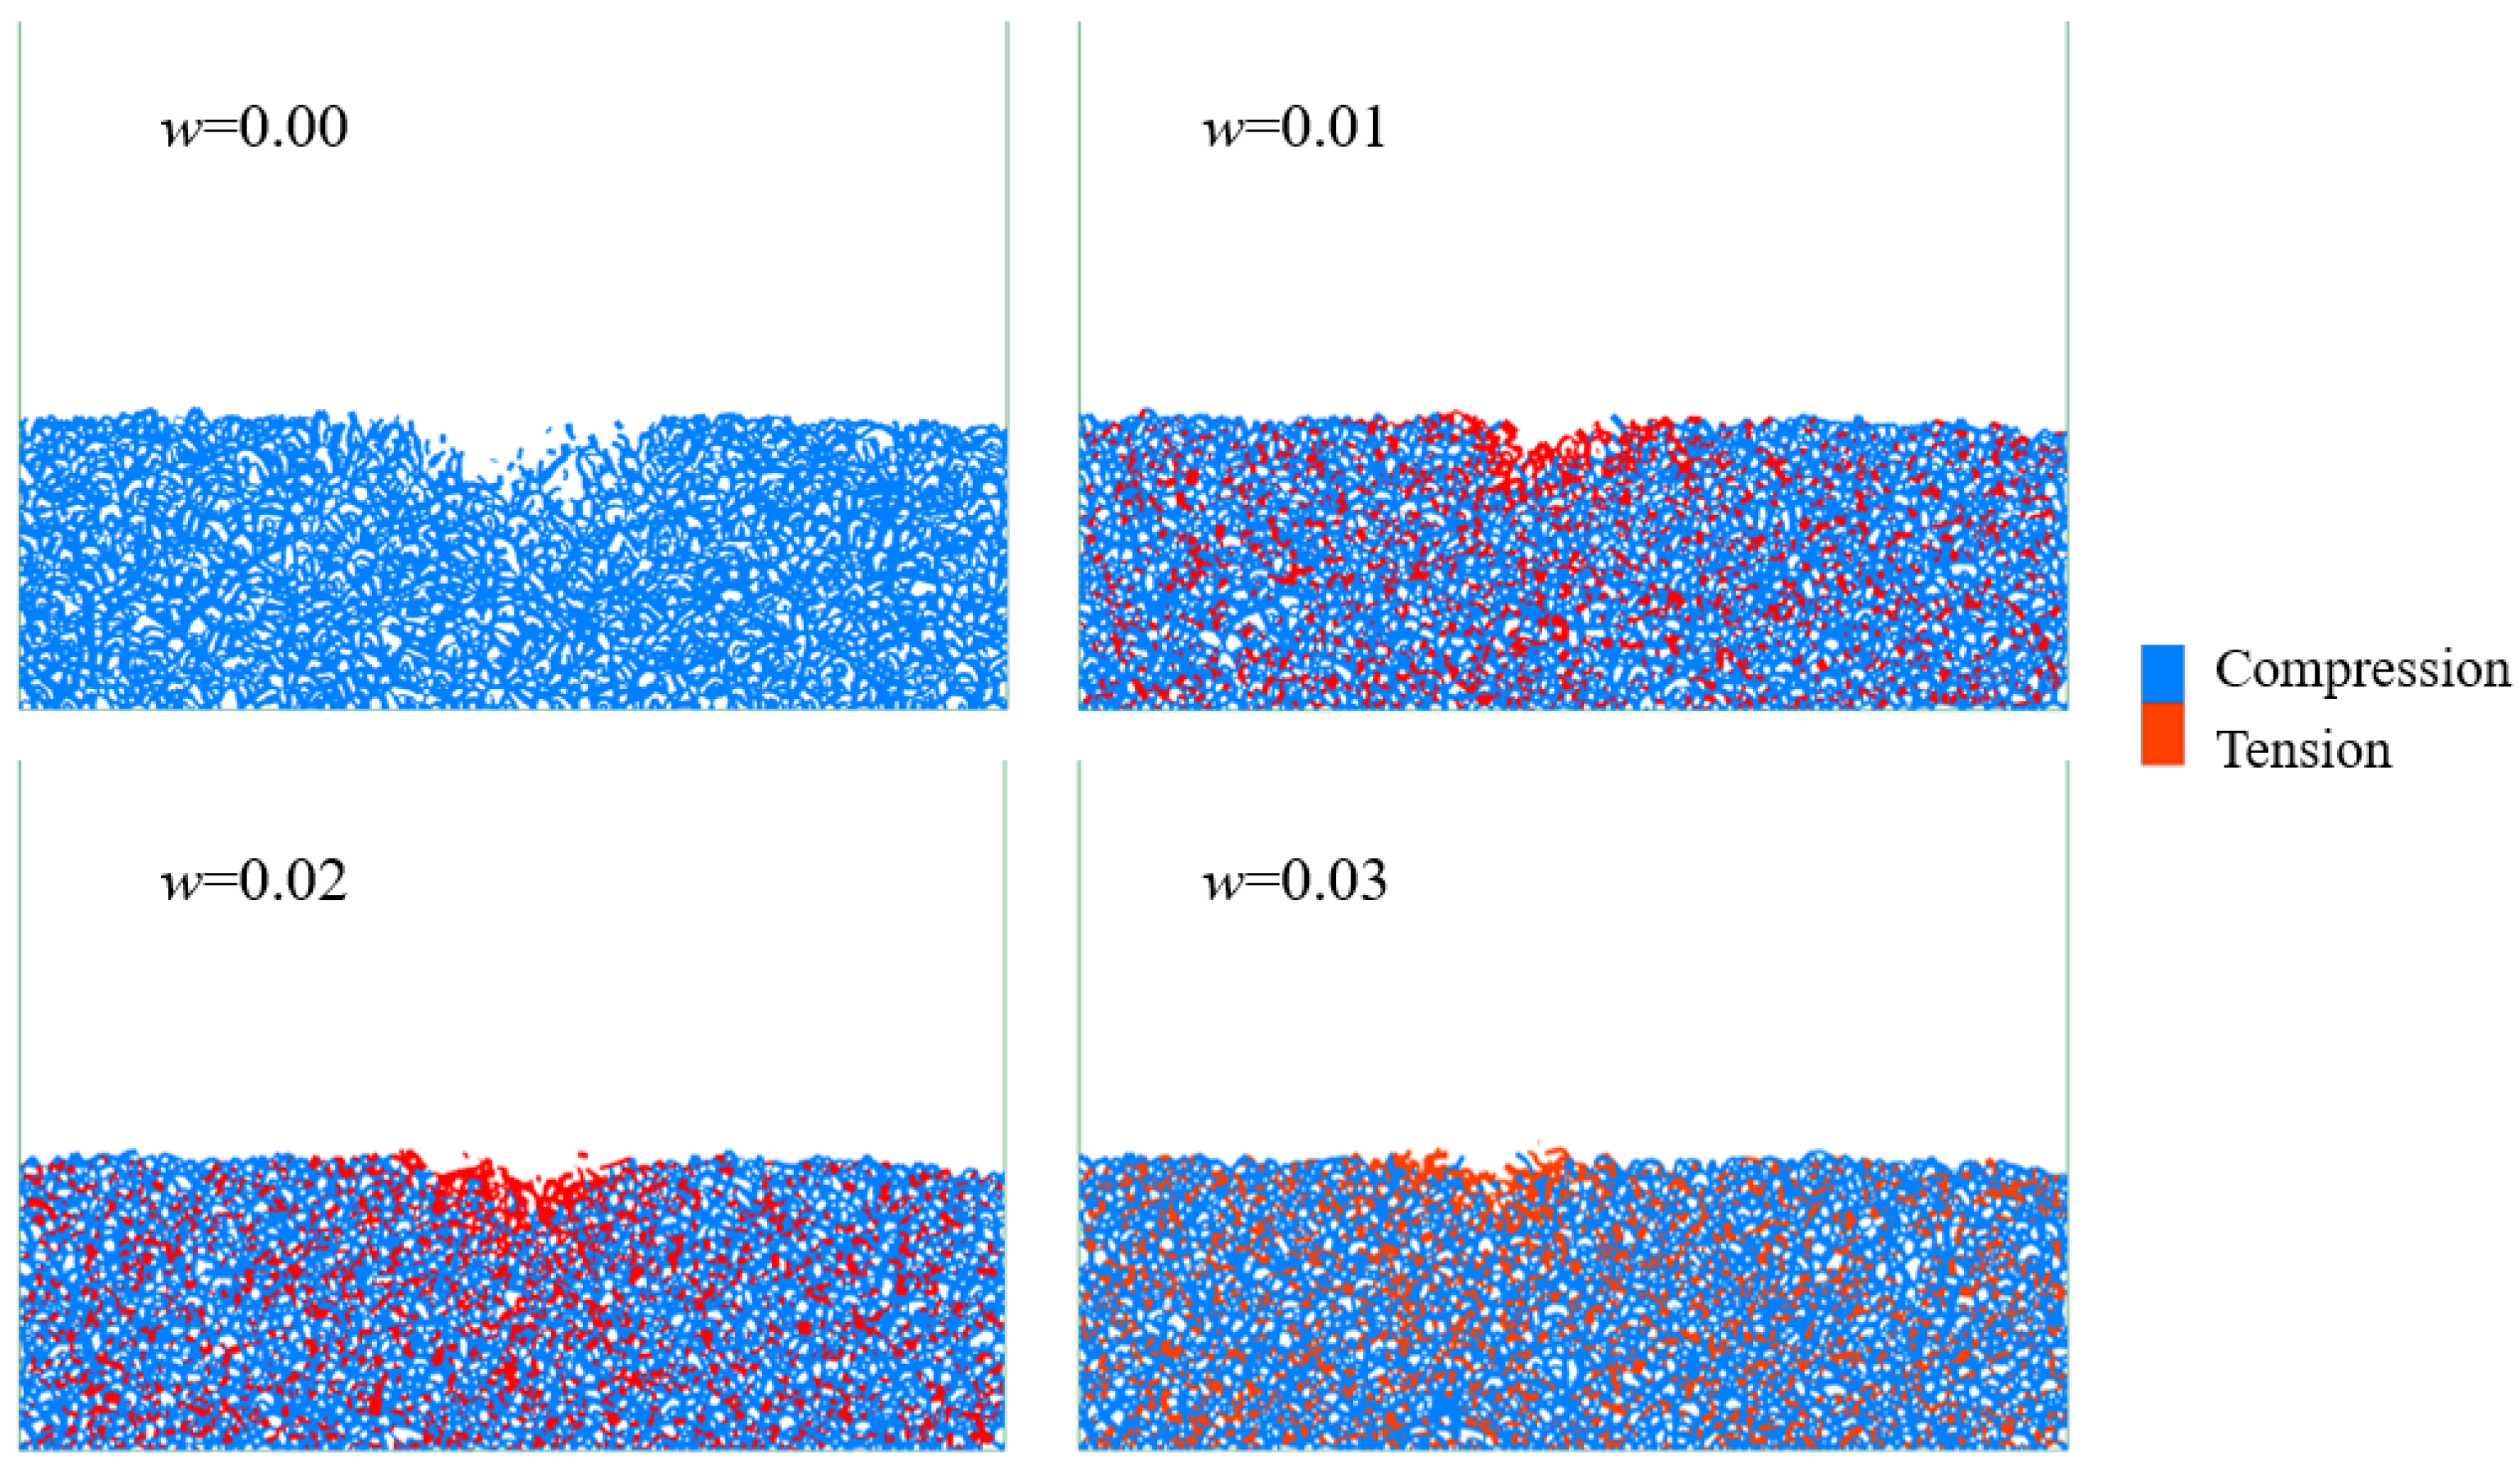
3.2. Force Chains and Energy Dissipation Characteristics

In this part, we aim to research the effect of cohesive forces formed by liquid bridges. Figure 6 presents the distribution of force chains among sand grains under different surface moistures and the compression and tension forces are differentiated by colour. The positions of sand grains can be estimated by observing the endpoints of the segment also in this figure. It is obvious that there are only compression forces in the dry sand surface and the force chains are sparse and cluttered around the edge of crater. As the moisture content increases, the average length of tension force chains under the surface increase significantly, indicating the sand grains are pulled more tightly. Especially around the crater, the tension force chains extend outward by connecting the ejected sand grains. Hence, even though the ejected sand grains saltate away from the surface and generate a considerable distance from the adjacent particles, the tension forces will pull them from leaving until the liquid bridges are stretched to break. In others word, under high moisture condition, the ejected sand grains may be unable to consider as a liftoff state as usual, because they can be pulled back to ground soon. This is a very important mechanism in sand-bed collision, which has been neglected for so long. It explains the reason why current aeolian sand models are difficult to generalize to coastal areas. At the same time, higher moisture content supports larger liquid bridge volumes, enhances the cohesive forces and extends the critical separation distance S c described by Equation (1).
Figure 7 shows the energy dissipation in sand-bed collision under different surface moisture values in time increments of 0.15 s, and we define P = m i n V i n 2 / i = 1 n m i V i 2 as ratio of the kinetic energy of all the grains before and after the collision, where m i n and V i n are the mass and velocity of incident grain before collision, respectively, and the m i and V i are the masses and velocities of all grains after collision, respectively, n is the total number of sand grains. A dimensionless parameter V i / ( g < d > ) 1 / 2 is used to represent the velocity of incident grain, the g is acceleration of gravity and < d > is the average grain diameter. When the incident velocity is low, the increasing surface moisture intensifies the energy dissipation due to the enhanced cohesive forces. However, the trends almost reverse when the incident velocity is high; high surface moisture content resists the energy dissipation. In fact, the incident grain carries most of the kinetic energy in whole multi-body system, and its dynamic behaviour in collision determines the change of kinetic energy. The incident grain can release more energy to break the cohesive forces under low moisture condition, but it will be rebounded by wet and hard surface by keeping most of the kinetic energy.

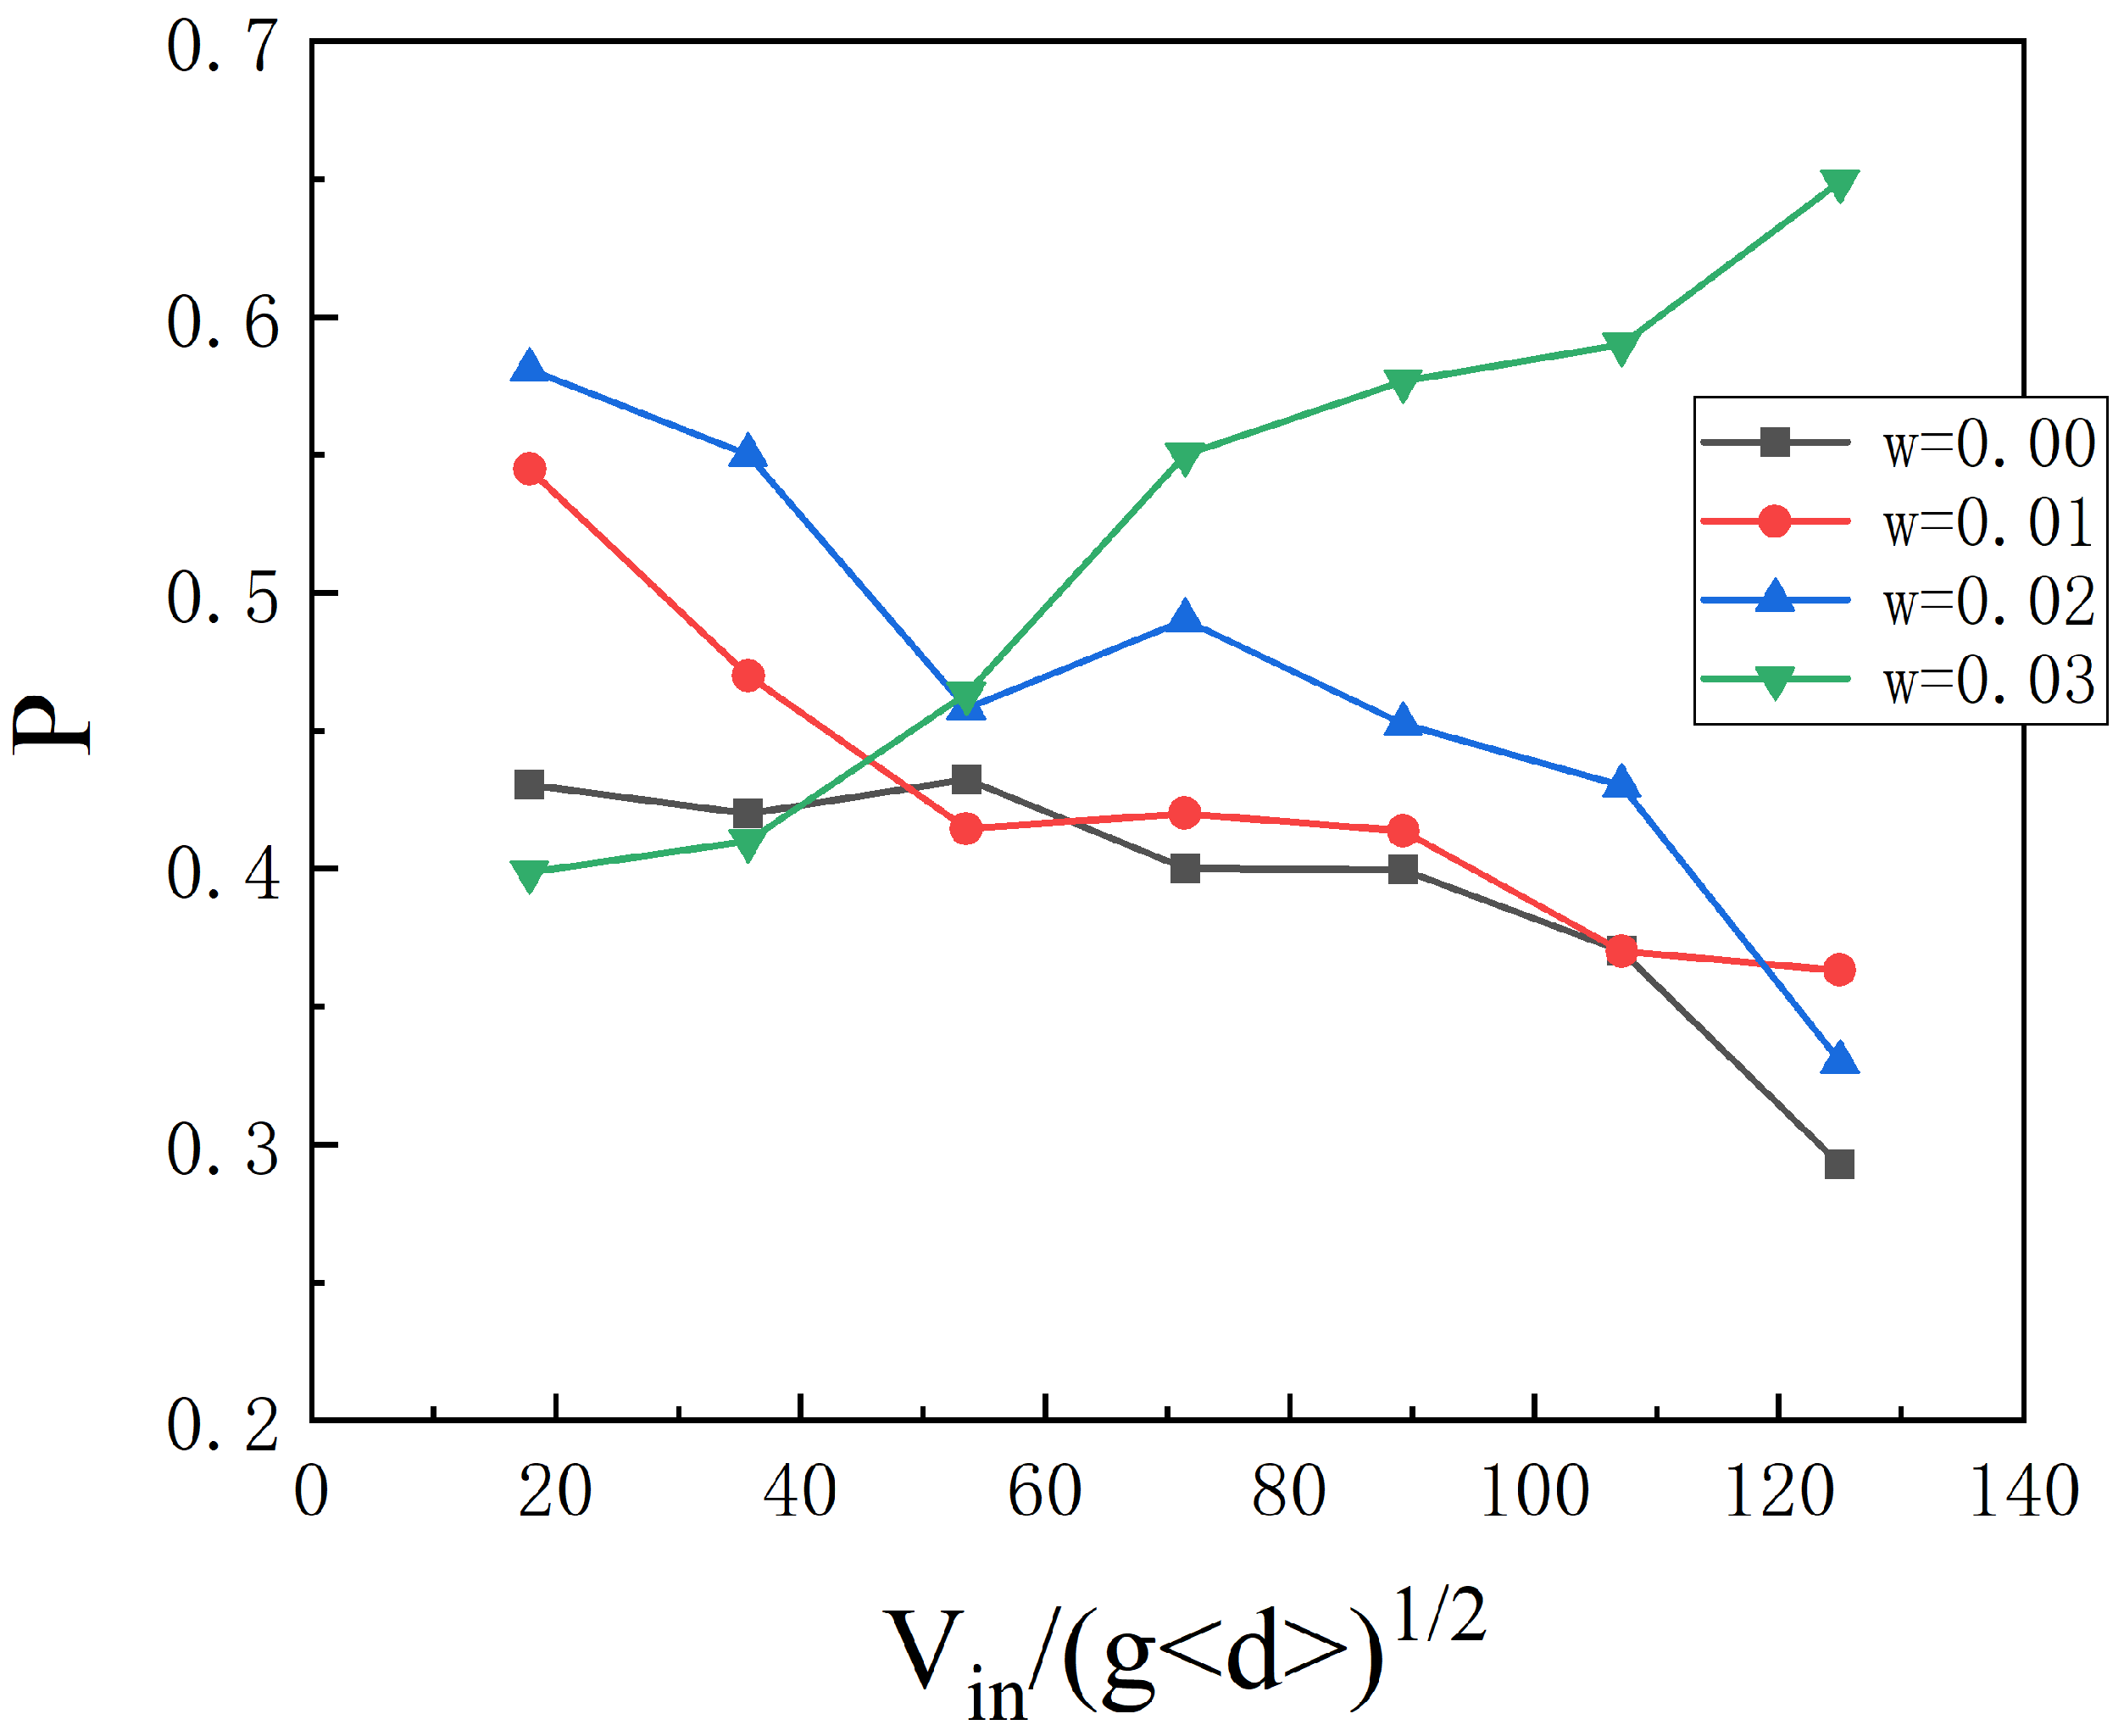
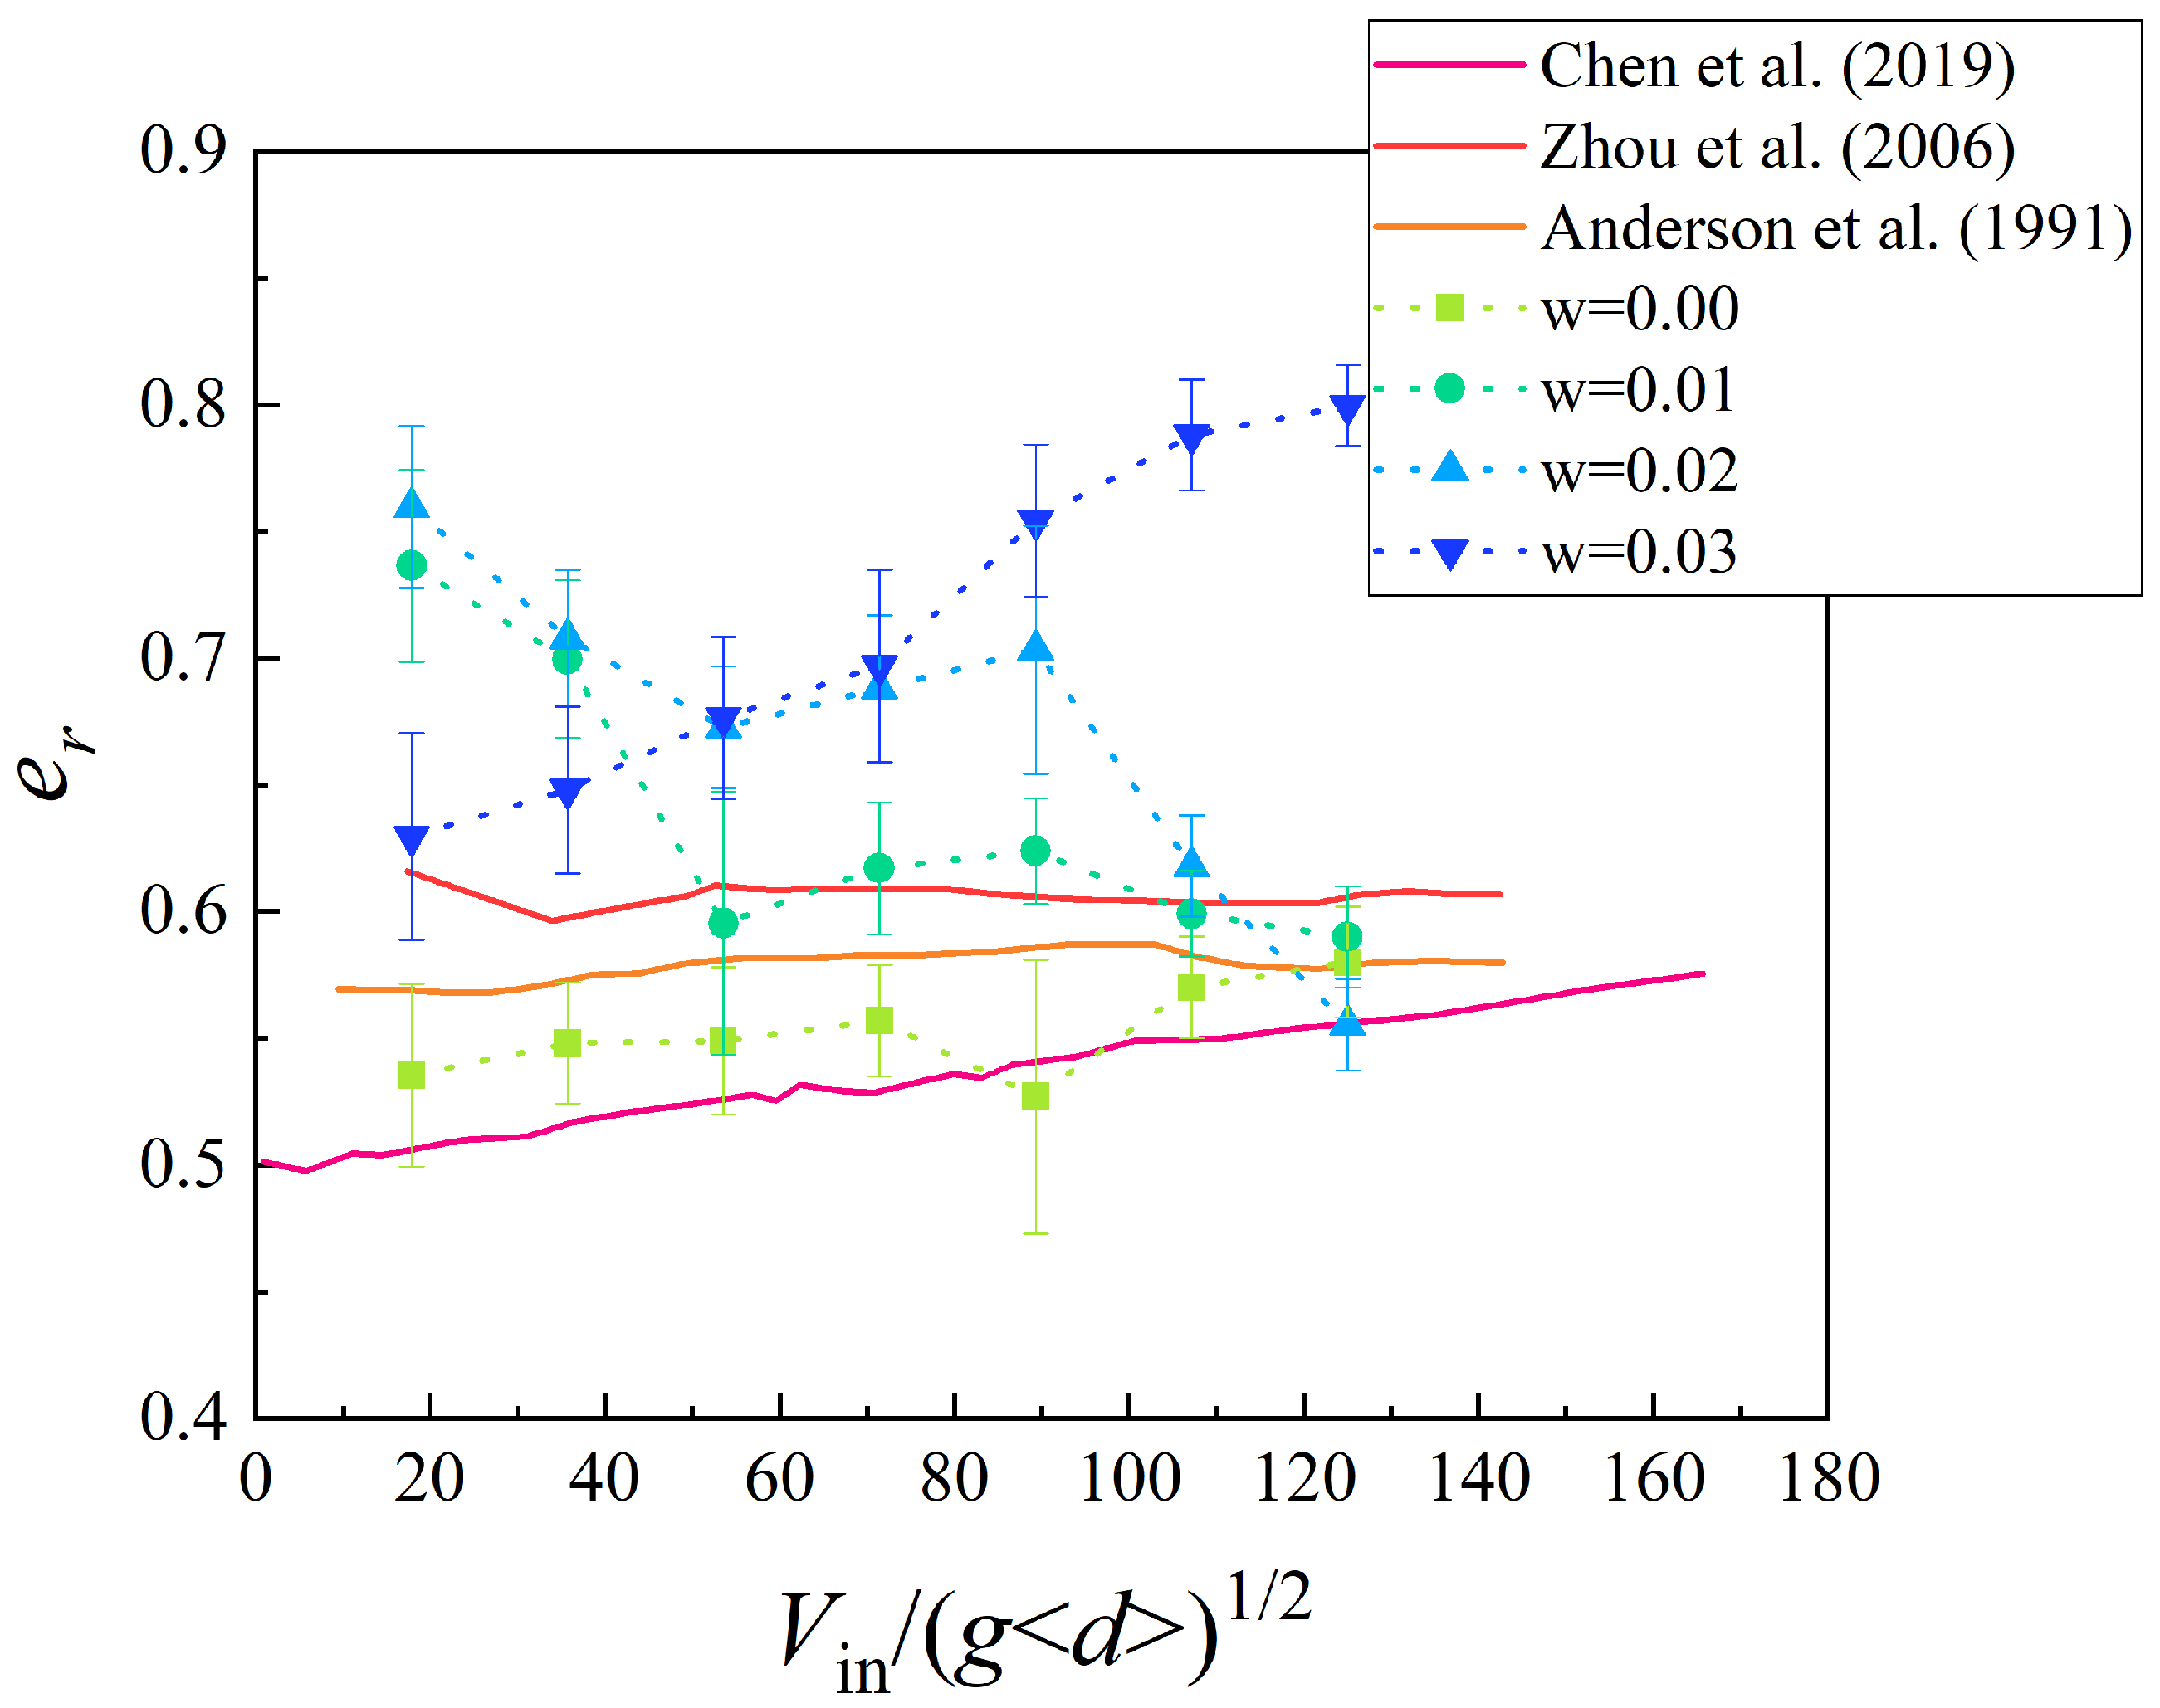
3.3. Statistical Analysis of Sand Grains

On account of the key role of incident grains in whole multi-body system, the restitution coefficient should be the focus of the study, which affects most of the kinetic energy. Figure 8 presents the restitution coefficient e r of incident grains in sand-bed collisions under different surface moisture in times of 0.15 s. We first compare our numerical simulation results with previous experimental results under a flat surface condition. Simulation results show that the e r of incident grain distributes in the range from 0.5 to 0.6 when the surface is dry, and is consistent with the previous studies from Anderson et al. [34] and Chen et al. [47]. The reason that our e r results smaller than that of Zhou et al. [35] may be the different conditions and materials. The e r of of incident grain in multi-body system is not a constant just related to the properties of the system; in fact, this is a growth variable with the increasing incident velocity. The variation law of restitution coefficient is similar to that of energy dissipation. Interestingly, there is a slight decrease in restitution coefficient with the increasing moisture content under the low moisture condition. This can explain why the effect of the tension force between the incident grain and sand surface in the collision increases faster than the resistance effect in that case.
The average velocity of ejected grains V e j ( m / s ) is another important value determining the structure of drifting sand flux, and it must remain constant with incident velocity to satisfy momentum and energy conservation. As shown in Figure 9, the V e j by the incident grain in sand-bed collision under different surface moisture values presents a relatively flat trend with the increase in incident velocity, indicating they are independent of each other. In the dry surface case, the V e j can reach 0.3 in almost all the incident velocity cases, and it is similar to previous experimental and simulation results [34,35,47]. With the surface moisture increases, the V e j drops down to a range of 0.1–0.15 ( m / s ) , indicating that the surface moisture has a significant effect on decreasing the kinetic energy of ejected grains.
Figure 10 presents the ejected number N e j by incident grain in sand-bed collision under different surface moisture in times of 0.15 s, and we can see the N e j increases linearly with the incident velocity in the dry case, which has been sufficiently studied by theory and numerical methods [34,35]. Take the surface moisture content into consideration, the trend of N e j with incident velocity shows some nonlinear characteristics. It could have been caused by the unequally distributed force chains and liquid bridges in the unsaturated sand bed surface as shown in Figure 6. The average velocity and ejected numbers significantly decrease when the sand surface becomes wet, and constant with numerous experimental studies [20,21,23,25,26,27]. This work reproduces the process of surface moisture restraining the saltation, in which the liquid bridges increases kinetic energy consumption of ejected grains and decreases the total number of particles ejected from the sand-bed collision.
The information about statistical significant are also given in Figure 8, Figure 9 and Figure 10. It is clear that the standard deviations of e r , V e j and N e j , shown as error bars, all follow a decreasing trend generally with the increasing velocity of incident grains. In the low incident velocity cases, less kinetic energy is available for collision and the randomness due to impact location on mixed loose surface is significant. The randomness reduces with the increasing incident velocity and this change law has been confirmed by experiments [38]. In low energy environments, the surface anisotropism of dense multi-body systems enhances the randomness of the sand-bed collision and this effect should be considered in aeolian sand transport models.

4. Conclusions

In this paper, we investigate sand-bed collision using the Discrete Element Method considering the cohesive forces formed by liquid bridges among neighbouring sand grains, and explore the evolution of the movement behaviour, microstructure, energy dissipation and statistical characteristics of sand grains.
Morphologically, largish impact craters are generated near the collision positions, and higher moisture content significantly decreases the area and slightly increases the depth of the crater. High density contact forces appear with the surface moisture increasing, and form a closed structure around the edge of teh crater, which inevitably has a better performance to resist the avulsion in the horizontal direction. Those different morphologies and microstructures of craters give us a unique insight into the deformation resistability capacity of surfaces consisting of loose grains under different moisture contents.
Under high moisture conditions, even though the ejected sand grains saltate away from the surface, the tension forces will pull them from leaving until the liquid bridges are stretched to break. This is a very important mechanism in sand-bed collision, which has been neglected for so long. Higher moisture content enhances the cohesive forces, extends the critical separation distance and resists the energy dissipation. The simulation results reveal how the liquid bridges affect the evolution of movement behaviour of sand grains in the coastal aeolian sand transport process.
The effect of tension force between incident grains and sand surfaces in collision increases faster than the resistance effect in the low moisture case, resulting in the slight decreases in restitution coefficient with the increasing moisture content. The eject velocity presents a relatively flat trend and is independent of incident velocity, and the ejected number trend with incident velocity shows some nonlinear characteristics due to the unequally distributed force chains and liquid bridges in the unsaturated sand bed surface. Statistical results of moisture effects can be used in the future to perfect the aeolian sand transport model and improve calculation accuracy essentially in wet coastal areas.

Author Contributions

Conceptualization, H.D.; methodology, H.D. and P.Y.; software, H.D. and P.Y.; validation, J.Z.; formal analysis, H.D.; investigation, H.D.; resources, N.H.; data curation, P.Y.; writing—original draft preparation, H.D.; writing—review and editing, N.H. and J.Z.; supervision, P.Y.; project administration, N.H.; funding acquisition, N.H. All authors have read and agreed to the published version of the manuscript.

Funding

This research was funded by the National Natural Foundation of China OF FUNDER grant number 42106218, the Open Foundation of The Key Laboratory of Desert and Desertification OF FUNDER grant number KLDD-2020-020, and the Fundamental Research Funds for the Central Universities OF FUNDER grant number lzujbky-2021-pd09.

Institutional Review Board Statement

Not applicable.

Informed Consent Statement

Not applicable.

Data Availability Statement

Not applicable.

Conflicts of Interest

The authors declare no conflict of interest.

References

  1. Bagnold, R.A. The Physics of Blown Sand and Desert Dunes; Courier Corporation: Washington, DC, USA, 1942. [Google Scholar]
  2. Sherman, D.J.; Jackson, D.; Namikas, S.L.; Wang, J. Wind-blown sand on beaches: An evaluation of models. Geomorphology 1998, 22, 113–133. [Google Scholar] [CrossRef]
  3. Kroy, K.; Sauermann, G.; Herrmann, H.J. Minimal model for aeolian sand dunes. Phys. Rev. E Stat. Nonlinear Soft Matter Phys. 2002, 66, 031302. [Google Scholar] [CrossRef] [Green Version]
  4. Shao, Y. Physics and Modelling of Wind Erosion; Springer Science and Business Media: New York, NY, USA, 2009. [Google Scholar]
  5. Namikas, S.L.; Edwards, B.L.; Bitton, M.; Booth, J.L.; Zhu, Y. Temporal and spatial variabilities in the surface moisture content of a fine-grained beach—ScienceDirect. Geomorphology 2010, 114, 303–310. [Google Scholar] [CrossRef]
  6. Jackson, N.L.; Nordstrom, K.F. Effects of Time-dependent Moisture Content of Surface Sediments on Aeolian Transport Rates Across a Beach, Wildwood, New Jersey, U.S.A. Earth Surf. Process. Landf. 2015, 22, 611–621. [Google Scholar] [CrossRef]
  7. Smit, Y.; Ruessink, G.; Brakenho, L.B.; Donker, J. Measuring spatial and temporal variation in surface moisture on a coastal beach with a near-infrared terrestrial laser scanner. Aeolian Res. 2017, 31, 19–27. [Google Scholar] [CrossRef]
  8. Haines, W.B. Studies in the physical properties of soils: II. A note on the cohesion developed by capillary forces in an ideal soil1. J. Agric. Sci. 1925, 15, 529–535. [Google Scholar] [CrossRef]
  9. Fisher, R.A. On the Capillary Forces in an Ideal Soil; Correction of Formulae Given by W. B. Haines. J. Agric. Sci. 1926, 16, 492–505. [Google Scholar] [CrossRef]
  10. Bisal, F.; Hsieh, J. Influence of moisture on erodibility of soil by wind. Soil Sci. 1966, 102, 143–146. [Google Scholar] [CrossRef]
  11. Hotta, K.; Takeda, K.; Iinoya, K. The capillary binding force of a liquid bridge. Powder Technol. 1974, 10, 231–242. [Google Scholar] [CrossRef]
  12. Logie, M. Influence of roughness elements and soil moisture on the resistance of sand to wind erosion. Catena 1982, 1, 161–173. [Google Scholar]
  13. Mckenna-Neuman, C.; Nickling, W.G. A Theoretical and Wind Tunnel Investigation of the Effect of Capillary Water on the Entrainment of Sediment by Wind. Can. J. Soil Sci. 1989, 69, 79–96. [Google Scholar] [CrossRef]
  14. Namikas, S.L.; Sherman, D.J. A Review of the Effects of Surface Moisture Content on Aeolian Sand Transport; Desert Aeolian Processes; Springer: Dordrecht, The Netherlands, 1995. [Google Scholar]
  15. Liu, X.P.; Dong, Z.B. Wind Threshold Shear Velocities of Sands at Moistened State. Bull. Soil Water Conserv. 2002, 22, 1–4. [Google Scholar]
  16. Wang, Z.T. Influence of moisture on the entrainment of sand by wind. Powder Technol. 2006, 9270, 89–93. [Google Scholar] [CrossRef]
  17. Owen, P.R. Saltation of uniform grains in air. J. Fluid Mech. 1964, 20, 225. [Google Scholar] [CrossRef]
  18. Almeida, M.P.; Parteli, E.; Andrade, J.S., Jr.; Herrmann, H.J. Giant saltation on Mars. Proc. Natl. Acad. Sci. USA 2008, 105, 6222–6226. [Google Scholar] [CrossRef] [Green Version]
  19. Neuman, M.K.; Scott, M.M. A wind tunnel study of the influence of pore water on aeolian sediment transport. J. Arid Environ. 1998, 39, 403–419. [Google Scholar] [CrossRef]
  20. Han, Q.; Qu, J.; Liao, K.; Zhang, K.; Zu, R.; Niu, Q. A wind tunnel study of the parameters for aeolian sand transport above a wetted sand surface using sands from a tropical humid coastal region of southern China. Environ. Earth Sci. 2012, 67, 243–250. [Google Scholar] [CrossRef]
  21. Cornelis, W.M.; Oltenfreiter, G.; Gabriels, D.; Hartmann, R. Splash-Saltation of Sand due to Wind-Driven Rain: Vertical Deposition Flux and Sediment Transport Rate. Soil Sci. Soc. Am. J. 2004, 68, 32–40. [Google Scholar] [CrossRef]
  22. Dong, Z.; Wang, H.; Liu, X.; Wang, X. A wind tunnel investigation of the influences of fetch length on the flux profile of a sand cloud blowing over a gravel surface. Earth Surf. Process. Landf. 2004, 29, 1613–1626. [Google Scholar] [CrossRef]
  23. Dong, Z.; Mu, Q.; Liu, X. Defining the threshold wind velocity for moistened sediments. J. Geophys. Res. 2007, 112, 1–10. [Google Scholar] [CrossRef] [Green Version]
  24. Ishizuka, M.; Mikami, M.; Leys, J.; Yamada, Y.; Heidenreich, S.; Shao, Y.; Mctainsh, G.H. Effects of soil moisture and dried raindroplet crust on saltation and dust emission. J. Geophys. Res. Atmos. 2008, 113, D24212. [Google Scholar] [CrossRef] [Green Version]
  25. Han, Q.; Qu, J.; Zhang, K.; Zu, R.; Niu, Q.; Liao, K. Wind tunnel investigation of the influence of surface moisture content on the entrainment and erosion of beach sand by wind using sands from tropical humid coastal southern China. Geomorphology 2009, 104, 230–237. [Google Scholar] [CrossRef]
  26. Lv, P.; Dong, Z. The status of research on the development and characteristics of mass-flux-density profiles above wind-eroded sediments: A literature review. Environ. Earth Sci. 2014, 71, 5183–5194. [Google Scholar] [CrossRef]
  27. Bergametti, G.; Rajot, J.L.; Pierre, C.; Bouet, C.; Marticorena, B. How long does precipitation inhibit wind erosion in the Sahel? Geophys. Res. Lett. 2016, 43, 6643–6649. [Google Scholar] [CrossRef] [Green Version]
  28. Johnson, K.L.; Kendall, K.; Roberts, A.D. Surface Energy and the Contact of Elastic Solids. Proc. R. Soc. Lond. A Math. Phys. Sci. 1971, 324, 301–313. [Google Scholar]
  29. Savkoor, A.R.; Briggs, G.A.D. The Effect of Tangential Force on the Contact of Elastic Solids in Adhesion. Proc. R. Soc. A Math. 1977, 356, 103–114. [Google Scholar]
  30. Lian, G.; AdAms, M.J.; Thornton, C. Elastohydrodynamic collisions of solid spheres. J. Fluid Mech. 1996, 311, 141–152. [Google Scholar] [CrossRef]
  31. Radjai, F.; Topin, V.; Richefeu, V.; Voivret, C.; Youssoufi, S.E. Force Transmission in Cohesive Granular Media. Am. Inst. Phys. 2010, 1227, 240–259. [Google Scholar]
  32. Khan, A.; Afzal, A. Influence of initial stress and gravity on refraction and reflection of SV wave at interface between two viscoelastic liquid under three thermoelastic theories. J. Braz. Soc. Mech. Sci. Eng. 2018, 40, 1–13. [Google Scholar] [CrossRef]
  33. Khan, A.A.; Tanveer, S. Transmission and reflection of SV waves at micropolar solid–liquid interface with dual-phase lag theory. Indian J. Phys. 2021. [Google Scholar] [CrossRef]
  34. Anderson, R.S.; Haff, P.K. Wind Modification and Bed Response during Saltation of Sand in Air; Springer: Vienna, Austria, 1991. [Google Scholar]
  35. Zhou, Y.H.; Li, W.Q.; Zheng, X.J. Particle dynamics method simulations of stochastic collisions of sandy grain bed with mixed size in aeolian sand saltation. J. Geophys. Res. Atmos. 2006, 111, D15108. [Google Scholar] [CrossRef]
  36. Oger, L.; Ammi, M.; Valance, A.; Beladjine, D. Study of the collision of one rapid sphere on 3D packings: Experimental and numerical results. Comput. Math. Appl. 2008, 55, 132–148. [Google Scholar] [CrossRef]
  37. Lian, G.; Thornton, C.; Adams, M.J. Discrete particle simulation of agglomerate impact coalescence. Chem. Eng. Sci. 1998, 53, 3381–3391. [Google Scholar] [CrossRef]
  38. Xin, Y.A.; Ning, H.B.; Cong, J.A.; Ejrp, C.; Jie, Z.B. Splash function for the collision of sand-sized particles onto an inclined granular bed, based on discrete-element-simulations—ScienceDirect. Powder Technol. 2021, 378, 348–358. [Google Scholar]
  39. Lian, G.; Thornton, C.; Adams, M.J. A Theoretical Study of the Liquid Bridge Forces between Two Rigid Spherical Bodies. J. Colloid Interface Sci. 1993, 161, 138–147. [Google Scholar] [CrossRef]
  40. Goldman, A.J.; Cox, R.G.; Brenner, H. Slow viscous motion of a sphere parallel to a plane wall—I Motion through a quiescent fluid. Chem. Eng. Sci. 1967, 22, 637–651. [Google Scholar] [CrossRef]
  41. Cundall, P.A.; Strack, O. A discrete numerical model for granular assemblies. Géotechnique 1979, 29, 47–65. [Google Scholar] [CrossRef]
  42. Knuth, D.E. The Art of Computer Programming; China Machine Press: Beijing, China, 1976. [Google Scholar]
  43. Rice, M.A. An experimental study of multiple grain-size ejecta produced by collisions of saltating grains with a flat bed. Sedimentology 2010, 42, 695–706. [Google Scholar] [CrossRef]
  44. Willetts, B.B.; Rice, M.A. Collisions of quartz grains with a sand bed: The influence of incident angle. Earth Surf. Process. Landf. 1989, 14, 719–730. [Google Scholar] [CrossRef]
  45. Haff, P.K.; Anderson, R.S. Grain scale simulations of loose sedimentary beds: The example of grain-bed impacts in aeolian saltation. Sedimentology 2010, 40, 175–198. [Google Scholar] [CrossRef]
  46. Lu, N.; Likos, W.J. Unsaturated Soil Mechanics; John Wiley and Sons Inc.: Hoboken, NJ, USA, 2004. [Google Scholar]
  47. Chen, Y.X.; Huang, N.; Xu, B. An experimental study on splash functions of natural Sand-bed collision. J. Geophys. Res. Atmos. 2019, 124, 7226–7235. [Google Scholar] [CrossRef]
Figure 1. Schematic diagram of sand-bed collision in aeolian sand transport. Sand grains move forward in nearly ballistic trajectories, collide with the loose sand surface and eject new sand particles. Surface moisture enhances the cohesive forces among sand particles and sand particles saltate higher [19,20].
Processes 10 00052 g001
Figure 2. Toroidal model of the liquid bridge between two unequally sized spheres.
Processes 10 00052 g002
Figure 3. The initial loose sand bed consists of 5000 mixed grains follows a Gaussian distribution.
Processes 10 00052 g003
Figure 4. The motion behaviours of sand grains in sand-bed collision under different surface moisture in times of 0.15 s ( V i n = 5 m / s ). Each circle represents a grain of sand and the colour indicates grain velocity.
Processes 10 00052 g004
Figure 5. The distribution of contact forces among sand grains in sand-bed collision under different surface moisture in times of 0.15 s ( V i n = 5 m / s ). Contact forces are represented as lines and the colour indicates magnitudes of forces.
Processes 10 00052 g005
Figure 6. The distribution of force chains among sand grains in the sand-bed collision under different surface moisture in times of 0.15 s ( V i n = 5 m / s ). Force chains are represented as lines and the colour indicate the form of forces.
Processes 10 00052 g006
Figure 7. The energy dissipation in the sand-bed collision under different surface moisture values, and P is the ratio of the kinetic energy of all the grains before and after the collision.
Processes 10 00052 g007
Figure 8. The restitution coefficients of the incident grain in the sand-bed collision under different surface moisture values.
Processes 10 00052 g008
Figure 9. The eject velocities by incident grains in sand-bed collisions under different surface moisture values.
Processes 10 00052 g009
Figure 10. The ejected number of incident grains in sand-bed collision under different surface moisture values.
Processes 10 00052 g010
Publisher’s Note: MDPI stays neutral with regard to jurisdictional claims in published maps and institutional affiliations.

