Article

Experimental and Numerical Analysis on Mesoscale Mechanical Behavior of Coarse Aggregates in the Asphalt Mixture during Gyratory Compaction

1
Shanghai Road and Bridge Group Co., Ltd., Shanghai 200433, China
2
Shanghai Engineering Research Center of Urban Infrastructure Renewal, Shanghai 200032, China
3
China Construction 4th Engineering Bureau 6th Co., Ltd., Shanghai 201100, China
4
Department of Highway and Railway Engineering, School of Civil Engineering, Beijing Jiaotong University, Beijing 100044, China
*
Authors to whom correspondence should be addressed.
Processes 2022, 10(1), 47; https://doi.org/10.3390/pr10010047
Submission received: 19 November 2021 / Revised: 20 December 2021 / Accepted: 22 December 2021 / Published: 27 December 2021
(This article belongs to the Special Issue DEM Simulations and Modelling of Granular Materials)

Abstract

:
Compaction is a critical step in asphalt pavement construction. The objective of this study is to analyze the mesoscale mechanical behaviors of coarse aggregates in asphalt mixtures during gyratory compaction through experiments and numerical simulation using the Discrete Element Method (DEM). A novel granular sensor (SmartRock) was embedded in an asphalt mixture specimen to collect compaction response data, including acceleration, stress, rotation angle and temperature. Moreover, the irregularly shaped coarse aggregates were regenerated in the DEM model, and numerical simulations were conducted to analyze the evolution of aggregate interaction characteristics. The findings are as follows: (1) the measured contact stress between particles changes periodically during gyratory compaction, and the amplitude of stress tends to be stable with the increase of compaction cycles; (2) the contact stress of particles is influenced by the shape of aggregates: flat-shaped particles are subjected to greater stress than angular, fractured or elongated particles; (3) the proportion of strong contacts among particles is high in the initial gyratory compaction stage, then decreases as the number of gyratory compactions grows, the contacts among particles tending to homogenize; (4) during initial gyratory compactions, the normal contact forces form a vertical distribution due to the aggregates’ gravity accumulation. The isotropic distribution of contact forces increases locally in the loading direction along the axis with a calibrated internal angle orientation (1.25°) in the earlier cyclic loading stage, then the local strong contacts decrease in the later stage, while the strength of the force chains in other directions increase. The anisotropy of aggregate contact force networks tends to weaken. In other words, kneading and shearing action during gyratory compaction have a positive impact on the homogenization and isotropy of asphalt mixture contact forces.

1. Introduction

Gyratory compaction is one of the main preferred methods to mold asphalt mixtures. With vertical pressure and horizontal shear simultaneously applied to the specimen, gyratory compaction can simulate the wheel kneading action during the asphalt pavement construction stage and the open traffic stage. Research has shown that the features of samples formed by gyratory compaction are closest to those of on-site core samples, and aggregate cracking can be alleviated during gyratory compaction [1,2,3]. Led by the National Highway Cooperative Research Program (NCHRP), the Superpave Gyratory Compactor (SGC) has been widely used in the United States [4,5]. At present, according to the densification curves recorded by SGC, volume indicators to characterize the compaction mechanism have been proposed, including the theoretical maximum relative density (Gmm), the initial number of gyrations (Nini) [6], the compaction energy index (CEI) [7], densification curve slopes, the locking point [8,9,10], and the ratio of compaction cycles when the air void of asphalt mixture reaches 2% and 5% [11]. The criteria based on the above volume parameters has not been unified. For instance, there are several criteria for defining the locking point according to the specimen’s height change during gyratory compaction [8,12,13,14,15,16]. Furthermore, to obtain a more reasonable and acceptable method to describe the compactability of the asphalt mixture, novel sensors and numerical methods [17] are used to characterize the force framework evolution of coarse aggregates, and attempts have been made to establish the relationship between volume parameters and mechanical indexes for asphalt mixtures.
With the development of sensors, a new integrated granular sensor called SmartRock has been introduced [18,19,20,21,22] and embedded in asphalt mixture to record physical and mechanical behavior data during compaction. With a size close to the nominal maximal particle size, the SmartRock can collect compaction response data, including stress, rotation angle, acceleration and temperature, and transmit it wirelessly to a LabVIEW system. Wang [18] obtained the variation of particle attitude (rotation angle) during gyratory compaction utilizing SmartRock, and a method for determining the locking point based on the relative rotation angle curves was preliminarily suggested. Subsequently, Wang and Shen [19] conducted more field compaction tests using SmartRocks, and the results proved that the acceleration tested by SmartRock could better reflect the dynamic characteristics of asphalt mixture under the action of a vibratory roller. In addition, the rotation angle tested by SmartRock could also explain the impact of rubber-tired rollers on the rolling and rubbing action for asphalt mixture. Han et al. [20,21] used SmartRock to compare dynamic responses, such as stress, acceleration and rotation angle, during on-site and indoor vibratory compaction, and found that the average stress tested by SmartRock could indicate the compaction trend of the asphalt mixture. However, this work is limited by the high cost and discrete characteristics of SmartRock sensor testing. Recently, the Discrete Element Method (DEM) was employed as a numerical technology to simulate asphalt mixing [23,24,25] and the compaction process [26,27,28,29]. Initially, 2D simulation models were built to analyze the dynamic modulus of mixtures and the law of particle motion, and to reveal the gyratory compaction mechanism of asphalt mixture [27]. Considering the influence of irregular particle shapes on the compaction process, scholars have combined 3D scanning technology and DEM to simulate real-shaped particles [28,29,30], and a more accurate representation of particle movement during compaction was achieved. However, there is still a lack of numerical analysis on the evolution of the interior force framework for aggregates during compaction.
The objective of this paper is to investigate the movement characteristics and mechanical behavior of coarse aggregates during gyratory compaction utilizing a granular sensor monitoring test and a numerical simulation. The main work includes: (1) obtaining the movement and contact stress of SmartRock during gyratory compaction; (2) preparing the compacted sample with a combination of differently shaped coarse aggregates through DEM simulation; (3) building the DEM model and simulating the gyratory compaction process to track the movements and contact forces of coarse aggregates; (4) comparing and analyzing the results between the test and numerical model and detecting the mesoscale force chain characteristics of aggregates.

2. SGC Testing Based on SmartRock
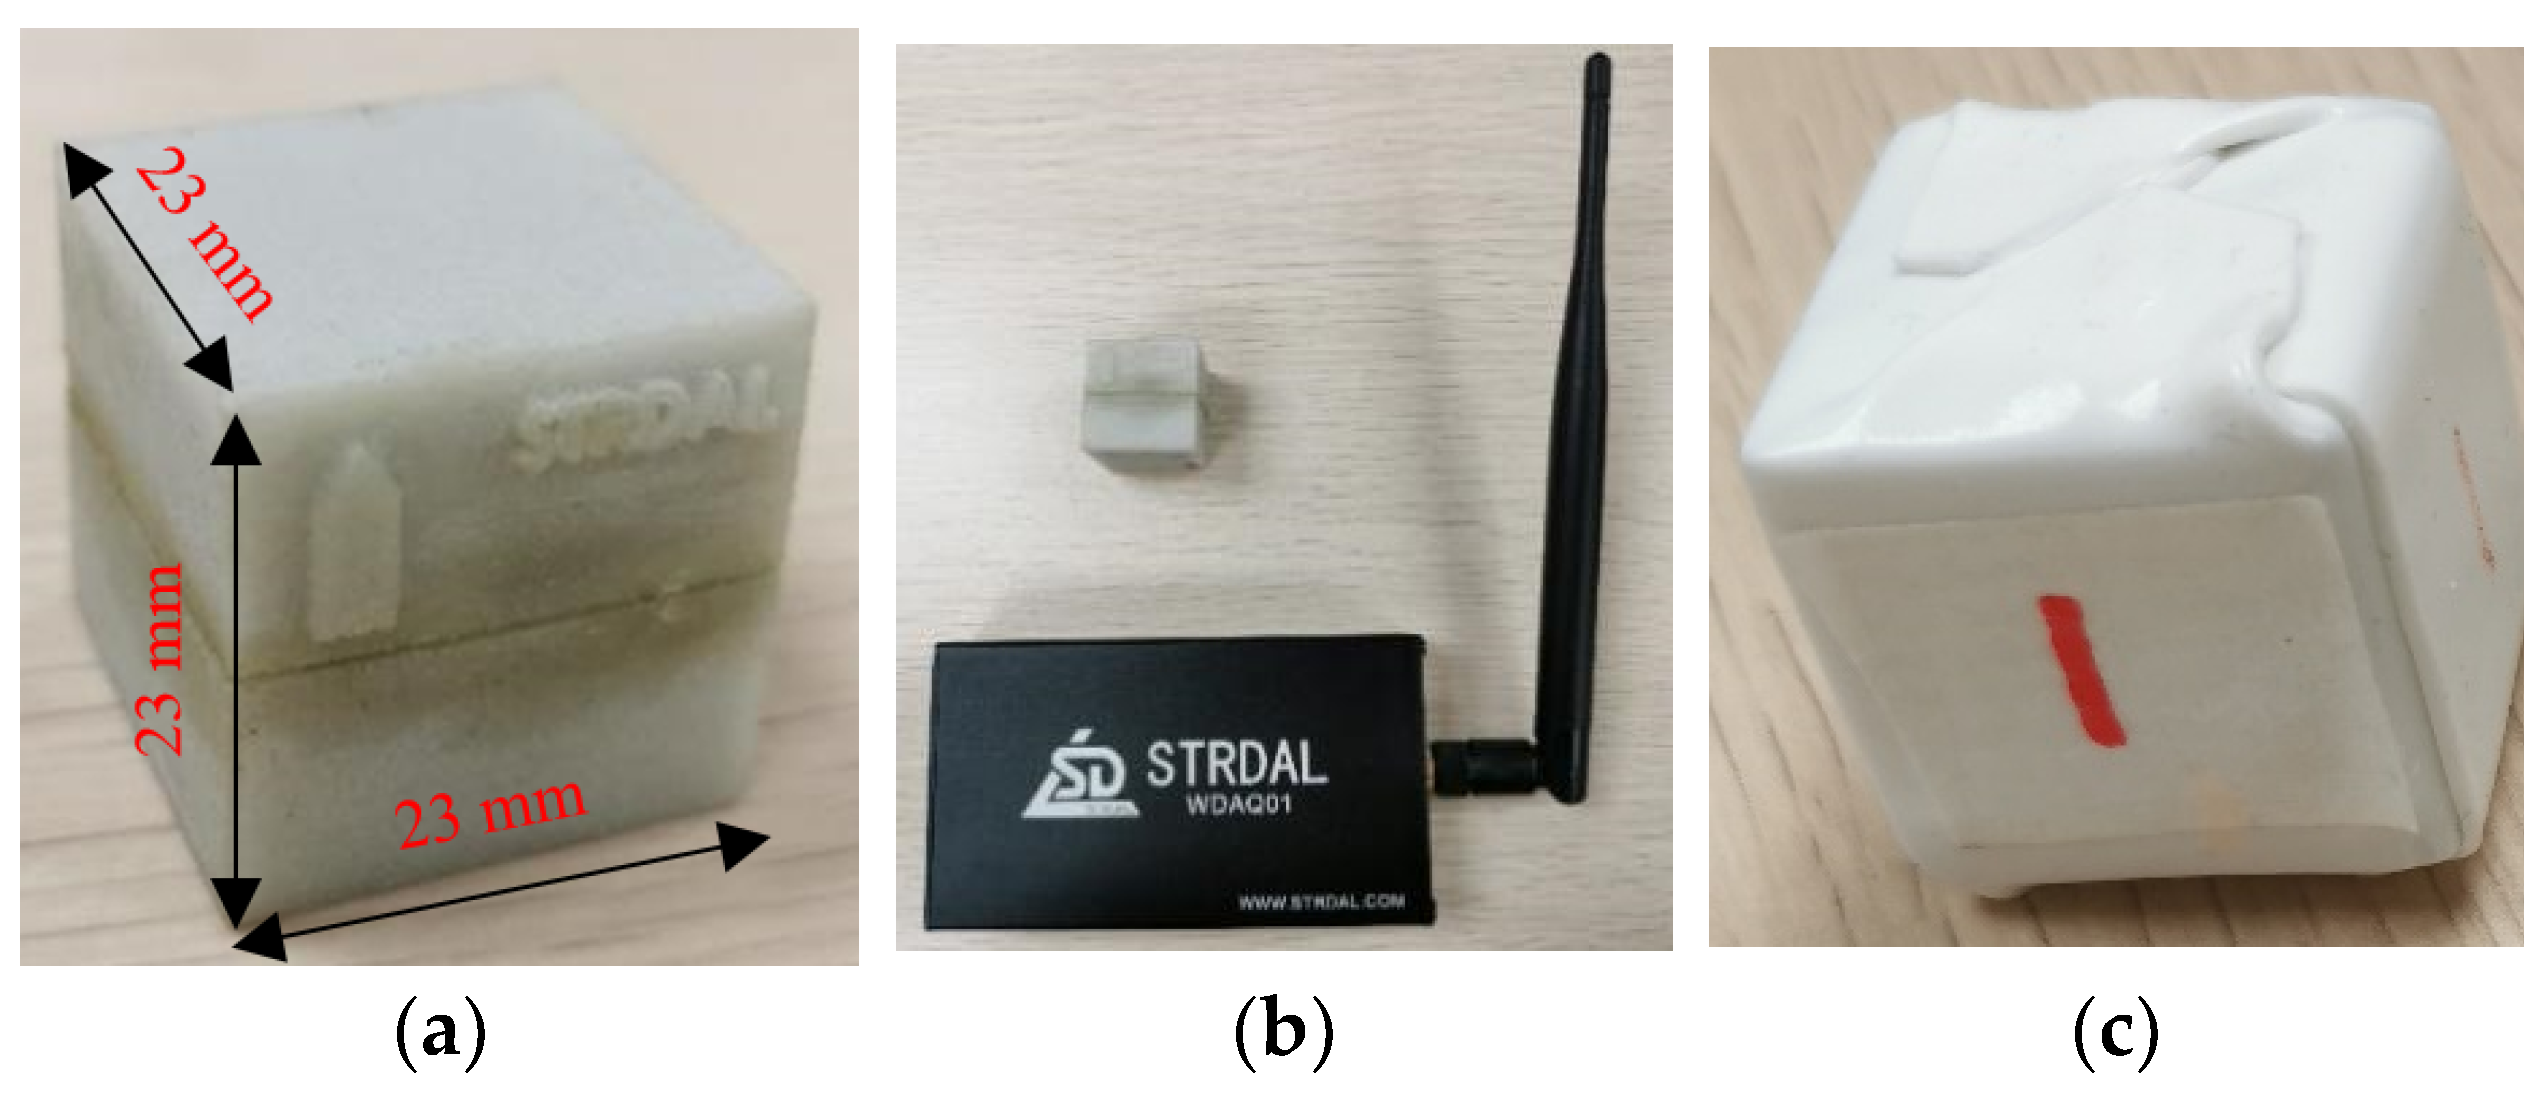
2.1. SmartRock

SmartRock is a small-size sensor developed for monitoring granular forces, deformation, stability, etc., of railway ballasted bed [31] and highway pavements. With the particle level size, all of the above studies have been extended from macroscale to mesoscale and have achieved meaningful results. The sensor system consists of three modules according to their functions: a data module, a communication module and a power module. The data are collected and stored instantly in the data module, including global time, temperature, stress, Euler angles under quaternion or geodetic coordinates, and acceleration. The shell of the sensor can be made in a specified shape. The sensor used in this study was filled in a cube shell 23 × 23 × 23 mm in size, as shown in Figure 1a, of which material strength and the bonding performance with the asphalt mixture are similar to the actual aggregate of the mixture. The test data were transmitted to a portable receiver (Figure 1b) using Bluetooth Low Energy technology in the communication and power module and can be displayed and recorded in real time. As the working temperature of the sensor should be within 120 °C, a thermal insulation layer (Figure 1c) is wrapped around the particle shell. Therefore, the sensor, embedded in hot mix asphalt mixture, can work normally under high temperatures over 120 °C during compaction.
The pressure measuring principle of SmartRock is to test and convert voltage to stress value. During compaction, the compressed sensitive film in SmartRock generates a slight deformation and a change in the resistance value of the strain gauge. Furthermore, the stress on the particle can be determined based on the voltage value, and the stress value can be determined by Equation (1):
f = U U 0 b · l n T c a A
where f (kPa) is the stress value; U (V) is the voltage signal recorded; U0 is the basic voltage signal before compaction; T (°C) is the temperature; A (m2) is the area of the strain gauge; a, b and c are calculation coefficients. Three sensors (R1, R2, R3) were employed in this study and the calculation parameters of each sensor are listed in Table 1.

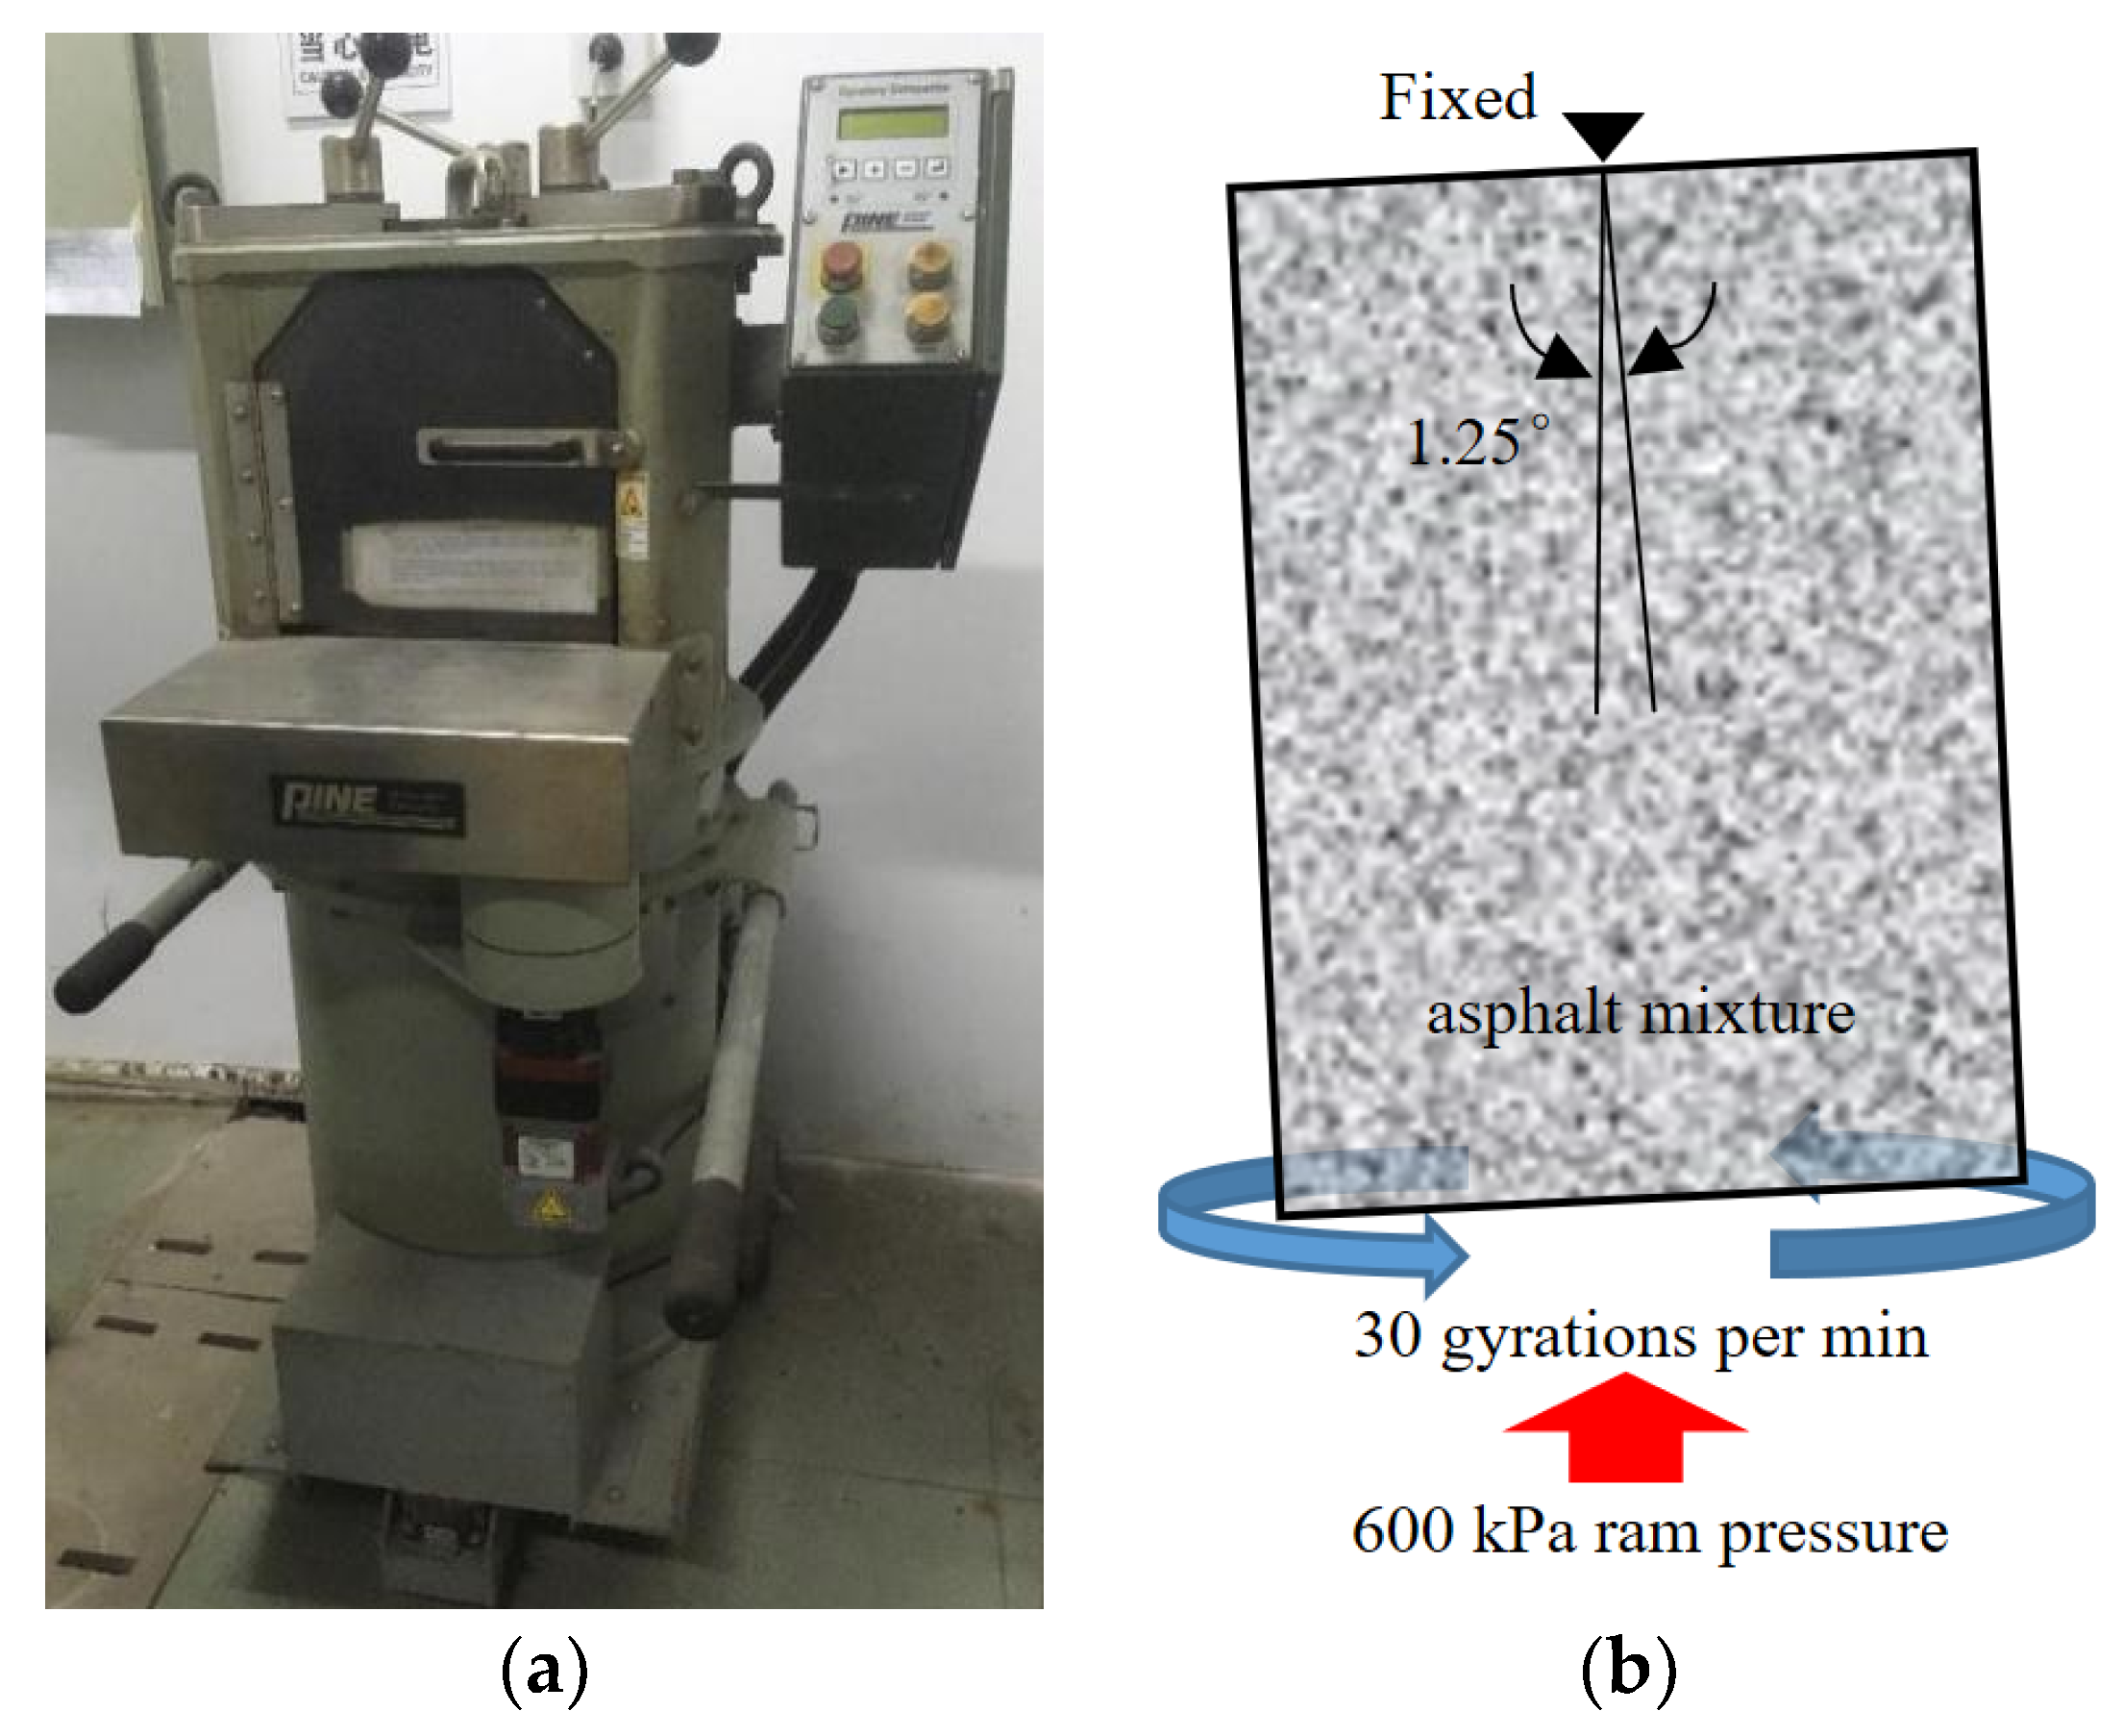
2.2. Preparation of SGC Testing Materials and Equipment

In order to reduce the influence of SmartRock’s size on the compactability of the asphalt mixture, AC-20C mixture (the maximum particle size is close to the SmartRock’s size) was selected for gyratory compaction. Moreover, the technical indicators of coarse aggregate, filler and bituminous binder are listed in Table 2, Table 3 and Table 4, respectively.
According to the inspection results listed in Table 2 through to Table 4, all materials meet the requirements of the Technical Specification for Highway Asphalt Pavement Construction (JTG F40-2004) [32]. The gradation curve of the AC-20C mixture is shown in Figure 2.
The gradation of the AC-20C mixture is listed in Table 5, and the optimal asphalt content is 4.2%. The volumetric and mechanical characteristics of the mixture are shown in Table 6, and both meet the specification requirements.
The Superpave gyratory compactor manufactured by the PINE instrument company was adopted in this test, as shown in Figure 3a. The operation parameters used in the study consisted of the rotation speed at 30 r/min with a calibrated internal angle of 1.25° and a stress of 600 kPa. The diameter of the molding specimen is 150 mm. During gyratory compaction, the top plate remains fixed, and the bottom plate under upward pressure rotates with the mold.

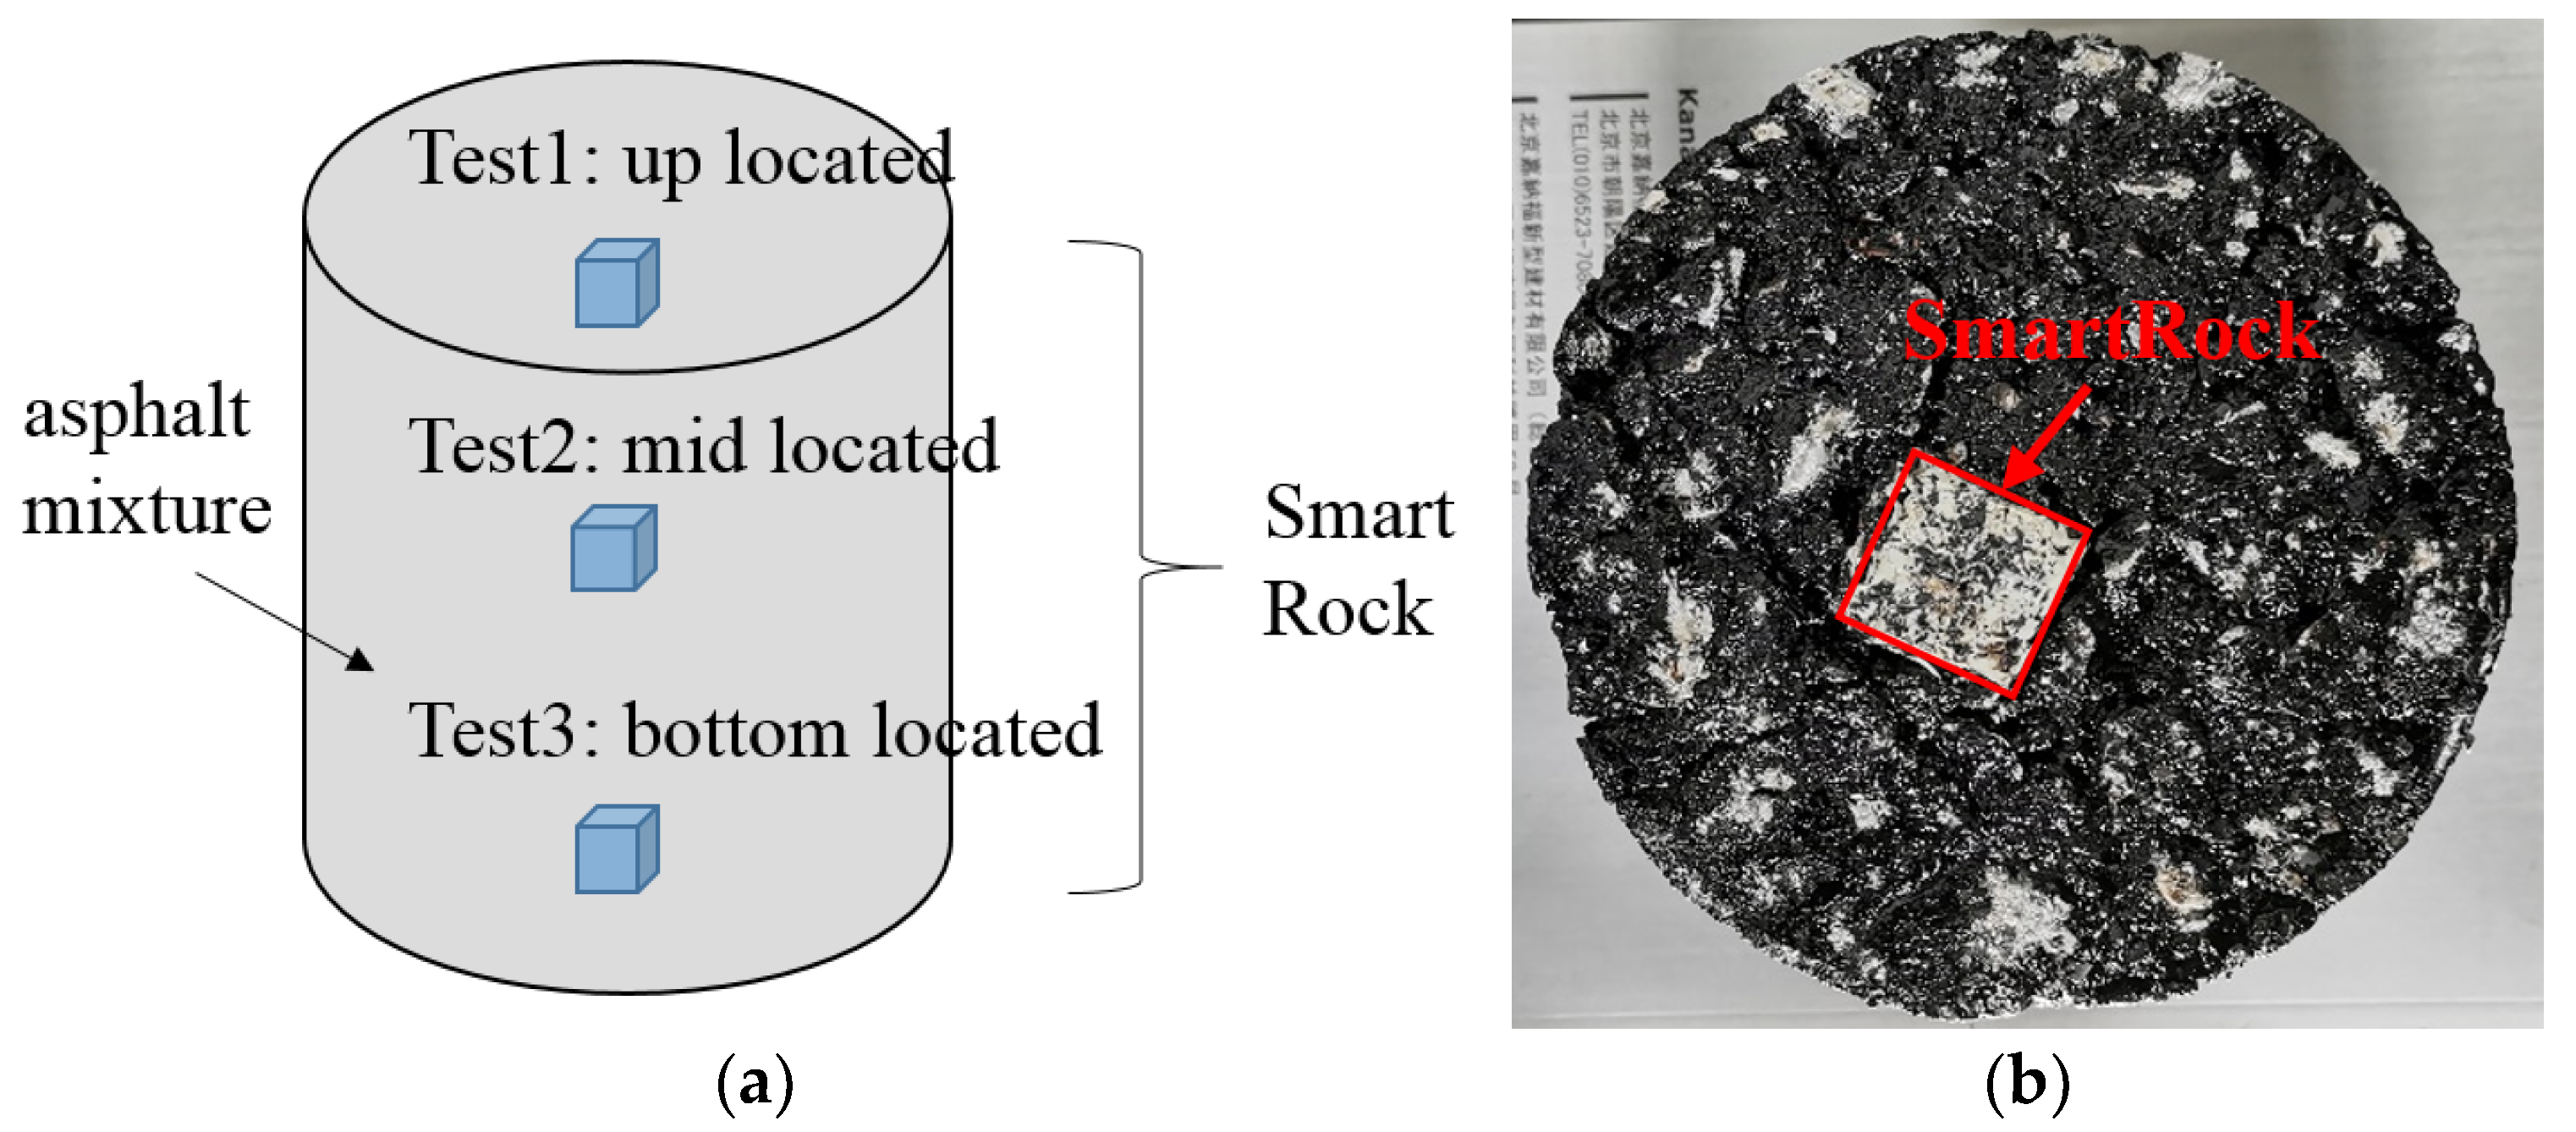
2.3. Layout and Application of SmartRocks

Several indoor experiments with SmartRock were carried out to investigate the compaction response characteristics from a mesoscale perspective. The application of SmartRocks in gyratory compaction is illustrated as follows.
Each testing specimen weighed 4.8 kg. The mixing temperature of the asphalt mixtures was set to 180 °C, and the compaction temperature ranged from 160–170 °C. To distinguish the possible impact on the compaction process caused by the SmartRock’s embedded locations, three groups of tests were carried out with SmartRock up-located (Test 1), mid-located (Test 2), and bottom-located (Test 3) in the sample, respectively (see Figure 4a). After compaction and testing, the sensor was taken out at a high temperature from the demolding specimen (as shown in Figure 4b).
During the test, the sampling frequency for stress, acceleration and rotation angle acquisition was set to 100 Hz. The quaternion could be transformed into an Euler angle, and all gathered signals should be filtered to reduce noise interference.

3. Discrete Element Simulation for Gyratory Compaction

3.1. Model Construction with Irregularly Shaped Aggregates

Previous studies reported that particle shape had a significant impact on the simulation of asphalt mixture compaction behavior [33]. Therefore, Gong obtained point cloud data of particle profiles with 3D laser scanning [26] and divided the overall morphological characteristics of aggregates into five categories (rounded, fractured, angular, elongated and flat) according to ASTM D 4791 and 5821 [34,35]. Based on the statistical results, most particles were fractured and angular, and only a small number of particles were elongated and flat [33]. In this study, an open-source discrete element simulation program (YADE) was used to simulate the gyratory compaction process. Considering the particle morphology distribution characteristics [33], a reconstruction method for polyhedral particles based on Voronoi tessellation [36,37,38] was employed to set up a sample library for irregularly shaped particles. For each particle, the reconstruction method is illustrated as follows:
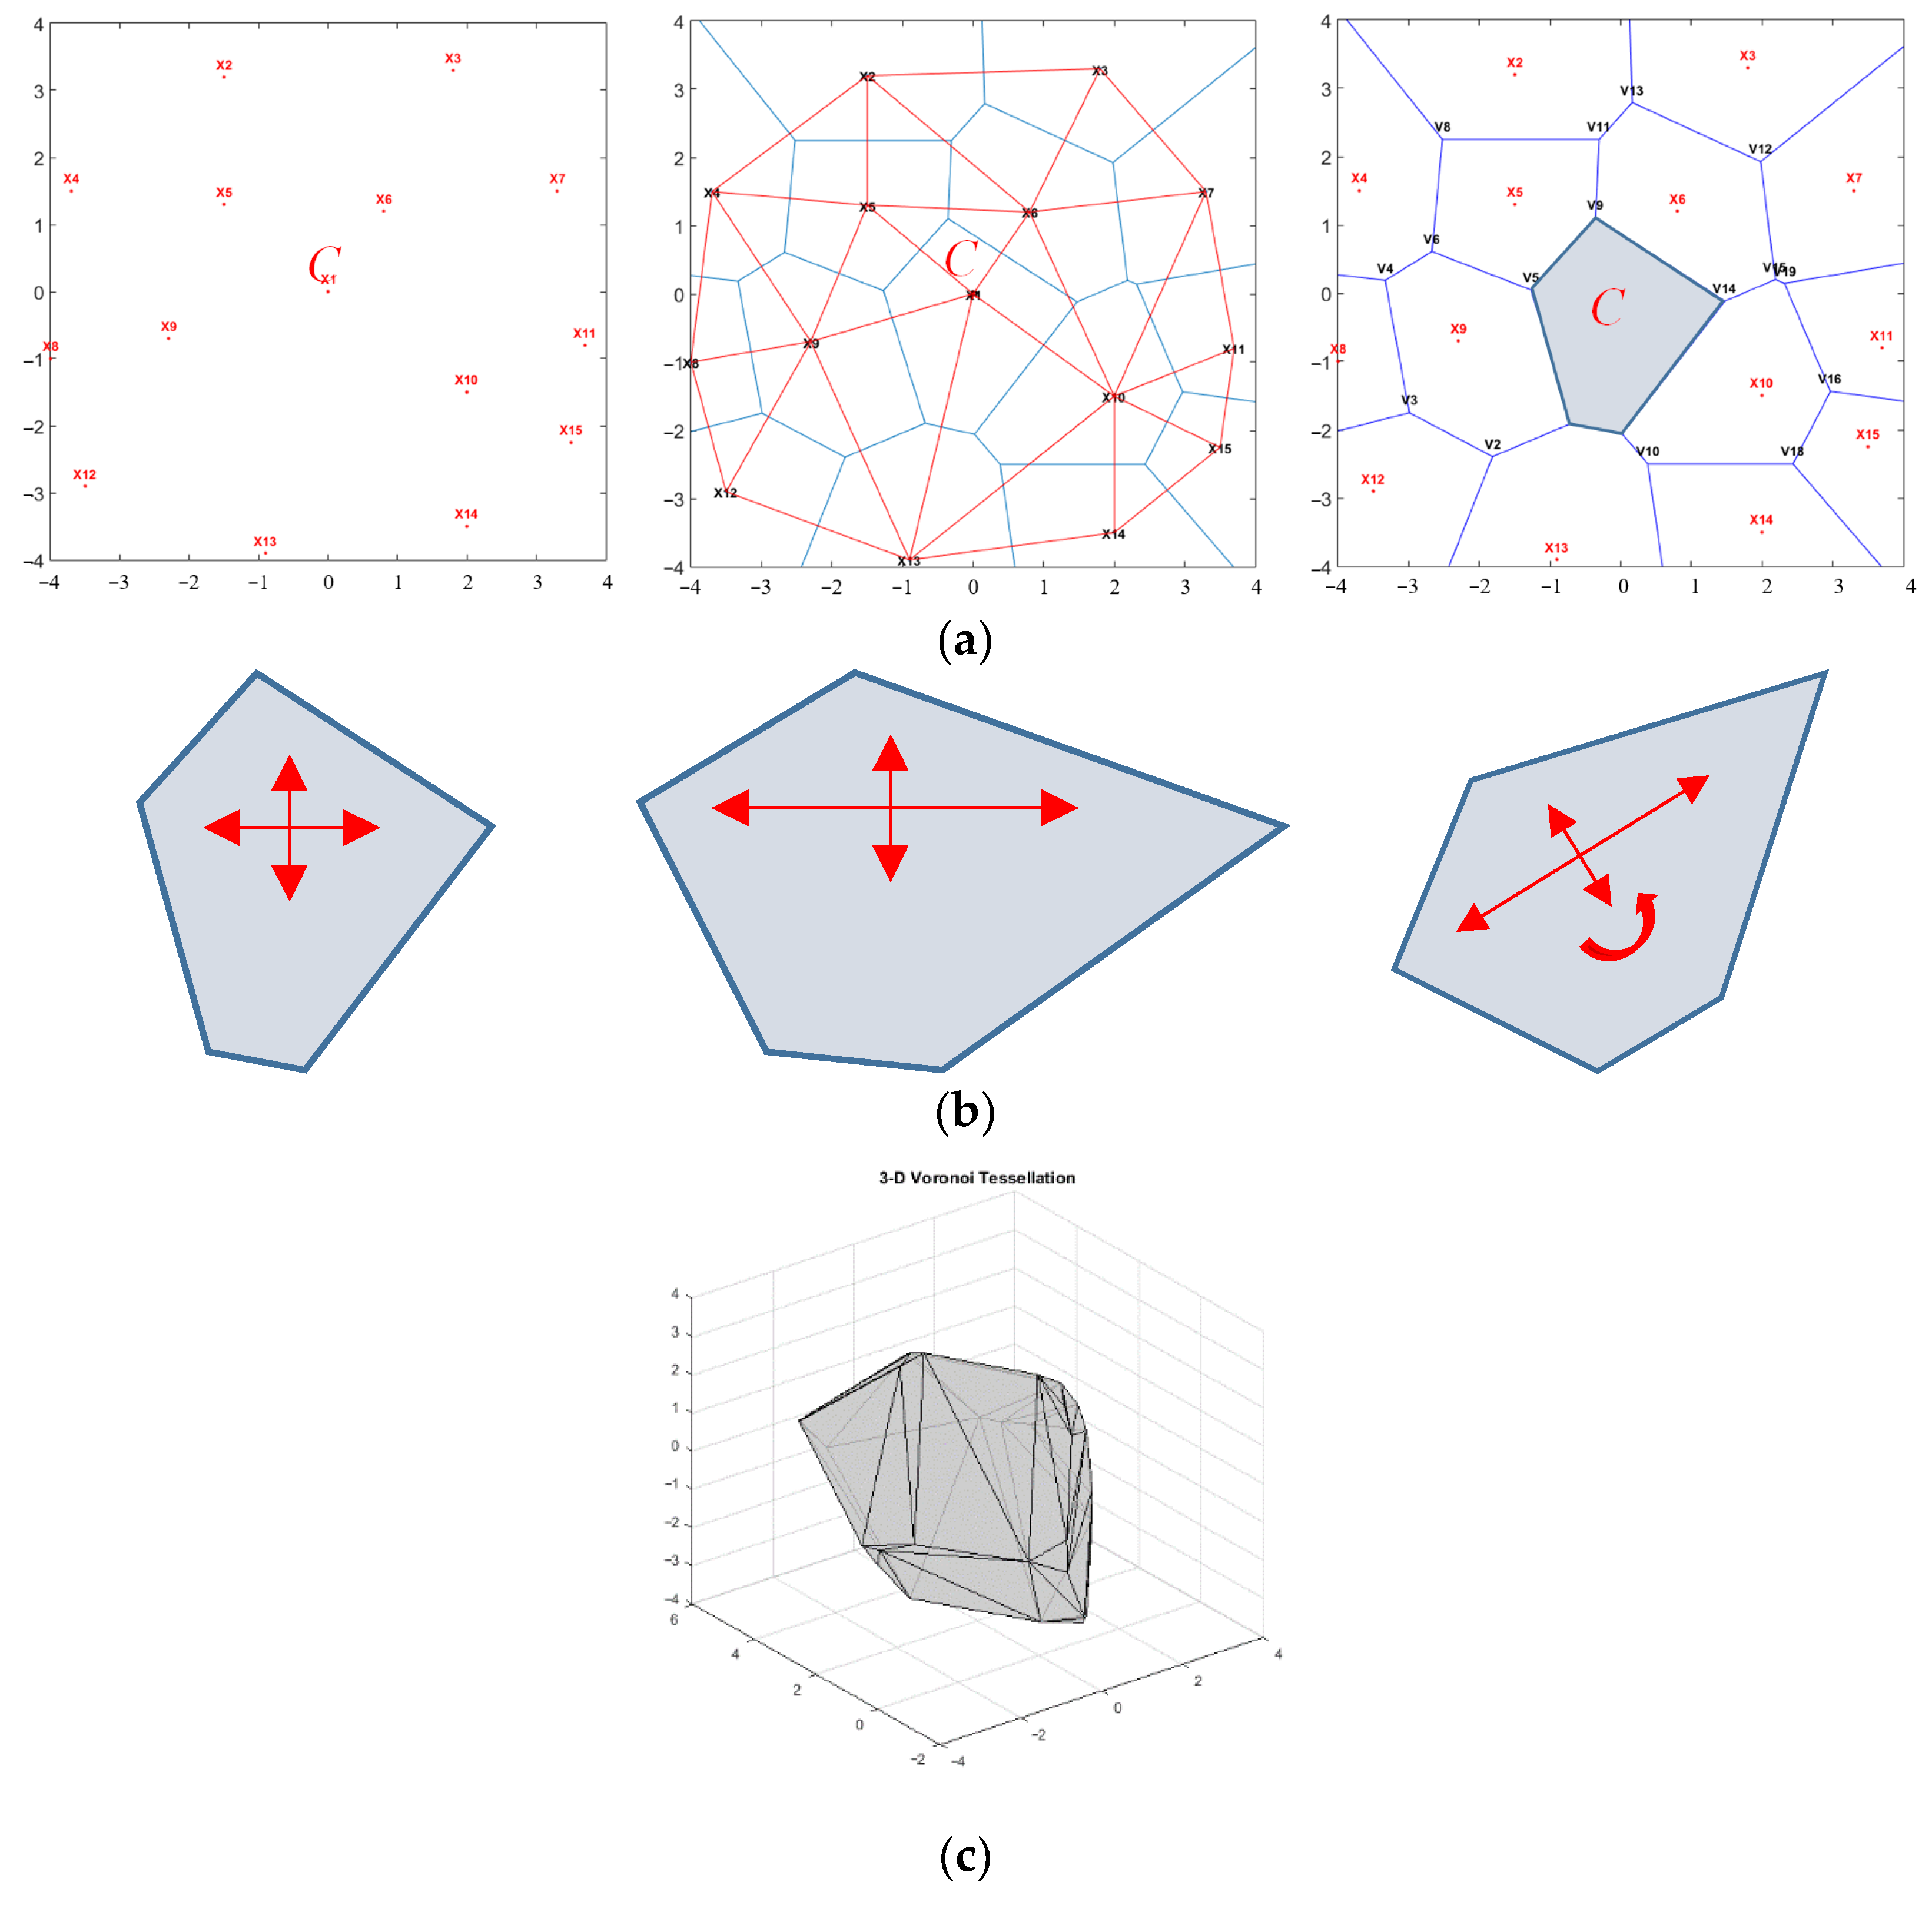
  • In 3D space, seed nuclei with random coordinates are firstly arranged around the center nuclei C. The 3D space is divided into multiple polyhedrons by the vertical bisector of adjacent seed nuclei, and the polyhedron containing the center nuclei C is obtained as the basic particle shape.
  • Figure 5a shows the schematic diagram in 2D. Each particle shape is further adjusted to make the grading curve of the particle sample library satisfy the gradation requirement of the asphalt mixture. As shown in Figure 5b, spindle tension and rotation are mainly utilized to adjust particle size. The final particle shape for 3D simulation is shown in Figure 5c.
  • After generating the polyhedrons, including three shape categories—angular particles, fractured/elongated particles and flat particles—each polyhedron is filled with densely arranged spheres to form a clump, as shown in Figure 6. In addition, asphalt binder and aggregates with sizes less than 3 mm are directly simulated by spherical particles.

3.2. Gyratory Compaction Process Simulation

For the DEM model, aggregates were randomly generated according to the method described in the previous section and initially stacked by gravity (see Figure 7a). Then, the top plate was fixed, while the mold was rotated around the central point of the top plate until the rotation angle reached 1.25°. During gyratory compaction, the bottom plate was under a pressure of 600 kPa. The mold rotated around the central axis at a speed of 0.5 r/s, and the final compacted model is shown in Figure 7b. The process data for the bottom plate position and the aggregate movement were recorded. In addition, asphalt binder was considered to play a lubricating role with respect to fast movement and large displacement [39], so that the linear contact model was adopted to simulate the gyratory compaction behavior, with the meso-parameters listed in Table 7. The computer used for calculation was configured with a dual core CPU with model Intel Core I7-9700 and 3.1 GHz using the Ubuntu 16.04 operating system. The total simulation time lasted about 44 h.

4. Results and Discussion

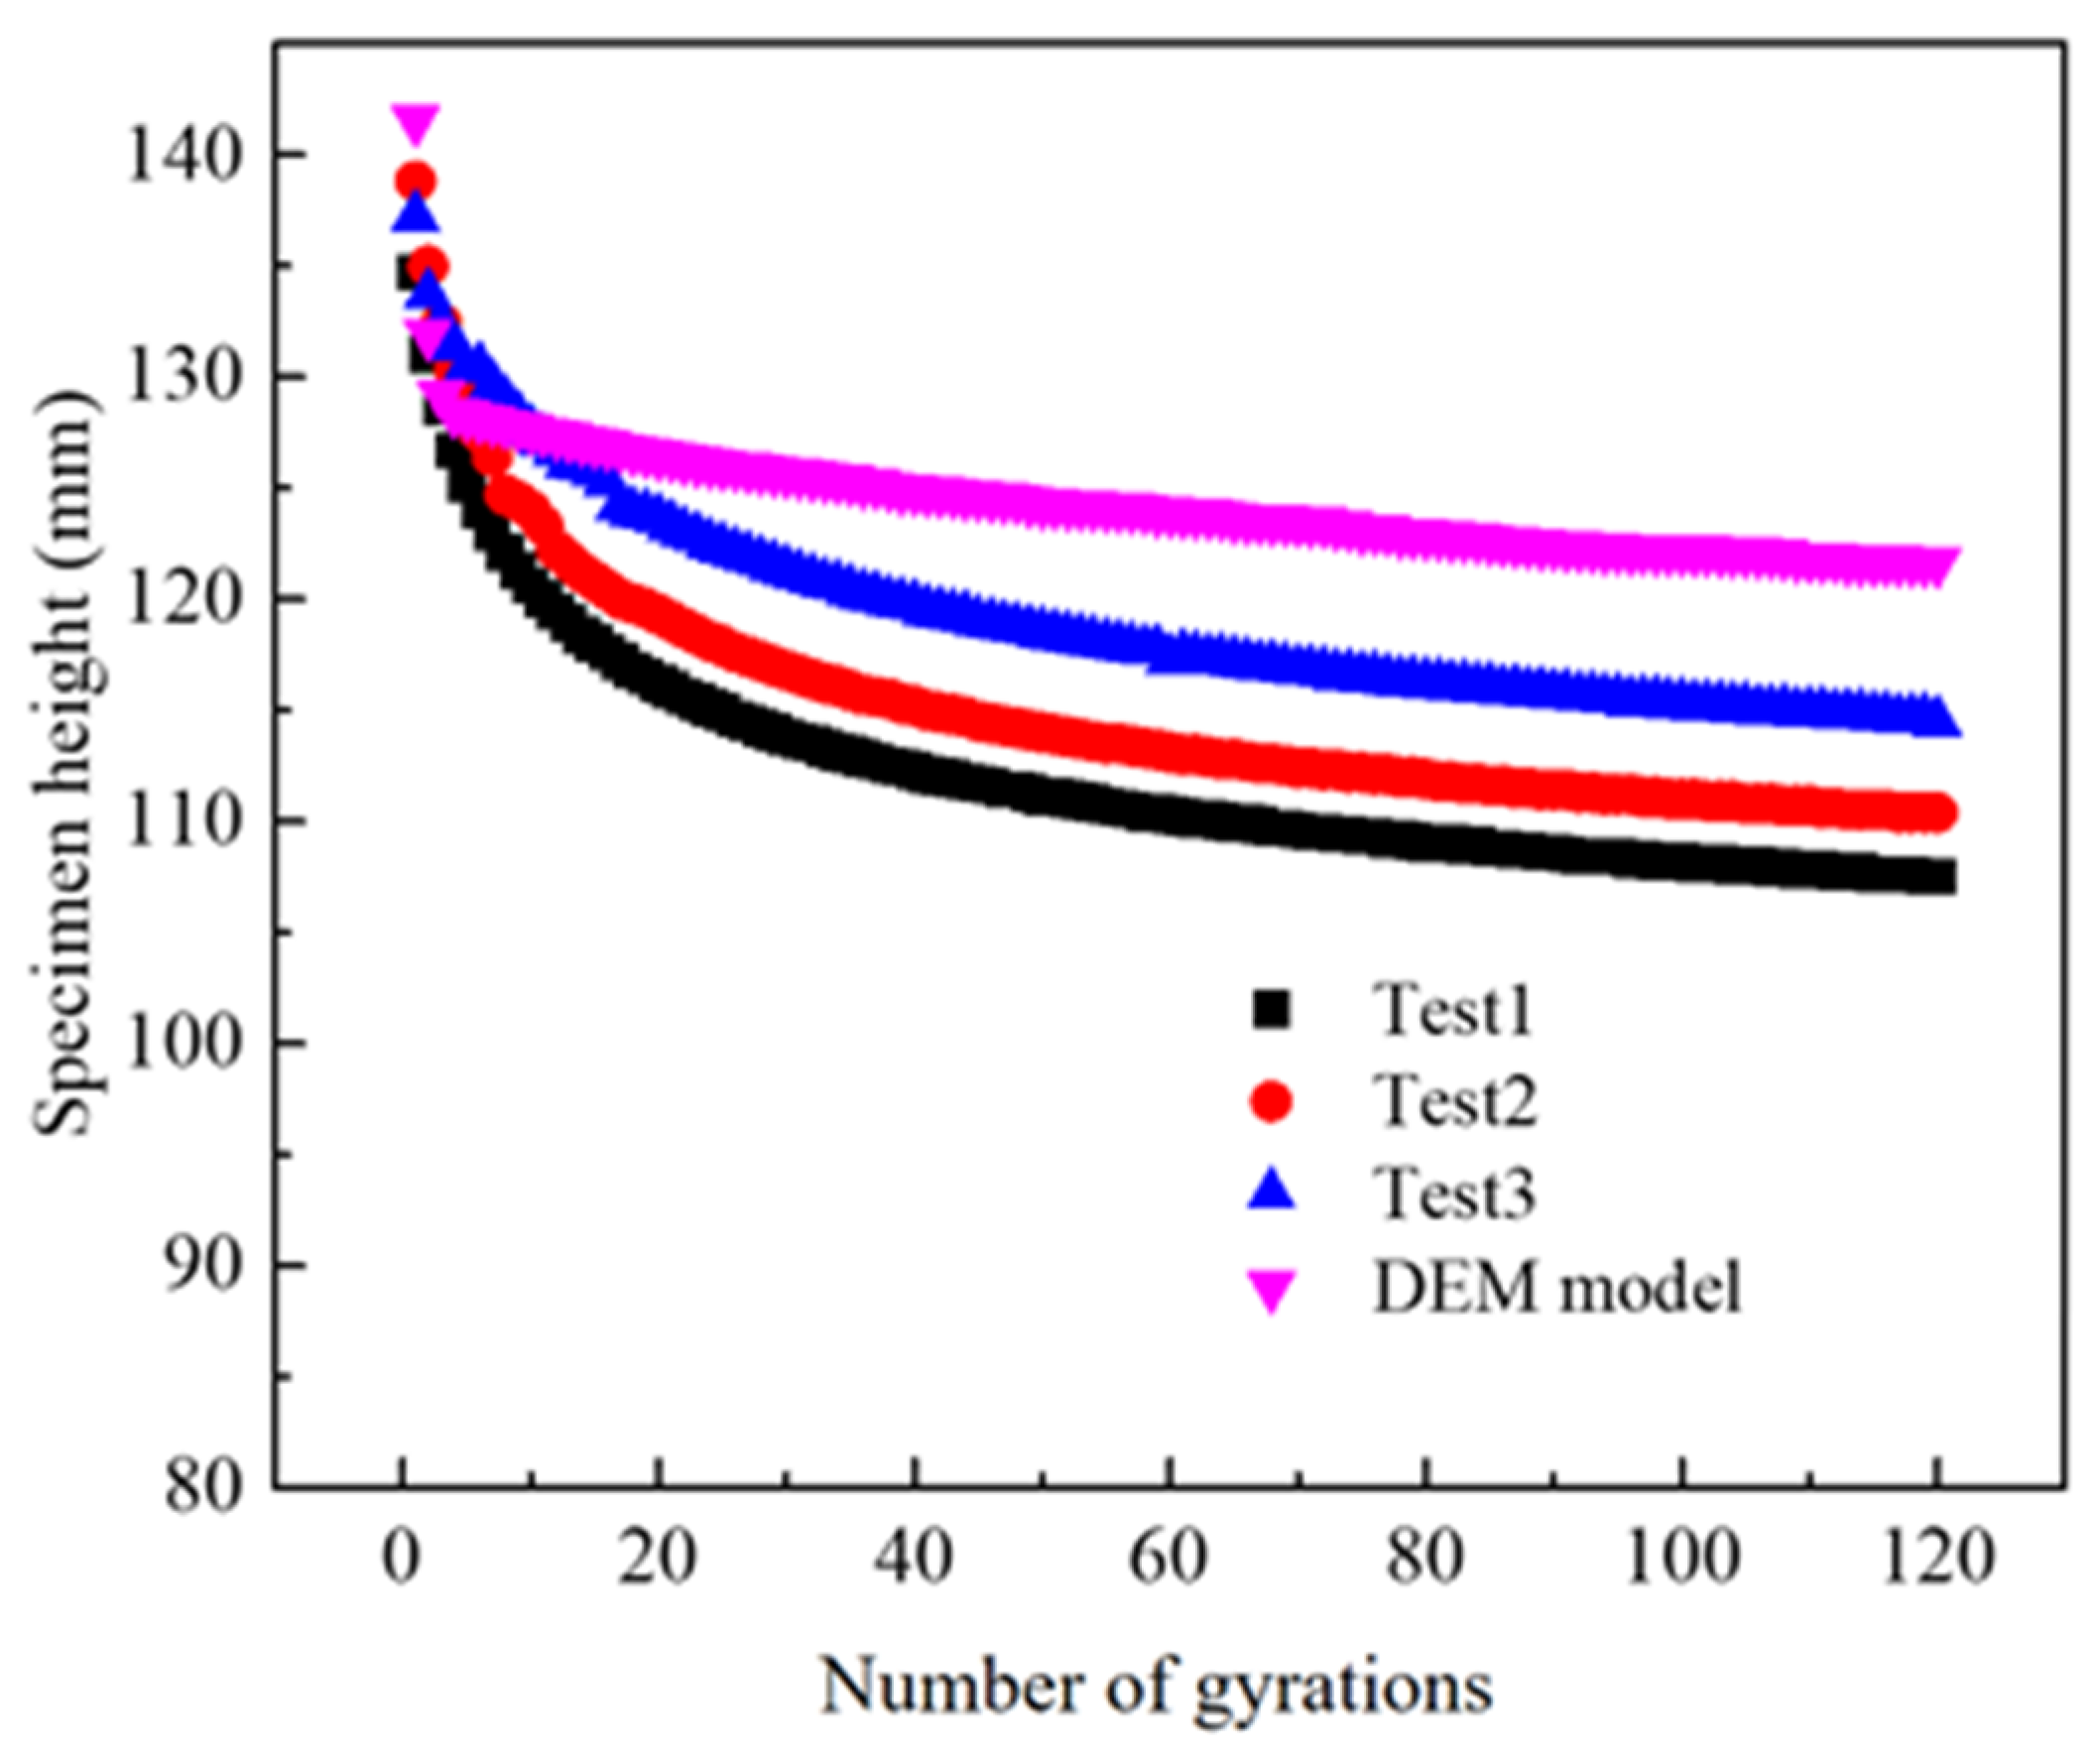
4.1. Specimen Height Change

The height change curves for compacted specimens from three tests were recorded and compared with the DEM simulation result, as shown in Figure 8. The compaction efficiency (height change) of the DEM model was greater than the test results in the several initial rotations (before 10 cycles). In addition, the reduction rate of specimen height in the DEM model became slower in the subsequent gyratory compaction stage. Unlike Burger’s contact model with a damping pot, the linear contact model used in this paper ignored the viscosity of the asphalt binder, which might explain the height change rule distinction between the DEM simulation and the test results.

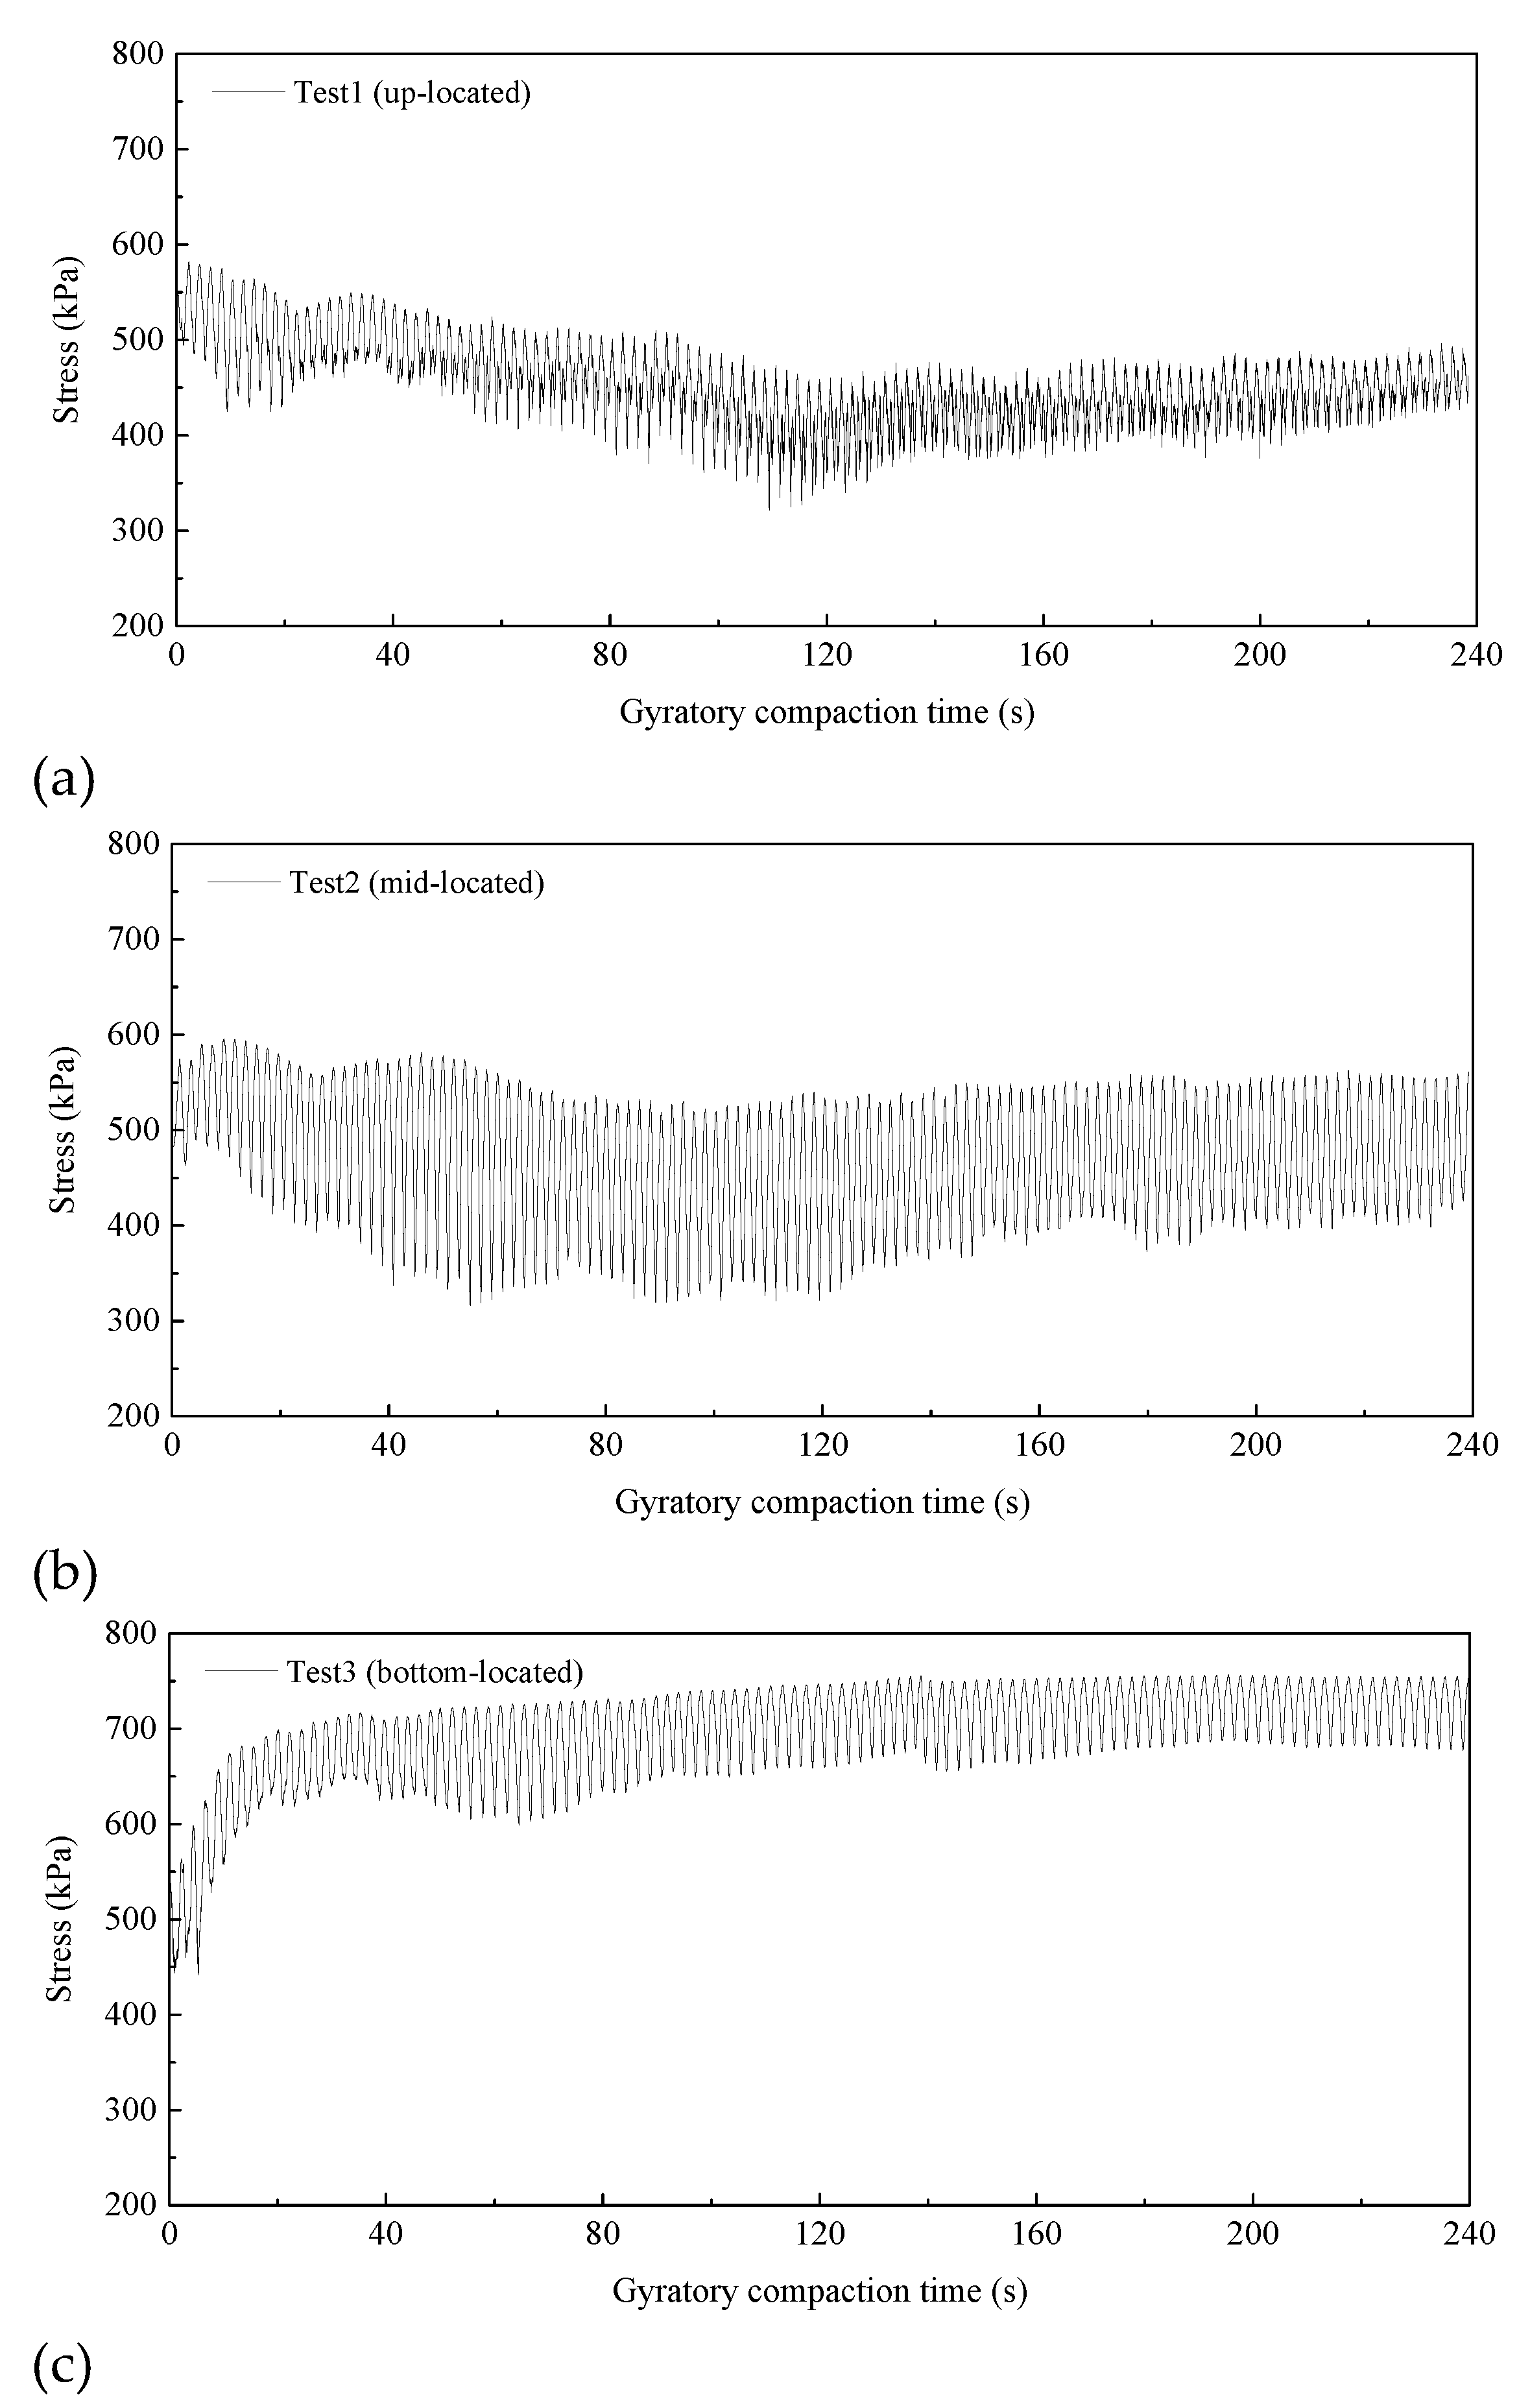
4.2. Contact Stress of Aggregates

Figure 9 shows the contact stress results of particles measured by SmartRock at different locations in three testing groups. It can be seen that the measured stress changes periodically during gyratory compaction, and the stress amplitude tends to be stable asgyrations increase. The stress value range fluctuates from 350 kPa to 750 kPa. Each particle’s contact stress is also tracked in the simulation model. The result indicates that the particles’ contact stress evolution in the DEM model is similar to the test result. However, the particles’ contact stress is discrete due to the particles’ shapes. Figure 10 shows the particles’ contact stress obtained in the simulation model; particles with three different shapes (angular, fractured/elongated and flat) are located in the middle layer of the specimen. As can be seen in Figure 10, the contact stress range for the angular particle (300 kPa~800 kPa) is close to that for the fractured/elongated particle (300 kPa~700 kPa). Nevertheless, the flat particles’ contact stress (1200 kPa~1600 kPa) is significantly higher than the other particles’. Similarly, conclusions can be drawn for other particles with different shapes according to the simulation results. It can be inferred that the flat particles are easy to trap in stress concentration, resulting in their being crushed during gyratory compaction. Therefore, the proportion of flat particles in the mixture should be reduced as much as possible.

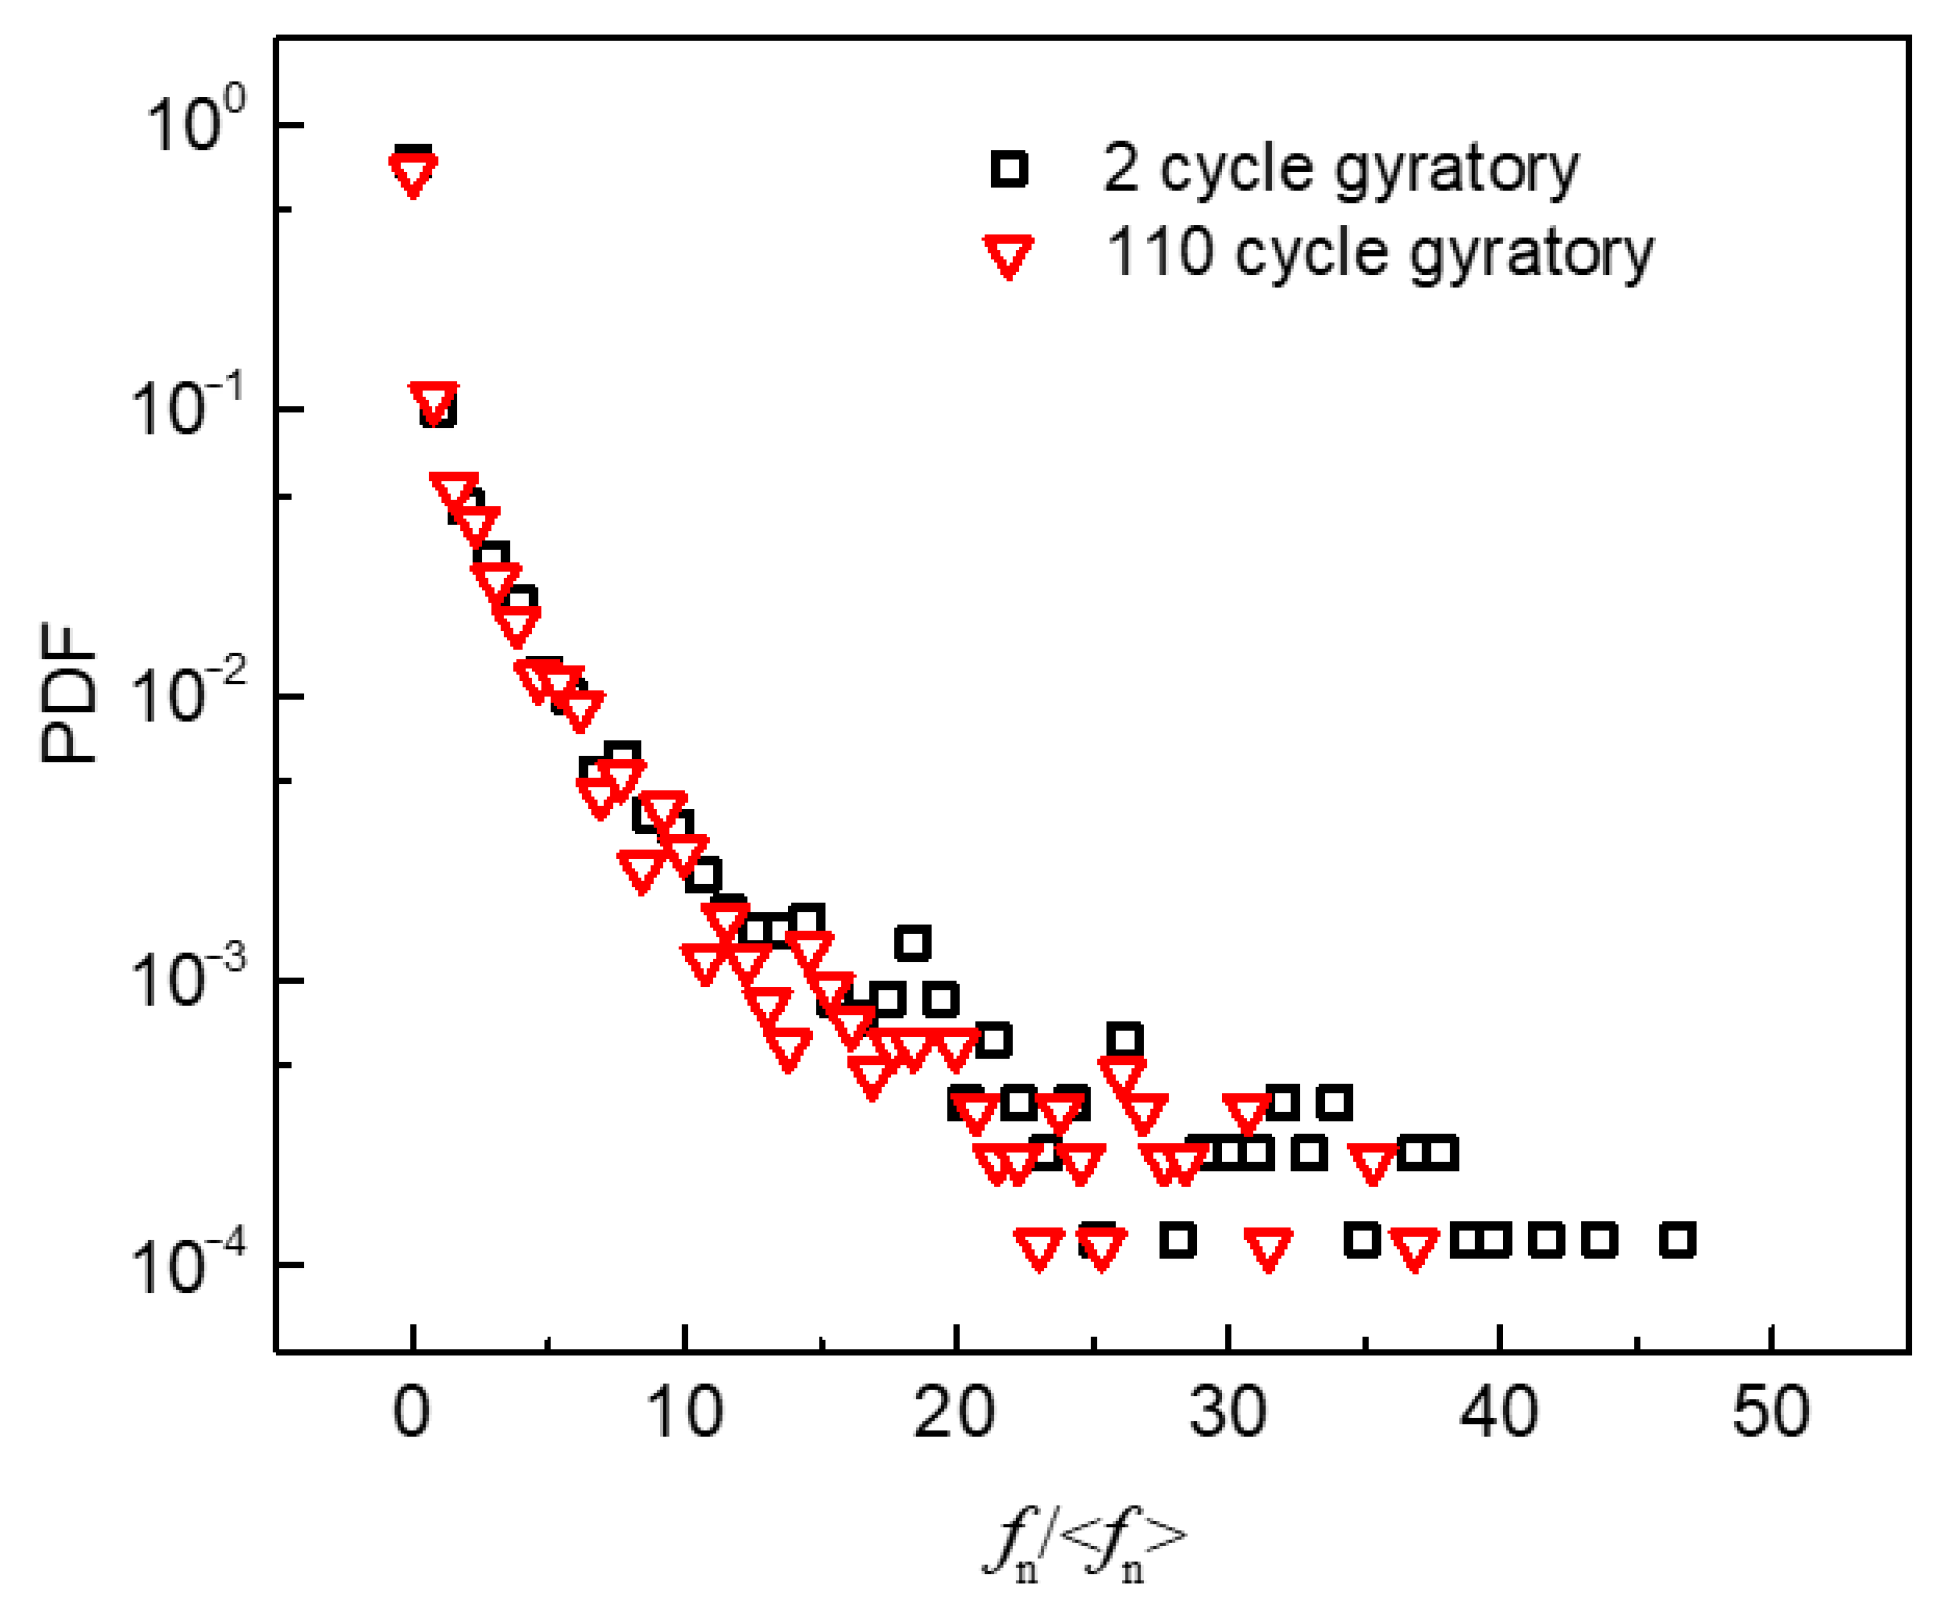
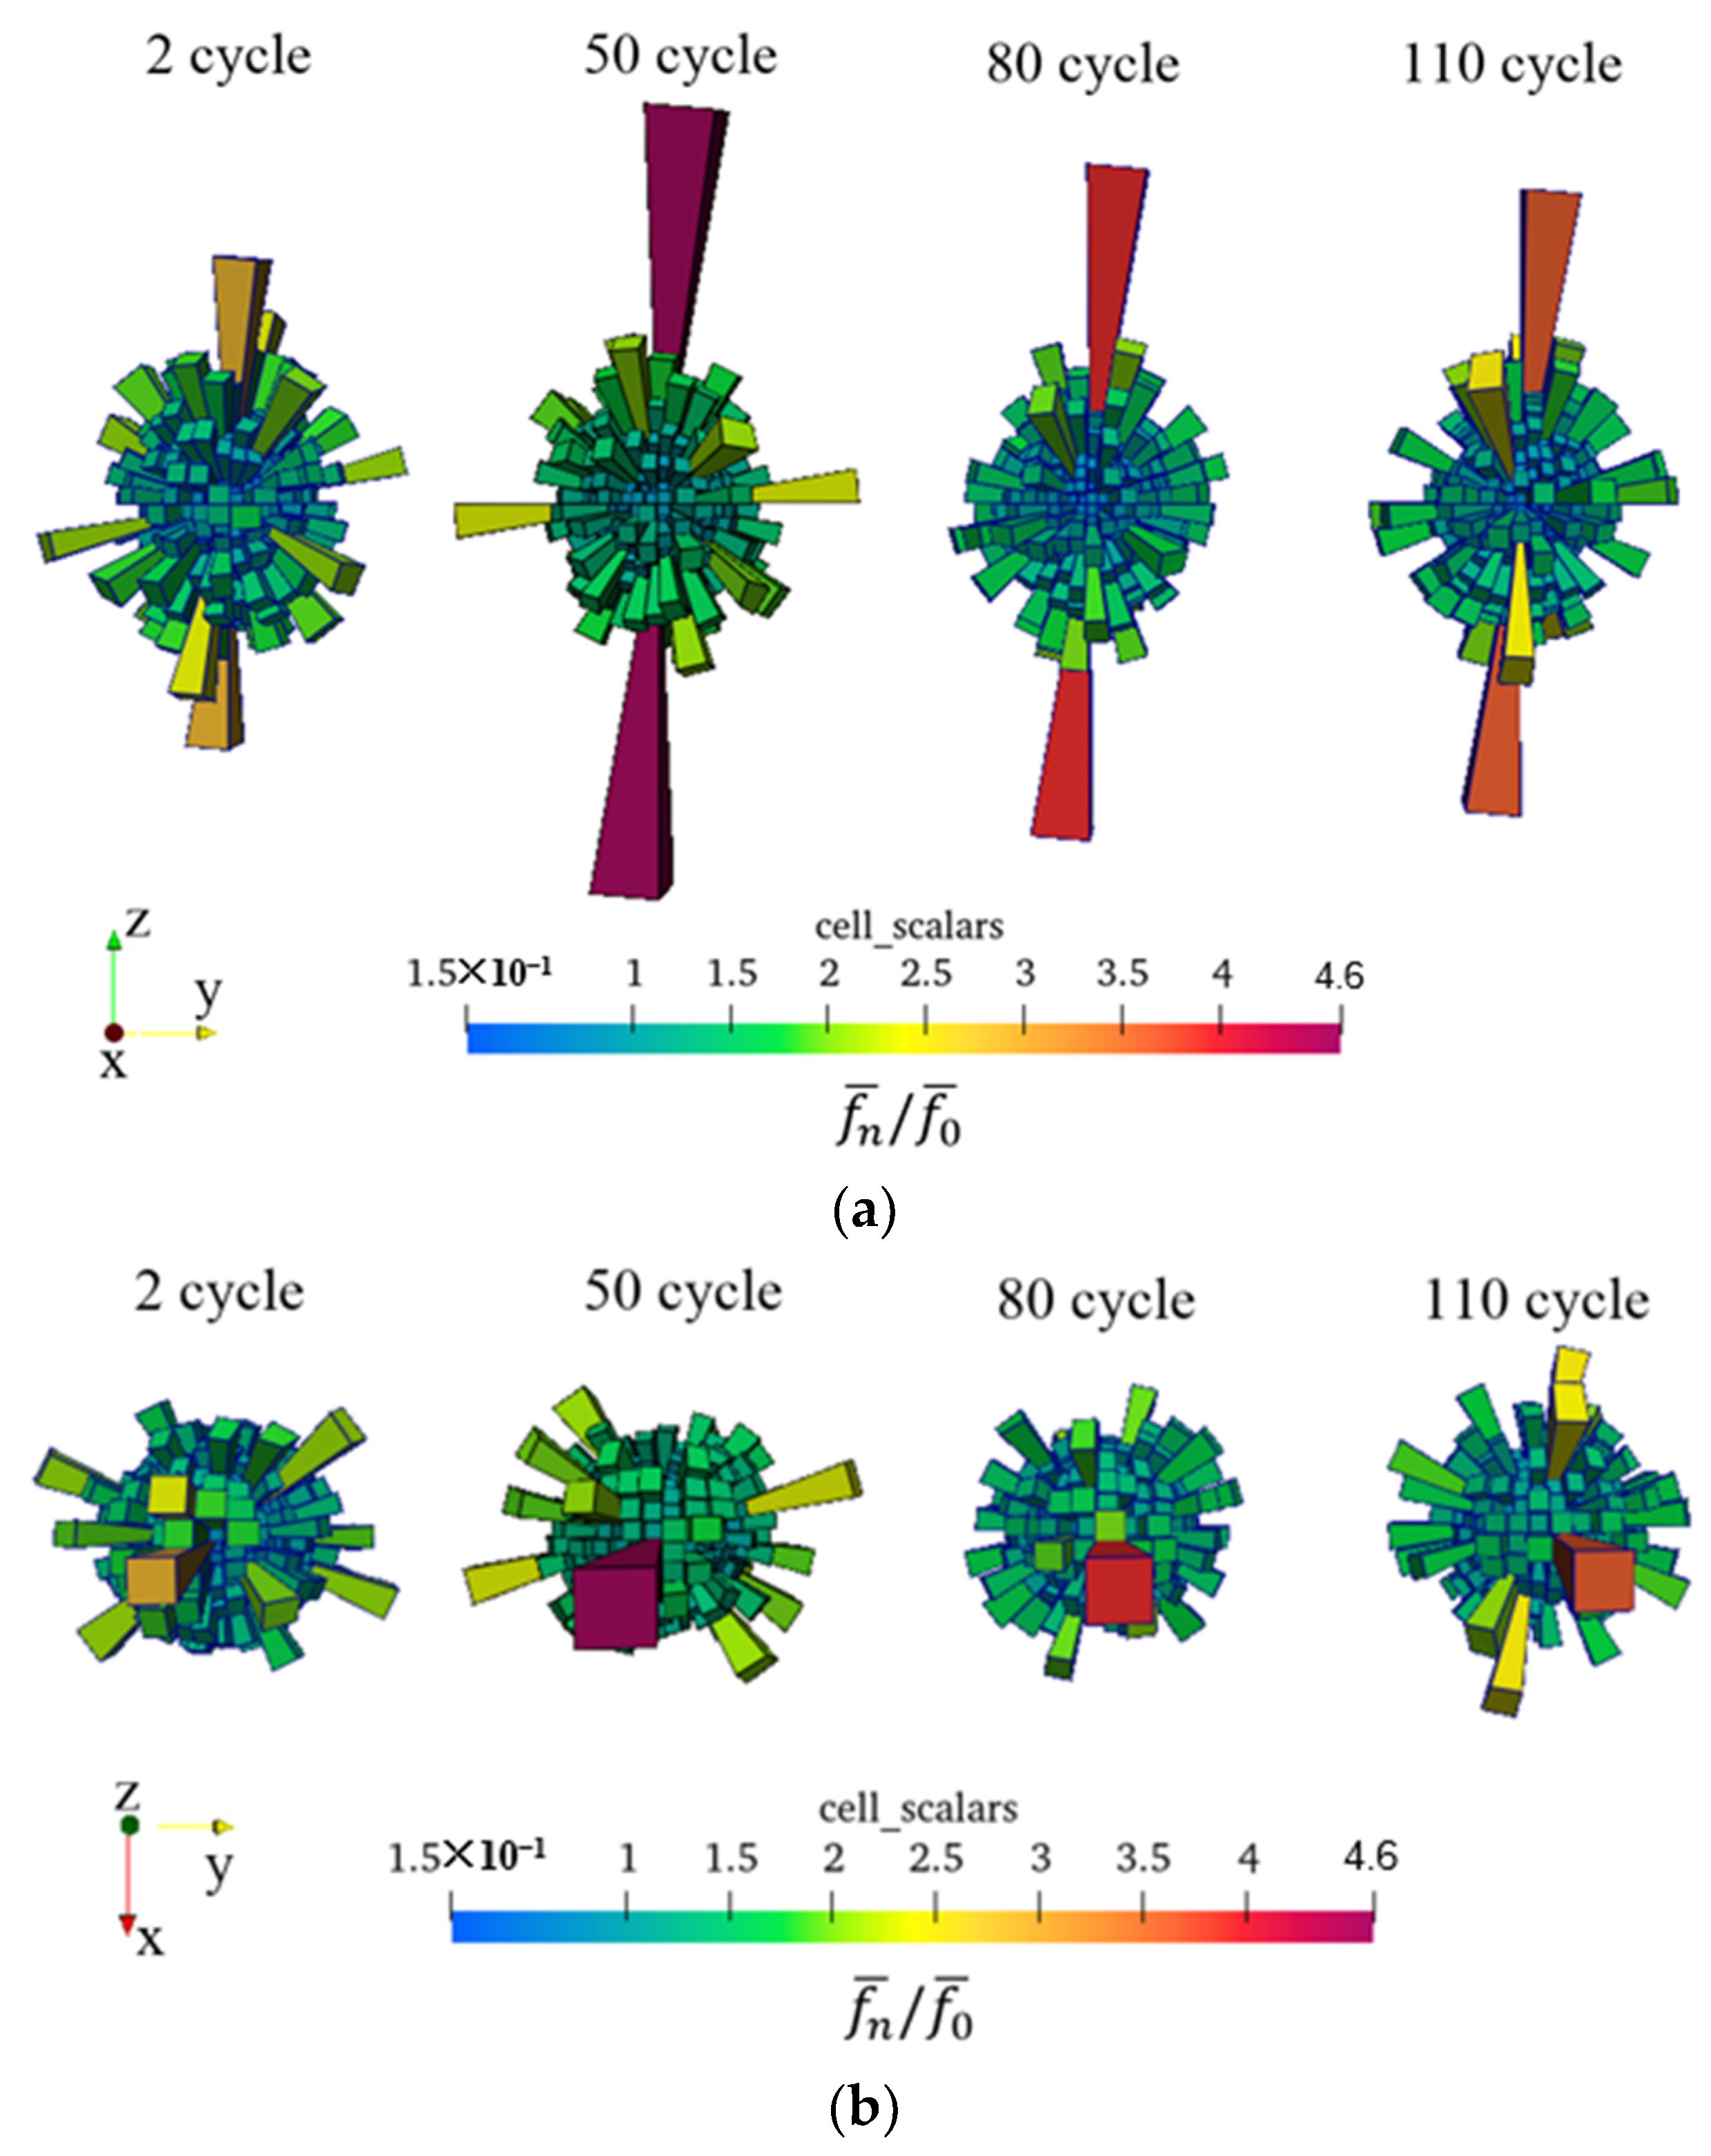
4.3. Contact Force Network Characteristics

Previous studies have proved that the normal contact force inside granular materials plays a major role in bearing external loads [40]. In this paper, the average normal contact force <fn> is defined as the average value of the normal contact forces. In addition, strong and weak contacts among particles construct a contact force network to resist external loads. Strong contacts bear the major eccentric load, while almost all friction dissipation occurs at weak contacts [41]. In this paper, normal contact force less than the average normal contact force is recorded as weak contact, with the converse holding for strong contact.
Figure 11 shows the evolution of a normal contact force (force chain) network under different compaction cycles (2, 50, 80 and 110 cycles). The distribution of normal contacts between particles becomes denser as the compaction cycle increases. Moreover, the strong contacts in the upper and middle parts of the specimen gradually increase in the compaction process. The proportions of strong contacts in the upper, middle and lower parts of the specimen vary from 21.9%, 18.3% and 19.1% to 27.8%, 20.1% and 20.5%, respectively. The maximum normal contact force of particles reaches 450 N in 110 cycle, which is located in the middle of the specimen. The probability distribution function (PDF) of contact force is often used to quantitatively study the non-uniformity of contact force networks [42]. The average normal contact force is normalized by the contact force fn in each normal direction, and the normalized fn/<fn> is obtained. The PDF of fn/<fn> under different compaction cycles (2 and 110 cycles) is shown in Figure 12. The strong contact proportion is high in the initial gyratory compaction stage. With the increase of cycles, the strong contact proportion decreases, and the contacts among particles tend to homogenize in the compaction process.
The three-dimensional spherical histogram can be used to visually describe the spatial distribution of the normal contact force, in which each column bar (in each discrete direction) represents the normalized local average normal contact force f n ¯ / f 0 ¯ in this direction. The local average normal contact force f n ¯ is defined as the average value of the normal contact force falling in a solid angle interval. It should be noted that the term “local” is used to distinguish it from the average value <fn> (“global”) of all contact forces. Besides <fn>, another global average value f 0 ¯ is introduced. f 0 ¯ equals the average of f n ¯ in all discrete directions. Therefore, <fn> is equal to f 0 ¯ for a uniformly distributed normal contact force direction. Moreover, for the isotropic normal contact force, the spherical histogram is an exact sphere with radius 1. The non-spherical histogram means the anisotropic distribution of normal contact force. Figure 13 shows the spatial distribution of the local average contact forces of the specimen under different numbers of gyrations (2, 50, 80 and 110 cycles). In the initial gyratory compaction (at two cycles), the normal contact forces form a close to vertical distribution, which is caused by the initial vertical gravity accumulation of the aggregates. In the process of gyratory compaction, the spherical histogram increases locally in the loading direction (along the axis with a calibrated internal angle of 1.25°), which means that strong contacts form and grow at 50 cycles. However, at 110 cycles, the local strong contacts along the axis with a calibrated internal angle of 1.25° decrease. While the strength of the force chains in other directions increase, the anisotropy of the aggregates’ contact force network tends to weaken. Combined with the previous PDF features, kneading and shearing action during gyratory compaction can have a positive effect on the homogenization and isotropy of asphalt mixture contact force.

5. Conclusions

This study was carried out to analyze the mesoscale mechanical behaviors of coarse aggregates in asphalt mixtures during gyratory compaction. The particles’ contact stress was obtained by a novel granular sensor (SmartRock), and the evolution of the normal contact network for aggregates was explored and developed in a DEM simulation model. The mechanistic results can be used to guide on-site compaction control and mix proportion design. In summary, the main findings are as follows:
  • The measured contact stress among particles changes periodically during gyratory compaction, and the amplitude of stress tends to be stable with the increase of compaction cycles;
  • Particles’ contact stresses are discrete and influenced by the shapes of aggregates. Flat particles are subjected to greater stress than the angular and fractured/elongated particles during gyratory compaction;
  • It can be inferred that flat particles are easy to trap in stress concentrations, resulting in their being crushed in gyratory compaction. Therefore, the proportion of particles with flat shapes in a mixture should be reduced as much as possible;
  • According to the contact network simulated by DEM models, the proportion of strong contacts is high in the initial gyratory compaction stage and decreases with the increase of compaction cycles. The contacts among particles tend to homogenize in the compaction process.
  • Given the gravity accumulation of the aggregates, the normal contact forces of samples form vertical distributions in the initial gyrations. Strong contacts form and grow up locally along the axis in 1.25° orientation at earlier cyclic loading, then decrease in the later stage. The anisotropy of aggregate contact force networks tends to be weakened by kneading and shearing of the asphalt mixture.

Author Contributions

Conceptualization, D.Z. and Z.C.; methodology, D.Z.; software, D.Z.; validation, D.Z., S.X. and D.G.; formal analysis, T.W.; investigation, D.Z. and Z.C.; resources, D.Z. and Z.C.; data curation, D.Z. and S.X.; writing—original draft preparation, D.Z.; writing—review and editing, Z.C. and T.W.; visualization, T.W.; supervision, Z.C.; project administration, Z.C.; funding acquisition, D.Z., Z.C. and D.G. All authors have read and agreed to the published version of the manuscript.

Funding

This research was funded by [the Shanghai Science and Technology Committee] grant number [20dz1202100] and [20DZ2251900] and [the central government guides local science and technology development fund projects] grant number [216Z3802G].

Acknowledgments

All experiments were completed with the staff in the engineering and technology center of Shanghai Road and Bridge Group Co. LTD. The authors would like to acknowledge the help of them all. It should be noted, however, that the content of this paper only reflects the views of the authors, who are responsible for the facts and the accuracy of the data presented herein.

Conflicts of Interest

The authors declare no conflict of interest.

References

  1. Mcgennis, R.B.; Anderson, R.M.; Kennedy, T.W.; Solaimanian, M. Background of Superpave Asphalt Mixture Design and Analysis; National Asphalt Training Center Demonstration Project 101. Final report, December 1992–November 1994, Report No. PB-95-221495/XAB); Asphalt Institute: Lexington, KY, USA, 1995. [Google Scholar]
  2. Lei, G.; Ni, F.; Charmot, S.; Luo, H. Influence on compaction of cold recycled mixes with emulsions using the superpave gyratory compaction. J. Mater. Civ. Eng. 2014, 26, 04014081. [Google Scholar]
  3. Wang, X.; Ren, J.; Hu, X.; Gu, X.; Li, N. Determining optimum number of gyrations for porous asphalt mixtures using superpave gyratory compactor. KSCE J. Civ. Eng. 2021, 25, 2010–2019. [Google Scholar] [CrossRef]
  4. Yuan, Y.J.; Hu, C.S. A study on the principles of gyratory compaction and its parameter configuration. Guangxi Sci. Technol. Commun. 2003, 28, 20–23. [Google Scholar]
  5. Sri, S. Influence of Foamed Bitumen Characteristics on Cold Mix Asphalt Properties; University of Nottingham: Nottingham, UK, 2008. [Google Scholar]
  6. Roberts, F.L.; Kandhal, P.S.; Brown, E.R.; Lee, D.Y.; Kennedy, T.W. Hot Mix Asphalt materials, Mixture Design and Construction, 2nd ed.; National Asphalt Pavement Association Education Foundation: Greenbelt, MD, USA, 1996. [Google Scholar]
  7. Bahia, H.U.; Friemel, T.P.; Peterson, P.A. Optimization of constructibility and resistance to traffic: A new design approach for HMA using the superpave compactor. J. Assoc. Asph. Paving Technol. 1998, 67, 189–232. [Google Scholar]
  8. Vavrik, W.R.; Carpenter, S.H. Calculating Air Voids at Specified Number of Gyrations in Superpave Gyratory Compactor; Transportation Research Board; National Research Council: Washington, DC, USA, 1998; pp. 117–125. [Google Scholar]
  9. Cheng, Z.; Jia, X.; Jiang, H.; Hu, W.; Huang, B. Quantification of impact compaction locking point for asphalt mixture. Constr. Build. Mater. 2021, 302, 124410. [Google Scholar] [CrossRef]
  10. Cheng, Z.; Aadrzej, P.P.; Zhang, D.; Hu, W.; Huang, B. A method for determining impact locking point of asphalt. J. Cent. South Univ. 2021, 52, 2232–2244. [Google Scholar]
  11. Mallick, R.B. Use of superpave gyratory compactor to characterize hot-mix asphalt. Transp. Res. Rec. 1999, 1681, 86–96. [Google Scholar] [CrossRef]
  12. Xinjun, L.I.; Gibson, N. Mechanistic characterization of aggregate packing to assess gyration levels during HMA mix design. J. Assoc. Asph. Paving Technol. 2011, 80, 33–64. [Google Scholar]
  13. Anderson, R.M.; Turner, P.A.; Peterson, R.L. Relationship of Superpave Gyratory Compaction Properties to HMA Rutting Behavior; Transportation Research Board; National Research Council: Washington, DC, USA, 2002; Volume 478, pp. 3–37. [Google Scholar]
  14. Alabama Department of Transportation. Special Provision No. 02-0360-2004—Amendment for Section 424; Alabama Standard Specifications; Alabama Department of Transportation: Montgomery, Alabama, 2004. [Google Scholar]
  15. Georgia Department of Transportation. Special Provision-Section 828—Hot-Mix Asphaltic Concrete Mixtures; Georgia Standard Specifications; Georgia Department of Transportation: Atlanta, GA, USA, 2003.
  16. Leiva, F.; West, R. Analysis of Hot-Mix asphalt lab compactability using lab compaction parameters and mix characteristics. Transp. Res. Rec. J. Transp. Res. Board 2008, 2057, 89–98. [Google Scholar] [CrossRef]
  17. Jiang, X.; Zhang, M.; Xiao, R.; Polaczyk, P.; Bai, Y.; Huang, B. An investigation of structural responses of inverted pavements by numerical approaches considering nonlinear stress-dependent properties of unbound aggregate layer. Constr. Build. Mater. 2021, 303, 124505. [Google Scholar] [CrossRef]
  18. Wang, X.; Shen, S.; Huang, H.; Almeida, L.C. Characterization of particle movement in Superpave gyratory compactor at meso-scale using SmartRock sensors. Constr. Build. Mater. 2018, 175, 206–214. [Google Scholar] [CrossRef]
  19. Wang, X.; Shen, S.; Huang, H.; Zhang, Z. Towards smart compaction: Particle movement characteristics from laboratory to the field. Constr. Build. Mater. 2019, 218, 323–332. [Google Scholar] [CrossRef]
  20. Dan, H.C.; Yang, D.; Liu, X.; Peng, A.P.; Zhang, Z. Experimental investigation on dynamic response of asphalt pavement using SmartRock sensor under vibrating compaction loading. Constr. Build. Mater. 2020, 247, 118592. [Google Scholar] [CrossRef]
  21. Dan, H.C.; Yang, D.; Zhao, L.H.; Wang, S.P.; Zhang, Z. Meso-scale study on compaction characteristics of asphalt mixtures in Superpave gyratory compaction using SmartRock sensors. Constr. Build. Mater. 2020, 262, 120874. [Google Scholar] [CrossRef]
  22. Zhang, C.; Shen, S.; Huang, H.; Wang, L. Estimation of the vehicle speed using cross-correlation algorithms and MEMS wireless sensors. Sensors 2021, 21, 1721. [Google Scholar] [CrossRef] [PubMed]
  23. You, Z.P.; Adhikari, S.; Dai, Q.L. Three-Dimensional Discrete Element Models for Asphalt Mixtures. J. Eng. Mech. 2008, 134, 1053–1063. [Google Scholar] [CrossRef]
  24. Olsson, E.; Jelagin, D.; Partl, M.N. New discrete element framework for modelling asphalt compaction. Road Mater. Pavement Des. 2019, 20, 604–616. [Google Scholar] [CrossRef]
  25. Qian, G.; Hu, K.; Li, J.; Bai, X.; Li, N. Compaction process tracking for asphalt mixture using discrete element method. Constr. Build. Mater. 2020, 235, 117478. [Google Scholar] [CrossRef]
  26. Gong, F.; Zhou, X.; You, Z.; Liu, Y.; Chen, S. Using discrete element models to track movement of coarse aggregates during compaction of asphalt mixture. Constr. Build. Mater. 2018, 189, 338–351. [Google Scholar] [CrossRef]
  27. Guo, H.; Zhao, Y.; Zhang, D.; Shang, M. Study of movement of coarse aggregates in the formation process of asphalt mixture in the laboratory. Constr. Build. Mater. 2016, 111, 743–750. [Google Scholar] [CrossRef] [Green Version]
  28. Liu, Y.; Zhou, X.; You, Z.; Yao, S.; Gong, F.; Wang, H. Discrete element modeling of realistic particle shapes in stone-based mixtures through MATLAB-based imaging process. Constr. Build. Mater. 2017, 143, 169–178. [Google Scholar] [CrossRef]
  29. Chen, J.; Huang, B.; Shu, X.; Hu, C. DEM simulation of laboratory compaction of asphalt mixtures using an open source code. J. Mater. Civ. Eng. 2015, 27, 04014130. [Google Scholar] [CrossRef]
  30. Gong, F.; Liu, Y.; Zhou, X.; You, Z. Lab assessment and discrete element modeling of asphalt mixture during compaction with elongated and flat coarse aggregates. Constr. Build. Mater. 2018, 182, 573–579. [Google Scholar] [CrossRef]
  31. Liu, S.; Huang, H.; Qiu, T.; Kwon, J. Effect of geogrid on railroad ballast particle movement. Transp. Geotech. 2016, 2016, 110–122. [Google Scholar] [CrossRef]
  32. Institute of Highway Science and Ministry of Communications. Technical Specification for Highway Asphalt Pavement Construction; JTG F40-2004; Lancarver: Beijing, China, 2004. [Google Scholar]
  33. Gong, F.; Liu, Y.; You, Z.; Zhou, X. Characterization and evaluation of morphological features for aggregate in asphalt mixture: A review. Constr. Build. Mater. 2021, 273, 121989. [Google Scholar] [CrossRef]
  34. American Society Testing and Materials (ASTM). D5821-3; Standard Test Method for Determining the Percentage of Fractured Particles in Coarse Aggregate; American Society Testing and Materials (ASTM): West Conshohocken, PA, USA, 2017. [Google Scholar]
  35. American Society Testing and Materials (ASTM). D4791-10; Standard Test Method for Flat Particles, Elongated Particles, or Flat and Elongated Particles in Coarse Aggregate; American Society Testing and Materials (ASTM): West Conshohocken, PA, USA, 2017. [Google Scholar]
  36. Tonon, F. Explicit exact formulas for the 3-D tetrahedron inertia tensor in terms of its vertex coordinates. J. Math. Stat. 2004, 1, 8–11. [Google Scholar] [CrossRef]
  37. Elias, J. Simulation of railway ballast using crushable polyhedral particles. Powder Technol. 2014, 264, 458–465. [Google Scholar] [CrossRef]
  38. Xiao, J.; Zhang, X.; Zhang, D.; Geng, X.; Wang, Y. Three-dimensional discrete element simulation of ballast direct shear testing in vibration field. Geotech. Geol. Eng. 2021, 39, 1–13. [Google Scholar] [CrossRef]
  39. Liu, Y.; Dai, Q.; You, Z. Viscoelastic model for discrete element simulation of asphalt mixtures. J. Eng. Mech. 2009, 135, 324–333. [Google Scholar] [CrossRef] [Green Version]
  40. Zhao, S.; Zhou, X. Effects of particle asphericity on the macro- and micro-mechanical behaviors of granular assemblies. Granul. Matter. 2017, 19, 38. [Google Scholar] [CrossRef]
  41. Estrada, N.; Taboada, A.; Radja, F. Shear strength and force transmission in granular media with rolling resistance. Phys. Rev. E 2008, 78, 021301. [Google Scholar] [CrossRef] [PubMed]
  42. Majmudar, T.S.; Behringer, R.P. Contact force measurements and stress-induced anisotropy in granular materials. Nature 2005, 435, 1079–1081. [Google Scholar] [CrossRef] [PubMed]
Figure 1. The SmartRock sensor: (a) dimensions of the shell; (b) the portable signal receiver; (c) the thermal insulation layer.
Processes 10 00047 g001
Figure 2. Gradation curve of the AC-20C mixture.
Processes 10 00047 g002
Figure 3. Superpave gyratory compactor: (a) the compactor; (b) the compaction process.
Processes 10 00047 g003
Figure 4. SmartRocks in SCG specimen: (a) test loaction; (b) after compaction.
Processes 10 00047 g004
Figure 5. Particle reconstruction based on Voronoi tessellation: (a) basic particle shape generation; (b) spindle tension and rotation for shape adjustment; (c) 3D particle shape for simulation.
Processes 10 00047 g005
Figure 6. Clump models.
Processes 10 00047 g006
Figure 7. DEM simulation process: (a) stacked states by gravity; (b) compacted states after gyratory compaction.
Processes 10 00047 g007
Figure 8. Specimen height change comparison between tests and the DEM model.
Processes 10 00047 g008
Figure 9. Particles’ contact stress tested by SmartRock located in (a) upper, (b) middle and (c) bottom positions of the specimen.
Processes 10 00047 g009
Figure 10. Particles’ contact stress (with angular, fractured/elongated and flat shapes) located in the mid-layer, tracked by DEM.
Processes 10 00047 g010
Figure 11. Normal contact force distribution under different compaction cycles: (a) 2 cycles; (b) 50 cycles; (c) 80 cycles; (d) 110 cycles.
Processes 10 00047 g011
Figure 12. The evolution of the probability distribution function (PDF) for normalized normal contact force fn/<fn> with 2 and 110 compaction cycles.
Processes 10 00047 g012
Figure 13. 3D spherical histogram of local average normal contact force f n ¯ under different gyratory compaction cycle: (a) in front view; (b) in vertical view.
Processes 10 00047 g013
Table 1. Parameters of the SmartRock for stress conversion.
SensorDirectionabcU0
R1x−0.047710.09367−0.71782.28
y−0.053770.127−1.1372.3
z−0.061230.06668−0.69242.38
R2x−0.044−0.065090.041852.32
y−0.05006−0.06509−0.084481.86
z−0.05262−0.02223−0.39592.04
R3x−0.053480.09208−0.66092.3
y−0.06735−0.02064−0.41562.44
z−0.052270.003175−0.42392
Table 2. Technical indicators of coarse aggregate.
ParameterValueRequirement
Crushing Value (%)23.5≤28%
Needle Content (%)12.5≤15%
Fine-grained < 0.075 Content (%)0.7≤1.0%
Adhesion5≥4
Table 3. Technical indicators of filler.
ParameterValueRequirement
Apparent Density (g/cm3)2.705≥2.50
Moisture Content (%)0.4≤1
Particle Size < 0.6 mm (%)
Particle Size < 0.15 mm (%)
Particle Size < 0.075 mm (%)
100
93.2
87.5
100
90~100
85~100
MorphologyNo agglomerationsNo agglomerations
Hydrophilic Coefficient0.81<1.0
Table 4. Technical indicators of bituminous binder.
ParameterRequirementValue
Penetration (25 °C, 100 g, 5 s) (0.01 cm)40~6050
Ductility (5 cm/min, 5 °C) (cm)≥2034
Softening Point (5 °C)≥6079.5
Density (25 °C) (g/cm3)-1.031
Table 5. Production mixing ratio of the AC-20 mixture.
0–33–55–1010–1515–25Mineral
Powder
Bituminous Binder
27 (%)10 (%)19 (%)15 (%)26 (%)3 (%)4.2 (%)
Table 6. Summary of the volumetric and mechanical parameters of the AC-20 asphalt mixture.
ParameterValueRequirement
Void Ratio (%)4.43–6
VMA (%)13.4≥13.0
VFA (%)67.265–75
MLS (kN)11.1≥8.0
Flow Value (0.1 mm)33.620–40
Residual Stability (%)91.5≥85
TSR (%)87.9≥80
Dynamic Stability (cycle/mm)6585≥3500
Table 7. Meso-parameters of DEM model.
Contact ObjectsModulus (Pa)Friction
Aggregate5.5 × 1070.36
Asphalt Binder2.0 × 1070.2
Mold/Plate1.0 × 1090.15
Publisher’s Note: MDPI stays neutral with regard to jurisdictional claims in published maps and institutional affiliations.

