Article

Numerical Description of Jet and Duct Ventilation in Underground Garage after LPG Dispersion

by
Zdzislaw Salamonowicz
1,
Malgorzata Majder-Lopatka
2,
Anna Dmochowska
1,
Aleksandra Piechota-Polanczyk
3 and
Andrzej Polanczyk
1,*
1
Faculty of Safety Engineering and Civil Protection, The Main School of Fire Service, 52/54 Slowackiego Street, 01-629 Warsaw, Poland
2
Institute of Safety Engineering, The Main School of Fire Service, 52/54 Slowackiego Street, 01-629 Warsaw, Poland
3
Department of Medical Biotechnology, Faculty of Biochemistry, Biophysics and Biotechnology, Jagiellonian University, Gronostajowa 7 Street, 30-387 Krakow, Poland
*
Author to whom correspondence should be addressed.
Processes 2022, 10(1), 53; https://doi.org/10.3390/pr10010053
Submission received: 13 October 2021 / Revised: 20 December 2021 / Accepted: 21 December 2021 / Published: 28 December 2021

Abstract

:
Contamination of toxic and odorous gases emitted from stacks in buildings located in an urban environment are potential health hazards to citizens. A simulation using the computational fluid dynamic technique may provide detailed data on the flammable region and spatial dispersion of released gases. Concentrations or emissions associated with garage sources and garage-to-house migration rates are needed to estimate potential exposures and risk levels. Therefore, the aim of the study was to use an original mathematical model to predict the most accurate locations for LPG sensors in an underground garage for vehicles powered with LPG. First, the three-dimensional geometry of an underground garage under a multi-family building was reconstructed. Next, two types of ventilation, jet and duct, were considered, and different sources of LPG leakage were assumed. Then, the Ansys Fluent software was applied as a solver, and the same initial value of released LPG (5 kg) was assumed. As a simplification, and to avoid the simulation of choked outflow, the emission from a large area was adopted. The results showed stagnation areas for duct ventilation in which gas remained for both the jet and duct ventilation. Moreover, it was observed that the analyzed gas would gather in the depressions of the ground in the underground garage, for example in drain grates, which may create a hazardous zone for the users of the facility. Additionally, it was observed that for jet ventilation, turbulence appearance sometimes generated differentiated gas in an undesirable direction. The simulation also showed that for blowing ventilation around the garage, and for higher LPG leakage, a higher cloud of gas that increased probability of ignition and LPG explosion was formed. Meanwhile, for jet ventilation, a very low concentration of LPG in the garage was noticed. After 35 s, LPG concentration was lower than the upper explosive limit. Therefore, during the LPG leakage in an underground garage, jet ventilation was more efficient in decreasing LPG gas to the non-explosive values.

1. Introduction

Residential and public buildings equipped with underground garages are becoming increasingly popular in cities all over the world. The main problem of these constructions is related to insufficient ventilation systems [1]. Therefore, the evaluation of air distribution for these types of buildings is necessary to develop and offer new solutions that are able to provide the desired thermal comfort and, at the same time, will meet the building energy requirements [2,3]. The adequate air exchange rate should be provided to ensure the safety of users during the normal operation of the facility. The gas emissions depend on the garage location and its usage profile [4]. High concentrations of volatile organic compounds (VOCs) present in garages are often due to emissions of fumes by vehicles [5]. Also, combustion products from the fire are harmful to the respiratory system and eyes and, in extreme cases, may lead to death [6,7]. Therefore, to keep the concentration of carbon dioxide at a lower level, it is necessary to supply some fresh air flow to the garage [8]. For this reason, enclosed parking garages require mechanical ventilation, which contributes to energy use and peak electricity demand [9], and therefore, proper localization of fans at the building design stage is required.
Understanding contamination with toxic and odorous gases emitted from stacks on a building in an urban environment is critical for maintaining good air quality and a low level of threat of combustion to citizens and firefighters [10]. It was experimentally estimated by Buckland that the maximum explosion pressure should not exceed 21 kPa for an average room-sized structure filled with an explosible gas mixture [11]. Moreover, Huo et al. observed that the minimum amount of liquefied petroleum gas (LPG) required to generate 21 kPa in an empty garage with volume equal to 200 m3 is 3 kg [12]. This minimum amount is less than 3 kg if the net free space is substantially less than 200 m3 due to the presence of objects in a garage [12]. For this reason, the transient gas explosion pressure has to be better understood to protect people and firefighters during life-threatening operations [13,14].
Different mathematical models have been developed to design ventilation systems in order to improve indoor air quality [15,16]. To assist decision making and planning of the placement of hazardous gas tanks, computational tools are applied [17,18]. Calculations may be performed analytically, using physical equations or by the implementation of those equations into dedicated software to receive many important parameters [19]. Various computational tools are applied for the description of the dispersion process, i.e., Phast software [20], Aloha software [21], Ansys software [22] and FDS [23]. The computer programs available at the moment are based on two types of models: zone models (single or multi-zone) or more complex field models, which require high computing power [24]. For instance, computational fluid dynamics (CFD) is a useful tool to estimate the hazardous zones after the release of flammable gases [12]. This approach uses Navier-Stokes equations for CFD modeling, consisting of a set of non-linear mass conservation equations to estimate pressure distributions in each zone and calculate the airflow through the zones [25]. A simulation using CFD techniques can provide detailed data on the flammable region and the spatial dispersion [26]. Concentrations or emissions associated with garage sources and garage-to-house migration rates are needed to estimate potential exposure rates and health risks. Therefore, the aim of the study was to predict the most useful locations of LPG sensors for vehicles powered with LPG with the use of an original mathematical model.
The paper is organized as follows: In Section 2, a description of the analyzed case study as well as material and methods applied in the research are presented. In Section 3, the results of numerical simulations and a discussion are presented. Section 4 concludes the manuscript.

2. Materials and Methods
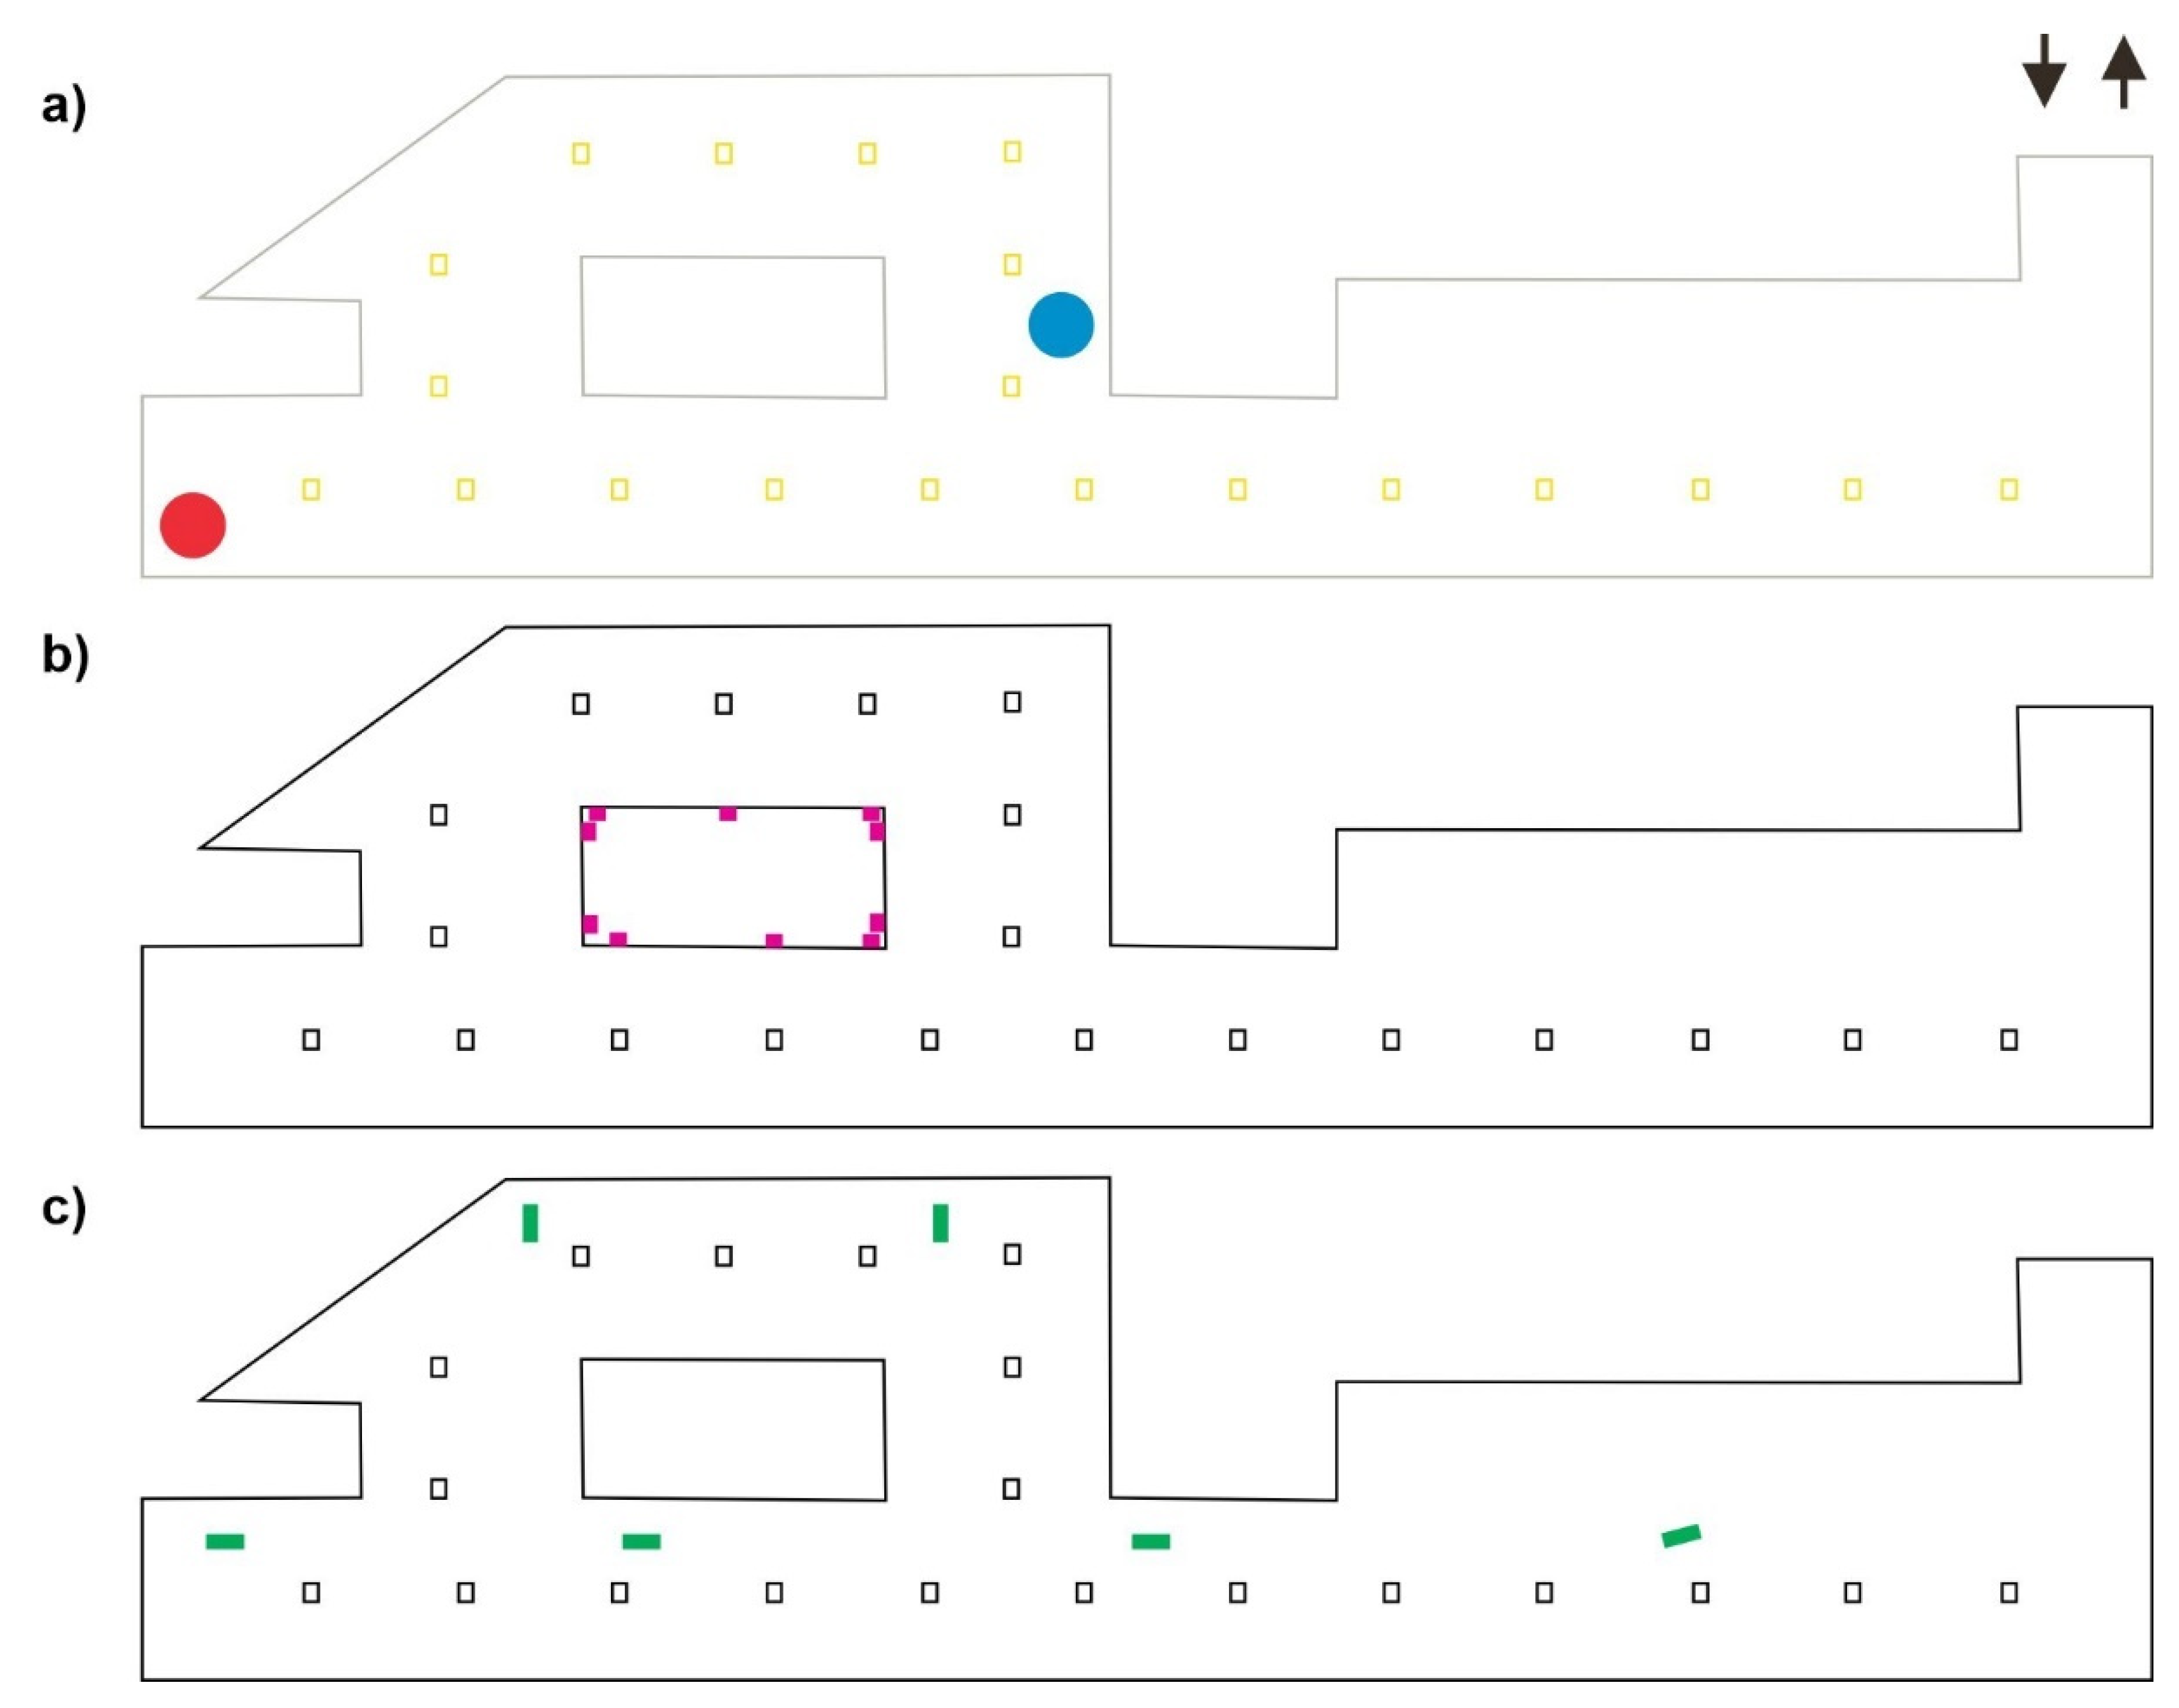
2.1. Case Study

In our study, we investigated two types of ventilation systems (duct ventilation [27] and jet ventilation [28]) in a designed underground garage under a multi-family building. The dimensions of the mathematical domain were chosen based on an actual architectural plan (Figure 1). The length of the analyzed garage was equal to 110 m, height was equal to 2.8 m, and 20 pillars were located inside. There was only one vehicle exit (width equal to 7.5 m), which was also a garage entry, and it acted as an air outlet.
Two types of ventilation, jet (Figure 2) and duct (Figure 3), were considered. The total area of the air outlet from the garage was equal to 17.25 m2, and ten air diffusers were mounted for duct ventilation. The total area of the air inlet for duct ventilation was equal to 2.4 m2. The jet ventilation was composed of six jet-type fans with a cylindrical shape and total length equal to 2 m. Two locations of the leakage source from the defective vehicle’s tank powered with LPG fuel were considered (Figure 1). One source of leakage was in the left garage corner and marked with a red circle (called “A source”), while the second source of leakage was located in the middle and marked with a blue circle (called “B source”) (Figure 1a). When designing a garage with a duct ventilation system, one had to design diffusers that were localized in the middle of the garage in the part of the building with elevators and the entrance to the staircase. However, for a garage with a jet ventilation system, the air supply side was in the wall opposite to the exit gate.

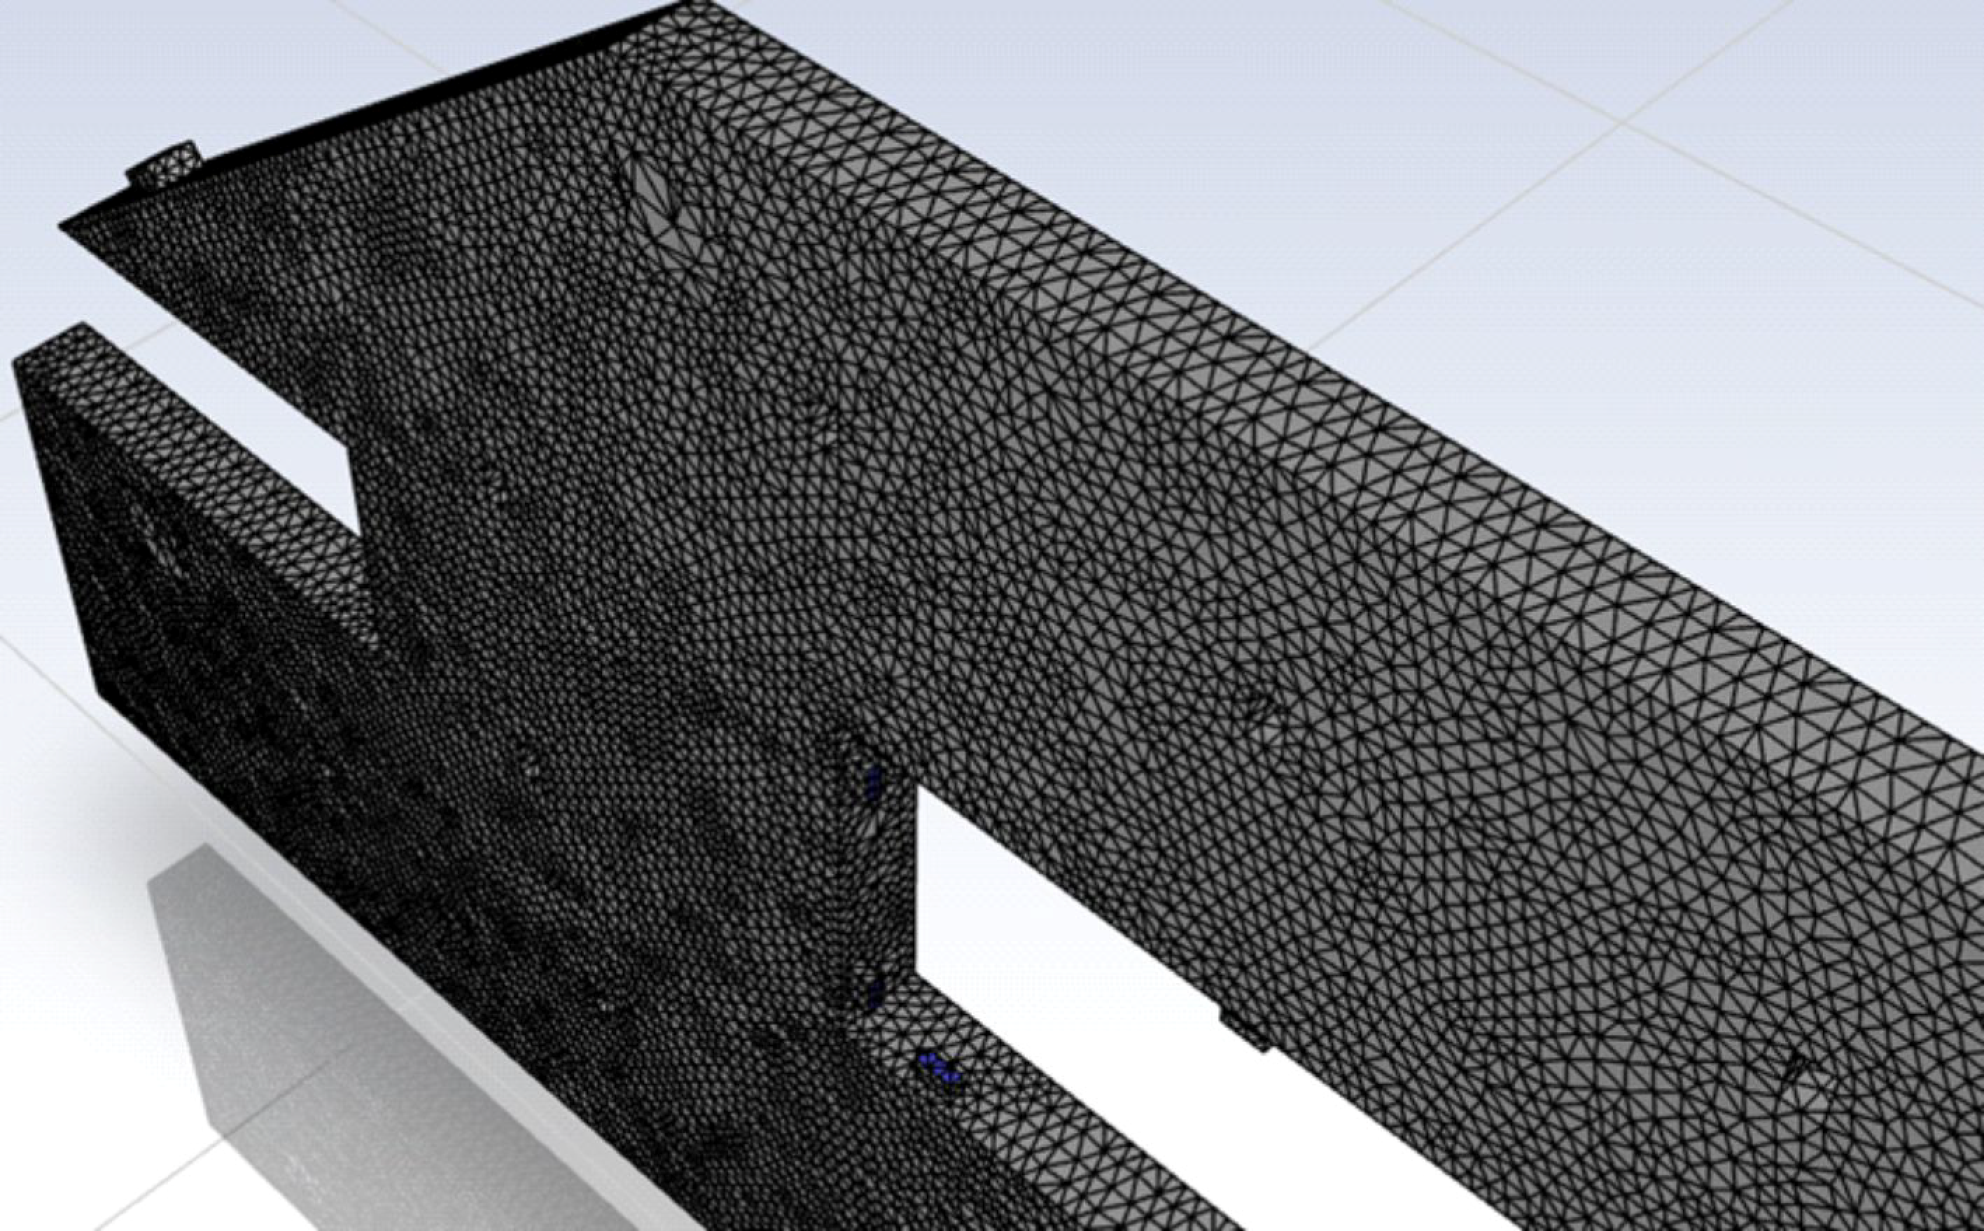
2.2. Numerical Model

The purpose of our study was to analyze the risk posed by a vehicle with a damaged LPG tank that was left in the underground garage. A numerical description of the garage ventilation process was described with the use of the CFD technique. Numerical analysis was performed with the use of Reynolds Averaged Navier-Stokes equations (Equations (1)–(4)) implemented into Ansys Fluent software (ANSYS, Canonsburg, PA, USA) [29]. The system was considered as compressible [30]. The SIMPLE algorithm was used for pressure velocity coupling. Moreover, the pressure was described with a second-order interpolation, and second-order discretization schemes were used for both the convection terms and the viscous terms of the governing equations.
( v x t + v x v x x + v y v x y + v z v x z ) = ρ g x p x + x ( ( μ + μ t ) ( 2 v x x ) ) + y ( ( μ + μ t ) ( v z y + v y x ) ) + z ( ( μ + μ t ) ( v x z + v z x ) )
ρ ( v y t + v x v y x + v y v y y + v z v y z ) = ρ g y p y + x ( ( μ + μ t ) ( v y x + v x y ) ) + y ( ( μ + μ t ) ( 2 v y y ) ) + z ( ( μ + μ t ) ( v y z + v z y ) )
ρ ( v z t + v x v z x + v y v z y y + v z v z z ) = ρ g z p z + x ( ( μ + μ t ) ( v z x + v x z ) ) + y ( ( μ + μ t ) ( v z y + v y z ) ) + z ( ( μ + μ t ) ( v z z ) )
x ( ρ h ) + · ( v ρ h ) = · ( k T ) + S h
with:
vx, vy, vz—velocity components for x, y, z directions, [m/s];
t—time [s]; g—acceleration in x, y, z direction, [m2/s];
µ—fluid viscosity, [Pa s];
ρ—fluid density, [kg/m3];
µt—turbulent viscosity, [Pa s];
h—enthalpy;
k—conductivity;
T—temperature;
Sh—heat source.
In this work, the kε model was used to represent the effects of turbulence [31]. The kinetic energy was estimated with Equation (5) and dissipation rate with Equation (6), while turbulent viscosity was calculated by Equation (7).
k = 1 2 i = 1 3 ( v i 2 ) ¯
with:
v—kinetic viscosity.
ε = ( 2 μ t ρ ) s i j s i i
with:
S—Reynold’s stress;
ρ—density.
μ t = ρ C μ k 2 ε
with:
Cµ = 0.09.
A change in the density was described by a perfect gas (Equation (8)) and the averaged molecular weight of the gas mixture ingredients (Equation (9)). The enthalpy was calculated by Equation (10).
p = ρ R T M a v g
M a v g = 1 Y i M i
with:
p—pressure, [Pa];
R—gas constant, [J/mol K];
T—temperature, [K];
Yi—volume concentration of i-th species;
Mi—molar mass of the i-th species.
h = T 0 T c p d T
with:
cp—specific heat capacity, [J/kg K];
Mixture density was calculated with the use of Equation (11).
ρ m = i = 1 N α i ρ i
Moreover, the “species transport and finite elements chemistry” of the Ansys Fluent option without reaction between mixed gases was selected for modeling of the air LPG mixture (Equation (12)).
( ρ Y i ) t + ( ρ Y i u ) = ( ρ D i Y i ) + m ˙ i
with:
Di—the dispersion coefficient of i-th species.
First, a 3D model of the analyzed mathematical domain was prepared with the use of SpaceClaim Ansys software (Ansys, Canonsburg, PA, USA). Next, with the use of Ansys ICEM software (Ansys, Canonsburg, PA USA), a numerical mesh was generated. Initially, mesh independent testing was performed for differently sized grid elements. The tested range of elements for the whole analyzed domain was equal to 0.1–0.2 m (with a slope equal to 0.05 m), decreasing the size of elements to 0.1 m around the wall. It was observed that when the elements size was equal to 0.2 m and 0.15 m, errors appeared when the model was started (Table 1). However, for the meshes composed of smaller elements (0.15 m and 0.1 m), the CFD model presented converged results. Thus, to minimize the size of the numerical grid and the time of calculations, the final mesh consisted of 5,00,000 tetrahedral elements and was composed of elements with a size equal to 0.05 m for the areas where the greatest gradients of analyzed parameters were expected (Figure 4). These assumptions were performed, e.g., for the pillar areas.
Finally, the size of the applied elements was approximately equal to 0.1 m, while in the areas where the greatest gradients of analyzed parameters were expected, the elements’ size was equal to 0.05 m.
A solver in the Ansys Fluent software (Ansys, Canonsburg, PA USA) was composed of a SIMPLE algorithm for pressure velocity coupling, second-order pressure interpolation and second-order discretization schemes. A no-slip boundary condition was enforced at the walls. Moreover, a standard k–ε model was used because of its balance between computational time and precision [32]. This model was successfully applied by others for numerical simulations of LNG vapor dispersion and other gas dispersions with satisfactory results [33,34]. For jet and duct ventilation simulation, different sources of LPG leakage were assumed, and the same initial value of 5 kg of released LPG for both analyzed cases was used (flow rate for the emission was set to 1.38 × 10⁻³ kg/s). As a simplification, the emission from a large area was adopted, with which we avoided the simulation of choked outflow.
Additionally, it was assumed that the ventilation system for both analyzed cases was active. The following boundary conditions were applied: (1) top (ceiling), bottom (floor) and side surfaces (side walls and side surface of pillars) were treated as walls, where the derivative of the velocity normal to the surface was zero; (2) for duct ventilation 10 diffusers with a flow rate equal to 30 m3/h for each one were used; (3) for jet ventilation 6 fans with a capacity equal to 100 m3/h for each one were used; (4) the garage gate was treated as the outlet, and the outlet boundary was set; (5) the release of the analyzed substance was described with a constant stream of a given gas in a direction normal to the surface.
For the prepared CFD model, the following assumptions were made: (1) the simulation was considered as transient; (2) each time numerical simulation was performed until the concentration of LPG was not higher than the lower explosive limit of 2% of LPG in the air; (3) the time of hazardous substance release was equal to 10 s. Results were presented as iso-surfaces with assigned values for the lower explosive limit (LEL) and upper explosive limit (UEL), respectively. Moreover, transient results illustrated LPG distribution as a function of time.

3. Results and Discussion

In the design and construction of ventilation systems, an energy efficient air distribution method is a crucial element [35]. In this chapter, duct and jet ventilation systems were analyzed. Two locations of LPG leakage were considered, and a 10 s leakage of LPG was considered.

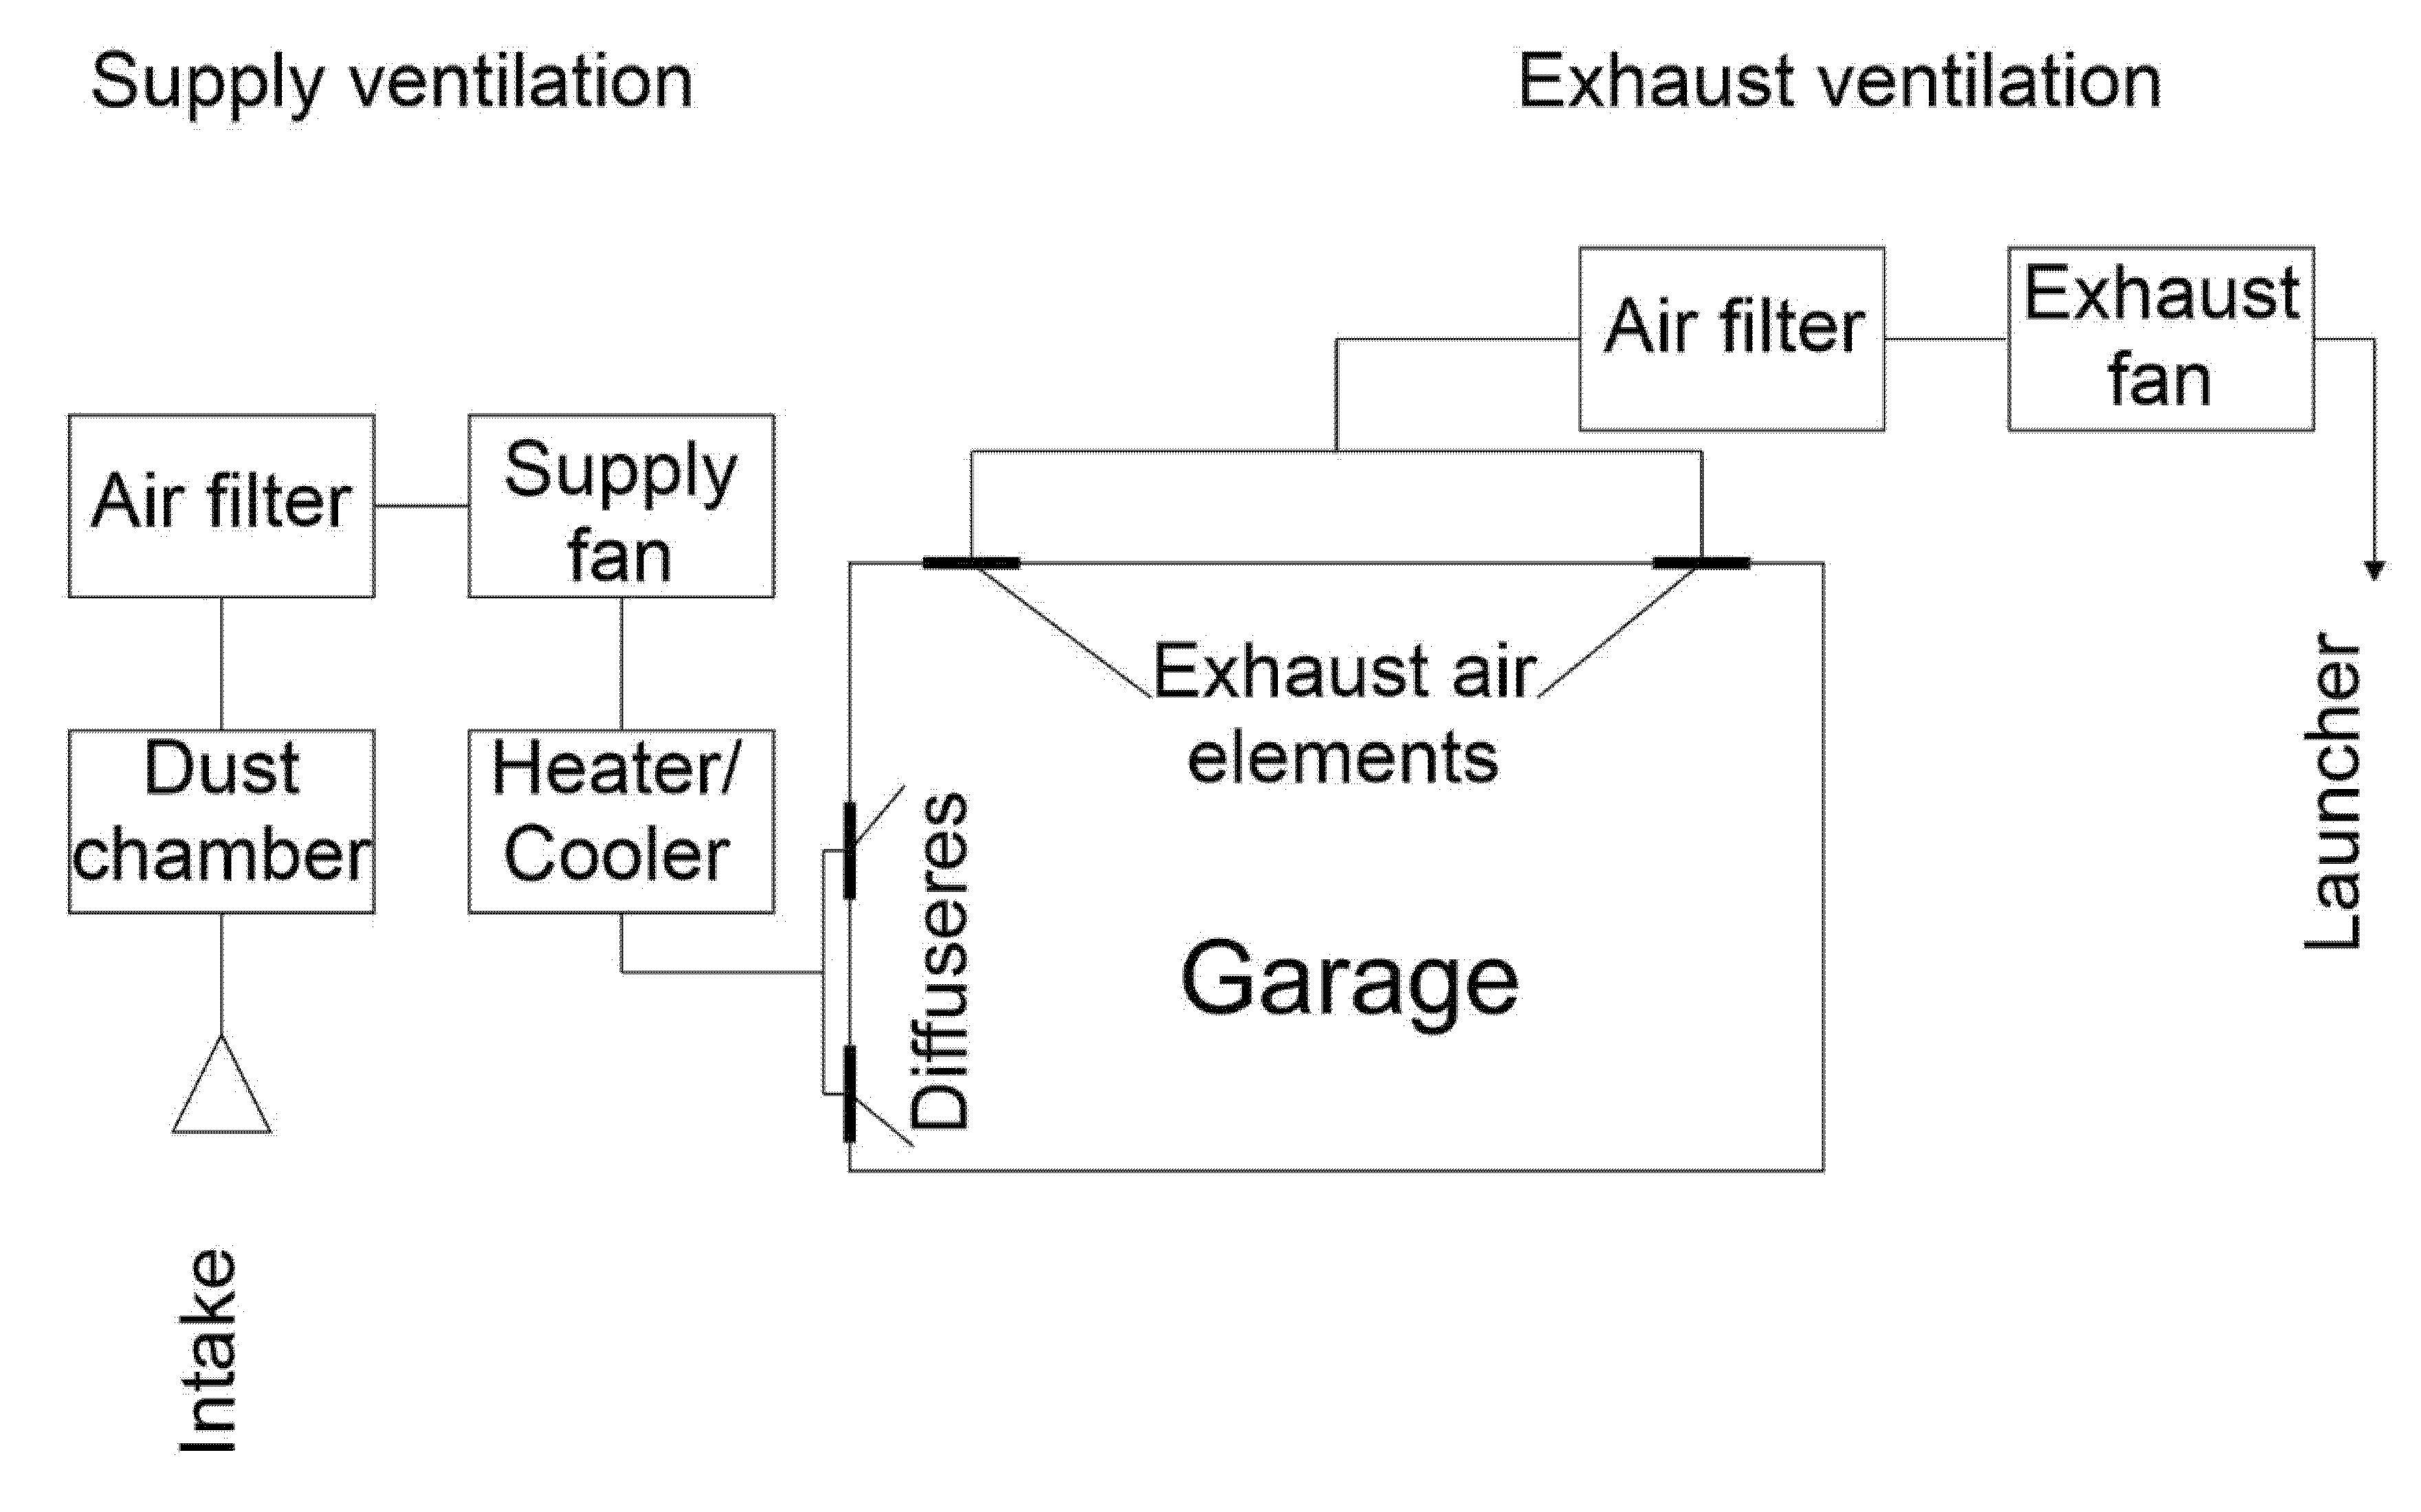
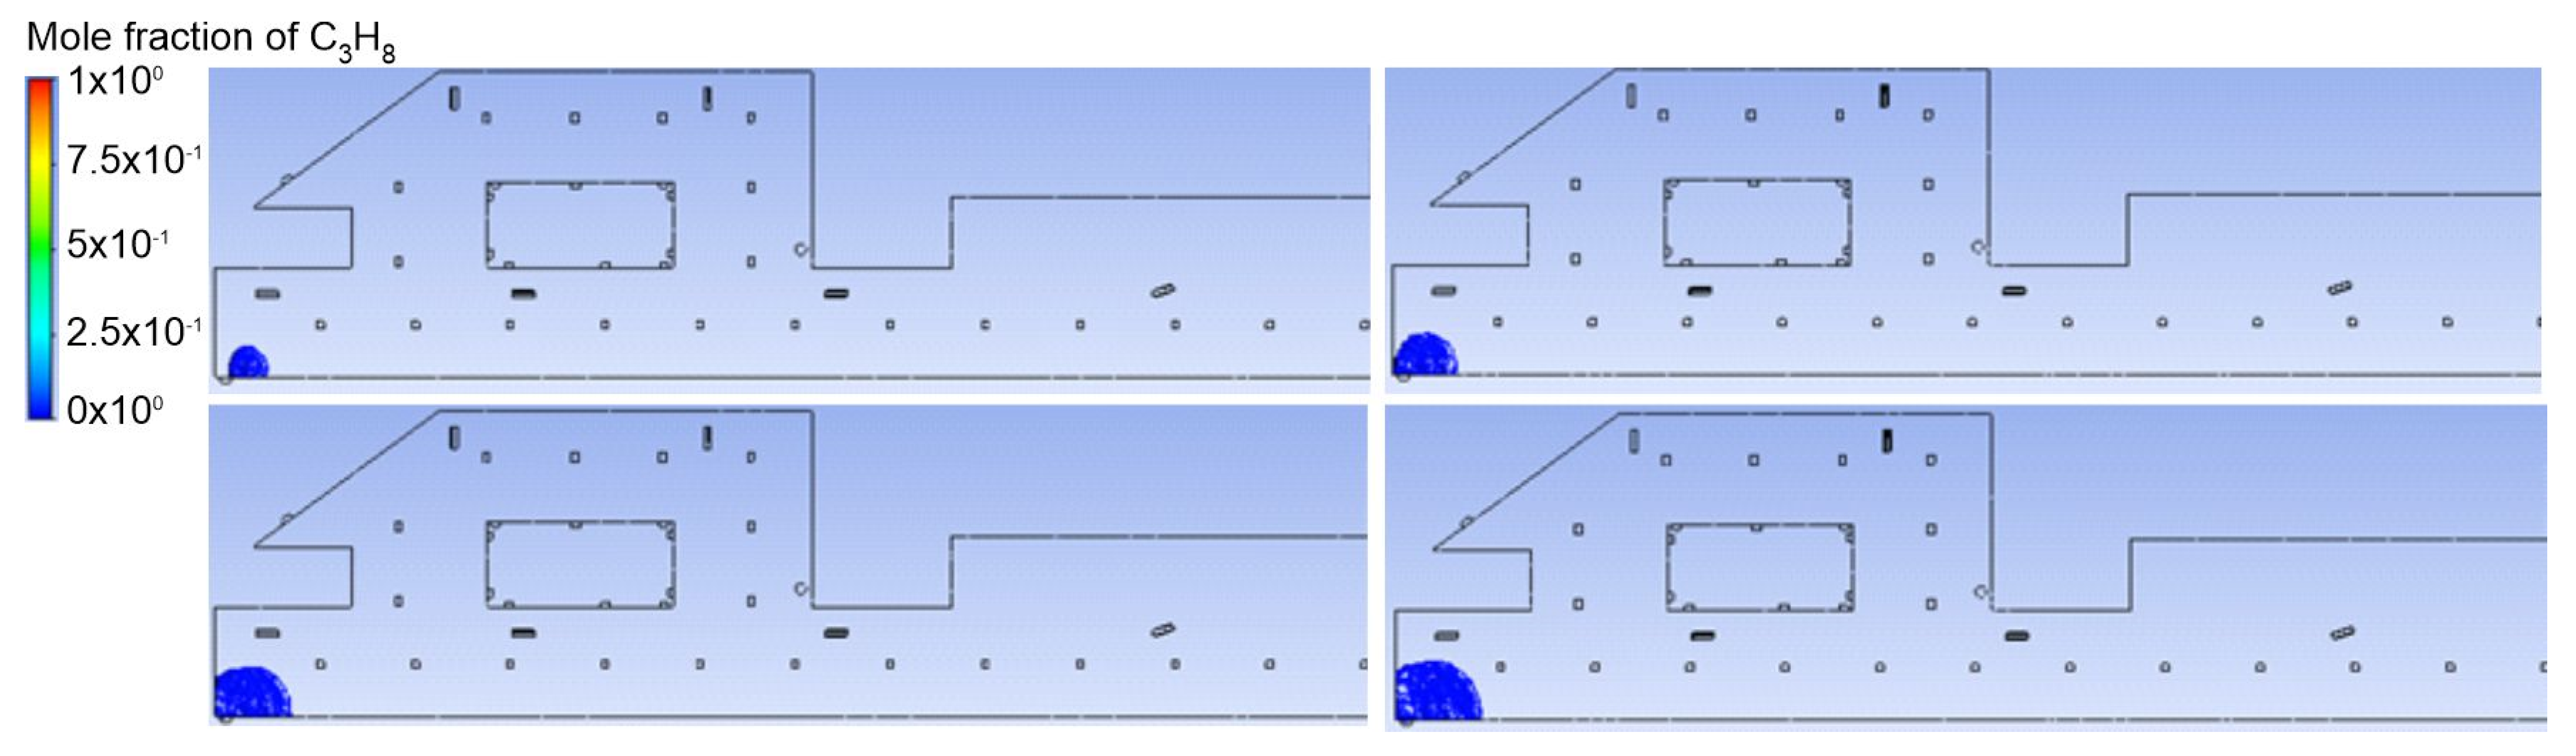
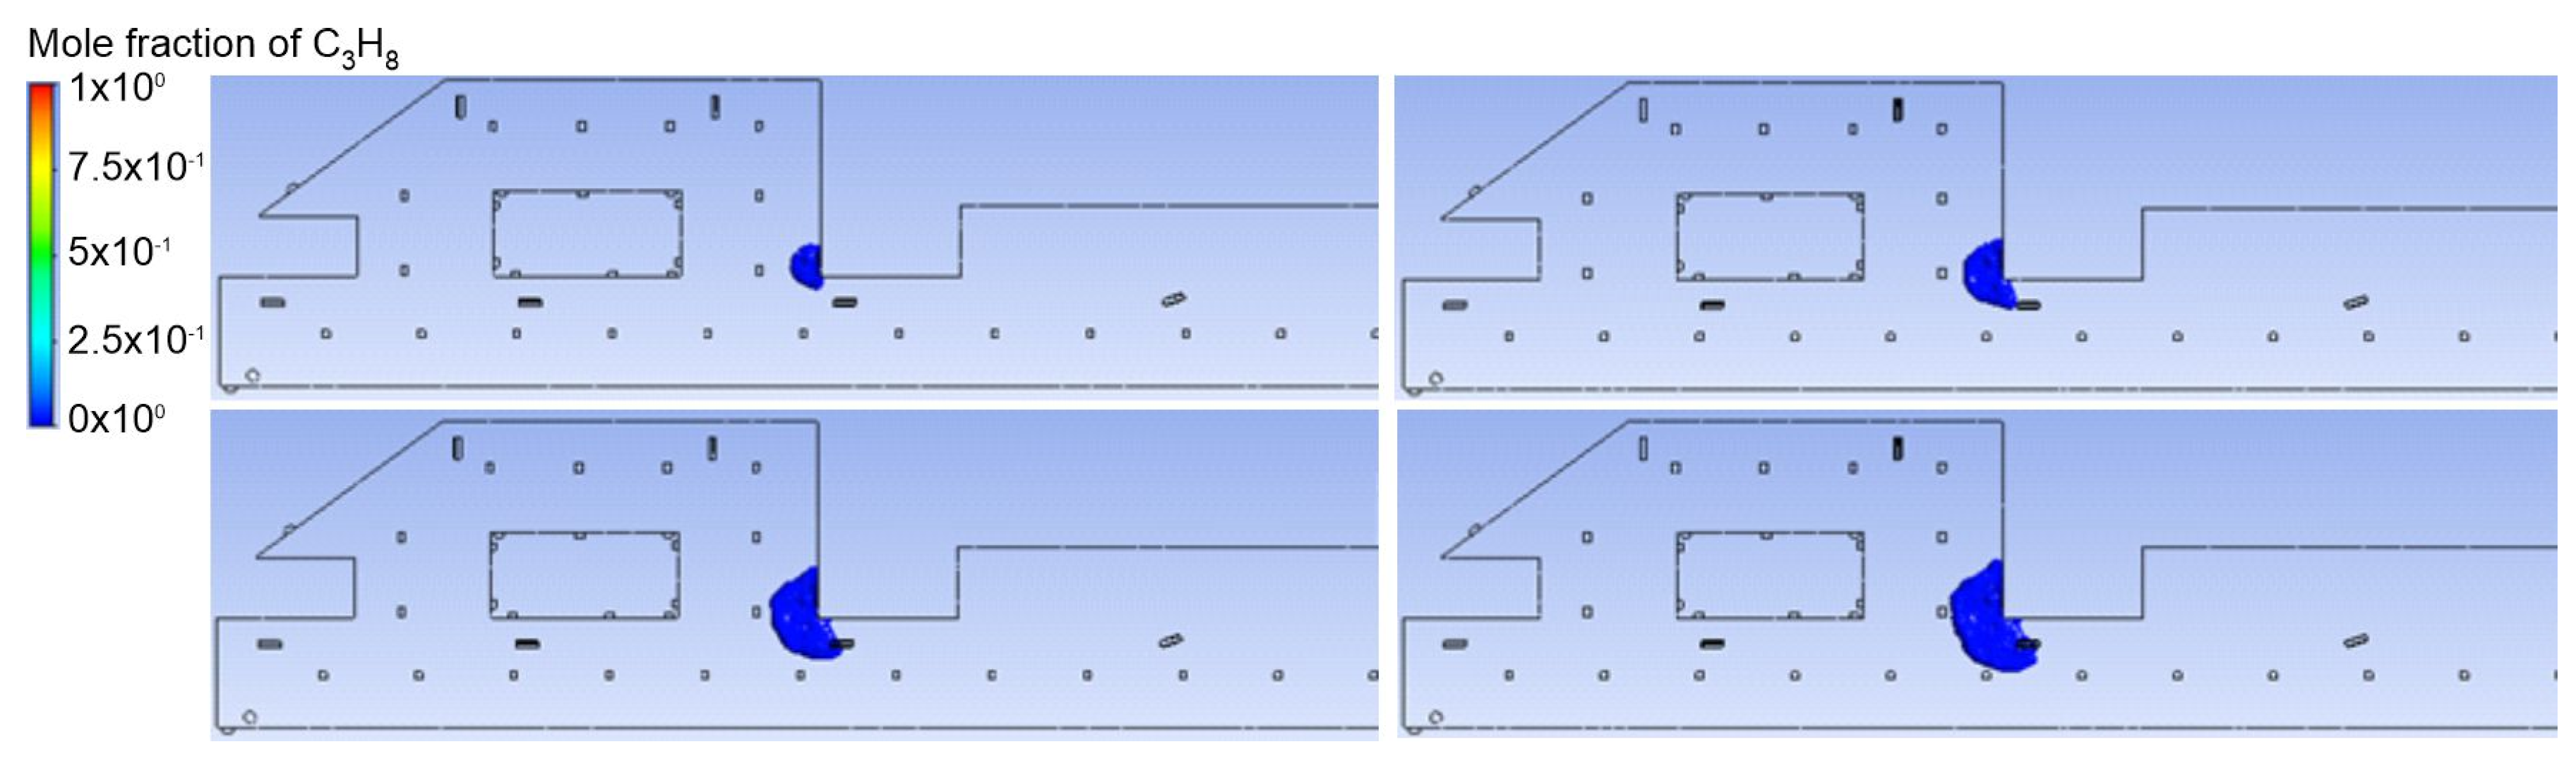
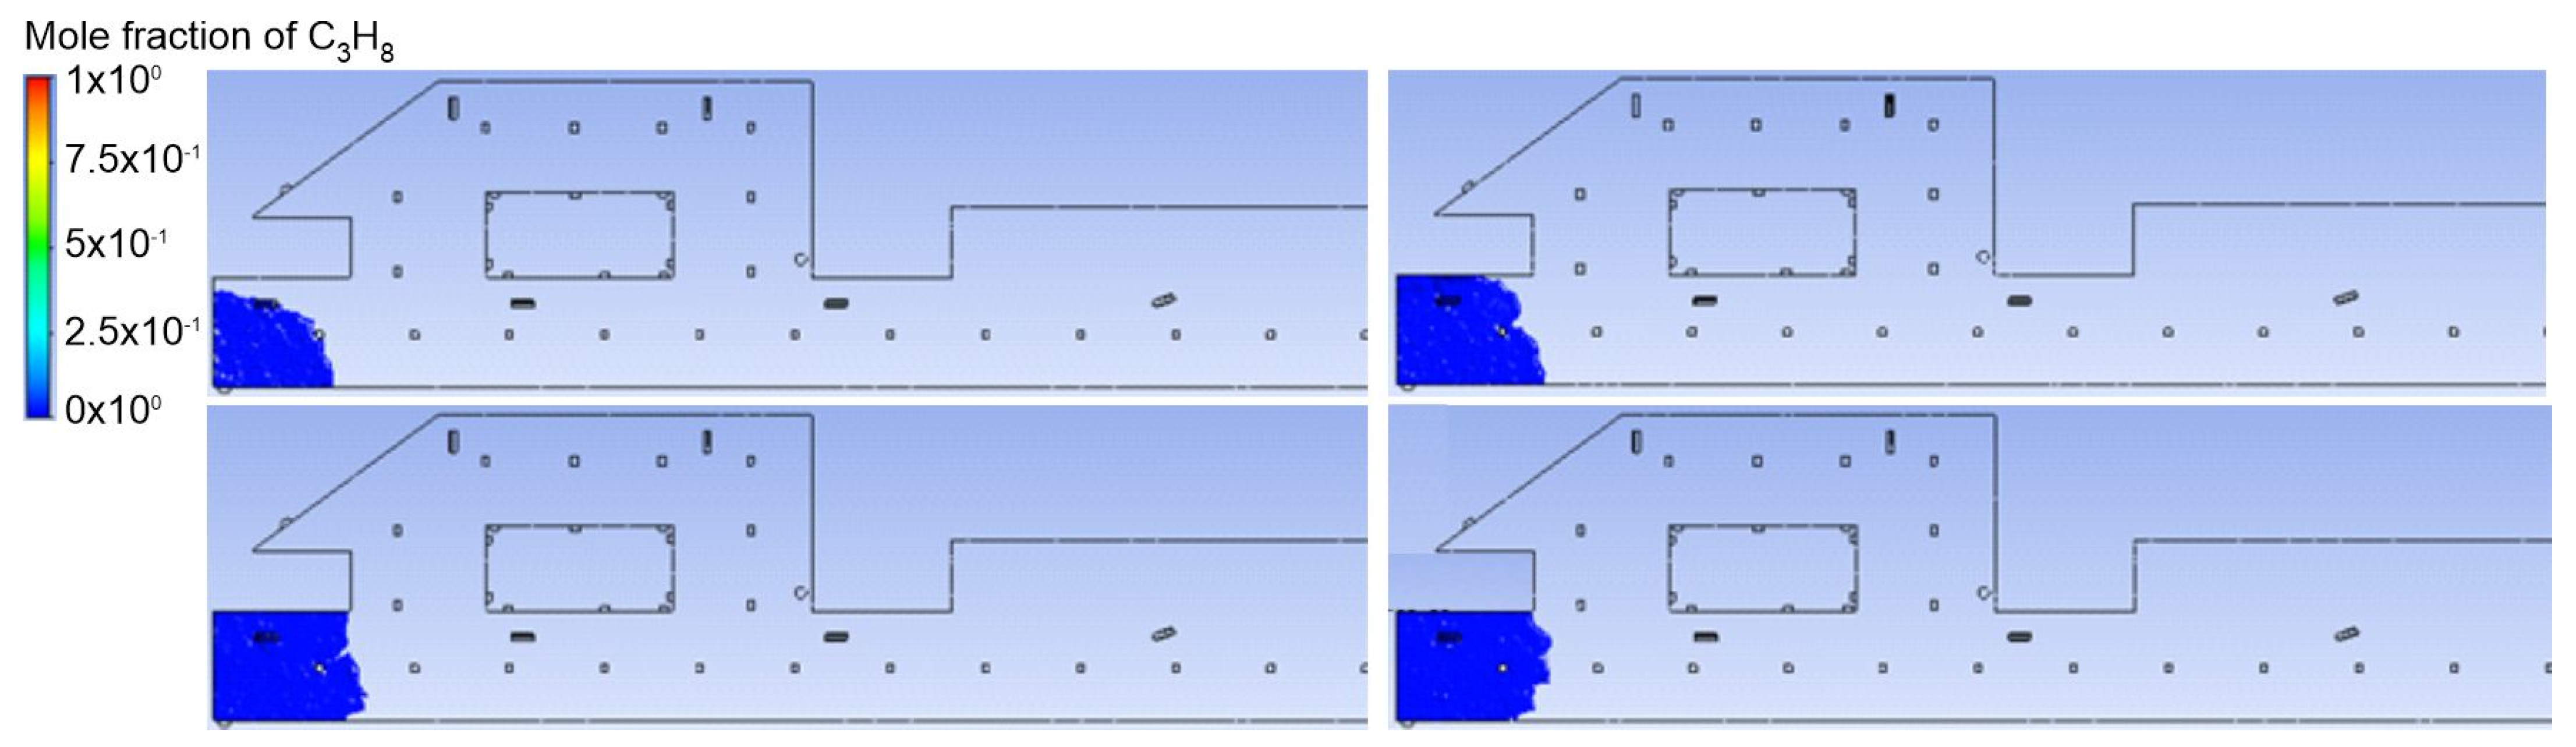
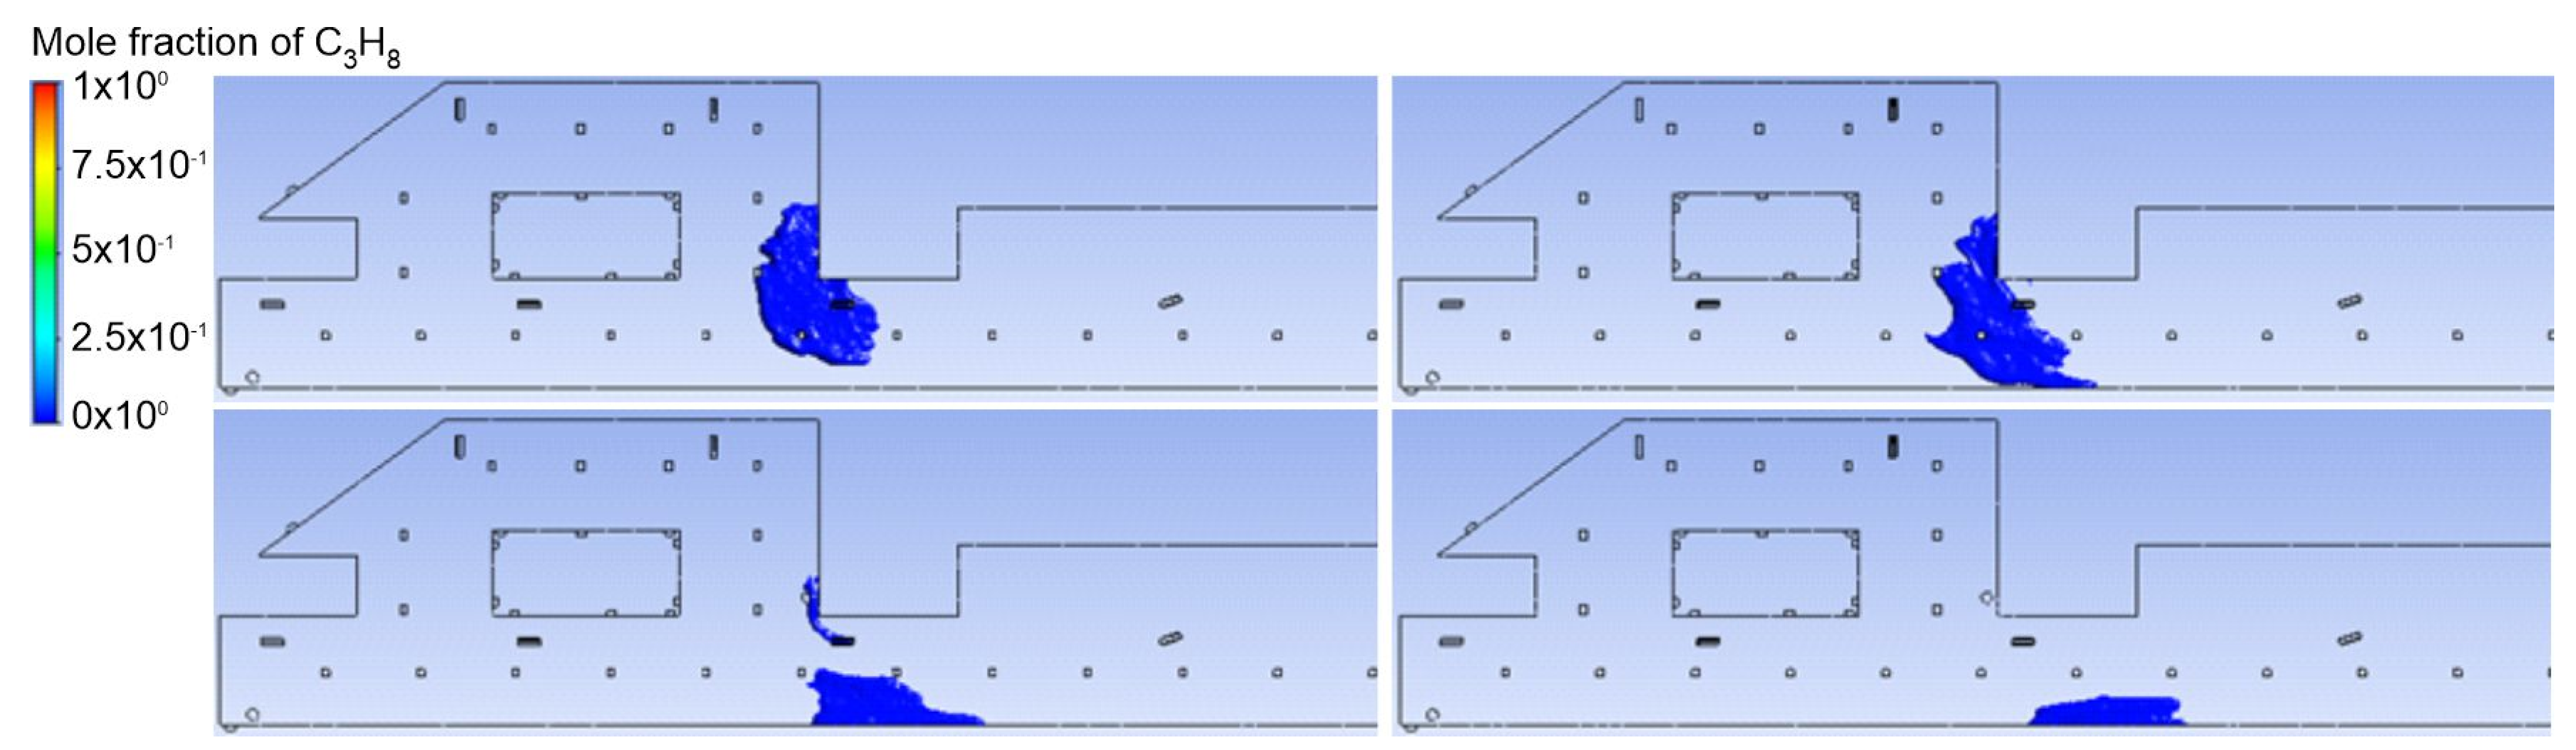
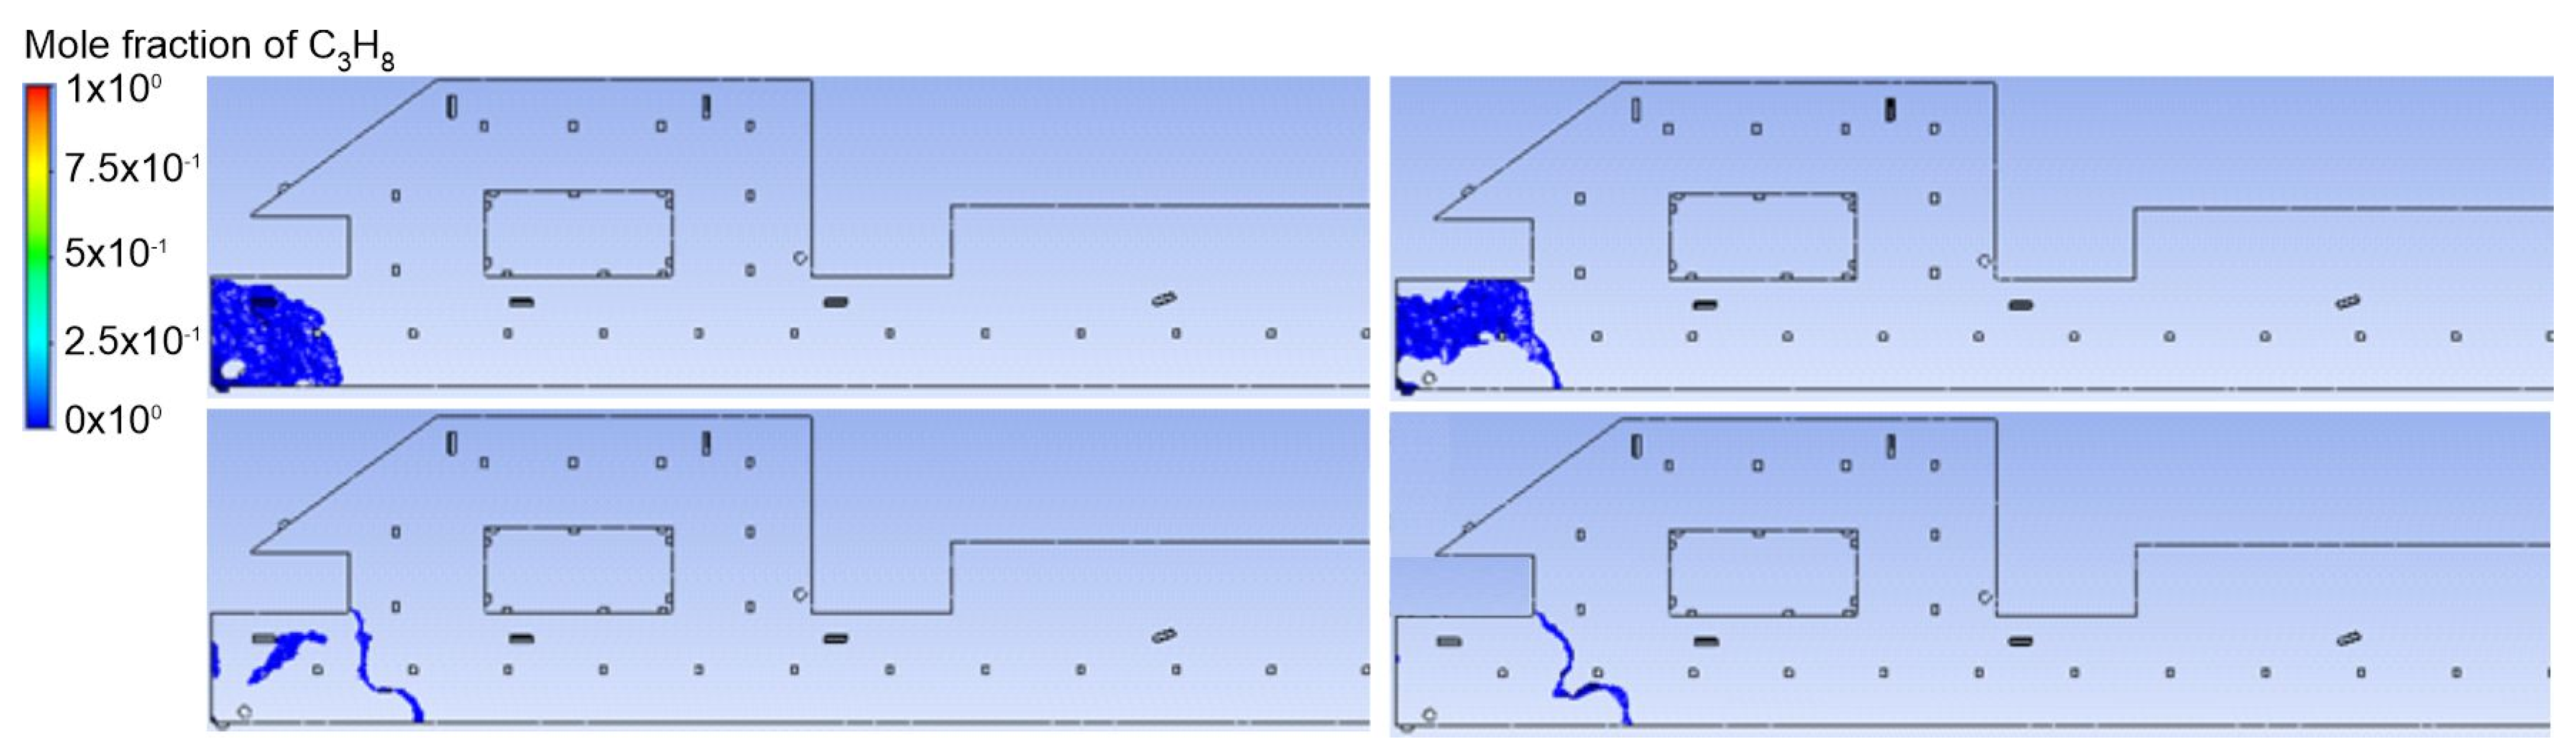
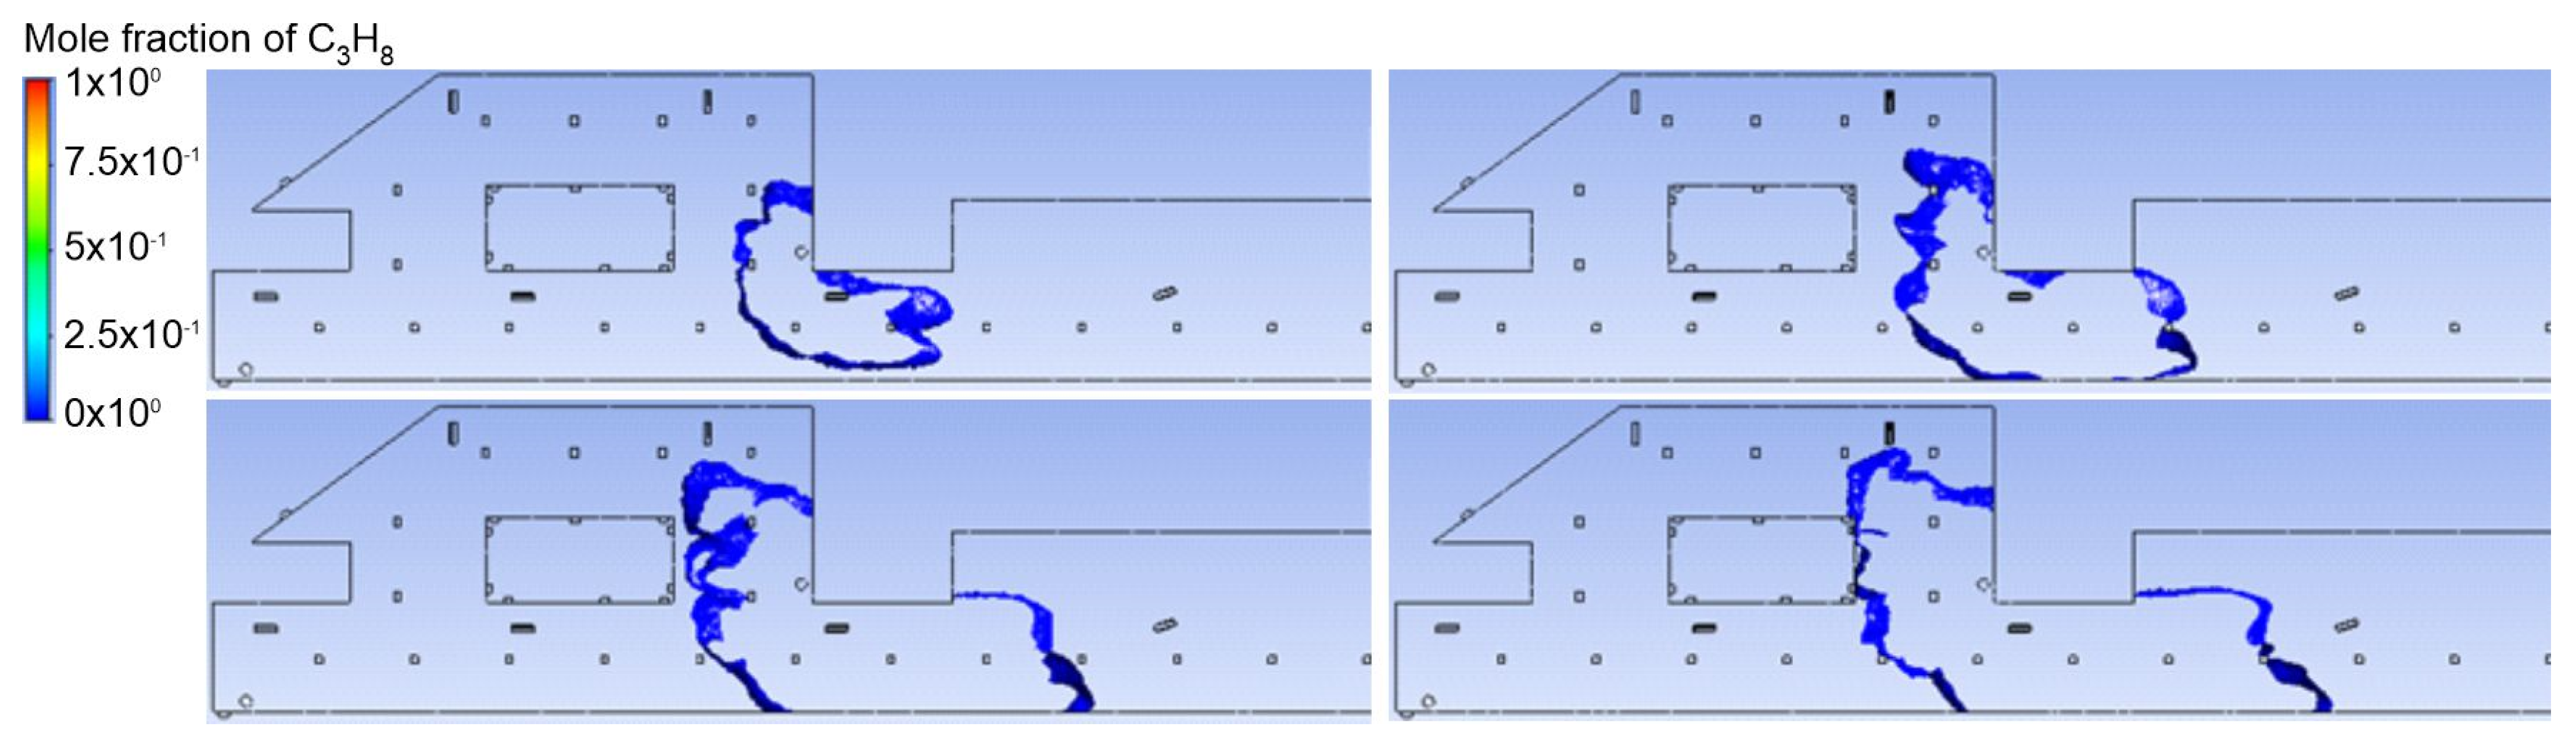
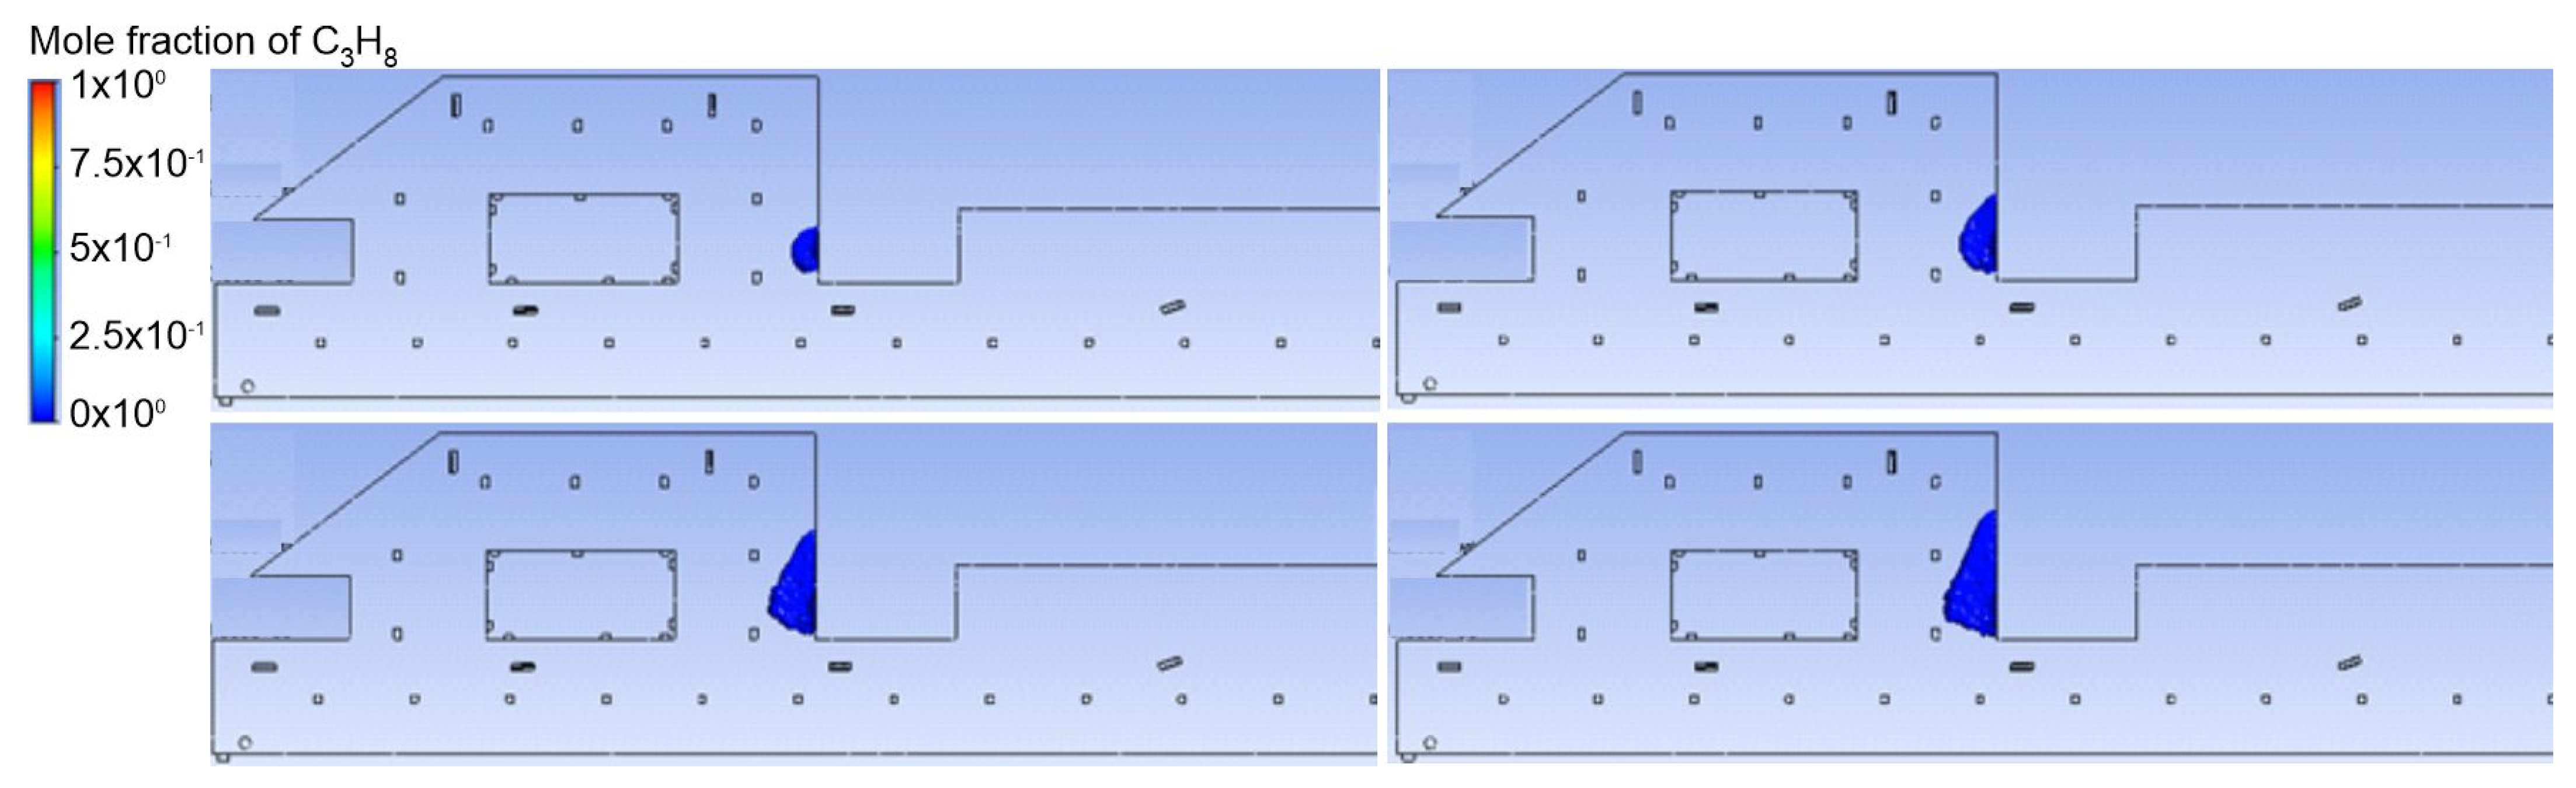
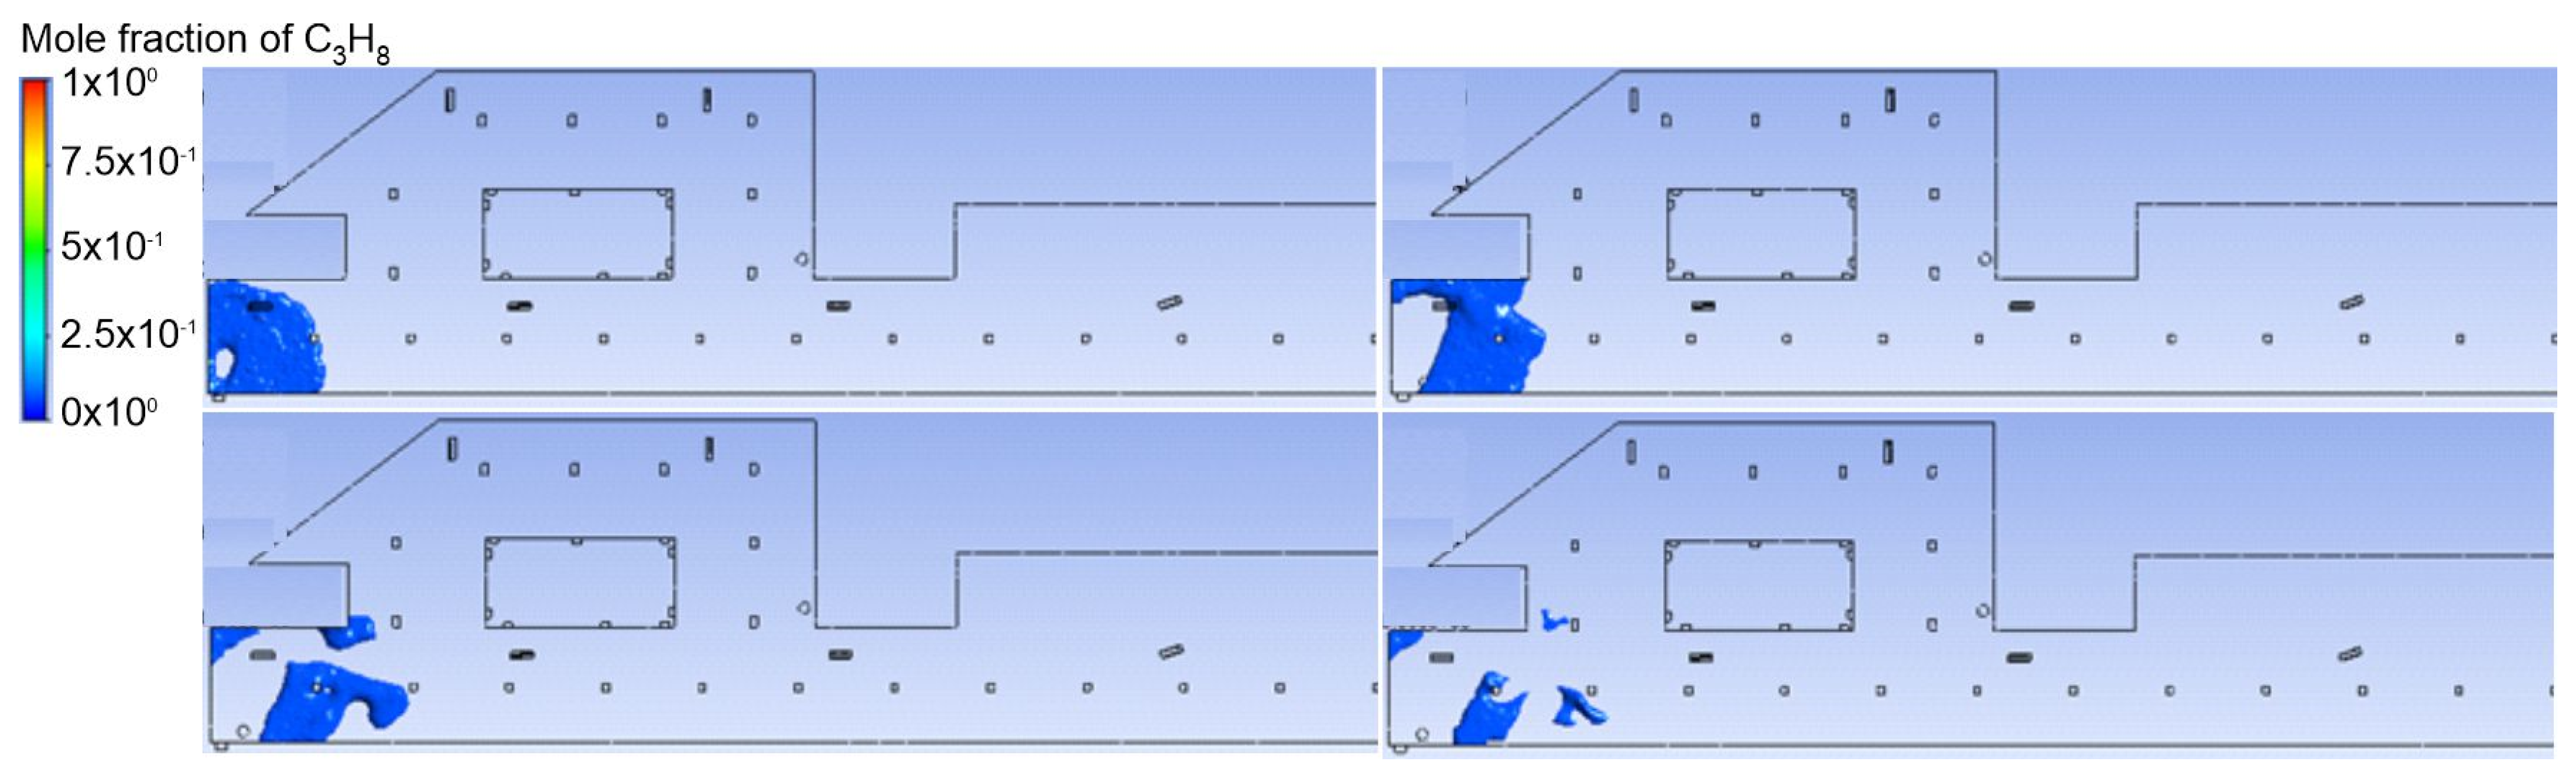
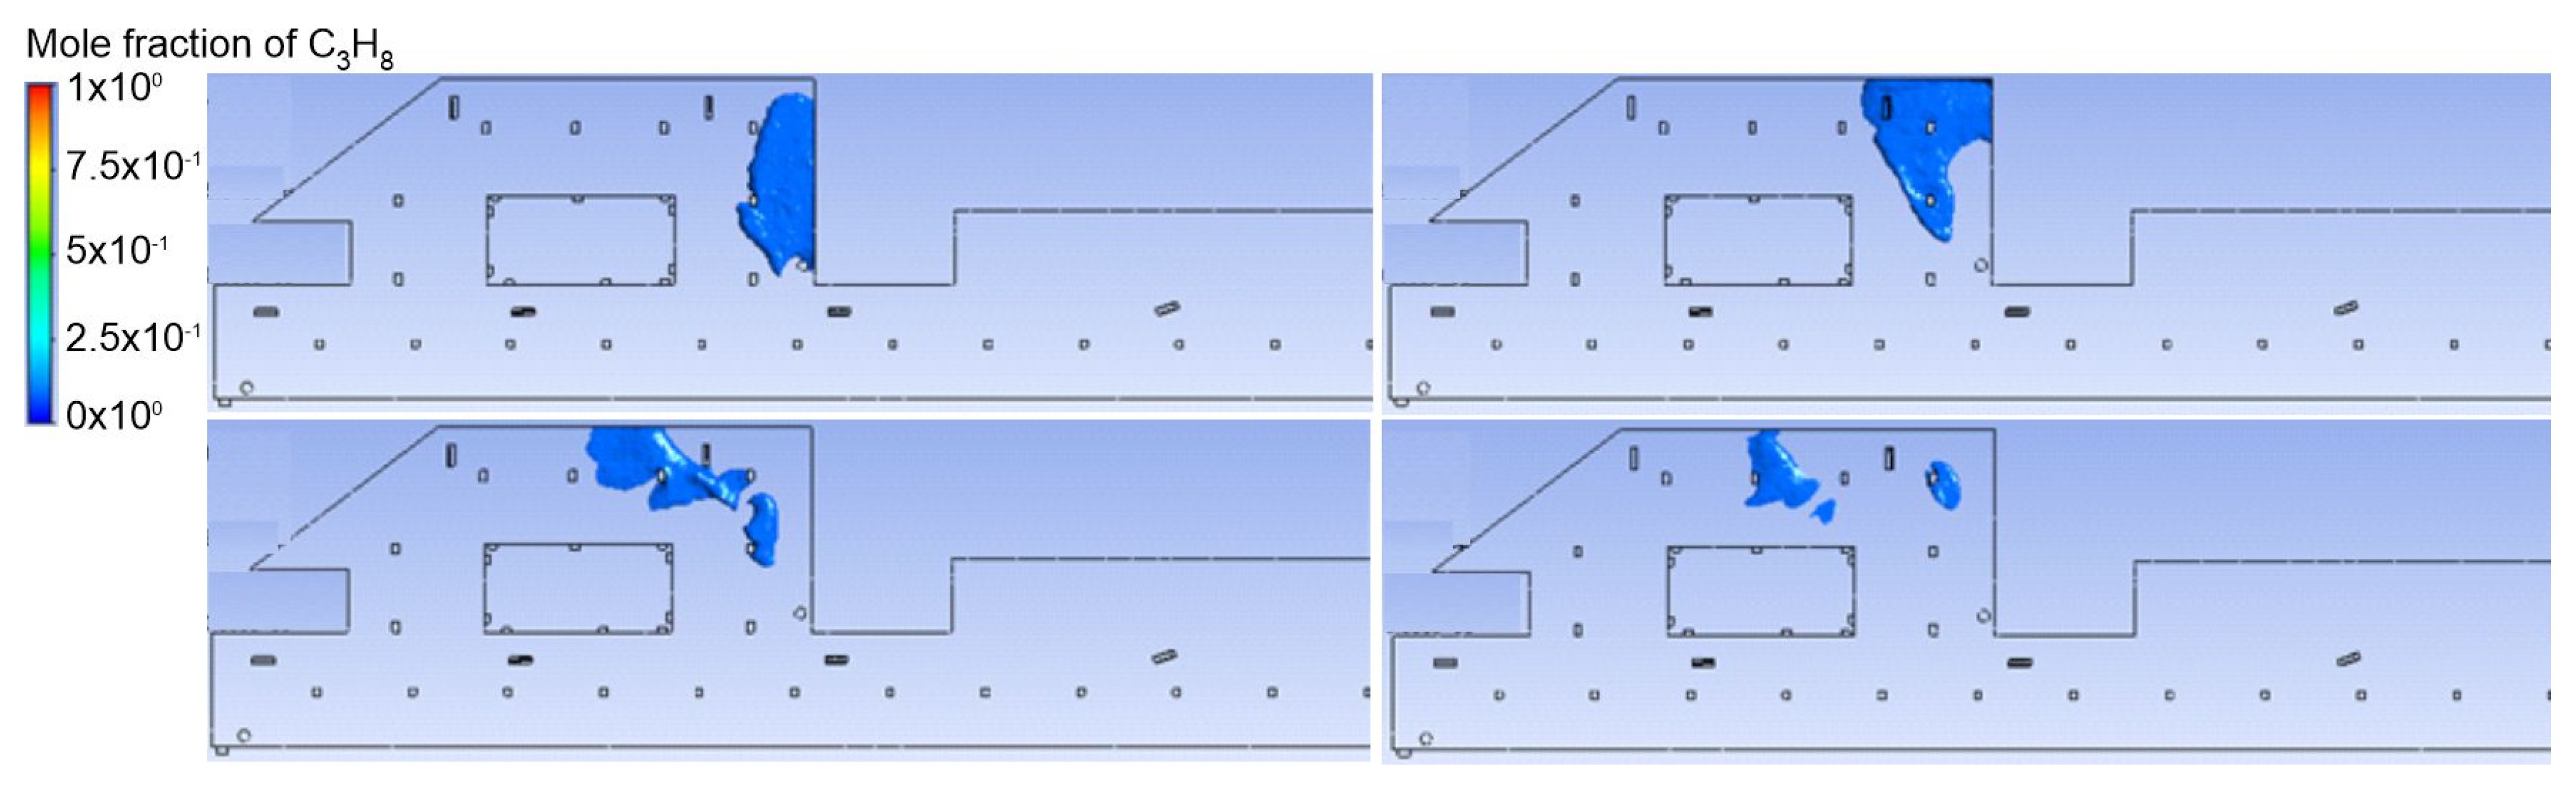
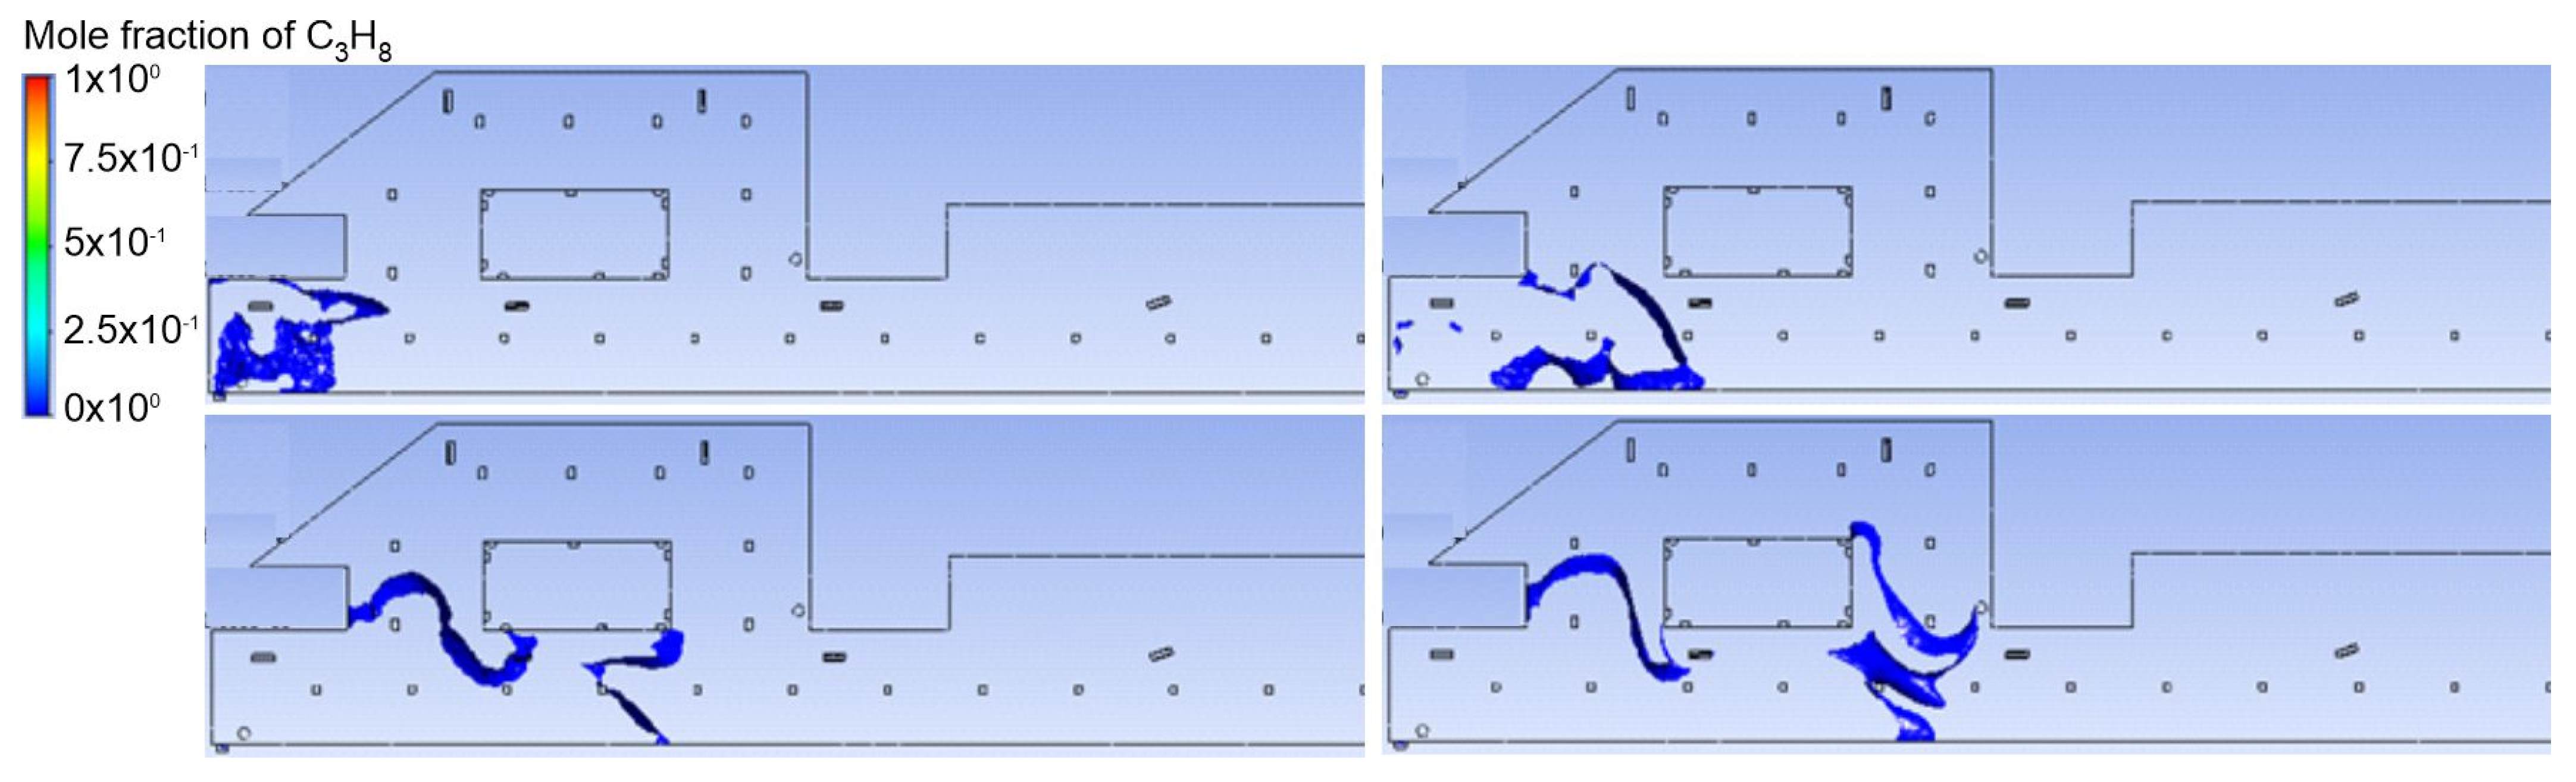
3.1. Duct Ventilation

For the duct ventilation analysis, it was observed that gas dispersion described with a lower explosive limit for the first 10 s for both LPG leakages was similar (Figure 5 and Figure 6). At the beginning of the simulation, the gas spread symmetrically, and each time, the area represented by the LEL of the LPG concentration was stuck to the wall. For A source th LEL area initially took up approximately 1.5% of the garage zone (time step equal to 2.5 s). Next, the LEL area expanded up to 2.4%, 3.2% and 3.85% for 5 s, 7.5 s and 10 s, respectively. While for B source of the LPG leakage, the initial area was similar (1.6%). However, for the next time steps, the area of the LEL of LPG was more extensive (2.7%, 3.9% and 4.7% for 5 s, 7.5 s and 10 s, respectively).
For longer times, differences in gas dispersion were observed. For A source, a greater area occupied by gas compared to B source was observed. For the A leakage source, the LEL area initially took up approximately 4.4% of the garage zone (time step equal to 15 s). Next, the LEL area expanded to 6.1%, 5.6% and 5.1% for 35 s, 55 s and 70 s, respectively. For B source of LPG leakage, the initial area was not similar (4.7%). However, for the next time steps, the area of the LEL of LPG was further extended, and its amounts were 6.4%, 5.2% and 4.7% for 35 s, 55 s and 70 s, respectively. After 70 s for A source, approximately two parking areas were covered with the leaking LPG (Figure 7); while for B source of gas leakage, almost the whole LPG, represented as the low explosive limit, was blown (Figure 8).
At the end of the dispersion process, there appeared areas with lower LPG concentration represented with transparent areas bounded with blue boundary gas. Moreover, when gas was dispersed from A source (Figure 9), the range represented by the blue boundary was smaller compared to the gas leakage from B source. However, the thickness of the blue boundary for B source of gas leakage (Figure 10) was wider compared to A source of LPG leakage.
Moreover, the upper explosive limit indicated that after 35 s, LPG was observed only for A source of leakage (Figure 11); while for the B source, LPG was not detected (Figure 12).
According to LPG distribution after the duct ventilation application, it was observed that LPG sensors should be located at the pillars; while for both cases, these locations appeared inside the leakage areas.

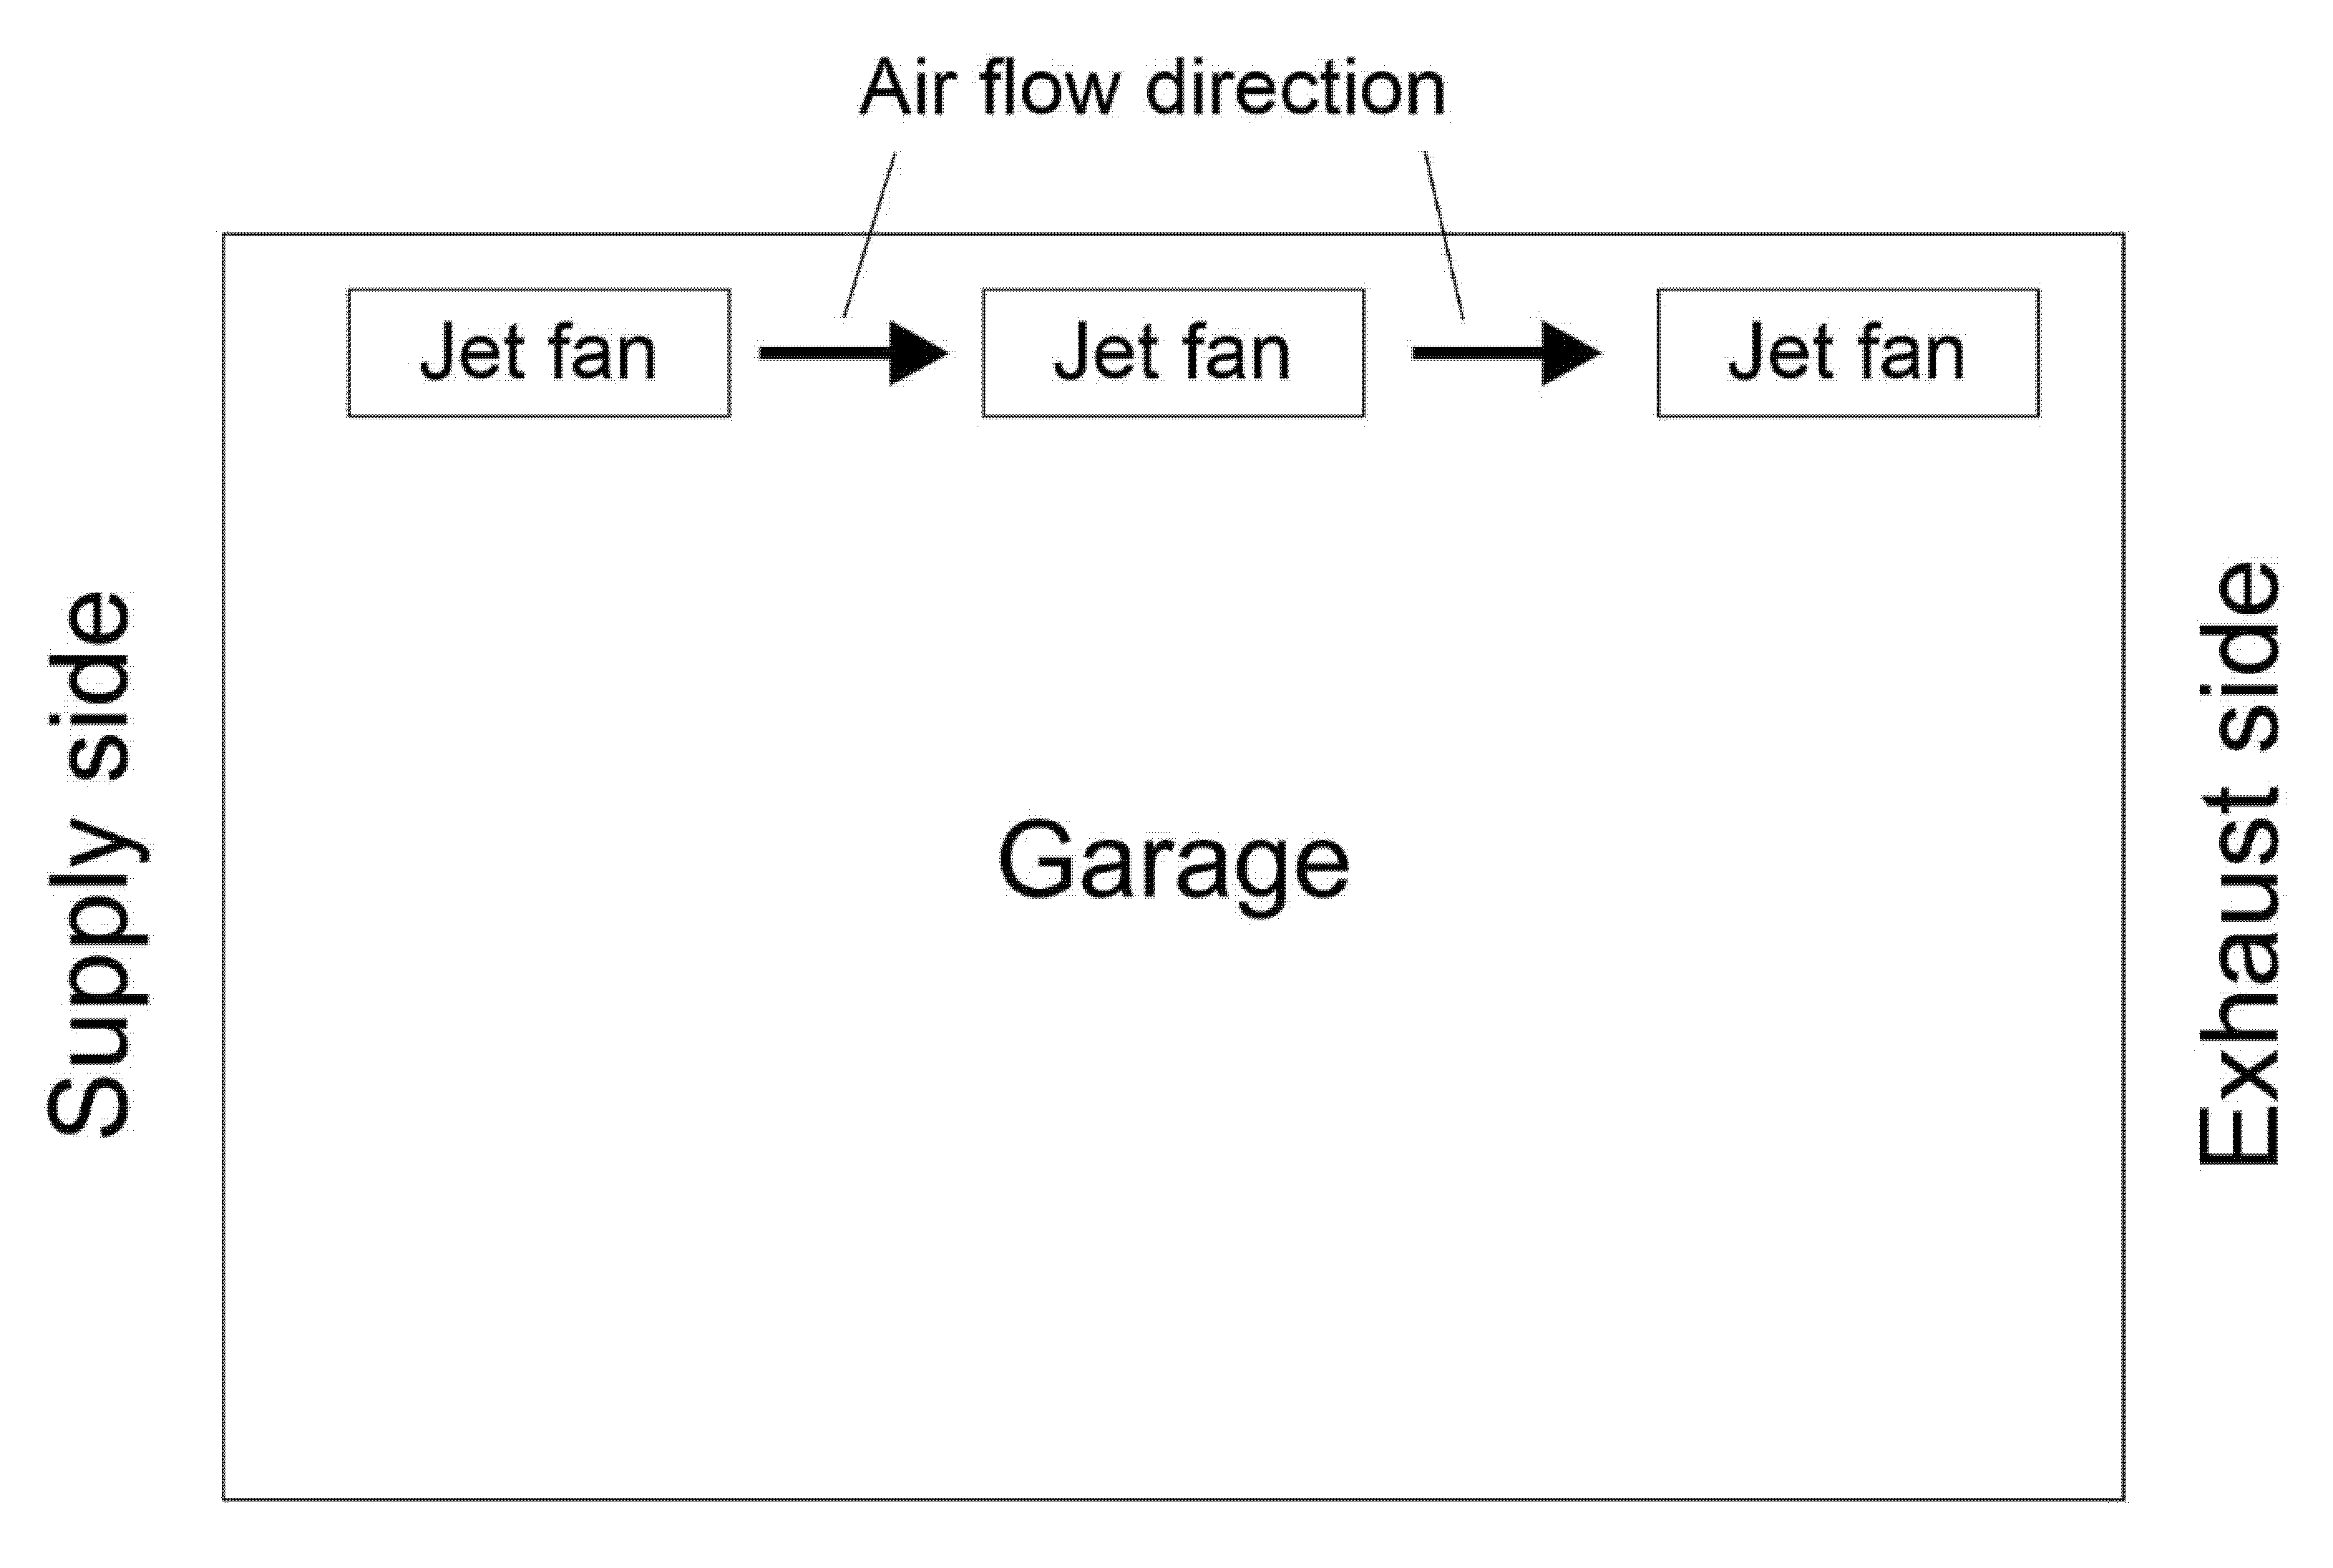
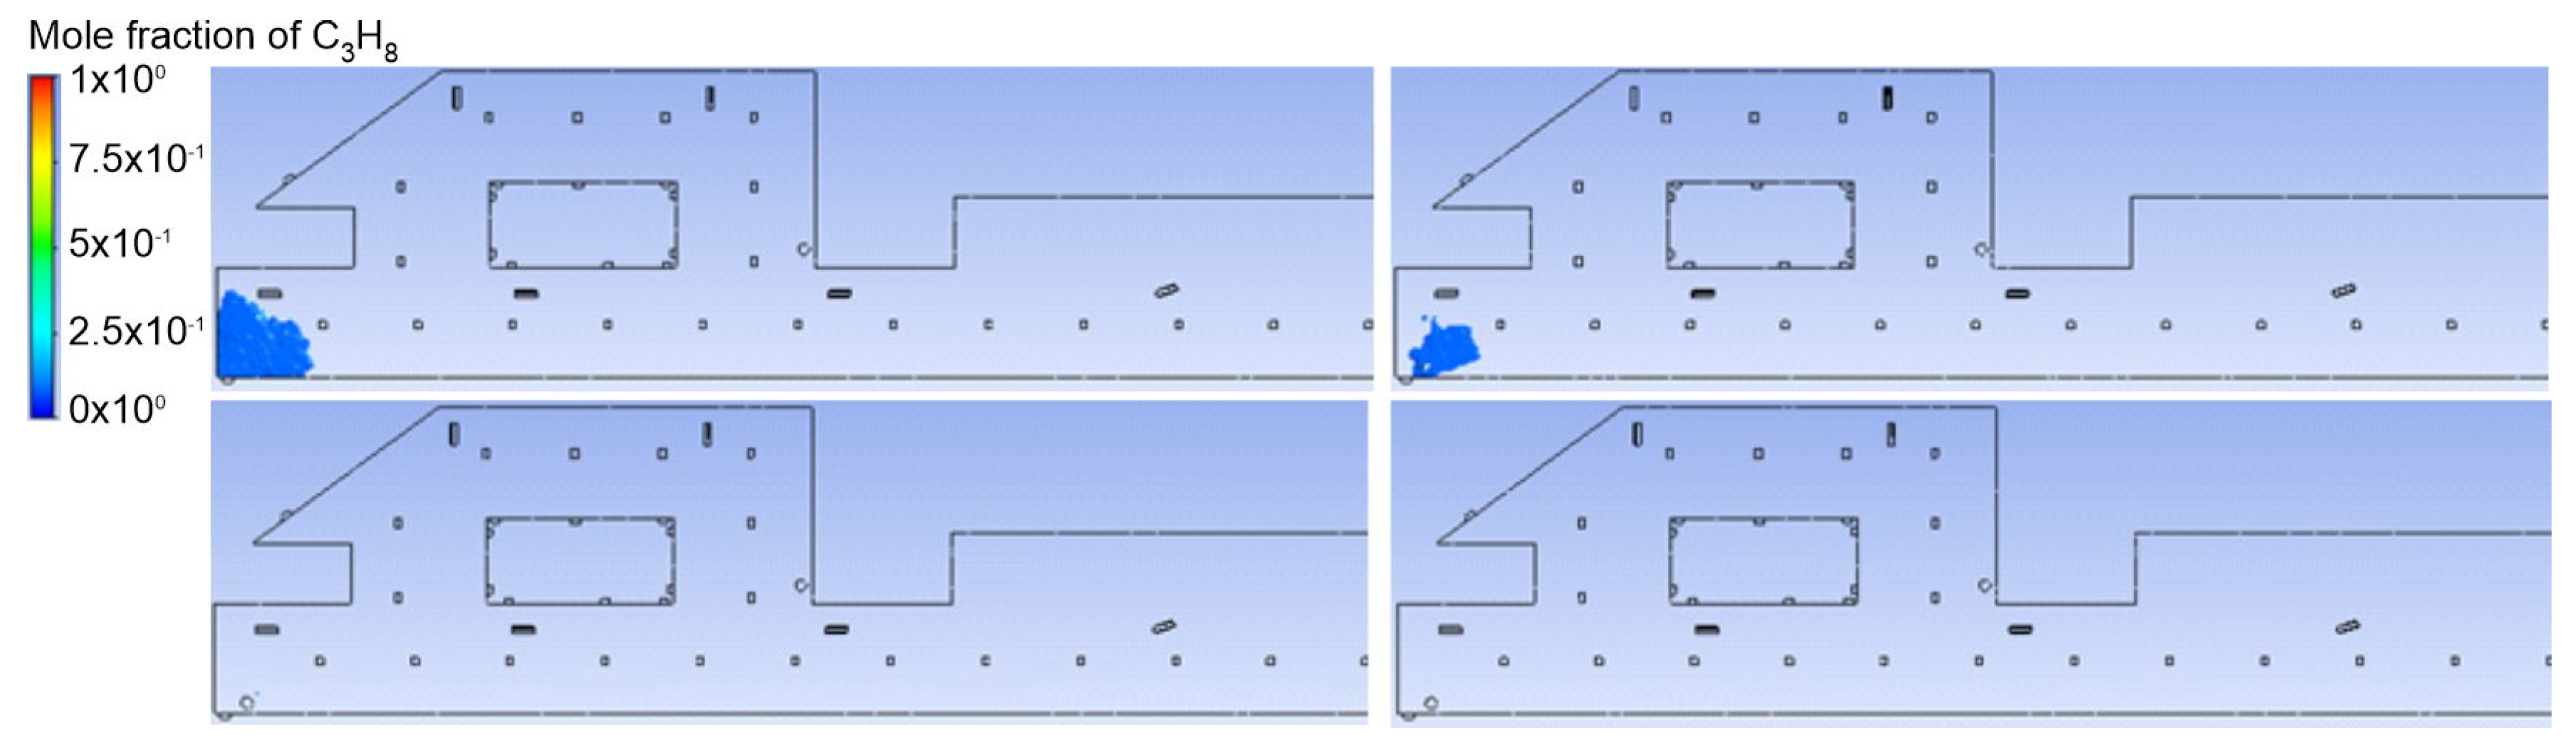
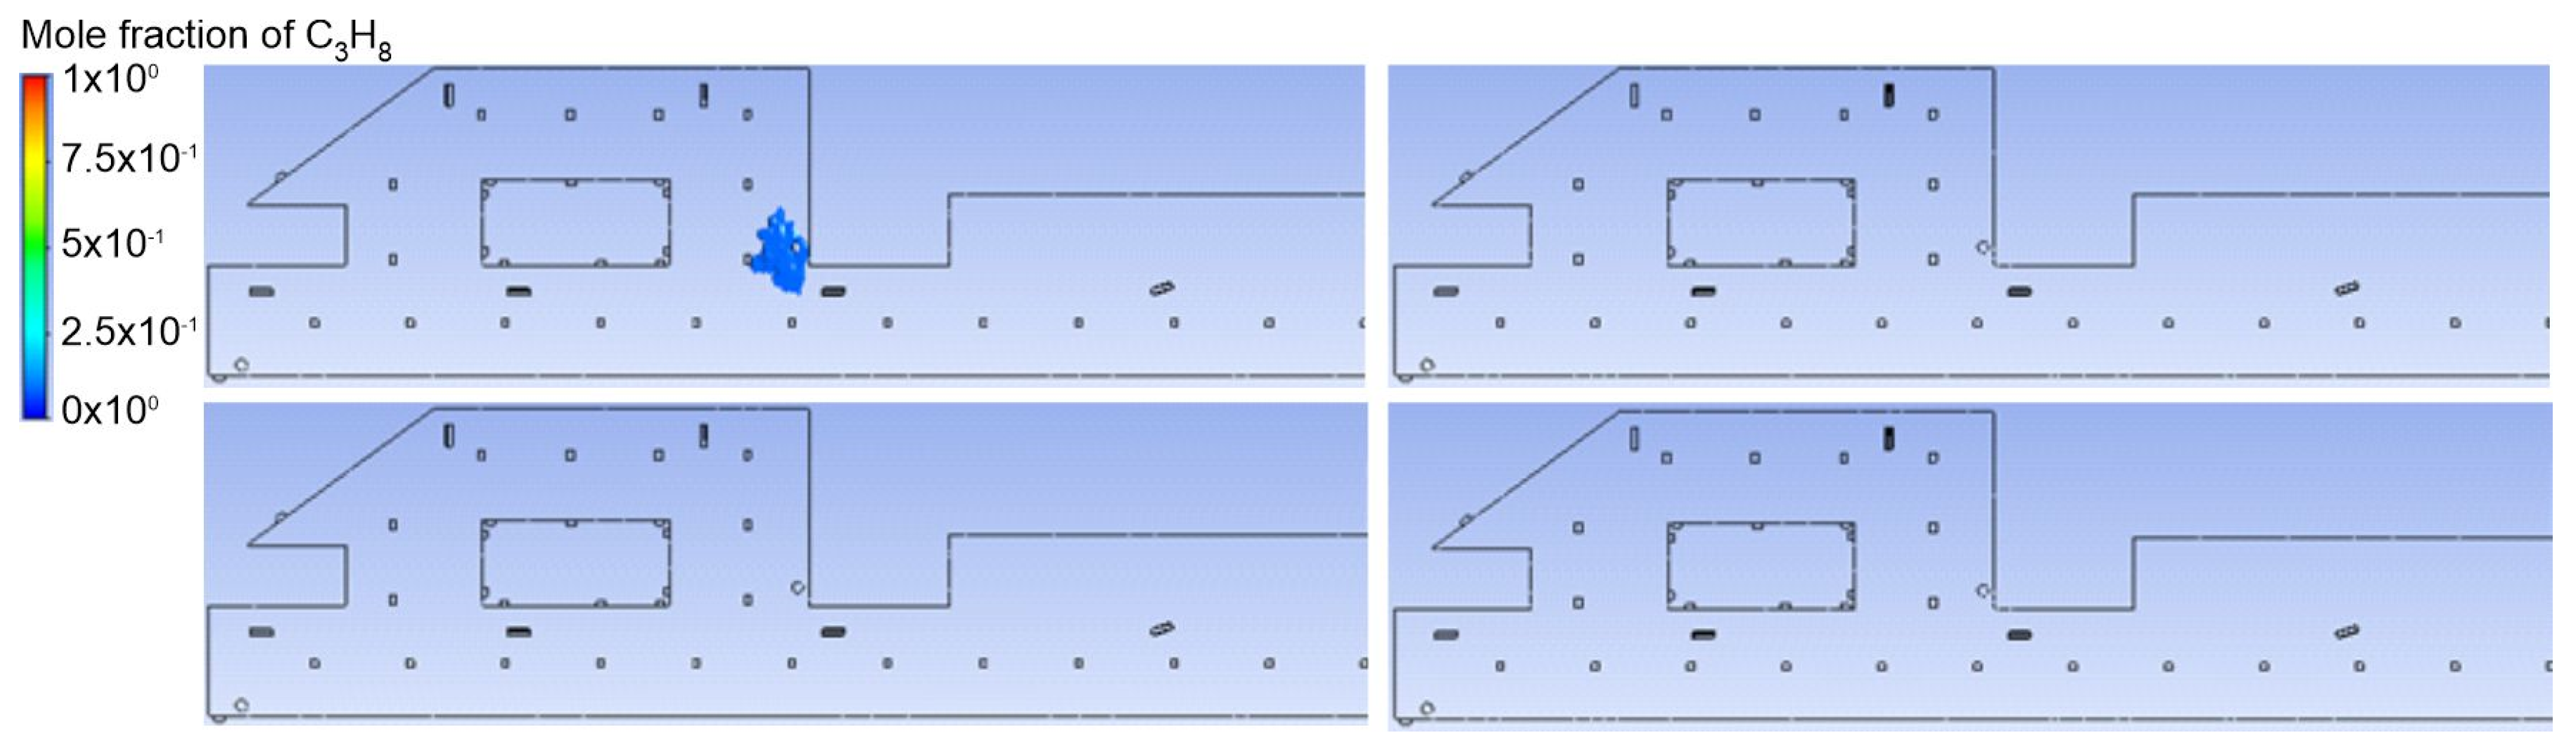
3.2. Jet Ventilation

Jet ventilation was a second analyzed system. The same points of LPG leakage were investigated. Similar to duct ventilation, gas dispersion described with the lower explosive limit for the first 10 s for both cases was not similar (Figure 13 and Figure 14). The comparison of the duct and jet ventilation for the first source of LPG release indicated a similar shape. However, for B source of LPG release, gas was stuck to the wall instead of covering the corner. It was observed that gas dispersion described with the lower explosive limit for the first 10 s for both LPG leakages was similar (Figure 13 and Figure 14). Initially, gas spread symmetrically. Moreover, in line with duct ventilation, each time the area represented by the LEL concentration of LPG was stuck to the wall. For the A leakage source, the LEL area initially took up approximately 1.8% of the garage zone (time step equal to 2.5 s). Next, the LEL area expanded to 2.6%, 3.5% and 4.2% for 5 s, 7.5 s and 10 s, respectively. For B source of LPG leakage, the initial area was similar, and the amount was 1.6%. However, for the next time steps, the area of the LEL of LPG was more extended, and the amount was 2.7%, 4.1% and 4.5% for 5 s, 7.5 s and 10 s, respectively.
For additional times, differences in gas dispersion were observed. For A source, a wider area occupied by gas compared to B source was observed. For A leakage source, the LEL area initially took up approximately 4.6% of the garage zone (time step equal to 15 s). Next, the LEL area decreased to 5.5%, 5.1% and 3.3% for 35 s, 55 s and 70 s, respectively. For B source of LPG leakage, the initial area was not similar, and its amount was 4.9%. However, for the next time steps, the area of the LEL of LPG was more extensive and resulted in 6.7%, 5.5% and 4.4% for 35 s, 55 s and 70 s, respectively. After 70 s for A source, most of the gas was blown (Figure 15). A similar phenomenon was observed for the second source of gas leakage (Figure 16). These observations were different from the duct ventilation results, where after 70 s, LPG released from both sources was still present.
At the end of the dispersion process, the blue boundary bounded transparent area spread wider for both sources of LPG release compared to the duct ventilation system (Figure 17 and Figure 18). However, the thickness of the blue boundary for both sources of gas leakage was wider compared to the duct ventilation.
Moreover, the upper explosive limit indicated that after 70 s, LPG was observed for both sources of LPG release in opposition to the duct ventilation system (Figure 19 and Figure 20).
Effective air pollution prevention and control measures are required when designing ventilation systems [36]. The results obtained from this study predict the nature of LPG dispersion from the chosen source (illegal car parked in an underground garage equipped with LPG installation), which plays a crucial role in the estimation of proper places for the sensors [37].
A comparison of both sources of LPG leakage (A and B) for duct ventilation indicated that for the time range from 2.5 s to 35 s, the area of LEL concentration for B source of leakage was higher (6.7%, 21.5%, 21.9% and 22.1% for 2.5 s, 5 s, 7.5 s and 10 s, respectively), while for 55 s and 70 s the tendency was opposite (Figure 21). It was observed that the area of LEL concentration for B source of leakage was smaller (7.1% and 7.8% for 55 s and 70 s, respectively), while a comparison of both sources of LPG leakage (A and B) for jet ventilation indicated that for only 2.5 s the area of the LEL for B source of leakage was smaller (11.1%). Meanwhile, for the time range from 5 s to 70 s, a higher area of LEL concentration for A source of leakage was observed.
Furthermore, a comparison of both ventilation systems for the same source of leakage indicated that, for A source of leakage, a higher area of LEL was observed for the jet ventilation system for the time range from 2 s to 15 s (20%, 8.3%, 9.4%, 9.1% and 4.5% for 2.5 s, 5 s, 7.5 s and 10 s, respectively), while an opposite trend was observed for the time range from 35 s to 70 s (9.8%, 8.9% and 35.3% for 35 s, 55 s and 70 s, respectively). Additionally, for the time range from 2.5 s to 5 s, there was no difference in the LEL area for B source of leakage. At a time equal to 7.5 s, and the time range from 15 s to 55 s, a higher LEL area for B source of leakage was observed for jet ventilation (5.1%, 4.3%, 4.7% and 5.8% for 7.5 s, 15 s, 35 s and 55 s, respectively). Meanwhile, for the times 10 s and 70 s, the opposite trend was observed for B source of leakage (4.3% and 6.4% for 10 s and 70 s, respectively).

3.3. Limitations to the Study

The numerical model was based on one underground garage with three-dimensional geometry. Moreover, two ventilation systems, jet and duct, were analyzed. LPG emission was reconstructed from two different points, simulating vehicles in their parking space. The turbulence model, kε, was selected. It must be noted that it was crucial to understand how LPG flows for different spatial configurations of ventilation systems, so as to indicate the practical aspect of our model.

4. Conclusions

Comparing jet to duct ventilation for gas movement, stagnation areas in which gas remained were observed for duct ventilation only. Moreover, it was noticed that the analyzed gas would gather in the depressions of the ground, for example in drain grates, which became a hazardous zone for the users of the facility. The turbulence presence for the jet ventilation indicated gas flow in an unexpected direction. Therefore, the proposed CFD model indicated the areas required for LPG sensor application for LPG leakage detection. The analysis of the blowing ventilation around the garage showed that higher LPG leakage caused a higher cloud of gas, which increased the probability of ignition and LPG explosion. For jet ventilation, a very low concentration of LPG in the garage was present. After 35 s, LPG concentration was lower than the upper explosive limit. Therefore, jet ventilation proved to be more effective in blowing up dangerous gas to the level of non-explosive values.

Author Contributions

Conceptualization, Z.S.; methodology, Z.S.; software, Z.S. and A.P.; validation, A.P.-P., M.M.-L. and A.D.; formal analysis, A.P. and A.P.-P.; investigation, Z.S.; resources, Z.S.; data curation, A.P.; writing—original draft preparation, A.P. and A.D.; writing—review and editing, A.P.-P. and Z.S.; visualization, Z.S.; supervision, Z.S. and A.P.; project administration, Z.S.; funding acquisition, Z.S. All authors have read and agreed to the published version of the manuscript.

Funding

This research received no external funding.

Institutional Review Board Statement

Not applicable.

Informed Consent Statement

Not applicable.

Data Availability Statement

Data is available on request from the corresponding author.

Conflicts of Interest

The authors declare no conflict of interest.

References

  1. Yassin, M.F. Experimental study on contamination of building exhaust emissions in urban environment under changes of stack locations and atmospheric stability. Energy Build. 2013, 62, 68–77. [Google Scholar] [CrossRef]
  2. Tabunshchikov, Y.A.; Shkarpet, V.E.; Kapko, D.V.; Brodach, M.M.; Kochariantc, K.V. Installing Local Recirculation Air Diffusers During Building Deep Renovation Reduces Energy Consumption of Ventilation Systems. Energy Procedia 2016, 96, 266–276. [Google Scholar] [CrossRef] [Green Version]
  3. Papakonstantinou, K.; Chaloulakou, A.; Duci, A.; Vlachakis, N.; Markatos, N. Air quality in an underground garage: Computational and experimental investigation of ventilation effectiveness. Energy Build. 2003, 35, 933–940. [Google Scholar] [CrossRef]
  4. Gladyszewska-Fiedoruk, K.; Nieciecki, M. Indoor air quality in a multi-car garage. Energy Procedia 2016, 95, 132–139. [Google Scholar] [CrossRef] [Green Version]
  5. Tsai, P.-Y.; Weisel, C.P. Penetration of Evaporative Emissions into a Home from an M85-Fueled Vehicle Parked in an Attached Garage. J. Air Waste Manag. Assoc. 2000, 50, 371–377. [Google Scholar] [CrossRef] [PubMed] [Green Version]
  6. Majder-Lopatka, M.; Wesierski, T.; Dmochowska, A.; Salamonowicz, Z.; Polanczyk, A. The influence of hydrogen on the indications of the electrochemical carbon monoxide sensors. Sustainability 2020, 12, 14. [Google Scholar] [CrossRef] [Green Version]
  7. Wang, W.; Zhu, Z.; Jiao, Z.; Mi, H.; Wang, Q. Characteristics of fire and smoke in the natural gas cabin of urban underground utility tunnels based on CFD simulations. Tunn. Undergr. Space Technol. 2020, 109, 103748. [Google Scholar] [CrossRef]
  8. Batterman, S.; Jia, C.; Hatzivasilis, G. Migration of volatile organic compounds from attached garages to residences: A major exposure source. Environ. Res. 2007, 104, 224–240. [Google Scholar] [CrossRef]
  9. Faramarzi, A.; Lee, J.; Stephens, B.; Heidarinejad, M. Assessing ventilation control strategies in underground parking garages. Build. Simul. 2021, 14, 701–720. [Google Scholar] [CrossRef]
  10. Mavroidis, I.; Griffiths, R.F.; Jones, C.D.; Biltoft, C. Experimental investigation of the residence of contaminants in the wake of an obstacle under different stability conditions. Atmos. Environ. 1999, 33, 939–949. [Google Scholar] [CrossRef]
  11. Buckland, I.G. Explosions of gas layers in a room size chamber. Inst. Chem. Eng. Symp. Ser. 1980, 58, 289–304. [Google Scholar]
  12. Huo, Y.W.N.Y.; Chow, W.-k.; Show, C.L.; Cheng, F.M. Numerical simulations on explosion of leaked liquefied petroleum gas in a garage. Build. Simul. 2017, 10, 755–768. [Google Scholar]
  13. Krawczyk, D.A. Theoretical and real effect of thermal modernization 2—A case study. Energy Build 2014, 81, 30–37. [Google Scholar] [CrossRef]
  14. Giordano EmrysScarponi, G.E.; Pastor, E.; Planas, E.; Cozzani, V. Analysis of the impact of wildland-urban-interface fires on LPG domestic tanks. Saf. Sci. 2020, 124, 104588. [Google Scholar]
  15. Chow, W.K. On ventilation design for underground car parks. Tunn. Undergr. Space Technol. 1995, 10, 225–245. [Google Scholar] [CrossRef]
  16. Salamonowicz, Z.; Majder-Lopatka, M.; Dmochowska, A.; Piechota-Polanczyk, A.; Polanczyk, A. Numerical Analysis of Smoke Spreading in a Medium-High Building under Different Ventilation Conditions. Atmosphere 2021, 12, 705. [Google Scholar] [CrossRef]
  17. Hannaa, S.R.; Hansenb, O.R.; Ichard, M.; Strimaitisc, D. CFD model simulation of dispersion from chlorine railcar releases in industrial and urban areas. Atmos. Environ. 2009, 43, 262–270. [Google Scholar] [CrossRef]
  18. Polanczyk, A.; Salamonowicz, Z. Computational modeling of gas mixture dispersion in a dynamic setup – 2d and 3d numerical approach. E3S Web Conf. 2018, 44, 146. [Google Scholar] [CrossRef] [Green Version]
  19. Zieminska-Stolarska, A.; Polanczyk, A.; Zbicinski, I. 3-D CFD simulations of hydrodynamics in the Sulejow dam reservoir. J. Hydrol. Hydromech. 2015, 63, 334–341. [Google Scholar] [CrossRef] [Green Version]
  20. Wang, K.; Liu, Z.; Qian, X.; Huang, P. Long-term consequence and vulnerability assessment of thermal radiation hazard from LNG explosive fireball in open space based on full-scale experiment and PHAST. J. Loss Prev. Process Ind. 2017, 46, 13–22. [Google Scholar] [CrossRef]
  21. Thoman, D.C.; O’Kula, K.R.; Laul, J.C.; Davis, M.W.; Knecht, K.D. Comparison of ALOHA and EPIcode for Safety Analysis Applications. J. Chem. Health Saf. 2006, 13, 20–33. [Google Scholar] [CrossRef]
  22. Polanczyk, A.; Wawrzyniak, P.; Zbicinski, I. CFD analysis of dust explosion relief system in the counter-current industrial spray drying tower. Dry. Technol. 2013, 31, 881–890. [Google Scholar] [CrossRef]
  23. Salamonowicz, Z.; Krauze, A.; Majder-Lopatka, M.; Dmochowska, A.; Piechota-Polanczyk, A.; Polanczyk, A. Numerical Reconstruction of Hazardous Zones after the Release of Flammable Gases during Industrial Processes. Processes 2021, 9, 307. [Google Scholar] [CrossRef]
  24. Wawrzyniak, P.; Podyma, M.; Zbicinski, I.; Bartczak, Z.; Polanczyk, A.; Rabaeva, J. Model of Heat and Mass Transfer in an Industrial CounterCurrent Spray-Drying Tower. Dry. Technol. 2012, 30, 1274–1282. [Google Scholar] [CrossRef]
  25. Choi, J.; Hur, N.; Kang, S.; Lee, E.D.; Lee, K.B. A CFD simulation of hydrogen dispersion for the hydrogen leakage from a fuel cell vehicle in an underground parking garage. Int. J. Hydrogen Energy 2013, 38, 8084–8091. [Google Scholar] [CrossRef]
  26. Rigas, F.; Sklavounos, S. Evaluation of hazards associated with hydrogen storage facilities. Int. J. Hydrogen Energy 2005, 30, 1501–1510. [Google Scholar] [CrossRef]
  27. Chen, Q.; Chen, S.; Zhang, H.; Ran, G.; Zhang, F.; Yang, H. Augmentation of tunnel-air convective heat transfer forced by duct ventilation in a geothermal construction tunnel. Build. Environ. 2021, 205, 108219. [Google Scholar] [CrossRef]
  28. Wang, L.; Dai, X.; Weia, J.; Ai, Z.; Fan, Y.; Tang, L.; Jin, T.; Ge, J. Numerical comparison of the efficiency of mixing ventilation and impinging jet ventilation for exhaled particle removal in a model intensive care unit. Build. Environ. 2021, 200, 107955. [Google Scholar] [CrossRef]
  29. Polanczyk, A.; Salamonowicz, Z.; Majder-Lopatka, M.; Dmochowska, A.; Jarosz, W.; Matuszkiewicz, R.; Makowski, R. 3D Simulation of Chlorine Dispersion in Rrural Area. Annu. Set Environ. Prot. 2018, 20, 1035–1048. [Google Scholar]
  30. Bottcher, N.; Singh, A.K.; Kolditz, O.; Liedl, R. Non-isothermal, compressible gas flow for the simulation of an enhanced gas recovery application. J. Comput. Appl. Math. 2012, 236, 4933–4943. [Google Scholar] [CrossRef] [Green Version]
  31. Pontiggiaa, M.; Derudi, M.; Alba, M.; Scaioni, M.; Rota, R. Hazardous gas releases in urban areas: Assessment of consequences through CFD modelling. J. Hazard. Mater. 2010, 176, 589–596. [Google Scholar] [CrossRef] [PubMed]
  32. Zhang, Q.-X.; Mo, S.-J.; Liang, D. Numerical Simulation of Natural Gas Release and Risk Zone Forecast in Urban Areas. Procedia Eng. 2014, 71, 470–475. [Google Scholar] [CrossRef] [Green Version]
  33. Gavelli, F.; Bullister, E.; Kytomaa, H. Application of CFD (Fluent) to LNG spills into geometrically complex environments. J. Hazard. Mater. 2008, 159, 158–168. [Google Scholar] [CrossRef] [PubMed]
  34. Sklavounos, S.; Roigas, F. Simulation of Coyote series trials—Part I: CFD estimation of non-isothermal LNG releases and comparison with box-model predictions. Chem. Eng. Sci. 2006, 61, 1434–1443. [Google Scholar] [CrossRef]
  35. Staveckis, A.; Borodinecs, A. Impact of impinging jet ventilation on thermal comfort and indoor air quality in office buildings. Energy Build. 2021, 235, 110738. [Google Scholar] [CrossRef]
  36. Song, P.; Zhang, Z.; Zhu, Y. Numerical and experimental investigation of thermal performance in data center with different deflectors for cold aisle containment. Build. Environ. 2021, 200, 107961. [Google Scholar] [CrossRef]
  37. Bonilla, J.T.G.; Bonilla, H.G.; Rodríguez-Betancourtt, V.M.; Bonilla, A.G.; Zamora, A.C.; Alonso, O.B.; Ortega, J.A.R. A Gas Sensor for Application as a Propane Leak Detector. J. Sens. 2021, 2021, 8871166. [Google Scholar] [CrossRef]
Figure 1. The scheme of analyzed object: (a) presents spatial configuration of pillars (yellow color), walls (grey color) and entry and exit to the garage (black arrows). The red circle represents first source of LPG dispersion, and the blue circle represents second source of LPG dispersion; (b) presents spatial configuration of ducts (violet color) and duct ventilation system; (c) presents spatial configuration of fans (green color) and jet ventilation system.
Processes 10 00053 g001
Figure 2. The scheme of applied jet ventilation.
Processes 10 00053 g002
Figure 3. The scheme of applied duct ventilation.
Processes 10 00053 g003
Figure 4. Numerical grid generated with the use of Ansys ICEM software.
Processes 10 00053 g004
Figure 5. Lower explosive limit of LPG distribution in an underground garage after gas dispersion for A source for different time steps: 2.5 s, 5 s, 7.5 s and 10 s.
Processes 10 00053 g005
Figure 6. Lower explosive limit of LPG distribution in an underground garage after gas dispersion for B source for different time steps: 2.5 s, 5 s, 7.5 s and 10 s.
Processes 10 00053 g006
Figure 7. Lower explosive limit of LPG distribution in an underground garage after gas dispersion for A source for different time steps: 15 s, 35 s, 55 s and 70 s.
Processes 10 00053 g007
Figure 8. Lower explosive limit of LPG distribution in an underground garage after gas dispersion for B source for different time steps: 15 s, 35 s, 55 s and 70 s.
Processes 10 00053 g008
Figure 9. Trace amount of LPG near the end of dispersion for A source.
Processes 10 00053 g009
Figure 10. Trace amount of LPG near the end of dispersion for B source.
Processes 10 00053 g010
Figure 11. Upper explosive limit of LPG dispersion for A source for different time steps of 15 s, 35 s, 55 s and 70 s.
Processes 10 00053 g011
Figure 12. Upper explosive limit of LPG dispersion for B source for different time steps of 15 s, 35 s, 55 s and 70 s.
Processes 10 00053 g012
Figure 13. Lower explosive limit of LPG distribution in an underground garage after gas dispersion for A source for different time steps of 2.5 s, 5 s, 7.5 s and 10 s.
Processes 10 00053 g013
Figure 14. Lower explosive limit of LPG distribution in an underground garage after gas dispersion for B source for different time steps of 2.5 s, 5 s, 7.5 s and 10 s.
Processes 10 00053 g014
Figure 15. Lower explosive limit of LPG distribution in an underground garage after gas dispersion for A source for different time steps of 15 s, 35 s, 55 s and 70 s.
Processes 10 00053 g015
Figure 16. Lower explosive limit of LPG distribution in an underground garage after gas dispersion for B source for different time steps of 15 s, 35 s, 55 s and 70 s.
Processes 10 00053 g016
Figure 17. Trace amount of LPG near the end of dispersion for A source.
Processes 10 00053 g017
Figure 18. Trace amount of LPG near the end of dispersion for B source.
Processes 10 00053 g018
Figure 19. Upper explosive limit of LPG dispersion for A source for the following time steps 20 s, 35 s, 55 s and 70 s.
Processes 10 00053 g019
Figure 20. Upper explosive limit of LPG dispersion for B source for the following time steps 20 s, 35 s, 55 s and 70 s.
Processes 10 00053 g020
Figure 21. Comparison of both analyzed systems. Blue plus sign presents A source of leakage for duct ventilation; Orange triangle presents B source of leakage for duct ventilation; Purple minus sign presents A source of leakage for jet ventilation; Green circle presents B source of leakage for jet ventilation.
Processes 10 00053 g021
Table 1. Results for the mesh independent test.
Mesh RangeAchieved Level of Convergence
0.20–0.15 mnon converging results
0.15–0.10 mcontinuity 1 × 10⁻⁵
x-velocity 1 × 10⁻³
y-velocity 1 × 10⁻³
z-velocity 1 × 10⁻³
Publisher’s Note: MDPI stays neutral with regard to jurisdictional claims in published maps and institutional affiliations.

