Article

Response Surface Optimization for Antioxidant Extraction and Attributes Liking from Roasted Rice Germ Flavored Herbal Tea

by
Sriwiang Rittisak
1,*,
Ratchanee Charoen
1,
Natthaya Choosuk
1,
Wanticha Savedboworn
2 and
Wiboon Riansa-ngawong
2
1
Department of Innovation and Product Development Technology, Faculty of Agro-Industry, King Mongkut’s University of Technology North Bangkok, Prachinburi 25230, Thailand
2
Department of Agro-Industry Technology and Management, Faculty of Agro-Industry, King Mongkut’s University of Technology North Bangkok, Prachinburi 25230, Thailand
*
Author to whom correspondence should be addressed.
Processes 2022, 10(1), 125; https://doi.org/10.3390/pr10010125
Submission received: 2 December 2021 / Revised: 4 January 2022 / Accepted: 5 January 2022 / Published: 7 January 2022

Abstract

:
The optimal process conditions when examining the antioxidant potential, total polyphenol content, and attribute liking in roasted rice germ flavored herbal tea were investigated using response surface methodology (RSM). The influence upon the extraction process of time and temperature was assessed using a full factorial design on three levels with two variables (32), involving five central point replicates. Extraction temperature (70 °C, 80 °C, and 90 °C) and extraction time (3 min, 4.5 min, and 6 min) served as independent variables, while the dependent variables were allocated to the regression equation to determine antioxidant activity (R2 = 0.941) along with total polyphenol content (R2 = 0.849), flavor liking score (R2 = 0.758), and overall liking score (R2 = 0.816). Following experimentation, it was determined that the optimal time and temperature conditions to maximize total polyphenol content, antioxidant activity, flavor, and overall liking score were in a range of 86 °C to 90 °C for 3.4 min to 5.9 min. When these conditions were imposed, the antioxidant potential, total polyphenol content, flavor, and overall liking score were >70% for DPPH scavenging activity, >75 mgGAE/g, >6.7 (like moderately), and >6.5 (like moderately), respectively.

1. Introduction

In general, herbal tea is prepared from different morphological plant parts, namely the stem, leaves, flowers, seeds, roots, bark, buds, and fruits. There are a number of companies operating in the herbal tea business in Thailand, using herbs or medicinal plants to make their product. The tea is then sold in tea bag form, containing dried herbs, to which hot water or boiling water can then be added [1,2,3,4]. The popularity of herbal teas has soared in recent years, and the product is widely available in health food outlets. It is typically sold either as the pure herb, or in samples, which are a blend of different herbs. Its popularity can be attributed to its therapeutic qualities, its fragrance, flavor, and also its antioxidant activity [4,5,6]. Herbal teas are considered to be very safe by consumers due to their natural content, while their health-giving properties are attributed to the natural bioactive compounds in the product [1,4]. Among the bioactive contents of herbal teas are flavonoids, vitamins, carotenoids, and phenolic acid, while high levels of free radical scavenging activity have also been reported [7,8]. It is very well known that herbal extracts may provide a variety of health benefits, such as antioxidant, antibacterial, anticarcinogenic, anti-inflammatory, anti-aging, antispasmodic, carminative, and antidepressant effects, as well as acting as a diuretic and a laxative [9,10].
Numerous factors affect the DPPH (1,1-diphenyl-2-picrylhydrazyl) antioxidant activity, the total polyphenol content, including the sensory quality of herbal teas, although among the most important are the kinds of herb involved and the time and temperature used for extraction. The level of antioxidant activity is governed by the polyphenol content released in solution, but as a consequence of the sensitivity of polyphenols to heat, the optimal temperature conditions are also significant along with the optimal time; it is important not to boil the sample beyond the point which is necessary [9]. Given that a number of different variables can affect the overall outcome, the most effective means of analyzing and optimizing the process is to use response surface methodology [11]. The advantage of RSM (response surface methodology) is that it permits the conduct of statistical experiments whereby a process can be modeled and the independent variables can be evaluated to determine their statistical significance in the process. Accordingly, the optimal conditions can be ascertained [12,13]. There are two stages in this methodology. The first is the design of the experiment, whereby the full factorial design is used to set the levels for the independent variables. The second stage is the optimization of the process that is carried out via the RSM. It is possible to consider multiple factors simultaneously using RSM, which saves time over an approach based on examining one factor at a time because the number of trial runs required can be significantly reduced [14].
In most herbal teas, a number of different herbs will be used because the taste is typically better than is the case when a single pure herb is involved. The extra herbs tend to enhance the flavor or add color [15]. In terms of consumer perception, sensory qualities such as color, fragrance, and flavor enhance the pleasantness of the herbal tea. In earlier research, herbal tea has been given a more palatable flavor through the addition of roasted rice germ (cv. Khao Dawk Mali 105), which was suitable for further study due to the high levels of antioxidant activity and total polyphenol content. The formula used previously comprised dried bael fruit powder (45.25%), roasted rice germ (33.07%), and dried pandan leaf powder (21.68%). After steeping in hot water at 90 °C for 3 min, the product had 69.03% DPPH scavenging activity and 75.16 mgGAE/g total phenolic content [16]. The properties of herbal teas differ as a consequence of the location of their origin and the prevailing climate conditions there, as well as the techniques used in processing. The infusion or decoction approach is most frequently employed as a means of extracting bioactive compounds from herbal teas [10,15]. Many studies have therefore focused on the need to develop functional herbal teas that offer high levels of antioxidant activity and polyphenol content [8,9,10,17]. Most of the research was conducted to find the optimal extraction process for a single component or two components of herbal tea. We are unaware, however, of any previous studies in the literature which detail the optimization of the extraction process to maximize the antioxidant activity and total polyphenol content of herbal teas comprising the following three mixed constituents: dried pandan leaf, roasted rice germ, and dried bael fruit. Therefore, this study sought to employ RSM to optimize the extraction process in the case of herbal tea flavored with roasted rice germ to maximize the antioxidant activity when assessed using the 1,1-diphenyl-2-picrylhydrazyl (DPPH) method, while also maximizing the total polyphenol content by focusing on a good flavor of herbal tea. The process required the optimization of time and temperature to achieve the study objectives with regard to antioxidant activity, polyphenol content, and attribute liking score from the tested infusions of herbal tea.

2. Materials and Methods

2.1. Materials

The Dongbang Herb Shop, Prachinburi province, supplied both the dried bael fruit (Aegle marmelos (L.) Correa) and the dried pandan leaf (Pandanus amaryllifolius), while the Jibtong Surin Rice Mill, Surin province, provided the Thai rice germ (cv. Khao Dawk Mali 105). The rice germ was pan-roasted for 2 min before an electric grinder was used to grind the dry material to produce a powder which was then sieved using a No. 35 mesh testing sieve for 500 μm of particle size [16]. The resulting powder was then stored in darkness at room temperature in polyethylene bags until further use.

2.2. Reagents

Sigma-Aldrich (St. Louis, MO, USA) supplied the Folin–Ciocalteu reagent and 1,1-diphenyl-2-picrylhydrazyl (DPPH). All reagents used in the study were of an analytical grade.

2.3. The Preparation and Extraction Process for Herbal Tea Flavored with Roasted Rice Germ

To prepare herbal tea for each sample, two grams of the three mixed components of herb powder (45.25% of dried bael fruit powder, 33.07% of roasted rice germ, and 21.68% of dried pandan leaf powder) were extracted using 100 mL (ratio 1:50 of herb powder: solvent (g/mL)) of distilled water [16]. The experimental design, as shown in Table 1, sets out the water temperatures and extraction times for testing. Having reached the end of the specified extraction time, the water and herb powder underwent separation before the infusion was cooled down to room temperature. Whatman No. 4 filter paper was used to filter the extract, which was then placed in a centrifuge for 10 min at 10,062× g at a temperature of 4 °C [9]. In each trial, a fresh sample of herbal tea was prepared prior to experimentation.

2.4. Evaluation of the Total Polyphenol Content

The Folin-Ciocalteu method, as advised by Thaipong et al. [18], was employed in triplicate to assess the total polyphenol content for each of the roasted rice germ flavored herbal tea samples, whereby 150 µL of the herbal tea extract was combined with 2400 µL of nanopure water and a further 150 µL of 0.25 N Folin-Ciocalteu reagent. Having been mixed thoroughly, the reaction was permitted to run for 3 min before the further addition of 300 µL of 1 N Na2CO3 solution, which was introduced to the mix with shaking. Incubation of the solution followed in darkness at room temperature for 2 h. A microplate reader (BMG Labtech, SPECTROstar Nano, Ortenburg, Germany) was employed to assess the absorbance at 725 nm and the outcome was presented in the form of milligrams of gallic acid equivalent (GAE) per gram of dry weight on the basis of a standard curve constructed using a gallic acid solution.

2.5. 1,1-Diphenyl-2-Picrylhydrazyl (DPPH) Free Radical Scavenging Activity Assay

A technique described by Matthus [19] was used for the evaluation of the free-radical scavenging activity achieved by the roasted rice germ flavored herbal tea toward the 1,1-diphenyl-2-picrylhydrazyl (DPPH) radical. The method was slightly modified and performed in triplicate. To conduct the tests, 80 µL of the sample was first mixed with 200 µL of 0.05% DPPH within a total amount of 4 mL of methanol. The mixture then stood in darkness for 30 min at 25 °C while the reaction took place. A microplate reader (BMG Labtech, SPECTROstar Nano, Ortenburg, Germany) was used to measure the absorbance at 515 nm with comparisons drawn to a control (as 100%). Equation (1), below, was employed to calculate the DPPH free radical scavenging activity for each of the tested samples of herbal tea.
Inhibition   % = [ ( Absorbance   of   control Absorbance   of   Sample ) / Absorbance   of   control ]   ×   100

2.6. Hedonic Test

The roasted rice germ flavored herbal tea was evaluated for color, odor, flavor, and overall liking score by an untrained panel of 104, all of whom were members of the elder circle of Chao Phya Abhaibhubejhr hospital, Prachinburi province, Thailand, using a 9-point hedonic scale (9 = like extremely; 1 = dislike extremely) [20]. They were screened by the following criteria: they had to be over 60 years old, habitually exercise, and be health-conscious. Roasted rice germ flavored herbal tea sample was monadically served at 30 mL in a 1 oz. closed plastic cup for 4 samples with a 3-digit random number following a balance incomplete block design (BIB) to each panelist (Table 2).

2.7. Design of the Experiment and Statistical Analysis

This study made use of the 32 full factorial design for assessment of the extraction variable in order to predict the ideal conditions for the extraction process to maximize (1) antioxidant activity, (2) total polyphenol content, as well as (3) attributes liking score through RSM [21]. The independent variables, namely, extraction temperature (X1) and time (X2), were then allocated coded levels to reflect the normal habits of Thai herbal tea consumers when they prepare herbal tea. These coded values were −1 (low level), 0 (medium level), and 1 (high level). The ways in which these were coded allowed them to be allocated to the actual values. The design of the experiment comprised 13 points, of which five replications could be found at the central point, and for which a random order was followed (Table 1).
Antioxidant activity can be expressed through the use of the second degree polynomial (Y1), while the overall polyphenol content (Y2) and attributes liking score (Y3–Y6) for the herbal tea can be shown in terms of the independent variables as indicated below:
Y i = β 0 + i = 1 2 β i x i + i = 1 2 β i i x i 2 + i < j 2 β i j x i x j  
in which Yi serves as the response variable (antioxidant activity is given by (Y1)), total polyphenol content is given by (Y2), an attributes liking score is given by (Y3–Y6), β0 acts as a constant, βi serves as the regression coefficients related to linear effects, βij serves as the regression coefficients related to interaction effects, βii serves as regression coefficients indicating quadratic effects, and the coded levels of Xi and Xj are used to represent the independent variables (extraction temperature (X1) and extraction time (X2)) in the experiments. The experiments were designed and optimized using Minitab Statistical software (Minitab Pty Ltd., Inc. Sydney, NSW, Australia). Multiple regression analysis was carried out to fit the Equation (2) to all independent variables. ANOVA (analysis of variance) was performed to assess the significance of linear, quadratic, and interactive effects. The lack-of-fit test was also obtained to evaluate the quality of the predicted models, while STATISTICA (StatSoft, Inc. Tulsa, OK, USA) was employed to create the response surface graphs once the second-order polynomial equation of the experiment data was completed. The desirability function was applied to the process of simultaneous optimization in order to focus on (1) the maximization of phenolic compounds, (2) the maximization of the antioxidant activity in terms of free radical scavenging (DPPH) [22], and (3) the maximization of the attribute liking score of the herbal tea. A contour plot was used to show the quality of the second-order polynomial model fit, since it clearly shows the relationship between experimental levels and responses for each of the study variables (p ≤ 0.05).

2.8. Model Verification

Predictive equations from RSM were used to verify the model employed to optimize the conditions for the extraction process of herbal tea, in which time and temperature were varied to maximize the levels of antioxidant activity, total polyphenol content and liking score > 6.0 [16,23]. Having determined the optimal conditions, the experiments were then conducted by applying these parameters in order to compare the actual results with the values predicted.

3. Results and Discussion

3.1. Model Fitting for RSM (Response Surface Methodology)

Table 3 shows the details of the RSM approach used to assess antioxidant activity (shown as inhibition %), total polyphenol content (shown as mgGAE/g), and attributes liking score when the roasted rice germ flavored herbal teas were involved in a series of 13 experiments based on a factorial design, including five center point replicates. The coefficients for the second degree polynomial equation were determined through the experimental results, along with the regression coefficient for the antioxidant activity (Y1), total polyphenol content (Y2), color liking score (Y3), odor liking score (Y4), flavor liking score (Y5), and overall liking score (Y6) evaluation. The equation presented as Equation (2) demonstrates the full quadratic model, while Table 3 shows the models predicting the response of independent variables (Y1–Y6).
To assess the extent to which the model fit the data, the coefficient of determination or (R2) was used. Bas and Boyaci [11] have suggested that for a good model fit, R2 should be more than 0.70. Antioxidant activity, total polyphenol content, flavor, and overall liking score were 0.941, 0.849, 0.758 and 0.816, respectively, indicating the adequacy of the model for these response variables, while the response of color and odor liking score were 0.499 and 0.633, respectively, indicating the insufficiency of the model for these response variables. Where the regression coefficient is large, and the p-value small, this would be indicative of greater significance for the effect upon that particular response variable [24]. A lack of fit test was then performed to assess the adequacy of the model for each of the responses. With a p-value in excess of 0.05 it was confirmed that the model provided an adequate fit for the experimental data, as shown in Table 3. From the 13 selected combinations of independent variables, the mean antioxidant activity was in the range of 59.55% to 71.47% inhibition, total polyphenol content was in the range of 61.22 to 78.52 mg GAE/g, taste liking score was in the range of 6.0 to 6.9, and the overall liking score was in the range of 5.9 to 6.9 as shown in Table 4.
It is widely accepted that a value in excess of 70% for the determination coefficient (R2) indicates the acceptability of a regression model to explain the effect of the independent variables (extraction time and temperature in this particular case) upon the dependent variables (in this study, DPPH, total polyphenol content, and attributes liking score) [11]. It may be noted that the use of experimental data within the range permitted by the variables in this study to create mathematical equations, which may have broader general applications, may lead to a capacity to predict the system behavior when different factors are combined. From the perspective of herbal tea companies, the potential exists to develop products that offer significant functional appeal, possibly on the basis of high levels of antioxidant activity and phenolic compound content with a good organoleptic property. Furthermore, such companies may be able to use the techniques outlined in this study to further test the effects of time and temperature, or indeed other conditions, as required.

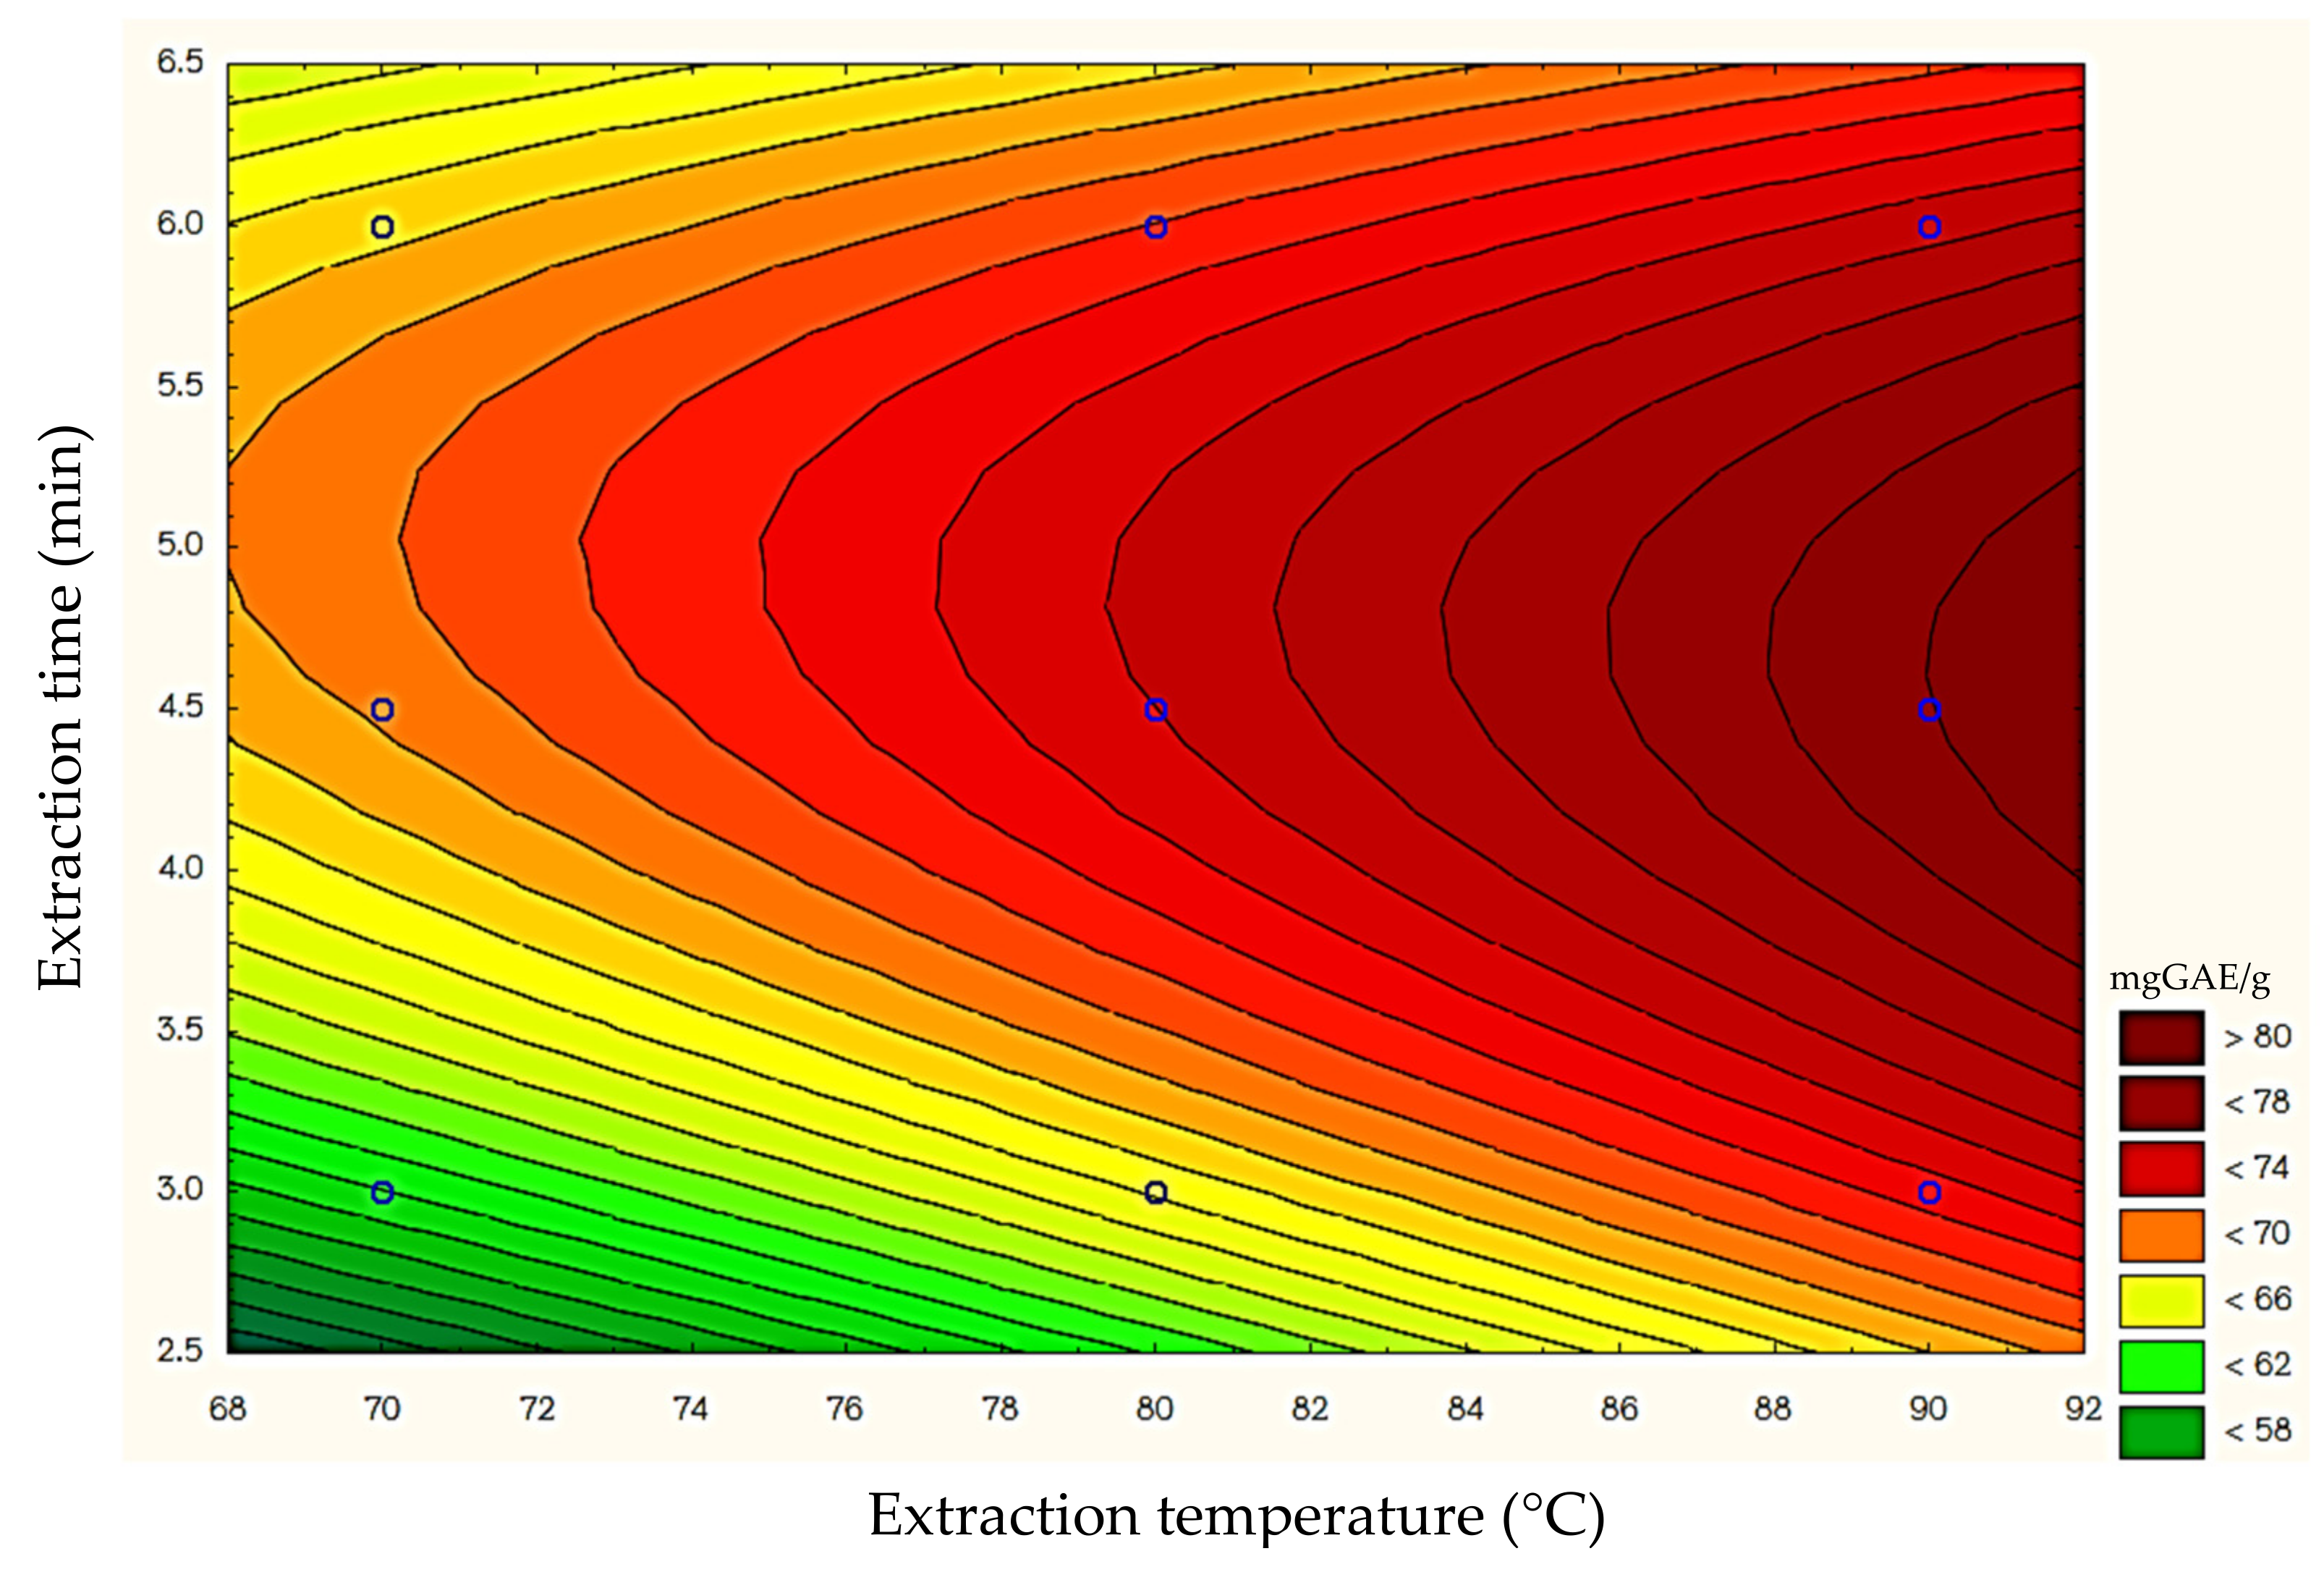
3.2. Effects of Extraction Temperature and Time on the Antioxidant Activity, Total Polyphenol Content, Flavor, and Overall Liking Score of Roasted Rice Germ Flavored Herbal Tea

In this study, the model is created in the form of a three-dimensional surface capable of indicating the responses, which in this case are the antioxidant activity, polyphenol content, flavor, and overall liking score. The use of the DPPH assay showed that time and temperature did exert a significant influence upon the antioxidant activity, while the polyphenol content was also significantly affected, as shown in Figure 1 and Figure 2. Figure 1 presents a contour plot showing the way time and temperature interact to control the antioxidant activity. When the temperature rises from 70 °C to 90 °C, and time is extended from 3 min to 5 min, the antioxidant activity was shown to increase, although no further changes were observed if the time was further extended beyond 5 min. Figure 2 shows the influence of the extraction time and temperature on the level of polyphenol content as the time increased from 3 min to 4.7 min. Under these conditions, raising the temperature from 70 °C to 90 °C resulted in a greater polyphenol content, but no further change was reported after the time was extended beyond 4.7 min.
Extraction time and temperature are common factors affecting the extraction of antioxidants from plant materials. Several studies were conducted to raise (not optimize) antioxidant extraction from medicinal herbs that provide antioxidant activity by using the one by one approach, that is, only one factor is tested to contribute to a higher content of total phenolic content and antioxidant activity [25]. This technique seems to be attractive, but does not render the interaction between factors that affect the responses, bringing about impractical optimization conditions. As regards RSM, it is designed to be the best statistical approach to assess the effect of different experimental factors and their linear and quadratic interactions on analytical response, and also to optimize and model the extraction conditions of phenolic compounds that array important antioxidant activity [9,17].
Nishiyama et al. [25] used the one by one approach to access the effect of the infusion time, type of packaging (in bulk or in bags), and process condition on the extraction of bioactive compounds from Brazilian green tea, and the authors verified that the use of herb in bulk with 5 min of extraction time was the most passable condition for the extraction of bioactive compounds. On the contrary, Bassani et al. [17] used the RSM to model the antioxidant extraction of roasted yerba-mate leaves as a function of time and temperature. The authors validated that the best experimental condition of those factors to maximize the antioxidant extraction for total phenolic content, total flavonoid content, and DPPH radical of roasted yerba-mate leaves was an extraction time of 10 min at 90 °C. Likewise, Wani et al. [9] used a user-defined design (UDD), followed by RSM analysis to maximize the extraction of sea buckthorn leaf as a herbal tea that presents a considerable antioxidant potential. For this study, the authors employed temperature and extraction time as independent variables and verified that the best combinations to obtain and optimize antioxidant extraction were 37.02 min at 74.20 °C.
Flavor and overall liking score were rated by 104 untrained panels. Fifty percent of participants were female. The participants were 63.4 ± 2.6 years of age, which was expected since the target consumers were pre-recruited. For flavor liking score, as the extraction temperature increased from 70 °C to 90 °C, the flavor liking score increased from 6.2 to 6.8 (Figure 3). In addition, the influence of extraction time and temperature on overall liking score is shown in Figure 4. When the temperature increases from 80 °C to 90 °C and the time increases from 4.5 min to 6.0 min, the overall liking score was shown to increase (liking score >6.5). These experiments allowed the creation of regression equations, which can be applied to determine the extracts from herbal tea under optimized conditions for antioxidant activity, total polyphenol content, flavor, and overall liking score. As a result, the flavor and overall liking score of herbal tea changed when different infusion temperatures and times were used. The roasted rice germ appends a nutty flavor that blends superbly with herbal tea. A similar result was found for green tea, as different water temperatures and durations of brewing resulted in the flavor of green tea. Increasing extraction temperature and time also provided increasing flavor, bitterness, astringency, etc. [26].

3.3. Extraction Process Optimization and Verification of the Predictive Model

As a consequence of this study, the conditions for the extraction process involving herbal tea could be optimized to achieve greater levels of antioxidant activity and total polyphenol content with maximized flavor and overall liking score. RSM was used to determine the optimal extraction time and temperature that would maximize the yield in the response variables. Figure 5 reveals that the optimal temperature was in the range of 86 °C to 90 °C, while for time, the optimum was in the range of 3.4 min to 5.9 min. This was shown to produce the maximum antioxidant activity in excess of 70% inhibition via DPPH assay, total polyphenol content in excess of 75 mgGAE/g, a flavor liking score in excess of 6.7 (like moderately), and an overall liking score in excess of 6.5 (like moderately). If the equation is used to make predictions, setting the temperature and the time for 6 points in the overlaid area (Figure 5), the outcome range of antioxidant activity, polyphenol content, flavor liking score, and overall liking score were 70.06% to 70.81% inhibition, 76.40 to 78.84 mgGAE/g, 6.9 to 7.0, and 6.7 to 6.8, respectively. All treatments closely match the experimental findings. Further verification analysis was then performed to validate the results for optimization produced through response surface analysis. Under the same process conditions, the respective values obtained antioxidant potential in the range of 70.89% to 72.98% inhibition, total polyphenolic content in the range of 75.23 to 79.78 mgGAE/g, a flavor liking score in the range of 6.7 to 6.9, and an overall liking score in the range of 6.5 to 6.9. Accordingly, the predictions and observations lay within a narrow range and showed no significant difference at the 5% significance level (ranging from 0.90 to 4.7) (Table 5), indicating the suitability of the model for optimization purposes [27].

4. Conclusions

In this research study, it was found that the model derived from the full factorial experimental design was capable of effectively achieving the optimization of the extraction process conditions to maximize the antioxidant activity, the total polyphenol content, and the attribute liking score of the roasted rice germ flavored herbal tea. It was confirmed that the optimal conditions involved an extraction temperature in the range of 86–90 °C and an extraction time in the range of 3.4–5.9 min. Under these conditions, the antioxidant activity was found to be >70 % inhibition for the DPPH radical, >75 mgGAE/g for total polyphenol content, >6.7 for flavor liking score, and >6.5 for overall liking score. The RSM was used effectively to determine the optimal extraction conditions for the roasted rice germ flavored herbal tea. The findings of this research provide useful insights into the potential for the modification of herbal tea products to maximize antioxidant activity, polyphenol content, flavor, and overall liking score through the adjustment of time and temperature conditions during the extraction process when preparing herbal tea.

Author Contributions

Conceptualization, S.R.; methodology, S.R. and R.C.; software, S.R. and N.C.; validation, S.R., W.S. and W.R.-n.; formal analysis, R.C. and N.C.; investigation, S.R. and W.R.-n.; data curation, S.R.; writing—original draft preparation, S.R.; writing—review and editing, S.R. and W.S.; visualization, S.R. and W.S.; supervision, S.R. All authors have read and agreed to the published version of the manuscript.

Funding

This research was funded by King Mongkut’s University of Technology North Bangkok. Contact no. KMUTNB-60-GOV-047.4.

Institutional Review Board Statement

Not applicable.

Informed Consent Statement

Not applicable.

Data Availability Statement

Data supporting reported resulted results are available upon request.

Acknowledgments

This work was supported by King Mongkut’s University of Technology North Bangkok. Contact no. KMUTNB-60-GOV-047.4.

Conflicts of Interest

The authors declare no conflict of interest.

References

  1. Craig, W.J. Health-promoting properties of common herbs. Am. J. Clin. Nutr. 1999, 70, 491s–499s. [Google Scholar] [CrossRef] [PubMed]
  2. Lazar, M.A. East meets West: An herbal tea finds a receptor. J. Clin. Investig. 2004, 113, 23–25. [Google Scholar] [CrossRef] [PubMed]
  3. Jansi, M.; Siripongvutikorn, S. Thunbergia laurifolia, a tradition herbal tea of Thailand: Botanical, chemical composition, biological properties and processing influence. Int. Food Res. J. 2016, 23, 923–927. [Google Scholar]
  4. Chan, E.W.C.; Eng, S.Y.; Tan, Y.P.; Wong, Z.C.; Lye, P.Y.; Tan, L.N. Antioxidant and sensory properties of Thai herbal tea with emphasis on Tunbergia laurifolia Lindl. Chiang Mai J. Sci. 2012, 39, 599–609. [Google Scholar]
  5. Naithani, V.; Nair, S.; Kakkar, P. Decline in antioxidant capacity of Indian herbal teas during storage and its relation to phenolic content. Food Res. Int. 2006, 39, 176–181. [Google Scholar] [CrossRef]
  6. Aoshima, H.; Hirata, S.; Ayabe, S. Antioxidative and anti-hydrogen peroxide activities of various herbal teas. Food Chem. 2007, 103, 617–622. [Google Scholar] [CrossRef]
  7. Speiky, H.; Rocco, C.; Carrasco, C.; Lissi, E.A.; Lopez-Alarcon, C. Antioxidant screening of medicinal herbal teas. Phytother. Res. 2006, 20, 462–467. [Google Scholar] [CrossRef]
  8. Eroglu, E.; Tontul, I.; Topuz, A. Optimization of aqueous extraction and spray drying conditions for efficient processing of hibiscus blended rosehip tea powder. J. Food Processing Preserv. 2018, 39, e13643. [Google Scholar] [CrossRef]
  9. Wani, T.A.; Wani, S.M.; Shah, A.G.; Masoodi, F.A. Optimizing conditions for antioxidant extraction from Sea Buckthorn leaf (Hippophae rhamoides L.) as herbal tea using response surface methodology (RSM). Int. Food Res. J. 2013, 20, 1677–1681. [Google Scholar]
  10. Uysal, S.; Cvetavovic, A.; Zengin, G.; Duravic, S.; Aktumsek, A. Optimization of the extraction process of antioxidants from loquat leaves using response surface methodology. J. Food Processing Preserv. 2016, 41, e13185. [Google Scholar] [CrossRef]
  11. Bas, D.; Boyaci, I.H. Modelling and optimization I: Usability of response surface methodology. J. Food Eng. 2007, 78, 836–845. [Google Scholar] [CrossRef]
  12. Salimi, A.; Maghsoudlou, Y.; Jafari, S.M.; Mahoonak, A.S.; Kashaninejad, M.; Ziaiifar, A.M. Preparation of lycopene emulsions by whey protein concentrate and maltodextrin and optimization by response surface methodology. J. Disper. Sci. Technol. 2014, 36, 274–283. [Google Scholar] [CrossRef]
  13. Sarfarazi, M.; Jafari, S.M.; Rajabzadeh, G. Extraction optimization of saffron nutraceuticals through response surface methodology. Food Anal. Methods 2015, 8, 2273–2285. [Google Scholar] [CrossRef]
  14. Wani, S.M.; Jan, N.; Wani, T.A.; Ahmad, M.; Masoodi, F.A.; Gani, A. Optimization of antioxidant activity and total polyphenols of dried apricot fruit extracts (Prunus armeniaca L.) using response surface methodology. J. Saudi Soc. Agric. Sci. 2017, 16, 119–126. [Google Scholar] [CrossRef] [Green Version]
  15. Tipduangta, T.; Julsrigival, J.; Chaithatwatthana, K.; Pongterdsak, N.; Tipduangta, P.; Chansakaow, S. Antioxidant properties of Thai traditional herbal teas. Beverages 2019, 5, 44. [Google Scholar] [CrossRef] [Green Version]
  16. Rittisak, S.; Charoen, R.; Pongsri, R.; Tearyakul, P.; Savedboworn, W.; Riansa-ngawong, W. Optimization of Herbal health tea flavored with roasted rice germ (Khao Dawk Mali 105) using response surface methodology. Malays. J. Anal. Sci. 2019, 23, 495–504. [Google Scholar]
  17. Bassani, D.C.; Nunes, D.S.; Granato, D. Optimization of phenolics and flavonoids extraction conditions and antioxidant activity of roasted Yerba-Mate leaves (Ilex paraguariensis A. St.-Hil., Aquifoliaceae) using response surface methodology. Ann. Brazil. Acad. Sci. 2014, 86, 923–933. [Google Scholar] [CrossRef] [Green Version]
  18. Thaipong, K.; Boonprokob, U.; Crosby, K.; Zevallos, L.C.; Byme, H.D. Comparison of ABTS, DPPH, FRAP and ORAC assays for estimating antioxidant activity from guava extracts. J. Food Compos. Anal. 2006, 19, 669–675. [Google Scholar] [CrossRef]
  19. Matthus, B. Antioxidant activity of extracts obtained from residues of different oilseeds. J. Agr. Food. Chem. 2002, 50, 3444–3452. [Google Scholar] [CrossRef]
  20. Peryam, D.R.; Pilgrim, F.J. Hedonic scale method of measuring food preferences. J. Food Sci. 1957, 11, 9–14. [Google Scholar]
  21. Joglekar, A.M.; May, A.T. Product excellence through design of experiments. Cereal Food. World 1987, 32, 857–868. [Google Scholar]
  22. Derringer, G.; Suich, R. Simultaneous optimization of several response variables. J. Qual. Technol. 1980, 12, 214–219. [Google Scholar] [CrossRef]
  23. Grosso, N.R.; Resurrecction, A.V.A. Prediction consumer acceptance rating of cracker-coated and roasted peanuts from descriptive analysis and hexanal measurements. J. Food Sci. 2002, 67, 1530–1537. [Google Scholar] [CrossRef]
  24. Quanhong, L.; Caili, F. Application of response surface methodology for extraction optimization of germinant pumpkin seeds protein. Food Chem. 2005, 92, 701–706. [Google Scholar] [CrossRef]
  25. Nishiyama, M.F.; Costa, M.A.F.; Costa, A.M.; Souza, C.G.M.; Boer, C.G.; Bracht, C.K.; Peralta, R.M. Brazilian green tea (Camellia sinensis var assamica): Effect of infusion time, mode of packaging and preparation on the extraction efficiency of bioactive compounds and on the stability of the beverage. Ciênc. Tecnol. Aliment. 2010, 30, 191–196. [Google Scholar] [CrossRef] [Green Version]
  26. Lee, J.; Chambers, D. Sensory descriptive evaluation: Brewing methods affect flavor of green tea. Asian J. Food Agro Ind. 2009, 2, 427–439. [Google Scholar]
  27. Granato, D.; Calado, V.M.A.; Jarvis, B. Observations on the use of statistical methods in food science and technology. Food Res. Int. 2014, 55, 137–149. [Google Scholar] [CrossRef]
Figure 1. Contour plot for antioxidant activity as a function of extraction temperature and time.
Processes 10 00125 g001
Figure 2. Contour plot for total polyphenol content as a function of extraction temperature and time.
Processes 10 00125 g002
Figure 3. Contour plot for flavor liking score as a function of extraction temperature and time.
Processes 10 00125 g003
Figure 4. Contour plot for overall liking score as a function of extraction temperature and time.
Processes 10 00125 g004
Figure 5. Overlaid contour plot showing the effect of the interaction of extraction temperature and time on antioxidant activity, total polyphenol content, flavor and overall liking score.
Processes 10 00125 g005
Table 1. Coded and uncoded level combinations of extraction temperature and time of roasted rice germ flavored herbal tea.
Test Run a No.Coded Level of Variable
Coded ValueUncoded Value
X1X2Extraction Temperature (°C)Extraction Time (min)
1−1−1703
2−10704.5
3−11706
40−1803
501806
61−1903
710904.5
811906
900804.5
1000804.5
1100804.5
1200804.5
1300804.5
Note: a Test runs were carried out randomly.
Table 2. The BIB (balance incomplete block design) of roasted rice germ flavored herbal tea infusion serving for panels.
No. of PanelNo. of Treatment
11427405366799212410
21528415467809323511
31629425568819434612
41730435669829545713
5183144577083965681
6193245587184976792
72033465972859878103
82134476073869989114
9223548617487100910125
102336496275881011011136
11243750637689102111217
12253851647790103121328
1326395265789110413139
Table 3. ANOVA (analysis of variance) for the surface quadratic model for antioxidant activity, total polyphenol content, and liking score of sensory attributes.
Quadratic Model of ResponsesSource of Variationp-Value
Y1: Antioxidant activity (R2 = 0.941)Model0.000 *
=13.8154 − 0.0474 X1 + 18.2173 X2 + 0.0058 X12 − 0.6695 X22 − 0.1327 X1X2Lack of fit0.957
Y2: Total polyphenol content (R2 = 0.849)Model0.009 *
=−50.3564 + 0.7944 X1 + 30.8394 X2 + 0.0008 X12 − 2.4005 X22 − 0.0949 X1X2Lack of fit0.100
Y3: Color liking score (R2 = 0.499)Model0.332
=19.6621 − 0.3459 X1 − 0.1253 X2 + 0.0024 X12 + 0.0621 X22 − 0.0050 X1X2Lack of fit0.053
Y4: Odor liking score (R2 = 0.633)Model0.141
=17.9345 − 0.2941 X1 + 0.0008 X2 + 0.0018 X12 − 0.0322 X22 + 0.0033 X1X2Lack of fit0.142
Y5: Flavor liking score (R2 = 0.758)Model0.040 *
=8.1069 − 0.1148 X1 + 0.7713 X2 + 0.0012 X12 + 0.0069 X22 − 0.0100 X1X2Lack of fit0.260
Y6: Overall liking score (R2 = 0.816)Model0.017 *
=5.5770 − 0.0905 X1 + 1.4958 X2 + 0.0010 X12 − 0.0674 X22 − 0.0100 X1X2Lack of fit0.114
Note: * Statistically significant (p ≤ 0.05).
Table 4. Factorial design arrangement and response of the dependent variables to extraction process conditions (independent variables).
Test Run a No.Independent VariablesDependent Variables
Ex. Temp. (°C)Ex. Time (min)Antioxidant Activity (% Inhibition)Total Polyphenols (mgGAE/g)Liking Score
ColorOdorFlavorOverall
X1X2Y1Y2Y3Y4 Y5Y6
170359.55 ± 1.0561.22 ± 1.776.3 ± 1.66.5 ± 1.46.0 ± 1.25.9 ± 1.1
2704.566.10 ± 0.4065.46 ± 1.036.5 ± 1.36.4 ± 1.26.2 ± 1.66.2 ± 1.2
370668.47 ± 1.9070.15 ± 0.616.4 ± 0.96.3 ± 1.56.4 ± 1.46.4 ± 1.0
480364.54 ± 1.3365.22 ± 1.026.4 ± 1.26.3 ± 1.46.4 ± 1.66.1 ± 1.6
580668.85 ± 2.1167.81 ± 0.526.8 ± 1.56.3 ± 1.26.5 ± 1.26.5 ± 1.1
690369.53 ± 0.5272.18 ± 0.346.7 ± 1.46.4 ± 1.56.7 ± 1.26.5 ± 1.3
7904.571.47 ± 0.4278.52 ± 0.956.9 ± 1.46.7 ± 1.56.9 ± 1.16.9 ± 1.2
890670.48 ± 1.7375.42 ± 0.626.5 ± 1.76.4 ± 1.06.5 ± 1.46.4 ± 1.5
9804.568.64 ± 1.3676.04 ± 0.186.2 ± 1.56.3 ± 1.36.2 ± 1.36.4 ± 1.0
10804.567.19 ± 0.6974.59 ± 1.195.9 ± 1.46.2 ± 1.36.4 ± 1.16.3 ± 1.4
11804.568.44 ± 0.4974.78 ± 0.646.1 ± 1.66.3 ± 1.76.1 ± 0.96.3 ± 1.5
12804.569.27 ± 1.6176.70 ± 0.796.1 ± 1.36.3 ± 1.36.4 ± 1.26.3 ± 1.3
13804.566.19 ± 0.5972.18 ± 1.826.3 ± 1.86.4 ± 1.66.3 ± 1.36.5 ± 1.6
Note: a Test runs were carried out randomly. Ex. Temp. = Extraction Temperature; Ex. Time = Extraction Time.
Table 5. The verification tests of the fitted model.
Extraction ProcessEx. Temp. (°C)Ex. Time (min)Antioxidant Activity (%)Total Polyphenol Content (mgGAE/g)
Predicted ValueObserved ValueError (%)Predicted ValueObserved ValueError (%)
Point no. 1874.570.0670.89 ± 0.521.1877.8379.02 ± 0.931.53
Point no. 2875.570.0471.01 ± 1.201.3976.4078.53 ± 0.852.78
Point no. 3885.070.5271.83 ± 0.861.8678.1776.81 ± 0.681.75
Point no. 4894.070.4572.12 ± 0.322.3677.8575.23 ± 1.453.36
Point no. 5894.570.8172.55 ± 0.652.4578.8479.55 ± 0.790.90
Point no. 6895.570.5272.98 ± 1.053.4877.2379.78 ± 1.033.30
Extraction ProcessEx. Temp. (°C)Ex. Time (min)Flavor Liking ScoreOverall Liking Score
Predicted ValueObserved ValueError (%)Predicted ValueObserved ValueError (%)
Point no. 1874.56.96.7 ± 1.12.96.76.8 ± 1.21.1
Point no. 2875.56.96.8 ± 1.31.06.76.5 ± 0.92.6
Point no. 3885.06.96.6 ± 1.14.76.86.5 ± 1.13.7
Point no. 4894.07.06.8 ± 1.43.36.86.6 ± 1.42.8
Point no. 5894.57.06.9 ± 1.51.46.86.6 ± 1.53.0
Point no. 6895.57.06.9 ± 1.30.76.76.9 ± 1.32.4
Note: Ex. Temp. = Extraction Temparature; Ex. Time = Extraction Time.
Publisher’s Note: MDPI stays neutral with regard to jurisdictional claims in published maps and institutional affiliations.

