Article

Smart Energy Transition: An Evaluation of Cities in South Korea

1
Erasmus Graduate School of Social Science and Humanities (EGSH), Erasmus University, 3062 PA Rotterdam, The Netherlands
2
Erasmus School of Social and Behavioural Sciences (ESSB), Erasmus University, 3062 PA Rotterdam, The Netherlands
3
Institute for Housing and Urban Development Studies (IHS), Erasmus University, 3062 PA Rotterdam, The Netherlands
*
Author to whom correspondence should be addressed.
Informatics 2019, 6(4), 50; https://doi.org/10.3390/informatics6040050
Submission received: 5 October 2019 / Revised: 31 October 2019 / Accepted: 4 November 2019 / Published: 6 November 2019

Abstract

:
One positive impact of smart cities is reducing energy consumption and CO2 emission through the use of information and communication technologies (ICT). Energy transition pursues systematic changes to the low-carbon society, and it can benefit from technological and institutional advancement in smart cities. The integration of the energy transition to smart city development has not been thoroughly studied yet. The purpose of this study is to find empirical evidence of smart cities’ contributions to energy transition. The hypothesis is that there is a significant difference between smart and non-smart cities in the performance of energy transition. The Smart Energy Transition Index is introduced. Index is useful to summarize the smart city component’s contribution to energy transition and to enable comparison among cities. The cities in South Korea are divided into three groups: (1) first-wave smart cities that focus on smart transportation and security services; (2) second-wave smart cities that provide comprehensive urban services; and (3) non-smart cities. The results showed that second-wave smart cities scored higher than first-wave and non-smart cities, and there is a statistically significant difference among city groups. This confirms the hypothesis of this paper that smart city development can contribute to the energy transition.

1. Introduction

Smart cities are neo-trend in the urban planning field that strives for comprehensive urban management and high quality of life [1,2]. The major component of smart cities is advanced technology, such as information and communication technologies (ICT), Internet of Things (IoT), big data analytics, cloud computing, social networks, and artificial intelligence [3,4,5,6]. Smart cities exploit these technologies to provide benefits to citizens. The embedded technology in smart cities enables gathering, processing, and sharing big data so that informed decision-making is possible [5], which eventually enhances efficiency of urban services [7]. Meanwhile, these core technologies are already applied in various urban sectors apart from smart city development. For example, IoT is used to gather energy consumption data so that it can aid optimizing energy distribution and consumption [4]. Since smart cities are a holistic approach to make cities a better place, employing smart city development is significant to the energy system. The urban energy system needs to move towards a low-carbon system because cities are responsible for major energy consumption and CO2 emission [8]. This movement is called energy transition [9], which requires a change in both energy supply and demand [10].
Technologies can benefit energy transition. For example, CO2 can be converted to clean fuels with wireless control [11]. A hybrid energy system that uses multiple renewable energy sources can be applied to reduce CO2 emission, which can be automated by a neural network that enables self-learning [12]. On the demand side, passive buildings are designed energy efficiently from the outset to automatically reduce energy consumption. ICT can be used to sense and monitor energy usage in buildings so that people can reduce energy consumption [13]. For transportation, an automatic vehicle location system which is enabled by a Global Positioning System (GPS) can be applied to reduce fuel consumption and travel time [14], and sharing transport data can reduce congestion [15]. The use of core technologies in a smart city can increase energy efficiency and contribute to reducing energy consumption and CO2 emission [16,17] which in the end, supports the energy transition. Since the smart city and the energy transition share some common aspects, a smart city development can contribute to the energy transition.
There are studies on technological solutions such as big data analytics, self-learning, hybrid power systems for energy transition [7,11,12] and IoT, data management and governance, and a living lab for smart city development [3,4,5,18]. These studies provide valuable ideas on an improved energy system and more efficient data management for smart cities. However, they have not been evaluated from a holistic view of smart city planning. A smart city is more than an application of technology [19]. It also pursues innovation in governance and community [15,20] and comprehensive urban development. This paper focuses on the impact of the smart city development, particularly on the urban energy system and energy transition, within the view of urban planning. The major hypothesis is that smart city planning can contribute to energy transition and there is a significant difference between smart and non-smart cities in the performance of energy transition.
South Korea is an interesting case for this purpose because there has been a nation-wide effort for smart city development as holistic urban planning. The South Korean government invested in digitalization and ICT implimentation since the early 2000s, announced the Ubiquitous-City (U-City) plan in 2004, and established the first smart city in Songdo in 2009. As for energy transition, the government set a smart grid testbed in Jeju Island in 2010. These efforts are not evaluated yet, and we intend to compare smart and non-smart cities in South Korea to identify the results of smart city developments in energy transition. The remainder of this paper consists of the following approach. First, we build a conceptual framework on smart city and energy transition. After reviewing the literature on smart city and energy transition, we link them and develop evaluation criteria to construct an index. Second, we introduce South Korea’s planning history and policies regarding smart city development and energy transition. Then, we move on to our analysis, introducing the data collection, analysis methods and results. Finally, we conclude with a summary of the analysis and discussion.

2. Smart City and Smart Energy System

2.1. Smart City Concept

The smart city concept is fragmented and not (yet) agreed upon among scholars because each study has a different focus [21]. Recently, Kummitha and Crutzen [22] conducted a systematic literature review and categorized four different focuses on the concept: (1) restrictive; (2) reflective; (3) rationalistic or pragmatic; and (4) critical. Restrictive and reflective views both emphasize technology (mainly ICT), data management, and IoT. The difference is the view on human capital. According to the restrictive view, human capital remains the same despite technological advancement. In contrast, the reflective view sees human capital can be improved through the technology. The rationalistic view positions human capital as a major driver of smart city development. Human capital interacts with technology and creates a smart city. Finally, the critical view argues that smart cities enlarge gaps between haves and have-nots and only benefit the elites. In this paper, we take the rationalistic or pragmatic view towards the smart city concept. We think both technology and human capital play an important role in the formation of a smart city.
A smart city is an urban planning method that aims to achieve sustainable development and high quality of life [2,23,24,25]. The core components of a smart city are technology, community, and policy and these three main components work together to achieve the desired outcomes [21]. A smart city is a process to achieve balanced and sustainable development [26]. In that process, the city’s attributes (e.g., population, economic status, existing infrastructures) become assets that interact with the three core components to create solutions for environmental, social, economic, and governance problems [1,27,28].
Technology represents mainly ICT such as sensors, broadband and wireless networks, and mobile devices [29,30]. ICT functions as an enabler and facilitator of various actions and innovations in the smart city [2]. ICT-embedded infrastructures enable gathering, processing, storing and sharing of real-time information. Such technologies create a ubiquitous connection between the stakeholders and infrastructures [2,31]. Information sharing and communication can be utilized for better urban services. The accessibility and availability of ICT in each urban sector represent important indicators of being smart [2]. IoT, cloud computing, artificial intelligence, and big data are major examples of ICT in a smart city [3]. However, a smart city is more than having cutting-edge technology [19]. Technology is a prerequisite that facilitates collaboration and cooperation among government agencies, community, businesses, and other stakeholders so that they can find an innovative solution to local problems and pursue sustainable growth [2]. In that sense, community and policy play an important role in shaping a city into a smart one.
A smart community pursues creativity, social learning, inclusiveness, cooperation, and democratic decision-making [2]. It identifies and brings the problems to planning process for better services and citizen-centric decision-making [32,33]. For that social networks, online participatory tools, and e-governance can be utilized to encourage communities to join and enables mutual communication [23,34,35]. The living lab is an example of a user-driven innovation that fosters citizen involvement in service development [18,29]. Inevitably, citizens need the ability to exploit ICT infrastructure [33]. This may result in a digital divide [36], but inclusive governance can empower citizens through various training [33].
Policy paves environments in which technology can be applied and implemented in desired places and include the community in the planning process. This includes investment in R&D for ICT infrastructure, providing learning programs for citizens who are not used to ICT devices, and maintaining a good relationship with communities and businesses. The policy is not limited to regulations, laws or legislation [21], it represents a favorable governance environment for smart city development. In the smart city, e-governance shows the capacity of the government to collaborate with inter-departments, citizens, and businesses via online participatory tools [2] to improve public services [37,38].
As these three components interact together, desirable outcomes are generated in smart cities. We are especially interested in the outcomes in the environmental sector. Since the major objectives of smart city development include achieving energy efficiency and environmental sustainability [39], the energy sector can be considered the main domain that constitutes a smart city [40]. The energy sector in the smart city focuses on reducing energy consumption and CO2 emission [14,15], which is closely related to energy transition to a low-carbon society. In the next section, we introduce current challenges in energy transition and need for integraing the smart city development and the energy transition.

2.2. Energy Transition and Smart Energy System

The energy system faces challenges, such as intermittency of renewable energy sources, high demand, and pressure to reduce CO2 emission. It is efficient to tackle these challenges in a holistic manner rather than treating them separately [41]. A radical change is desired because of a technological lock-in to the unsustainable energy system, which relay on the limited amount of fossil fuel [42]. This change, the energy transition, is a shift to a low-carbon society [43]. It requires utilizing renewable energy sources, developing efficient storage and distribution technology and strategies, and consuming less energy in daily life [9]. This system-wide change can be achieved with smart city development, which itself is a comprehensive change in the urban system.
The energy system consists of generation, distribution and storage, and consumption and smart city technologies can contribute to each process to increase energy efficiency [44] and reduce CO2 emission [41]. For energy generation, hybrid renewable energy sources can be introduced to tackle the intermittency issue and it can be optimized with an intelligent power controller [12]. Small-scale energy production plants such as solar panels can be installed at homes and offices [45]. The smart grid enables real-time and interactive information sharing on energy production and consumption [41]. It consists of advanced metering infrastructures, energy storage systems, intelligent energy management systems, big data analytics that enable optimization of energy use on-demand, and enhances stable energy distribution. Energy consumption patterns can be monitored through smart metering and accumulated data can aid better decision-making [5,7].
The common ground of energy transition and a smart city is the data derived from ICT infrastructure. Big data management is important but there are barriers in implementation [6,7,45]. A universal platform is needed to share the data which increases implementation expenses. Lack of institutional capacity forces external experts to join and this makes decision-making even complex [7,45]. Most of the time, data collection is operated at a national level, which is not a suitable localized solution [7]. These barriers can be overcome by smart city planning, which is more than the technology itself. Smart city planning can provide a clear and long-term vision, a consistent policy environment, and encourage collaboration among the stakeholders [45].

2.3. Theoretical Framework

As the energy system changes, the stakeholders’ roles are also changing. The government’s role has expanded from energy producer to comprehensive system manager. The government produces energy, promotes innovation in technology, and facilitates citizen participation in a sustainable energy system. The community’s role has also expanded from energy consumer to energy producer using a smart grid system. Table 1 compares smart city components’ contributions to the energy system under both the traditional and the new system. The first column shows three smart city components and the first row shows three domains of the energy system.
The main hypothesis is that a difference exists between smart and non-smart cities regarding performance in the energy system. To check the hypothesis, evaluation criteria are developed as shown in Table 2. Technology includes renewable energy and a smart grid system. The community’s contributions are civil initiatives in the energy sector, energy consumption, and participation in energy-saving behavior. Finally, policy includes an R&D budget for technology and rules and regulations on energy systems.
Another aspect to consider in smart city development is the city’s inherent attribute. Each city has different urban characteristics (e.g., population and density, the local government’s ability and economic status) that influence smart city development. For example, a certain population threshold and density are desirable in implementing ICT infrastructure. Additionally, a high density increases the possibility of an agglomeration economy that can foster innovation [46]. The local government’s ability to plan and execute the smart city development is important [33] as stable financing and consistent policy can support the development process. The existing built environment shows reserve space for the potential development of the city. The economic status of the city influences people’s accessibility and affordability to smart services. These aspects equate to the potential inherent smartness of the city. We use the term ‘inherent smartness’ because these characteristics are not the result of smart city development. Rather, they are the assets accumulated over time, along each city’s development path. These variables are not the measure of smart energy transition, but they are included in the analysis to demonstrate each city’s relative inherent smartness which may influence the smart energy transition.

3. Smart City Development in South Korea

3.1. Smart City and Energy Policy

Smart city development is one of the national development strategies in President Moon’s administration [47]. Smart city development in South Korea started with informatization and digitalization, following the generalization of the internet in the early 2000s. The government then initiated the U-Korea Plan (2006–2010) and the U-City Plan (2009–2012) and launched 55 U-City projects (45 cities if duplicated projects in the same cities are deducted). ‘U’ stands for ubiquitous technology that enables unlimited network accessibility anywhere and anytime. The official initiation of U-City was 2006 when the Ministry of Information and Communication and the Ministry of Construction and Transportation signed an memorandum of understanding (MOU) on U-City development. The main focus of the U-City was on technology and infrastructure (e.g., ubiquitous sensor network, wireless sensor network, CCTV, fast internet network, mobile environment, and public Wi-Fi). The sensors are implemented in roads, rivers, and major facilities to facilitate management. U-City provides service mainly on transportation information and security (surveillance through CCTV and emergency response).
At the same time, the government started to prepare for energy transition under the ‘Low Carbon Green Growth’ agenda. Aligning with the global trend, the government focused on sustainable economic development, especially green and eco-friendly transportation. The government launched the Guideline for Low-Carbon Green City (2009) focusing on the development of low-carbon green cities to overcome the climate change crisis. The Low-Carbon Green Growth Law (2010) was enacted to regulate compact cities, mixed land use, public transportation, new and renewable energy use, and the water and resource cycle. Additionally, the government initiated the National Smart Grid Vision (2009) and the National Smart Grid Roadmap (2010). At a glance, the government’s smart city and energy transition efforts seem to be separated. They both fall under the Low-Carbon Green City agenda but U-City is focused on technology and on transportation and security infrastructure while the low-carbon green city projects focus on purifying and restoring the natural environment and promoting renewable energy. In addition, the government used energy transition as a means of economic development, ignoring actual energy transition within the general society [48].
U-City is a Korean prototype of a smart city. As the smart city concept evolved into a comprehensive urban management platform, the Korean government also expanded its U-City concept. The term ‘smart city’ slowly took over ‘U-City’ by the governments. Table 3 shows occurrences of the term ‘smart city’ and ‘U-City (or U-eco city)’ in the government’s policy news, press releases, and policy documents collected from www.korea.kr. There is a clear transition from U-City to smart city according to the government. U-City began to appear in 2004 and has been in use since 2005 in press releases. The term ‘smart city’ was less used than ‘U-City’ but in some news articles or documents, both were used. Since President Park Geun-hye, ‘smart city’ has become the dominant term.
Table 4 summarises the major difference between the U-City and smart city. Both U-City and smart city utilize technology but U-City focuses on the technology itself while the smart city focuses on technological functionality. U-City focuses on connected infrastructure while the smart city pays attention to human and social capital. The U-City’s goal is urban informatization (i.e., implementing technology for efficiency). In contrast, the smart city’s aim is urban intelligence (i.e., making the technology more accessible to the general public). When there is an urban problem, U-City tends to follow ready-made procedures, but the smart city diagnoses the problem and prescribes a solution based on the data. The initiatives show difference, evolving from a government-led, city-focused, top-down manner to a multi-stakeholder-led, citizen-focused, bottom-up manner. The citizen role has also expanded from mere service users to active service developers. Based on the lessons learned from U-City development, the South Korean smart city tries to provide multiple urban services and to include citizens and other parties.

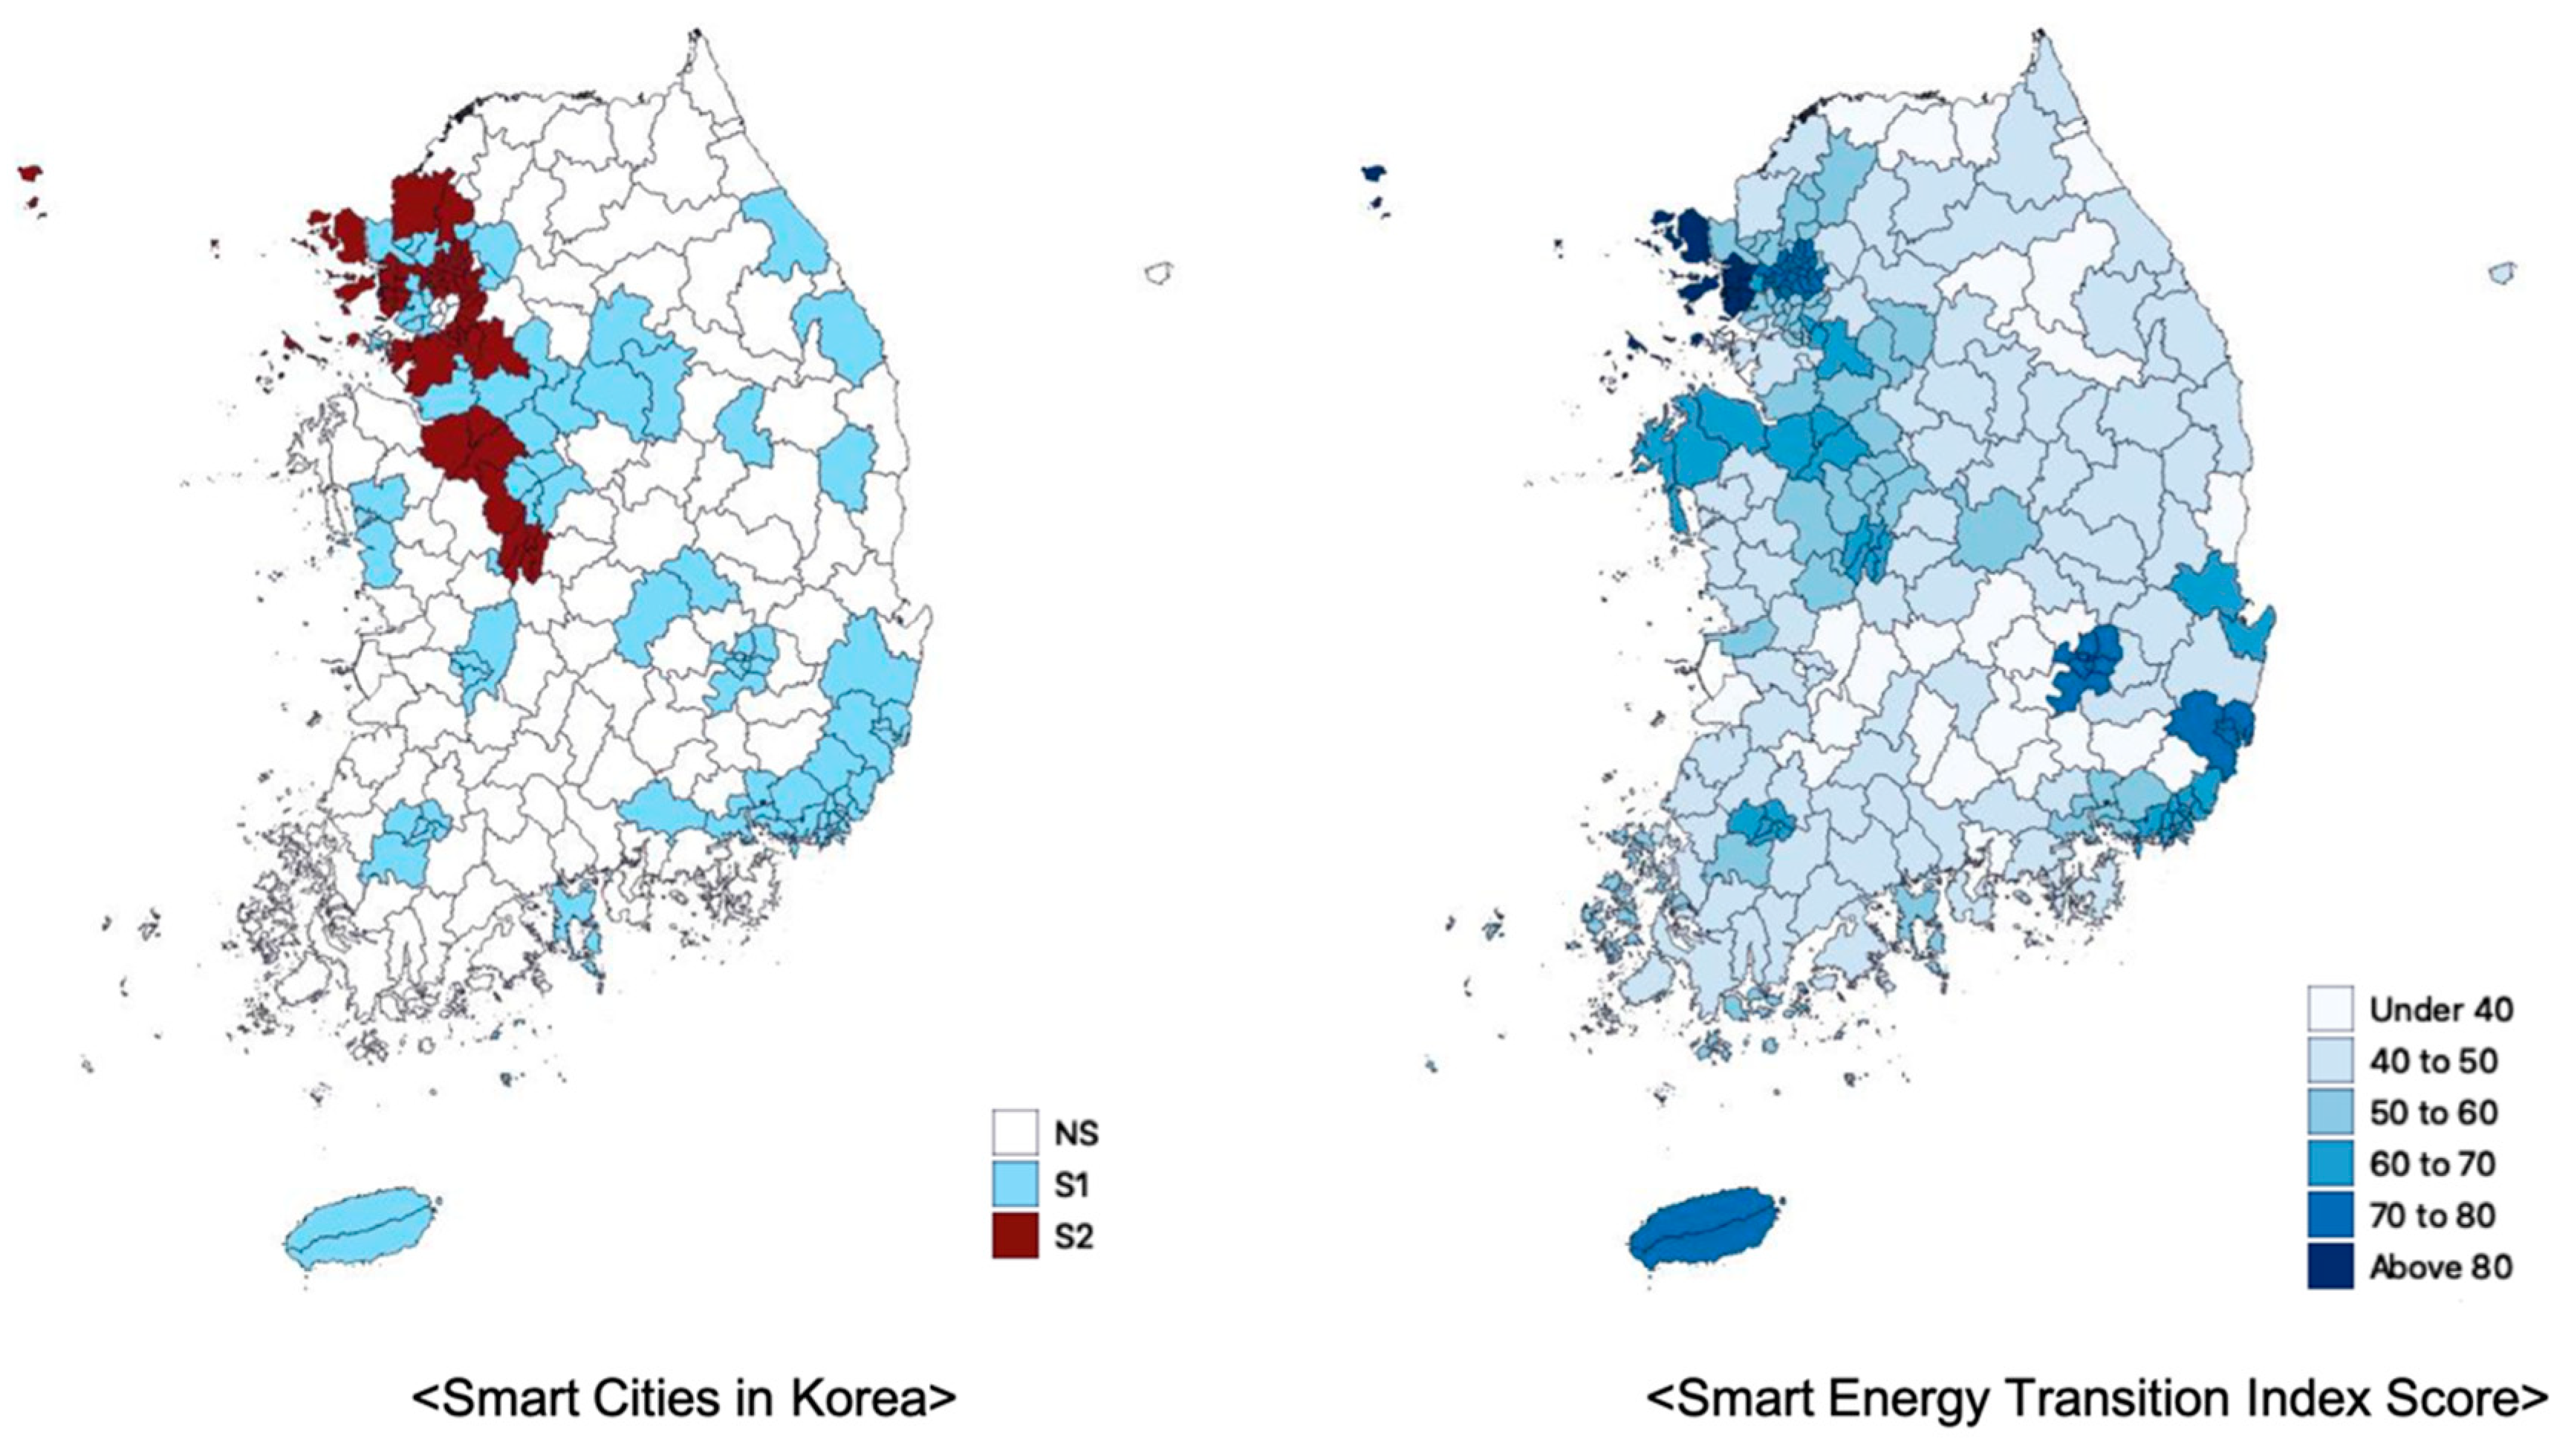
3.2. Smart Cities in South Korea

Administrative districts in South Korea consist of one special city, six metropolitan cities, eight provinces, one special autonomous city, and one special autonomous province (see Figure 1). The table in Figure 1 shows administrative districts in South Korea. The hierarchy of districts is Si/Do, Si/Gun/Gu, and Eup/Myeon/Dong. Si/Do represents special and metropolitan cities (Si) and provinces (Do). Si/Gun/Gu consists of sub-districts of Si/Do. Si and Gun are sub-districts of Do (provinces) and Gu is a sub-district of Si (Here, Si includes Special City, Metropolitan Cities, Special Autonomous City and cities (Si) under provinces (Do) that have a population of more than 500,000 people). The difference between Si and Gun is one of population, wherein the criterion is 50,000 people. Eup/Myeon/Dong are sub-districts of Si/Gun/Gu. Here, we considered both Si and Gun as ‘a city’ (including the special city, metropolitan cities, the special autonomous city and cities under provinces). Including Seoul, Sejong, and Jeju, six metropolitan cities and 75 Si and 77 Gun, a total of 161 areas are considered as cities for data analysis.
Cities in South Korea can be categorized into three types as follows (see Table 5):
  • First-wave smart city (SC1): U-Cities developed from 2009 to 2013 and smart city projects by LH and local governments focusing on transportation and security sectors.
  • Second-wave smart city (SC2): Smart city projects providing comprehensive urban management services, including transportation information, facility management, security and disaster prevention, health and welfare, administration, and environment (including ongoing smart city projects.
  • Non-smart cities (NSC): None of the above.

4. Methodology

4.1. Methods and Limitation

An index is commonly used to quantitatively measure certain phenomenon [50], in this case, smart energy transition. We adopted this method to summarise various smart city’s contributions to energy transition that can ease the comparison and provide the relative position of cities at a glance. There are several limitations of this method, first the data may not be available for all indicators. This can be overcome by introducing alternative indicators or using existing data according to the indicator. For example, some of the variables lack the city level data but provincial data (accumulation of city data) was available. In this case, we use the average of provincial data (provincial data divided by the number of cities in that province) as the city data. Additionally, the index may over-simplify the phenomenon and mislead policy decision-making. However, a well-constructed index based on sound theories can provide insights on the overall tendency of the phenomenon that can support decision-making [50].
The methods are as follows. First, based on literature we introduce a smart energy transition index and its variables. The variables are aggregated with an equal weighting scheme based on the assumption from the literature. Then, descriptive analysis is operated showing the top 10 and bottom 10 cities to show a general tendency of the index. Then, the index of three city groups are compared to check the statistical significance. A sensitivity analysis is carried out to see the effect of altered variables due to data availability. Finally, the correlation between the index and urban characteristic variables is conducted.

4.2. Constructing a Smart Energy Transition Index

The Smart Energy Transition Index was developed based on the theoretical framework in Section 2, having indicators in Table 6. Due to the limited data source, we had to alter some of the indicators which are marked with an asterisk (*). The following bullet points indicate how the data was collected and treated.
  • Renewable energy production *: There is provincial-level data on renewable energy production but not at the city-level. We divided provincial data by the number of cities in each province. Renewable energy sources include solar, photovoltaic, wind, hydro, geothermal, and biomass power.
  • Smart grid *: The data available for a smart grid is the energy storage system (ESS) and advanced metering infrastructure (AMI) supply which are available at provincial level so we divided the data by the number of cities in each province. In addition, we found data on smart grid projects at smartgrid.or.kr. as well as ESS projects from DOE Global Energy Storage Database. We use multiple sources of data to triangulate the smart grid penetration.
  • Civil initiatives in the energy sector: There are three forms of civil initiatives: cooperatives, social enterprise, and town enterprise. It is possible to access the full list of these initiatives and extract the ones specializing in the renewable energy sector. Most of them support residents in installing or renting solar paneling.
  • Energy-saving behaviors *: This represents how much people try to reduce energy consumption in their daily lives. The data comes from the social survey which asks whether people try to use public transportation, participate in recycling, use fewer disposable goods, buy eco-friendly goods, and participate in energy conservation campaigns. These questions are asked on a scale of 1 to 5 with 5 being they are always participating and 1 being never or not interested. All provinces except for Gangwon, Chungnam, Jeonnam, and Gyeongnam have city-level data on each energy conservation behavior (n = 87). Gangwon, Chungnam, Jeonnam, and Gyeongnam (n = 74) provide only provincial-level data. It is risky to remove all missing cases, so we used provincial-level data as each city’s data.
  • Energy consumption per capita: Energy consumption means electricity use. The Korean Statistical Information Service (KOSIS) provides city-level data on electricity usage and is divided into four purposes of use: home, public, service, and industry. We excluded industrial (agriculture, fisheries, forestry and mining, and manufacture) electricity use because those facilities are usually built outside the city. Only home, public, and service usage are considered. The total amount of electricity consumption is divided by the population.
  • R&D budget for technology: The percent of R&D budget earmarked for technology (technology development, R&D and scientific technology in general) in the local government’s annual budget is used.
  • Rules and regulations: Elis.go.kr provides a full list of each city’s current ordinances, rules, and regulations. We count the number of ordinances and rules that are related to energy. The titles that frequently appeared include ‘Energy Basic Ordinance’, ‘Ordinance on Green Roof’, ‘Ordinance on Response to Climate Change’, ‘Ordinance on Low-Carbon Green Growth’, and ‘Ordinance on Renewable Energy Provision’.
  • Urban characteristics: As discussed in Section 2.3, the variables of the inherent smartness of the city are included in the analysis. These variables are population, financial independence ratio (FIR), gross regional domestic production (GRDP) per capita, and urbanized area per capita. The population represents the city’s size while GRDP per capita represents the economic status of the city. FIR shows to what extent the local government has the financial means to provide public services and the urbanized area represent the urban infrastructure and density of the city.
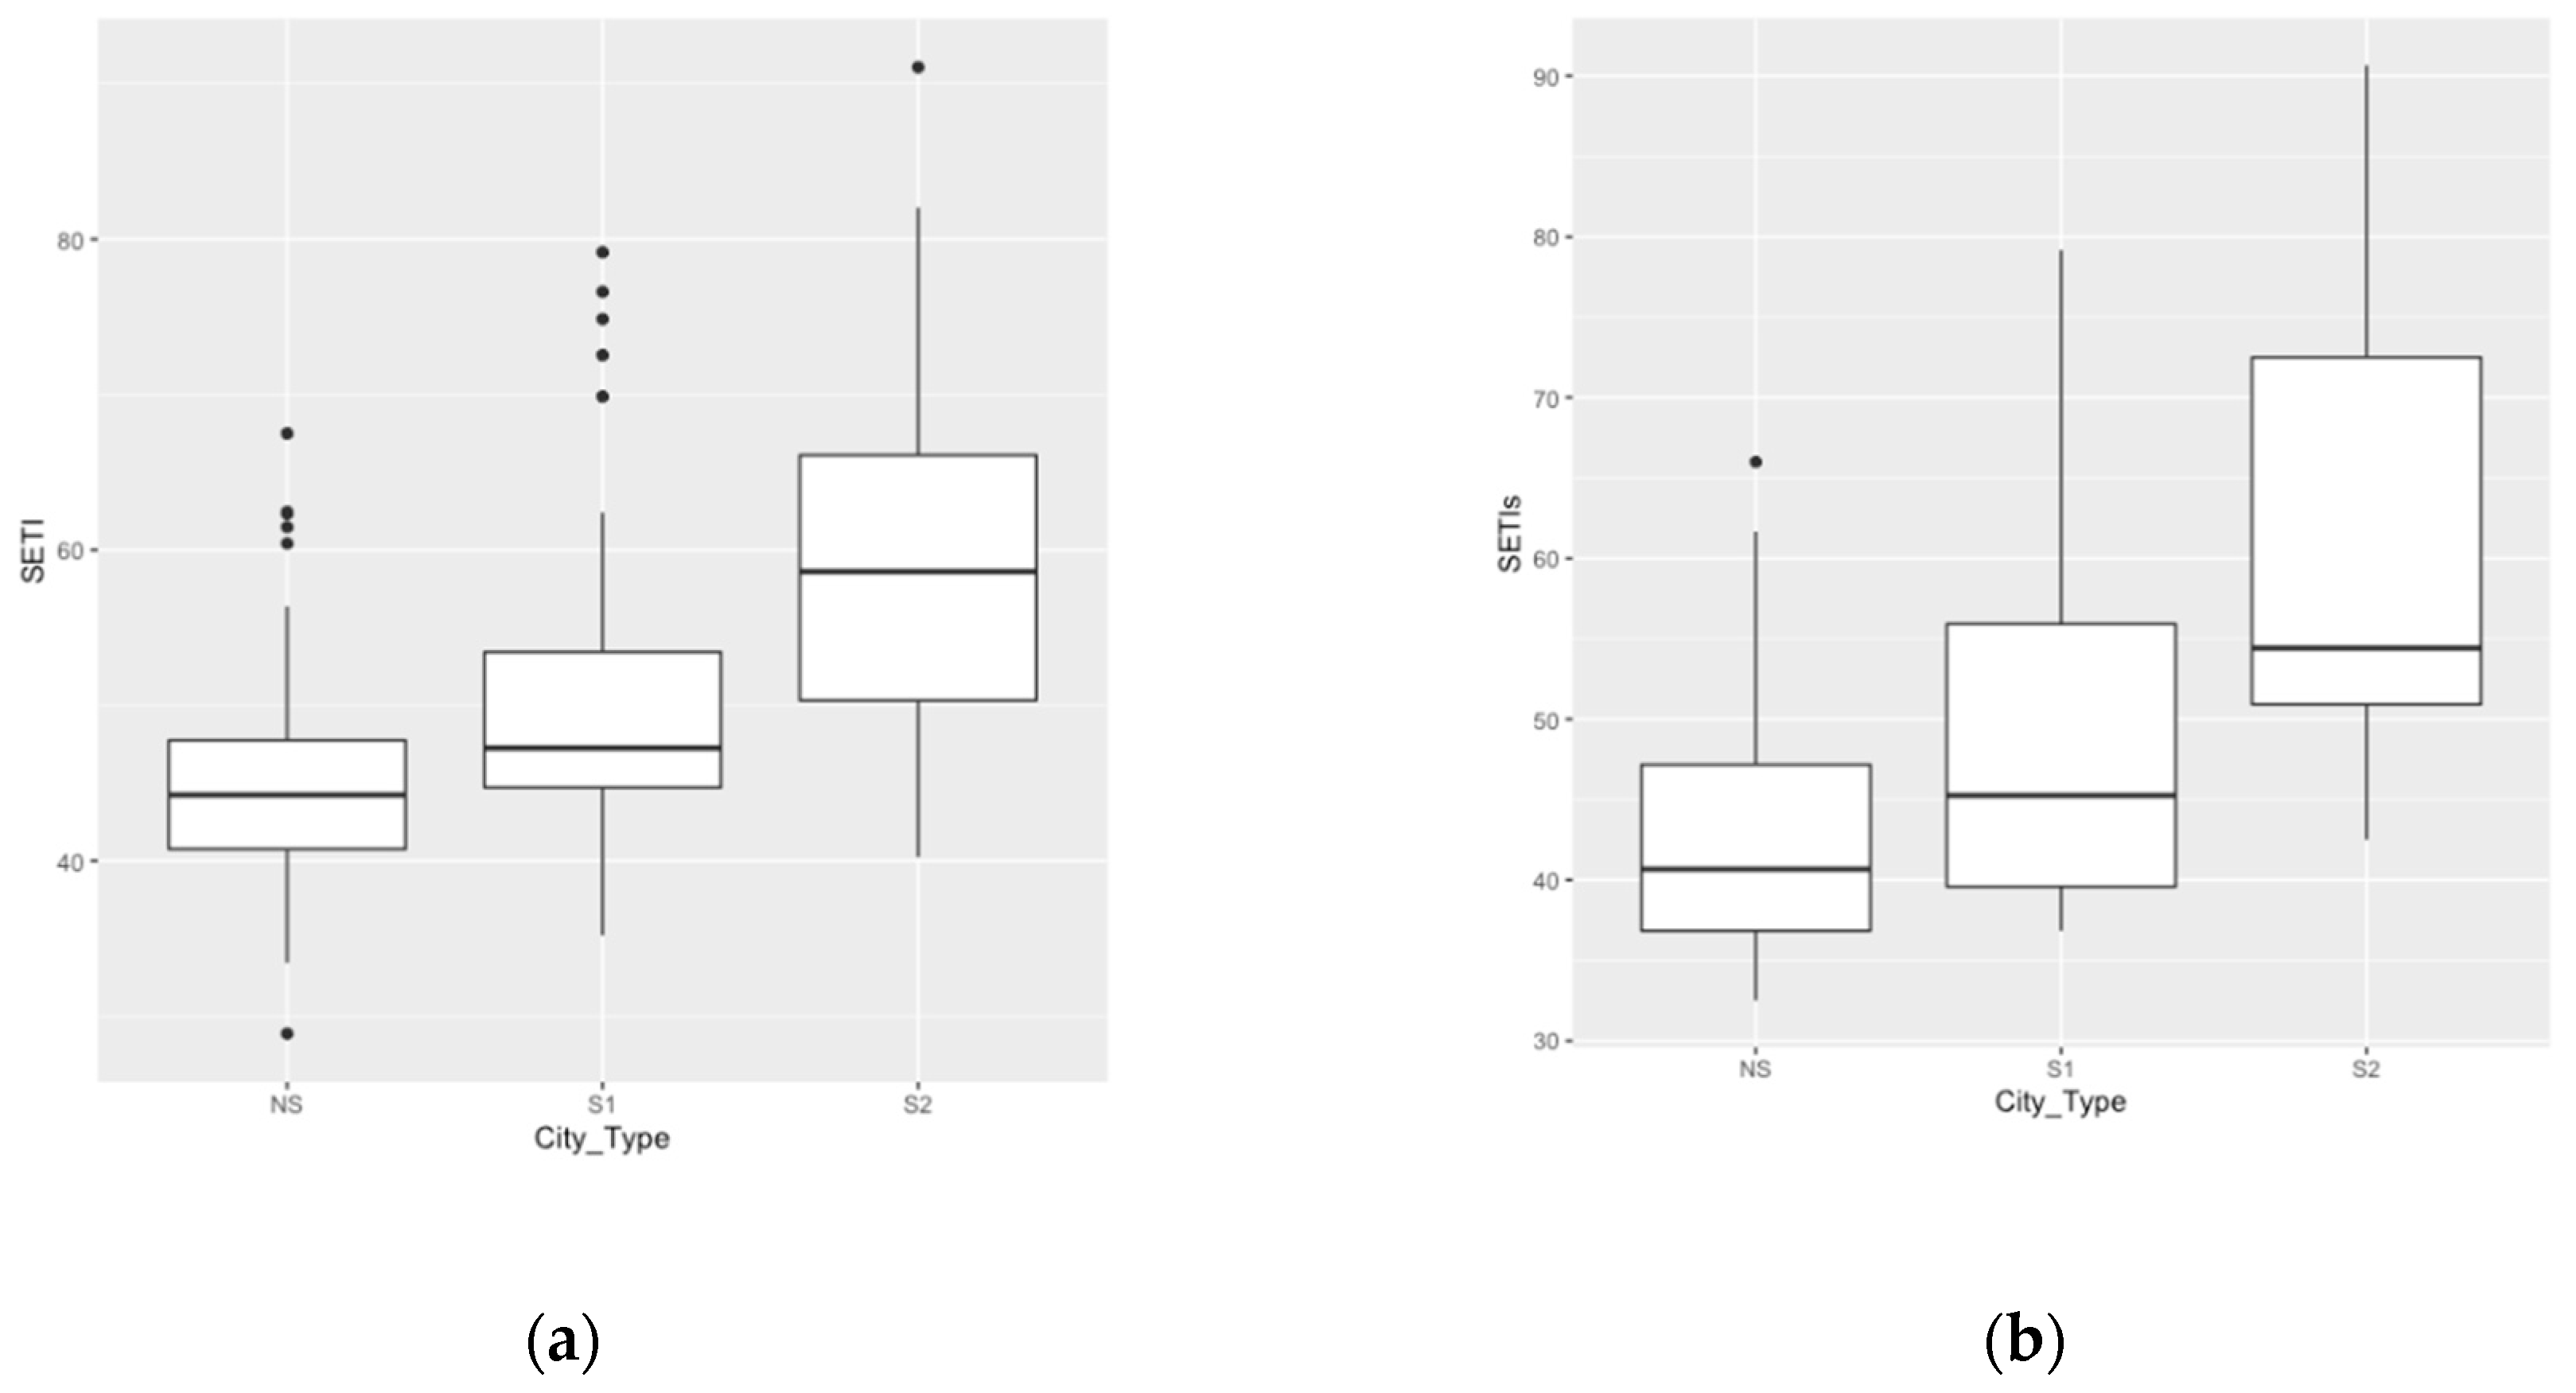
The indicators are normalized and accumulated with equal weighting, as shown in Figure 2, to calculate the Smart Energy Transition Index score.
S m a r t   E n e r g y   T r a n s i t i o n   I n d e x = 1 3 { 1 2 ( R E + S G ) + 1 3 ( C I + E B + E C ) + 1 2 ( R B + R R ) }
where RE means renewable energy production, SG means smart grid (accumulated with smart grid projects, ESS and AMI installation), CI means civil initiative in energy sector, EB means energy-saving behavior, EC means energy consumption per capita, RB mean R&D budget for technology, and RR means rules and regulations on the energy sector. We chose equal weighting because three components of smart cities are equally highlighted in the literature [21].
Since the indicators have different units of measurement, the indicators are normalized by using the z-score and percentile. Normalization puts all indicators on the same scale so each city’s relative position can be shown. The z-score does so, where the mean is standardized to zero (0) and the standard deviation is converted to one (1). Then, z-scores are converted into a percentile in which the maximum value becomes 100% so that it is intuitive and easy to understand the score. Interpretation should be careful, 100% does not necessarily mean the city has perfect conditions for an indicator. For example, 100% in renewable energy does not mean the city’s power source is 100% renewable energy. Rather, it means the city is relatively better than other cities. The Smart Energy Transition Index score ranges from 100% (highest) to 0% (lowest). Figure 3 shows the results of the Smart Energy Transition Index and the categories of cities in South Korea. Darker blue means a higher Smart Energy Transition Index score. In general, smart cities in South Korea have a higher Smart Energy Transition Index score than NSC.

4.3. Analysis

The 10 cities with the highest and lowest scores are shown in Table 7. The top 10 cities are mostly smart cities (SC1 and SC2) and the top eight cities are all metropolitan or special cities. These big cities have a large population, mostly more than 1 million people, and Seoul significantly exceeds the average (9.8 million). Jeju and Pohang-si have relatively lower populations but they have a higher per capita urbanized area. Incheon scores the highest followed by Seoul. Seoul scores similar to Incheon but it performs lower in the R&D budget for technology. Yongin-si is SC2 but a non-metropolitan city. It has a population of 1 million and fairly sound financial power as well as GRDP per capita. Yongin-si performs well in smart grid projects (95.4%) and community initiatives (76.8%) which compensates for its relatively poor performance in renewable energy production (32.6%).
The bottom 10 cities are mostly NSCs and from the ‘Gun’ area. Most of the bottom 10 cities have a relatively lower population and FIR. Additionally, their urbanized area per capita is higher than the average, meaning the urban infrastructures are spread. As a result, it is hard to implement ICT infrastructure. The bottom 10 cities scored poorly in each smart energy transition variable. Some cities showed very low scores in energy-saving behavior less than 10.0% and rules and regulations.
Exceptional cases are found in both the top and bottom 10 lists. One NSC is included in the top 10 list and two SC1s are included in the bottom 10 lists. A closer look into each one’s smart energy transition and urban characteristic variables can explain the existence of these exceptional cases. Pohang-si, an NSC included in the top 10 list, performed well in energy-saving behavior (68.4%) and R&D budget for technology (100.0%). Pohang-si has a relatively smaller population but has sound FIR and GRDP per capita. In contrast, Wanju-gun and Gimcheon-si, the SC1s in the bottom 10 list, have a lower population, but their other urban characteristic variables are better than the average. Wanju-gun and Gimcheon-si have lower scores in each variable, similar to the other bottom 10 cities, but they scored even less in energy-saving behavior. This tendency implies that even though a city has higher inherent urban smartness rooted in urban characteristics, its smart energy transition may be more to do with active community involvement and voluntary participating in energy-saving behaviors. Additionally, the policy plays an important role in building a favorable environment for a sustainable energy transition.
Table 8 shows the results of the descriptive analysis on the Smart Energy Transition Index score of each city group and urban characteristic variables. SC1 is comprised of 42 cities and their mean Smart Energy Transition Index score is 50.9, with the minimum being 33.6 and the maximum being 72.8. SC2 is comprised of 12 cities where the mean score is 60.9 and the maximum score is 84.0. The number of NSCs is 107 and their mean score is 44.8. The minimum and maximum scores are 27.3 and 63.9, respectively. The mean score is highest in SC2 and lowest in NSC. SC2 has the highest average population, more than 1 million people, while NSC has the lowest population. This tendency can be observed in administrative-city-type metropolitan areas which are all smart cities with the highest populations, more than 2 million people. Meanwhile the Si area hovers around the average and Gun has the least population. FIR is also highest in SC2 and the metropolitan area and lowest in the NSC and Gun. The urbanized area per capita is lowest in SC2 and the metropolitan area, meaning the cities are more compact than in NSC or Gun. GRDP per capita does not show dramatic differences like other variables do, but the tendency is similar.
SC2 scored higher in most of the smart energy transition variables except for energy-saving behavior. SC2 scored especially high in technology variables (renewable energy production at 50.5% and smart grid projects at 64.5%) and policy variables (R&D budget for technology at 60.4% and rules and regulations at 77.1%). In comparison, in community variables, only civil initiative on energy is exceptional (63.3%). The others are similar or slightly higher than the average. SC1 shows somewhat better performance in community and policy variables than the average. NSC scored least, similar or lower than the average. The metropolitan area scored the most in every variable, exceeding the average. Si performed better than Gun except in renewable energy production and energy-saving behavior.
To check whether there is a statistically significant difference among mean scores, one-way ANOVA is performed. One-way ANOVA is useful to check whether a difference exists among groups in terms of their mean. Before performing ANOVA, the following assumptions are checked:
  • The data for each group is normally distributed (normality).
  • The data for each group has a common variance (homogeneity in variance).
The result of the Shapiro test also shows that both non-smart cities and SC1s are not normally distributed (p-value < 0.05). For homogeneity of variance, Levene’s test was performed. The p-value was less than the significance level (p < 0.05) which means the variance is not homogeneous. Since both normality and homogeneity in variance assumptions were not satisfied, the nonparametric test was performed instead of one-way ANOVA. Since the number in the group was three, the Kruskal-Wallis test was performed (see Table 9). Since the p-value was less than the significance level of 0.05, we can conclude that there are significant differences between the city categories. To find which pair of city category exhibit a difference, we performed pairwise comparisons using the Wilcoxon rank-sum test (see Table 10). SC2 is significantly different from SC1 and NSC (p < 0.05). Additionally, there is a significant difference between SC1 and NSC.
Since the data on renewable energy production and energy-saving behavior represents an estimation, we excluded these indicators for the sensitivity analysis. The adjusted Smart Energy Transition Index score is summarised below. The boxplot shows the revised SETI score has a wider range than the original one, but the general tendency is similar (see Figure 4). The results of the Kruskal-Wallis test and the post-hoc test can be interpreted the same as the original results (see Table 11 and Table 12). All in all, there is a significant difference between the city categories in the mean of their Smart Energy Transition Index scores.
The analysis shows that a significant difference exists in the means of the SETI scores in each type of city. The top 10 highest scoring cities are mostly SC1 and SC2, and seven out of nine metropolitan cities (except Sejong and Busan) are on the list. This result seems to provide evidence that big cities with higher urban development levels are already ahead of other cities.
For the final analysis, we tested the correlation between urban characteristic variables and the SETI score to check the effect of urban characteristics. The result showed that the SETI score has a significant relationship with all urban characteristics variables except GRDP per capita (see Figure 5). Population and FIR have a high positive relation while per capita urbanized area has a negative relation. This result is plausible because technology, where urban infrastructure is reflected (smart grid), needs a population threshold to be implemented. Community is influenced by the size of the population, with more people likely to join community initiatives and participate in energy conservation behavior. Of course, a greater population results in more energy consumption. However, this is adjusted by using a per capita energy consumption level. The policy, especially R&D for technology, is closely related to the financial status of the local government, and hence, FIR. This propensity again confirms that inherent urban characteristics already determine the smartness of a city. On the other hand, a high per capita urbanized area means low density which results in more energy consumption (longer travel distance, spread sewerage pipeline, and longer electric wires) and a negative influence on the SETI score.

4.4. Findings of the Analysis

The major findings from the analysis can be summarised as follows. First, there is a significant difference in the mean of the index score by city type. This finding supports the hypothesis that smart cities perform better in the energy transition arena. SC2 performs better than SC1 or NSC in most of the smart energy transition variables except for energy-saving behavior. SC1 performs better than NSC, scoring similar to the average. This tendency can be also observed with the administrative city type. Metropolitan areas have a large population and high FIR score with Si’s being modest and Gun’s being the least. This takeaway provides another evidence of the first argument (i.e., urban characteristics influence the inherent smartness of the city). Metropolitan areas that already have resources at their disposal score higher than SC2 in their SETI score.
Second, there are some exceptional cases. Some SC1s performed poorly in smart energy transition while some NSCs performed better. This tendency is partly related to the urban characteristic variables and partly to the smart energy transition variables. For example, Wanju-gun and Gimcheon-si SC1s included in the bottom 10 cities, have a higher population and FIR than the other bottom 10 cities but it scored poorly in smart energy transition variables. Comparatively speaking, Pohang-si, an NSC included in the top 10 cities, scored high in energy-saving behavior and R&D budget for technology, even though its urban characteristic variables are lower than the other top 10 cities. Urban characteristics are important, but these exceptional cases also show the importance of smart city development that boosts community involvement and political support.
Finally, the correlation test shows a potential contribution of urban characteristic variables, such as population, FIR, and per capita urbanized area to the smartness of the city. Population and FIR have a positive relationship while per capita urbanized area has a negative relation to the index score. Per capita GRDP does not have a significant relationship. These findings imply that the inherent smartness of the city may influence the smart energy transition.

5. Conclusions

Smart city development aims for sustainable urban development and high quality of life [2,24,25]. This paper focuses on environmental sustainability, especially smart energy transition. A smart city can contribute to energy transition by properly compositing technology, community, and policy. By evaluating South Korea’s smart city development, this paper endeavored to provide a framework for the Smart Energy Transition Index and empirical evidence on the effectiveness of smart city development. We developed an index with seven indicators that represent the possible contribution of three smart city components (technology, community, and policy). Urban characteristic variables (population, FIR, per capita GRDP, and urbanized area) are included in the analysis to determine the effect of the inherent smartness of the city.
The results of the analysis can be summarized as follows.
  • There is a statistically significant difference in the mean index score among city groups.
  • SC2 scored the highest, followed by SC1, and NSC.
  • There were exceptional cases where an NSC was included in the top 10 cities and two SC1s were included in the bottom 10 cities.
  • There is a positive correlation between population and FIR with the index score, and a negative correlation between the urbanized area per capita and the index score.
What we can learn from these results is that smart city development can contribute to a smart energy transition. The fact that the mean SETI score of SC1s is lower than SC2s shows the limitation of SC1s, which mainly focus on technology implementation [49]. A smart city is more than technology [19], and community and policy should also play important roles. The policy designs a favorable environment for community and technology to prosper, and active community involvement can boost smart energy transition. SC2 is an advanced model of SC1, one that attempts to balance three smart city drivers, and it has a bigger impact on realizing energy transition. Many of the SC2s in South Korea are still under a developing process. Especially, Busan and Sejong are designated as a national smart city testbed in 2018. The plan encompasses safety, transportation, environment, welfare, tourism, governance, and infrastructure. As smart cities evolve as a comprehensive plan, further studies are expected to trace their development and assess the impact on energy transition in the future.
Additionally, urban characteristics have an indirect influence on the smart energy transition. For example, a large population has an advantage in securing community initiatives, tax revenue for local government’s financial status, and innovation that supports technology [51]. The local government’s ability (represented by FIR) can pave the way for a sustainable energy transition with financial and political support. These accumulated urban resources can positively influence smart energy transition.
The limitation of this study is that the dataset is imperfect. For example, renewable energy production is estimated from the provincial-level data and smart grid implementation is estimated with three different data sources. Lack of city-level data in some variables forced us to use alternative data (e.g., provincial data) which may not reflect the phenomenon correctly. Another limitation is that community-based smart cities are not considered. This is also due to the lack of such data. In addition, we provide only an overview of the smart energy transition in South Korea. Other countries may have different results. Despite these limitations, this paper still provides significant knowledge on the overall performance of smart cities on energy transition. We delivered an evaluation framework that combines smart city and energy transition. This is also significant as integrating the energy sector rather than treating it as separate entity provides flexibility in policy designing and planning [52]. The future research can better composite the index with full city-level data, fill the knowledge gap on community-based smart city projects, and identify the effectiveness of smart city development on smart energy transition in other countries. Additionally, specific case studies can be carried out to examine the success and failure of smart cities in energy transition.

Author Contributions

Conceptualization, Y.L., J.E., and A.G.; data curation, Y.L.; methodology, Y.L., J.E., and A.G.; supervision, J.E. and A.G.; visualization, Y.L.; writing—original draft, Y.L.; writing—review and editing, J.E. and A.G.

Funding

This research received no external funding.

Conflicts of Interest

The authors declare no conflict of interest.

List of Acronyms

The table below summarizes all the acronyms used in this paper in the order of appearance.
AcronymTerm
ICTInformation and Communication Technology
IoTInternet of Things
GPSGlobal Positioning System
U-cityUbiquitous city
SC1First wave smart city
SC2Second wave smart city
NSCNon-smart city
ESSEnergy storage system
AMIAdvanced metering infrastructure
RERenewable energy generation
SGSmart gird
CICitizen initiatives in the energy sector
EBEnergy conservation behavior
ECEnergy consumption
RBR&D budget for technology
RRRules and regulations on the energy sector
PPPopulation
FIFIR: financial independent ratio
GRGross regional domestic production per capita
UAUrbanized area per capita

References

  1. Neirotti, P.; de Marco, A.; Cagliano, A.C.; Mangano, G.; Scorrano, F. Current trends in smart city initiatives: Some stylised facts. Cities 2014, 38, 25–36. [Google Scholar] [CrossRef]
  2. Nam, T.; Pardo, T.A. Conceptualizing smart city with dimensions of technology, people, and institutions. In Proceedings of the 12th Annual International Digital Government Research Conference: Digital Government Innovation in Challenging Times, College Park, MD, USA, 12–15 June 2011; pp. 282–291. [Google Scholar]
  3. Ng, S.T.; Xu, F.J.; Yang, Y.; Lu, M. A Master Data Management Solution to Unlock the Value of Big Infrastructure Data for Smart, Sustainable and Resilient City Planning. Procedia Eng. 2017, 196, 939–947. [Google Scholar] [CrossRef]
  4. Talari, S.; Shafie-Khah, M.; Siano, P.; Loia, V.; Tommasetti, A.; Catalão, J.P.S. A review of smart cities based on the internet of things concept. Energies 2017, 10, 421. [Google Scholar] [CrossRef]
  5. Silva, B.N.; Khan, M.; Jung, C.; Seo, J.; Muhammad, D.; Han, J.; Yoon, Y.; Han, K. Urban planning and smart city decision management empowered by real-time data processing using big data analytics. Sensors 2018, 18, 2994. [Google Scholar] [CrossRef]
  6. Paskaleva, K.; Evans, J.; Martin, C.; Linjordet, T.; Yang, D.; Karvonen, A. Data Governance in the Sustainable Smart City. Informatics 2017, 4, 41. [Google Scholar] [CrossRef]
  7. Giest, S. Big data analytics for mitigating carbon emissions in smart cities: Opportunities and challenges. Eur. Plan. Stud. 2017, 25, 941–957. [Google Scholar] [CrossRef]
  8. IPCC. Climate Change 2014: Mitigation of Climate Change; Cambridge University Press: Cambridge, UK, 2015; Volume 3. [Google Scholar]
  9. Bridge, G.; Bouzarovski, S.; Bradshaw, M.; Eyre, N. Geographies of energy transition: Space, place and the low-carbon economy. Energy Policy 2013, 53, 331–340. [Google Scholar] [CrossRef]
  10. Rutherford, J.; Coutard, O. Urban Energy Transitions: Places, Processes and Politics of Socio-technical Change. Urban Stud. 2014, 51, 1353–1377. [Google Scholar] [CrossRef]
  11. Ou, T.C. Design of a Novel Voltage Controller for Conversion of Carbon Dioxide into Clean Fuels Using the Integration of a Vanadium Redox Battery with Solar Energy. Energies 2018, 11, 524. [Google Scholar] [CrossRef]
  12. Ou, T.C.; Hong, C.M. Dynamic operation and control of microgrid hybrid power systems. Energy 2014, 66, 2014. [Google Scholar] [CrossRef]
  13. Navarro, J.L.A.; Ruiz, V.R.L.; Peña, D.N. The effect of ICT use and capability on knowledge-based cities. Cities 2017, 60, 272–280. [Google Scholar] [CrossRef]
  14. Debnath, A.K.; Chin, H.C.; Haque, M.M.; Yuen, B. A methodological framework for benchmarking smart transport cities. Cities 2014, 37, 47–56. [Google Scholar] [CrossRef] [Green Version]
  15. Snow, C.C.; Hakonsson, D.D.; Obel, B. A Smart City Is a Collaborative Community: Lessons from Smart Aarhus. Calif. Manag. Rev. 2016, 59, 92–108. [Google Scholar] [CrossRef]
  16. Hara, M.; Nagao, T.; Hannoe, S.; Nakamura, J. New key performance indicators for a smart sustainable city. Sustainability 2016, 8, 206. [Google Scholar] [CrossRef]
  17. Geels, F.W.; Schwanen, T.; Sorrell, S.; Jenkins, K.; Sovacool, B.K. Reducing energy demand through low carbon innovation: A sociotechnical transitions perspective and thirteen research debates. Energy Res. Soc. Sci. 2018, 40, 23–35. [Google Scholar] [CrossRef]
  18. Alam, M.; Porras, J. Architecting and Designing Sustainable Smart City Services in a Living Lab Environment. Technologies 2018, 6, 99. [Google Scholar] [CrossRef]
  19. Hollands, R.G. Will the real smart city please stand up? Intelligent, progressive or entrepreneurial? City 2008, 12, 303–320. [Google Scholar] [CrossRef]
  20. Meijer, A.; Bolivar, M. Governing the Smart City: Scaling-Up the Search for Socio-Techno Synergy. Int. Rev. Adm. Sci. 2016, 82, 392–408. [Google Scholar] [CrossRef]
  21. Yigitcanlar, T.; Kamruzzaman, M.; Buys, L.; Ioppolo, G.; Sabatini-Marques, J.; da Costa, E.M.; Yun, J.J. Understanding ‘smart cities’: Intertwining development drivers with desired outcomes in a multidimensional framework. Cities 2018, 81, 145–160. [Google Scholar] [CrossRef]
  22. Kummitha, R.K.R.; Crutzen, N. How do we understand smart cities? An evolutionary perspective. Cities 2017, 67, 43–52. [Google Scholar] [CrossRef]
  23. Bakici, T.; Almirall, E.; Wareham, J. A smart city initiative: The case of Barcelona. J. Knowl. Econ. 2013, 4, 135–148. [Google Scholar] [CrossRef]
  24. Toppeta, D. The smart city vision: How innovation and ICT can build smart, ‘livable’, sustainable cities. Think Rep. 2010, 5, 1–9. [Google Scholar]
  25. Wagner, S.; Brandt, T.; Neumann, D. Smart City Planning-Developing an Urban Charging Infrastructure for Electric Vehicles. In Proceedings of the European Conference on Information Systems (ECIS), Tel Aviv, Israel, 9–11 June 2014; pp. 1–15. [Google Scholar]
  26. Trindade, E.P.; Hinnig, M.P.F.; da Costa, E.M.; Marques, J.S.; Bastos, R.C.; Yigitcanlar, T. Sustainable development of smart cities: A systematic review of the literature. J. Open Innov. Technol. Mark. Complex. 2017, 3, 11. [Google Scholar] [CrossRef]
  27. Hollands, R.G. Critical interventions into the corporate smart city. Camb. J. Reg. Econ. Soc. 2015, 8, 61–77. [Google Scholar] [CrossRef]
  28. Wiig, A. IBM’s smart city as techno-utopian policy mobility. City 2015, 19, 258–273. [Google Scholar] [CrossRef]
  29. Schaffers, H.; Komninos, N.; Pallot, M.; Trousse, B.; Nilsson, M.; Oliveira, A. Smart cities and the future internet: Towards cooperation frameworks for open innovation. In The Future Internet Assembly; Springer: Berlin, Germany, 2011; pp. 431–446. [Google Scholar]
  30. Washburn, D.; Sindhu, U.; Balaouras, S.; Dines, R.A.; Hayes, N.; Nelson, L.E. Helping CIOs understand ‘smart city’ initiatives. Growth 2009, 17, 1–17. [Google Scholar]
  31. Cimmino, A.; Pecorella, T.; Fantacci, R.; Granelli, F.; Rahman, T.F.; Sacchi, C.; Carlini, C.; Harsh, P. The role of small cell technology in future Smart City applications. Trans. Emerg. Telecommun. Technol. 2014, 25, 11–20. [Google Scholar] [CrossRef]
  32. Romanelli, M. E-city councils within Italian smart cities. In Proceedings of the Ifkad 2013 8th Int. Forum Knowl. Asset Dyn. Smart Growth Organ. Cities Communities, Zagreb, Croatia, 12–14 June 2013; pp. 390–406. [Google Scholar]
  33. Stratigea, A. The concept of ‘smart cities’. Towards community development? Netcom Réseaux Commun. Territ. 2012, 26, 375–388. [Google Scholar] [CrossRef]
  34. Gil-Garcia, J.R.; Zhang, J.; Puron-Cid, G. Conceptualizing smartness in government: An integrative and multi-dimensional view. Gov. Inf. Q. 2016, 33, 524–534. [Google Scholar] [CrossRef]
  35. Kanter, R.M.; Litow, S.S. Informed and Interconnected: A Manifesto for Smarter Cities. Harvard Business School Working Paper. 2009, 09–141, 1–27. [Google Scholar]
  36. Partridge, H.L. Developing a Human Perspective to the Digital Divide in the ‘Smart City’. In Proceedings of the ALIA 2014 Biennial Conference (Australian Library and Information Association), Gold Coast, QLD, Australia, 21–24 September 2004; pp. 1–7. [Google Scholar]
  37. Barns, S.; Cosgrave, E.; Acuto, M.; Mcneill, D. Digital infrastructures and urban governance. Urban Policy Res. 2017, 35, 20–31. [Google Scholar] [CrossRef]
  38. Odendaal, N. Information and communication technology and local governance: Understanding the difference between cities in developed and emerging economies. Comput. Environ. Urban Syst. 2003, 27, 585–607. [Google Scholar] [CrossRef]
  39. Kylili, A.; Fokaides, P.A. European smart cities: The role of zero energy buildings. Sustain. Cities Soc. 2015, 15, 86–95. [Google Scholar] [CrossRef]
  40. Mosannenzadeh, F.; Vettorato, D. Defining smart city: A Conceptual Framework Based on Keyword Analysis. TeMA J. Land Use Mobil. Environ. 2014, 684–694. [Google Scholar]
  41. Calvillo, C.F.; Sánchez-Miralles, A.; Villar, J. Energy management and planning in smart cities. Renew. Sustain. Energy Rev. 2016, 55, 273–287. [Google Scholar] [CrossRef]
  42. Seyfang, G.; Haxeltine, A. Growing Grassroots Innovations: Exploring the Role of Community-Based Initiatives in Governing Sustainable Energy Transitions. Environ. Plan. C 2012, 30, 381–400. [Google Scholar] [CrossRef] [Green Version]
  43. Grubler, A. Energy transitions research: Insights and cautionary tales. Energy Policy 2012, 50, 8–16. [Google Scholar] [CrossRef]
  44. Shahrokni, H.; Lazarevic, D.; Brandt, N. Smart Urban Metabolism: Towards a Real-Time Understanding of the Energy and Material Flows of a City and Its Citizens. J. Urban Technol. 2015, 22, 65–86. [Google Scholar] [CrossRef]
  45. Mosannenzadeh, F.; di Nucci, M.R.; Vettorato, D. Identifying and prioritizing barriers to implementation of smart energy city projects in Europe: An empirical approach. Energy Policy 2017, 105, 191–201. [Google Scholar] [CrossRef]
  46. Florida, R. Cities and the Creative Class; Routledge: London, UK, 2005. [Google Scholar]
  47. Baek, N. Strategy for Constructing Smart City Infrastructure. KOTI Spec. Ed. 2017, 2, 13–20. [Google Scholar]
  48. Yun, S. The Ideological Basis and the Reality of ‘Low Carbon Green Growth’. ECO 2009, 13, 219–266. [Google Scholar]
  49. Park, G.; Gang, M.; Lee, S. Establishing Seoul Smart City Model: A Policy Recommendation for Successful Seoul Smart City; Seoul Digital Foundation: Seoul, Korea, 2018. [Google Scholar]
  50. OECD. Handbook on Constructing Composite Indicators: Methodology and User Guide—OECD; OECD: Ispra, Italy, 2008. [Google Scholar]
  51. Shen, L.; Huang, Z.; Wong, S.W.; Liao, S.; Lou, Y. A holistic evaluation of smart city performance in the context of China. J. Clean. Prod. 2018, 200, 667–679. [Google Scholar] [CrossRef]
  52. Lund, H.; Østergaard, P.A.; Connolly, D.; Mathiesen, B.V. Smart energy and smart energy systems. Energy 2017, 137, 556–565. [Google Scholar] [CrossRef]
Figure 1. Administrative districts in South Korea.
Informatics 06 00050 g001
Figure 2. Constructing the Smart Energy Transition Index.
Informatics 06 00050 g002
Figure 3. Smart cities and Smart Energy Transition Index in South Korea.
Informatics 06 00050 g003
Figure 4. Boxplot and distribution of adjusted Smart Energy Transition Index (SETI) scores. (a) Original SETI score; (b) Adjusted SETI score.
Informatics 06 00050 g004
Figure 5. Correlation between SETI and urban characteristics.
Informatics 06 00050 g005
Table 1. Comparison of smart city drivers’ contribution to the energy system.
Smart City DriversTraditional Energy SystemNew Energy System
Energy ProductionEnergy Distribution & StorageEnergy ConsumptionEnergy ProductionEnergy Distribution & StorageEnergy Consumption
Technology×
Community××
Policy
〇: High contribution, △: Moderate/partial contribution, ×: No direct contribution.
Table 2. Smart city drivers’ contribution to the energy transition.
Smart City DriversContribution to Energy Transition
Technology
  • Renewable energy
  • Smart grid
Community
  • Civil initiatives in the energy sector
  • Energy consumption
  • Energy-saving behavior
Policy
  • R&D budget for technology
  • Rules and regulations on energy systems
Table 3. Use of terms ‘Smart City’ and ‘U-eco City’ by governments.
GovernmentYearSmart CityU-City (U-eco City)
Roh, Moo-hyun2003–200818114
Lee, Myung-bak2008–2013126175
Park, Geun-hye2013–201752566
Moon, Jae-in2017–Present75923
Source: www.korea.kr.
Table 4. Differences between U-City and Smart City.
CategoryU-CitySmart City
Major FocusConnected infrastructure (network)
Focus on technology
Social infrastructure (human and social capital)
Focus on functionality
GoalUrban informatization (efficiency)Urban intelligence (usability)
Solutions to Urban ProblemsReady-made procedurePrescription based on data
InitiativeTop-down
City focused and government-led
Vertical collaboration
Bottom-up
Citizen participation and multi-stakeholder
Horizontal collaboration
Implementation/OperationLimited urban services in telecommunication, security and disaster prevention
Mostly implemented in newly developed cities
Citizens adapt to provided urban services
Various urban services in administration, transportation, energy, water management, welfare, and environment
Can be implemented in both new and old cities
Provide citizen-centred urban services
Source: Adopted and translated from [49].
Table 5. Categorization of cities.
City TypeSC1SC2NSC
Metropolitan Cities (Including special districts)Busan, Daegu, Gwangju, Ulsan, Jeju-do (5)Seoul, Incheon, Daejeon, Sejong (4)(0)
Do (Province)GyeonggiUijeongbu-si, Bucheon-si, Gwangmyeong-si, Pyeongtaek-si, Ansan-si, Goyang-si, Namyangju-si, Osan-si, Siheung-si, Hanam-si, Icheon-si, Anseong-si, Gimpo-si, (13)Suwon-si, Seongnam-si, Yongin-si, Paju-si, Hwaseong-si, Yangju-si (6)(12)
GangwonWonju-si, Gangneung-si, Samcheok-si (3)-(15)
ChungbukCheongju-si, Chungju-si, Jecheon-si, Jincheon-gun, Emseong-gun (5)-(6)
ChungnamBoryeong-si, Gyeryong-si, Hongseong-gun (3)Cheonan-si, Asansi (2)(10)
JeonbukJeonju-si, Wanju-gun (2)-(12)
JeonnamYeosu-si, Naju-si (2)-(20)
GyeongbukGyeongju-si, Gimcheon-si, Gumi-si, Yeongju-si, Yeongyang-gun (5)-(18)
GyeongnamChangwon-si, Jinju-si, Gimhae-si, Yansgsan-si (4)-(14)
Total4212107
* The name of NSC is omitted from the table. Source: LH Smart city (http://www.lh.or.kr/lh_offer/business/bus3500.asp).
Table 6. Indicators for the Smart Energy Transition Index.
DimensionsCategory IndicatorYearUnit
TechnologyRenewable energy production *(RE)Provincial data divided by number of cities on renewable energy production2017TOE
Smart Gird *Smart Grid(SG)No. of ESS and smart grid projectsUp to 2018unit
ESSAmount of total ESSUp to 2017kWh
AMINo. of AMI installation Up to 2017unit
CommunityCitizen initiatives in the energy sector(CI)No. of civil initiatives specializing in renewable energyUp to 2018unit
Energy-saving behavior *(EB)Average energy-saving behavior2016score
Energy consumption(EC)Total amount of electricity use in houses, service sector and public sector per capita2016MWh
PolicyR&D budget for technology(RB)% of the budget for technology (scientific development)2016%
Rules and regulations(RR)No. of local gov’t regulations, laws or legislation regarding energy sectorUp to 2018unit
Urban CharacteristicPopulation(POP)Population of city2017Ppl
FIR(FIR)Financial independence ratio2017%
GRDP per capita(GRD)Gross regional domestic production per capita2016Million KRW
Urbanised Area per capita(UA)Per capita urbanised area (residential + commercial + industrial area)2017m2
Table 7. Top and bottom 10 cities.
NoCity NameSETI ScoreCity TypePopulation (ppl)FIR (%)GRDP per Capita (million KRW)Urbanized Area per Capita (m2)
Top 10 cities with highest SETI score
1Incheon84.0SC22,948,54265.427.471.7
2Seoul76.8SC29,857,42685.036.537.7
3Deagu72.8SC12,475,23156.620.173.0
4Ulsan70.8SC11,165,13269.962.0132.3
5Jeju70.0SC1657,08339.625.9109.5
6Gwangju69.6SC11,463,77049.223.282.1
7Pohang-si63.9NSC513,83237.132.7190.9
8Daejeon63.9SC21,502,22757.123.563.2
9Yonhin-si63.0SC21,004,08163.434.646.9
10Bucheon-si62.8SC1850,32942.420.036.7
Bottom 10 cities with lowest SETI score
161Imsil-gun27.3NSC30,16215.825.0206.8
160Buan-gun33.5NSC56,08615.122.5321.3
159Seongju-gun33.6NSC45,13815.341.0290.0
158Wanju-gun33.6SC195,97528.051.5251.7
157Jinan-gun34.3NSC26,27113.323.9159.2
156Sunchang-gun35.1NSC29,69816.325.094.4
155Goryeong-gun35.8NSC33,76821.039.3305.7
154Gimcheon-si36.7SC1142,90829.534.1213.2
153Sacheon-si37.9NSC114,25222.634.7262.2
152Hapcheon-gun37.9NSC47,00014.919.0138.1
-Average47.6-325,10427.932.0191.2
NoCity NameSETI Score Average of
RESGCIEBECRBRR
1Incheon84.099.157.899.964.656.4100.0100.0
2Seoul76.895.068.7100.074.456.343.4100.0
3Deagu72.874.161.732.764.756.4100.098.4
4Ulsan70.8100.035.390.777.856.341.298.4
5Jeju70.099.441.284.848.356.374.778.6
6Gwangju69.640.852.694.753.756.489.398.4
7Pohang-si63.951.248.832.768.456.4100.078.6
8Daejeon63.955.558.443.936.056.310.078.6
9Yongin-si63.032.695.476.861.856.341.278.6
10Bucheon-si62.832.688.276.841.656.441.278.6
161Imsil-gun27.344.327.632.70.60.041.228.6
160Buan-gun33.544.327.632.70.356.341.228.6
159Seongju-gun33.651.237.732.713.756.441.22.7
158Wanju-gun33.644.327.632.72.854.741.228,6
157Jinan-gun34.344.327.632.77.056.341.228.6
156Sunchang-gun35.144.327.643.959.00.041.228.6
155Goryeong-gun35.851.237.132.733.556.341.22.7
154Gimcheon-si36.751.237.132.73.456.341.228.6
153Sacheon-si37.929.237.132.748.356.341.228.6
152Hapcheon-gun37.929.237.132.748.356.341.228.6
-Average47.647.045.946.649.254.944.847.8
Table 8. Descriptive analysis.
City TypeNo.SETI ScoreAverage of
MeanMinMaxPopulationFIRGRDPUA
SC14250.933.6 72.8 522,97338.29 34.26 140.6
SC21260.946.9 84.01,670,54858.74 41.11 93.2
NSC10744.827.3 63.9 91,28120.40 30.46 222.8
Metropolitan969.454.884.02,646,68561.4929.0690.1
Si7549.836.763.9322,96135.3833.03144.8
Gun7742.927.361.448,52416.7531.85249.2
Total16147.627.3 84.0 321,60527.93 32.25191.7
City TypeNo.SETI ScoreAverage of
RESGCIEBECRBRR
SC14250.945.753.150.550.456.345.157.0
SC21260.950.564.563.349.656.360.477.1
NSC10744.847.040.643.348.654.242.940.8
Metropolitan969.476.050.269.360.056.476.689.9
Si7549.841.953.749.746.855.644.357.5
Gun7742.948.437.341.050.254.141.533.3
Total16147.647.045.746.649.254.944.847.8
Table 9. Levene’s test for homogeneity of variance and Kruskal-Wallis test.
Data: Smart Energy Transition Index Score by City Categories
Levene’s testdfF-valuep-value
28.95270.0002074 ***
Kruskal-WallisChi-squareddfp-value
20.9720.00002795
***: 0 ≤ p-value < 0.001.
Table 10. Pairwise comparisons using the Wilcoxon rank-sum test.
Data: Smart Energy Transition Index Score by City Categories
Pairwise com NSSC1
SC10.0030-
SC20.00050.0283
p-Value adjustment method: BH.
Table 11. Descriptive analysis of adjusted Smart Energy Transition Index scores.
CityNo.MeanStandard DeviationMinMax
SC14249.8 (50.9)12.1 (9.0)36.8 (33.6)79.2 (72.8)
SC21260.8 (60.9)15.5 (10.5)42.5 (46.9)90.7 (84.0)
NSC10742.9 (44.8)6.9 (6.5)32.5 (27.3)66.0 (63.9)
Total16146.0 (47.6)10.6 (8.8)32.5 (27.3)90.7 (84.0)
Note: Value within the bracket is the original.
Table 12. Adjusted Levene’s test, Kruskal-Wallis test, and the Wilcoxon rank-sum test.
Adjusted Levene’s test for homogeneity of variance and Kruskal-Wallis test
LevenedfF-valuep-value
27.4145 (8.9527)0.000836 *** (0.0002074 ***)
Kruskal-WallisChi-squareddfp-value
24.791 (20.97)20.000004138 (0.00002795)
Adjusted Pairwise comparisons using the Wilcoxon rank-sum test
Pairwise comparison SC1SC2
SC20.01395 (0.0215)-
NSC0.01395 (0.0170)0.00013 (0.0006)
***: 0 ≤ p-value < 0.001, p-Value adjustment method: BH.

