Article

A Lightweight Hybrid CNN–CBAM Model for Multistage Acute Lymphoblastic Leukemia Classification from Peripheral Blood Smear Images


Mahasarakham Business School, Mahasarakham University, Mahasarakham 44150, Thailand
Informatics 2026, 13(5), 69; https://doi.org/10.3390/informatics13050069
Submission received: 22 February 2026 / Revised: 5 April 2026 / Accepted: 27 April 2026 / Published: 30 April 2026
(This article belongs to the Section Health Informatics)

Abstract

Accurate and efficient classification of hematological malignancies from peripheral blood smear (PBS) images remains challenging due to the scarcity of annotated datasets, staining variability, and subtle morphological differences among blood cancer subtypes. To address these limitations, this study proposes an Advanced Lightweight Deep Learning (ALDL) framework for the multi-class classification of Acute Lymphoblastic Leukemia (ALL) across four clinically significant stages: Benign, Pro-B, Pre-B, and Early Pre-B. The framework integrates EfficientNetV2-S with Convolutional Block Attention Modules (CBAM) to enhance spatial and channel-wise feature refinement. At the same time, Focal Loss is employed to mitigate class imbalance by prioritizing hard-to-classify samples. A robust preprocessing pipeline, including CLAHE contrast enhancement, Reinhard stain normalization, and data augmentation, improves feature visibility and dataset generalization. Lesion segmentation is performed using RGB-based thresholding and watershed overlay, followed by lesion-level cropping to ensure consistency across inputs. Experimental evaluations on the ALL-DB dataset demonstrate the superior performance of the proposed method, achieving an average accuracy of 96.11%, an F1-score of 95.99%, and an AUC of 0.9875. Comparative analyses against MobileNetV3, ResNet50, DenseNet121, VGG16, and InceptionV3 confirm that the proposed segmentation-guided EfficientNetV2-S + CBAM + Focal Loss framework consistently outperforms conventional CNN architectures across both 70:30 and 60:40 train–test splits. Furthermore, a detailed investigation of color spaces (RGB, HSV, LAB, and HED) indicates that RGB yields the most reliable segmentation and classification results. At the same time, HED enhances lesion visualization at the expense of higher computational cost. The proposed ALDL framework demonstrates strong potential for real-world application as a computer-aided diagnostic (CAD) system for early leukemia detection, offering improved diagnostic reliability, reduced error rates, and practical scalability for clinical environments.

1. Introduction

Medical image analysis continues to face substantial challenges, particularly due to the scarcity of high-quality labeled datasets essential for reliable classification. Annotating medical images is a resource-intensive, highly specialized process that requires domain expertise, particularly for tasks involving the segmentation and classification of blood cancer cells across multiple stages [1]. The difficulty in curating large, well-annotated datasets constrains the effectiveness of traditional supervised learning approaches, thereby limiting the robustness and generalizability of deep learning models in hematopathology. To address this limitation, researchers have increasingly explored advanced strategies that combine small sets of labeled data with larger pools of unlabeled data, thereby enhancing the models’ capacity to learn meaningful representations for blood cancer imaging. A common strategy to mitigate data scarcity is to use transfer learning with supervised pretraining on large-scale datasets such as ImageNet. This approach enables convolutional neural networks (CNNs) to learn general-purpose features, such as edges, textures, and object structures, that can be fine-tuned for medical imaging tasks. While such pre-training accelerates convergence and often improves classification performance, its application to blood cancer analysis remains suboptimal due to the substantial domain gap between natural and medical images. Specifically, blood smear images exhibit highly specialized morphological and chromatic patterns that differ markedly from everyday photographs. Subtle visual cues, such as nuclear morphology, cytoplasmic staining, and fine-grained structural variations, are critical for distinguishing between clinically relevant stages of B-cell acute lymphoblastic leukemia (B-ALL), including Benign, Pro-B, Pre-B, and Early Pre-B cells [2,3]. Models pre-trained on natural image datasets often lack the inductive biases needed to capture domain-specific features, thereby reducing their diagnostic reliability.
To overcome these limitations, CNN-based approaches employing self- and weakly supervised learning paradigms have gained traction in Leukocyte classification, using relationship-guided contrastive learning [4,5]. By extracting intrinsic and discriminative representations without extensive manual labeling, these methods offer a promising avenue for analyzing blood cancer cells. Nonetheless, their application to hematological image classification remains limited. Existing CNN methodologies are typically optimized for broader medical imaging domains and fail to adequately account for the distinctive morphological complexity, high intra-class variability, and overlapping cellular structures characteristic of microscopic blood smear images. Consequently, there is a pressing need to design deep learning frameworks tailored to the unique visual and clinical attributes of hematological datasets. This requires incorporating domain-specific inductive biases, optimizing network architectures for fine-grained feature learning, and integrating robust training mechanisms that enhance both accuracy and interpretability. Addressing these requirements is pivotal for achieving reliable automated diagnostic systems in hematopathology.
In this study, we propose a novel hybrid framework for classifying B-ALL subtypes that integrates EfficientNetV2-S with a CBAM and Focal Loss. Although EfficientNetV2, CBAM, and Focal Loss have been proposed previously, their integration into a segmentation-guided hybrid pipeline for multi-stage classification of Acute Lymphoblastic Leukemia has not been thoroughly investigated. The proposed framework introduces a structured pipeline that combines lesion segmentation, ROI-based feature extraction, attention-based feature refinement, and imbalance-aware learning. This design addresses key challenges in leukemia classification, including morphological similarity, class imbalance, and heterogeneous imaging conditions. Therefore, the novelty of this work lies in the unified hybrid framework and its application to multi-stage leukemia classification.

2. Related Works

The classification of blood cell cancers (BCCs) remains challenging due to the complex morphological and visual characteristics of peripheral blood smear images. Factors such as high intra-class variability among WBC types, overlapping cellular structures, and subtle staining differences complicate distinguishing malignant from non-malignant cells. Differentiating BCC subtypes poses additional difficulties, as visual differences between stages are often subtle and fine-grained.
To address these challenges, researchers have investigated diverse feature extraction strategies, which can broadly be categorized into: (1) traditional machine learning models using handcrafted features (e.g., histograms, texture descriptors, and morphological properties), (2) deep learning-based methods that automatically extract high-level features using CNNs and advanced classifiers such as Support Vector Machines (SVMs) or Random Forests (RFs). While handcrafted methods offer interpretability and modest computational requirements [6,7], they suffer from limitations in scalability, robustness to noise, and adaptability to diverse datasets [8,9]. In contrast, CNN-based feature extraction enables the automated discovery of discriminative patterns but often requires large annotated datasets and careful adaptation to the characteristics of hematopathological images. Several studies highlight the potential of deep architectures in hematology. Lu et al. [10] proposed a multiscale WBC classification framework that incorporates a residual-block encoder to mitigate vanishing gradients and capture hierarchical representations of blood smear images. Similarly, Roy et al. [11] developed a DeepLabv3C framework with a ResNet-50 backbone, achieving 96.1% accuracy across three datasets by integrating semantic segmentation and residual learning to improve robustness in cancer detection. Other researchers have explored hybrid methods; for instance, Abdurrazzaq et al. [12] applied singular value decomposition (SVD) to vascular pattern detection, while Khomairoh et al. [13] employed Haar cascades for nucleus and cytoplasm segmentation in acute myeloid leukemia (AML) subtypes, achieving accuracies ranging from 71% to 90%. Comparative studies also reveal trade-offs between handcrafted and deep features. Hegde et al. [14] demonstrated that handcrafted descriptors focusing on morphological and chromatic cues achieved performance comparable to that of AlexNet-derived deep features, with an overall accuracy of 99%, underscoring the value of interpretability in clinical contexts. Feature fusion frameworks further enhance performance; for example, Saleem et al. [15] combined DarkNet-53 and ShuffleNet, achieving 98.6% segmentation accuracy while balancing semantic depth with computational efficiency. Likewise, Ramya et al. [16] employed gray-level co-occurrence matrix (GLCM) descriptors to distinguish healthy from malignant cells. Beyond CNNs, researchers have employed a diverse range of machine learning and optimization techniques. Puigdollers et al. [17] used a Bag-of-Words (BoW) approach, achieving 80% accuracy while providing interpretability, while Hussein et al. [18] introduced a platelet-based classification approach enhanced by Bee Colony and Reptile Search Optimization. H. Rai et al. [19] evaluated pancreatic, prostate, colorectal, and leukemia cancers using standard Machine Learning (ML) and Deep Learning (DL) techniques, highlighting the need for improved cancer diagnosis and treatment. Swanson et al. [20] discussed the use of ML methods in analyzing medical imaging and genetic data for cancer applications, advocating strategies to enhance clinical effectiveness. Aly et al. [21] introduced a method for training a Multi-Layer Perceptron (MLP) using the Hunger Games Optimization (HGO) technique, which improved classification accuracy for cervical cancer. Mahesh et al. [22] presented a hybrid of Ant Lion Mutation, Ant Colony Optimization, and Particle Swarm Optimization, achieving an SVM prediction accuracy of 87.8% for optimal feature selection. Wais et al. [23] developed a pipeline for categorizing acute lymphoblastic leukemia, using a novel neighborhood pixel transformation with differential evolution to enhance the clarity of blood cell images. Recent developments in the field increasingly emphasize the integration of deep learning architectures with ensemble-based strategies. For instance, Nssibi et al. [24] proposed the iBABC-CGO framework, which synergistically combines bee colony optimization with chaotic game-theoretic principles to enhance exploration within the feature space. Similarly, Vogelbacher et al. [25] utilized a dual deep neural network architecture for avian blood cell recognition, illustrating the cross-domain versatility of CNNs. Traditional feature extraction techniques such as Speeded-Up Robust Features (SURF) [26], Scale-Invariant Feature Transform (SIFT) [27], and Histograms of Oriented Gradients (HoG) [28], remain critical preprocessing components; however, their capability is frequently outperformed by CNN-based feature learning approaches [29]. Evidence from [30] demonstrated that HoG descriptors, combined with logistic regression, can effectively support feature extraction for leukemia prediction on the ALL-IDB dataset. Complementary work in [31] analyzed color and texture features derived from histogram-based thresholding and watershed segmentation, and outlined the influence of different feature-extraction pipelines. Among classical detectors, SIFT [32] remains notable for its specialized detection capabilities. At the same time, object recognition tasks commonly rely on segmentation-driven pipelines incorporating both quantitative and qualitative feature analysis and matching [33]; however, such conventional approaches often exhibit limited robustness. In contrast, CNN-based methods automate feature extraction and enable superior performance in complex leukocyte classification scenarios [34,35,36]. Within the broader spectrum of deep learning research [37,38,39], pre-trained architectures such as AlexNet [40], VGG-16 [41], and Inception-V3 [42] have emerged as highly effective feature extractors and selection mechanisms. These models have also served as foundational components in advanced analytical frameworks such as the Simulation of Electron Spectra for Surface Analysis (SESSA). At the same time, work in [43] further demonstrated the potential of SVM-based methodologies for detecting acute lymphoblastic leukemia (ALL). Additional studies have explored hybrid pipelines, including the integration of K-means clustering and SVMs to improve performance in microscopic ALL recognition [44,45,46,47]. More recent research trends highlight the growing dominance of deep learning-driven ALL classification, in which CNNs, including custom architectures, yield highly competitive results across training and validation settings [48]. In particular, Saeed et al. [49] introduce a weighted ensemble CNN framework that enhances diagnostic performance for ALL detection in microscopic images. (Table 1).

3. Research Gap and Contributions

A review of the existing literature on blood cancer analysis reveals that most feature-extraction methods have focused primarily on images of normal or healthy blood cells. Researchers have focused on standard WBC types such as neutrophils, eosinophils, and lymphocytes, mainly because of the greater availability of well-annotated datasets. While these studies have advanced our understanding of cellular morphology, they often overlook the complexities of pathological smear images from cancer patients. A significant challenge is the scarcity of annotated datasets for malignant cells, which typically exhibit considerable morphological variability and irregular staining. This limitation has constrained the development of robust and generalizable classification models.
To address this gap, the present study introduces feature-extraction strategies tailored to pathological blood smear images to detect and classify malignant cell types. The focus is placed on capturing morphological, chromatic, and textural alterations associated with malignant transformation, with particular emphasis on the multi-class recognition of B-cell acute lymphoblastic leukemia (B-ALL) subtypes: Benign, Pro-B, Pre-B, and Early Pre-B. By focusing on pathological rather than healthy cells, this study aims to enhance the diagnostic applicability of automated frameworks in hematopathology. The key contributions of this study are as follows:
  • A segmentation-guided pipeline is proposed for accurate ROI extraction from peripheral blood smear images.
  • A lightweight EfficientNetV2-S backbone with CBAM attention is introduced for refined feature learning.
  • A hybrid feature refinement strategy using CBAM and focal loss is designed to address class imbalance and morphological similarity.
  • Extensive experiments demonstrate superior performance compared with conventional CNN architectures.

4. Methodology

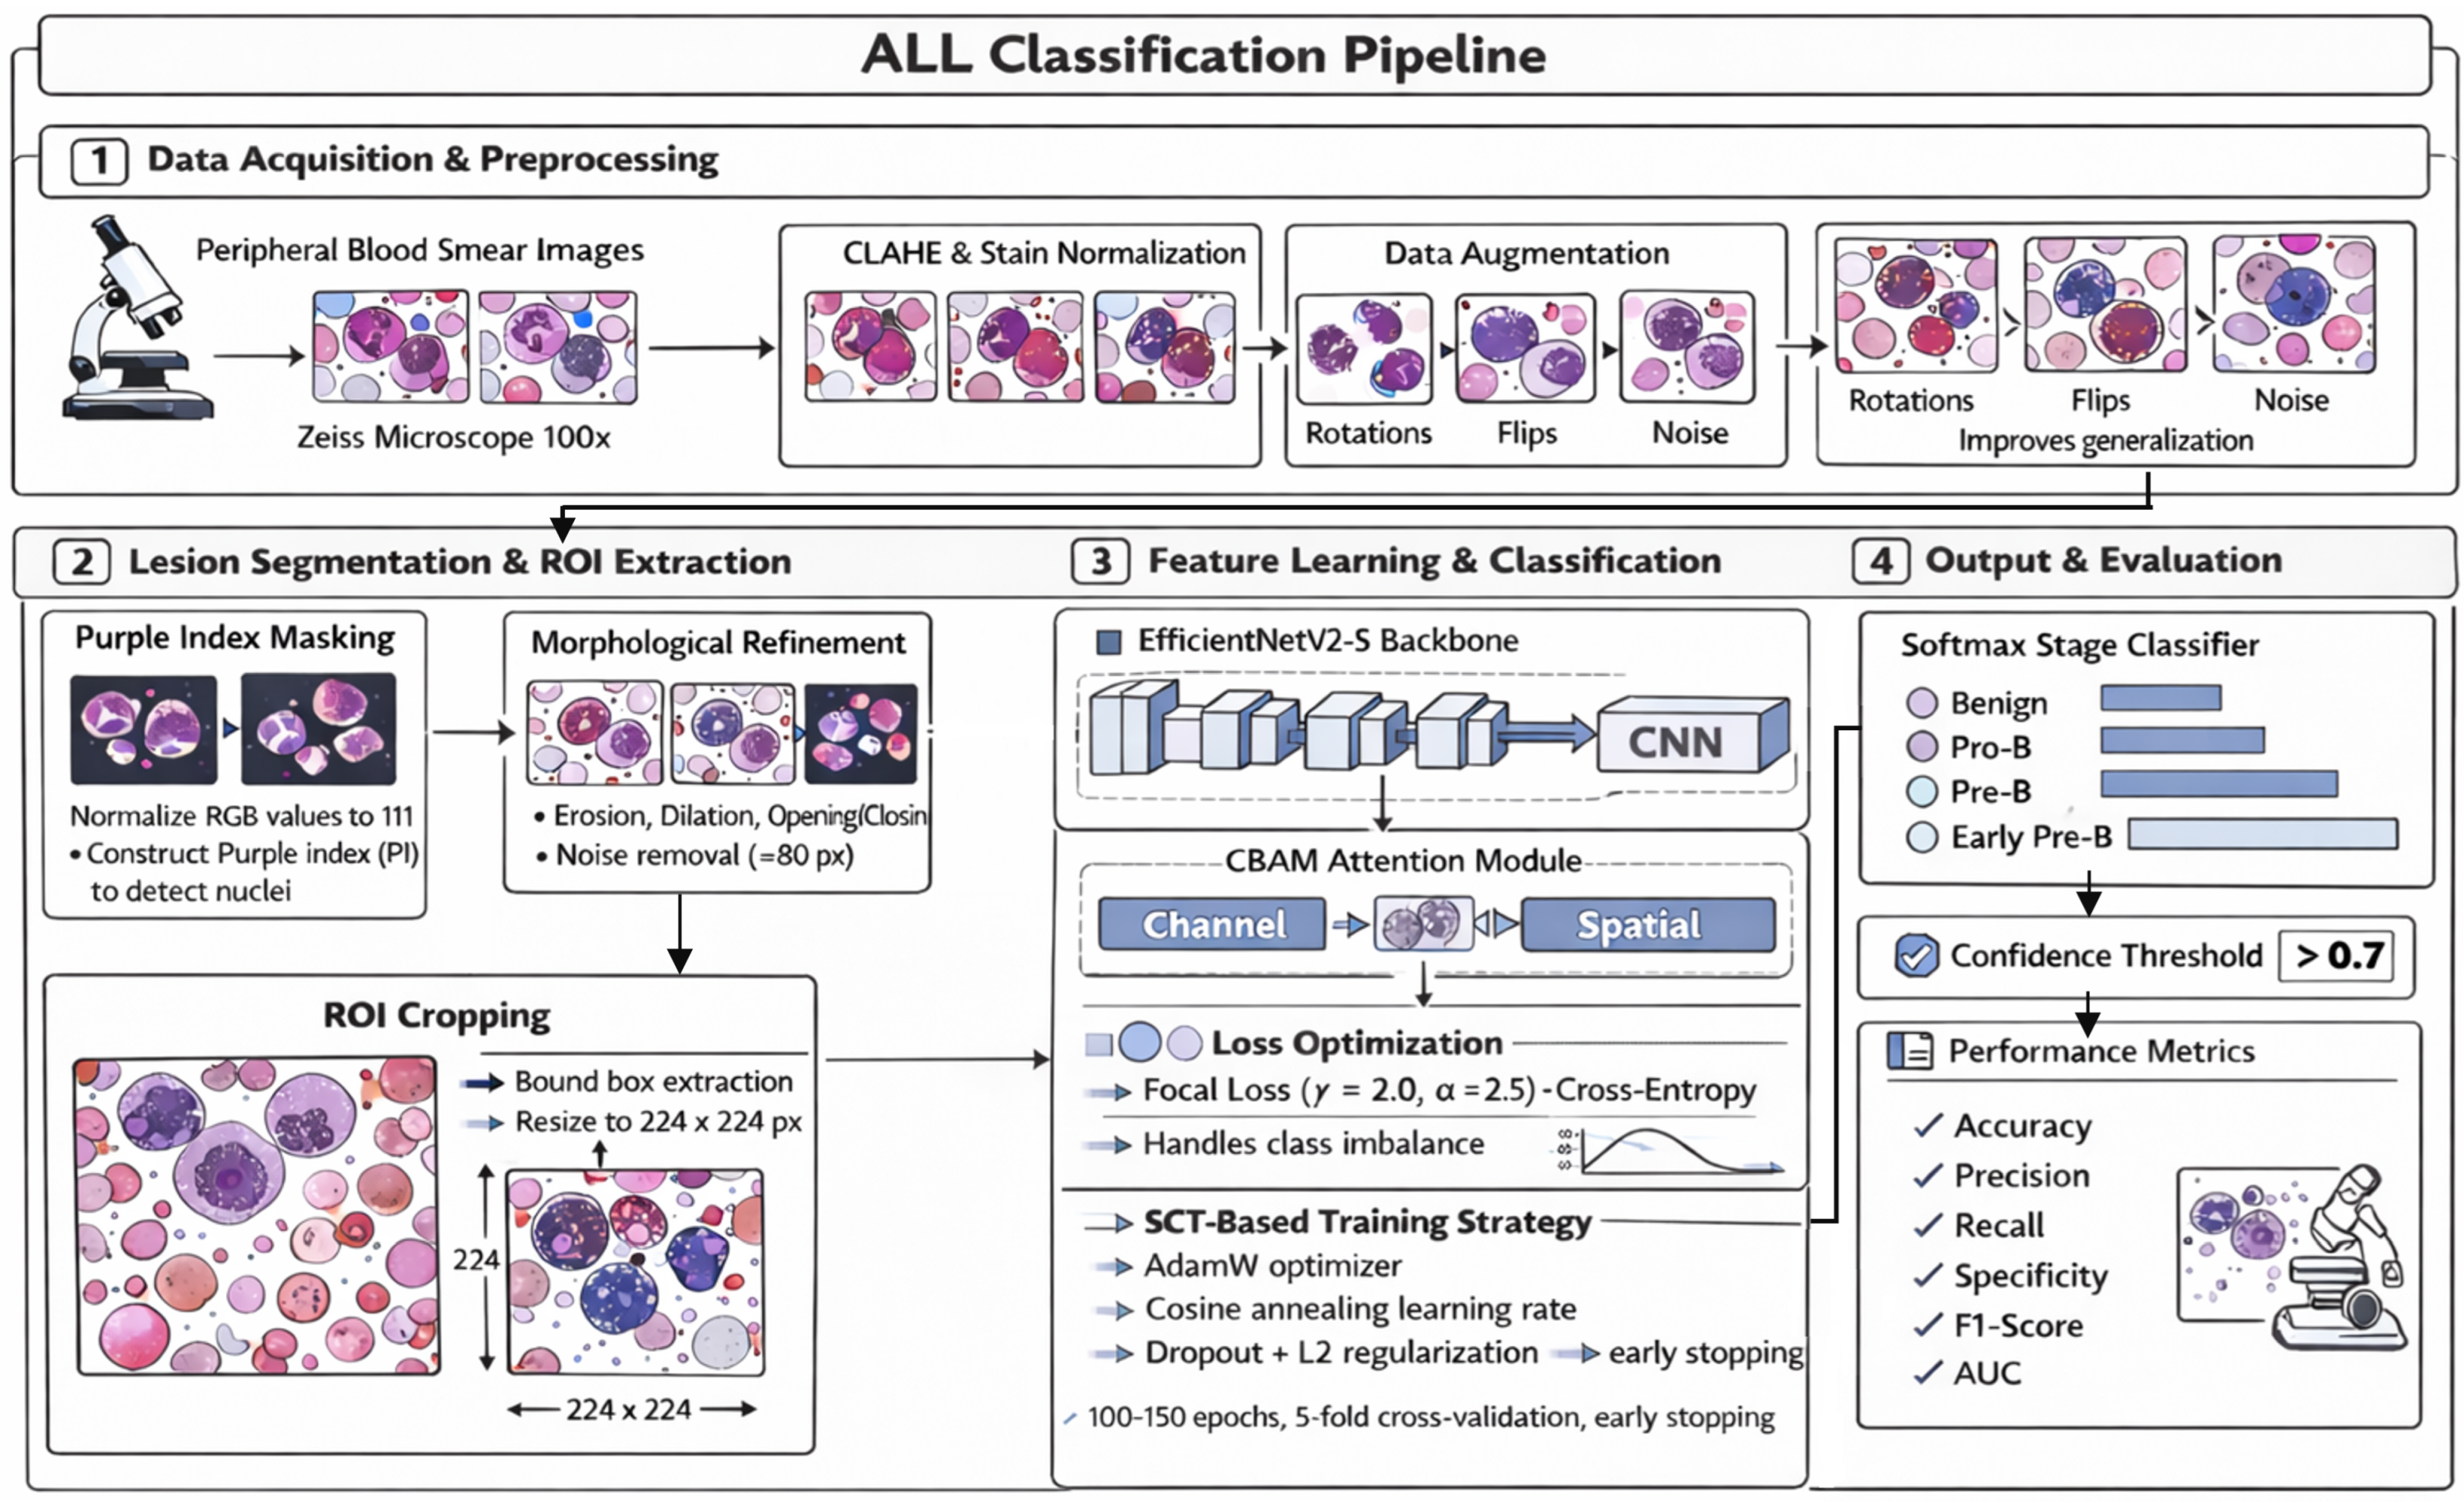
This study proposes a lightweight deep learning framework for efficient and interpretable classification of blood cancer cell images. The methodological pipeline consists of four sequential stages: (1) data preprocessing, (2) lesion segmentation and ROI extraction, (3) deep feature refinement using EfficientNetV2-S integrated with the Convolutional Block Attention Module (CBAM), and (4) final multi-class classification optimized with Focal Loss. Each stage is systematically designed to enhance image quality, emphasize diagnostically relevant cellular structures, improve discriminative feature learning, and achieve robust classification performance while maintaining computational efficiency. All image-processing procedures, network implementation, model training, hyperparameter configuration, and performance evaluation were conducted in MATLAB 2026a, using the Image Processing Toolbox, Deep Learning Toolbox, and Computer Vision Toolbox. The overall architecture of the proposed system is depicted in Figure 1, which illustrates the integration of preprocessing techniques, segmentation-guided ROI extraction, lightweight network architecture, attention-based refinement, and imbalance-aware optimization into a unified diagnostic framework.
The proposed pipeline is carefully designed to improve model generalization across heterogeneous datasets with variations in staining protocols, imaging devices, and acquisition conditions. First, contrast-limited adaptive histogram equalization (CLAHE) enhances local contrast and reduces illumination inconsistencies, enabling the model to learn robust visual features. Second, Reinhard stain normalization standardizes color distributions across images, minimizing variability caused by different staining procedures and laboratory conditions. Third, data augmentation techniques, including rotation, flipping, and noise injection, increase dataset diversity and prevent overfitting. Furthermore, segmentation-based ROI extraction focuses the model on biologically relevant lesion regions while reducing background noise, thereby improving feature consistency across datasets. Finally, the CBAM attention mechanism enhances feature learning by emphasizing informative spatial and channel-wise representations, improving robustness to inter-dataset variations. Together, these components improve the generalization capability of the proposed framework across heterogeneous medical imaging datasets.

4.1. Dataset

The dataset used in this study is adapted from [50] and contains peripheral blood smear images for the classification of Acute Lymphoblastic Leukemia (ALL). Compared with other publicly available leukemia datasets, the dataset in [50] provides several advantages. First, it includes multi-class annotations, including Benign, Pro-B, Pre-B, and Early Pre-B categories, which allow comprehensive evaluation of multi-stage leukemia classification. Many existing datasets provide only binary classification (benign vs. malignant), limiting their usefulness for fine-grained classification tasks. Second, the dataset contains high-resolution microscopic images with consistent staining and imaging conditions, which improves feature extraction and model performance. Third, the dataset is expert-annotated, ensuring reliable ground truth labels for training and evaluation. Additionally, the dataset includes sufficient sample diversity, covering variations in cell morphology, staining intensity, and imaging conditions, which enhances model generalization. Compared with other leukemia datasets, the dataset used in this study provides more detailed subclass information and higher-quality annotations. These characteristics make the dataset particularly suitable for evaluating multi-stage leukemia classification models and validating the effectiveness of the proposed framework.

4.2. Blood Cell Lesion Segmentation and Classification

4.2.1. Lesion Mask

In this stage, lesion regions corresponding to leukemic cell nuclei are segmented from peripheral blood smear (PBS) images using intensity-based thresholding in the RGB color space [51]. Unlike HSV or LAB transformations, which require nonlinear conversions and may distort original intensity distributions, the RGB-based approach retains the native pixel values. This reduces computational complexity, preserves the morphological integrity of leukemic nuclei, and provides a consistent basis for subsequent feature extraction. Let the original color image be denoted as Equation (1).
I x , y = R x , y , G x , y , B x , y , R , G , B 0 , 255
where R(x, y), G(x, y), and B(x, y) represent the intensities of the red, green, and blue channels at pixel coordinates (x, y).

4.2.2. Normalization

Normalization is a crucial preprocessing step in medical image analysis, as it mitigates the influence of illumination variability, staining inconsistencies, and acquisition artifacts, thereby ensuring that the model learns discriminative features rather than noise. In this study, the RGB values of each pixel were normalized to the [0, 1] range, standardizing input intensity levels across all images and improving model convergence during training. For each pixel location (x, y), the normalized red, green, and blue channel intensities are computed using Equation (2).
R n x , y = R x , y 255 , G n x , y = G x , y 255 , B n x , y = B x , y 255
where R(x, y), G(x, y), and B(x, y) represent the original channel values, each ranging from 0 to 255, and dividing by 255 scales the values to the range [0, 1], which facilitates numerical stability during backpropagation and prevents saturation in activation functions, the normalized RGB image is then represented as Equation (3).
I x , y = R n x , y , G n x , y , B n x , y

4.2.3. Color-Based Segmentation Using Purple Index

Accurate detection of leukemic nuclei is essential for reliable classification of Acute Lymphoblastic Leukemia (ALL) subtypes. In peripheral blood smear images, leukemic nuclei typically appear in shades of purple due to hematoxylin staining, which enhances the red and blue channels while suppressing the green channel. This distinctive chromatic characteristic provides an effective cue for detecting lesion regions. To exploit this property, we introduce a Purple Index (PI), which enhances pixels corresponding to leukemic nuclei while suppressing background and cytoplasmic regions [52]. The Purple Index is computed using normalized RGB channels, where higher red and blue intensities relative to green indicate potential lesion areas. By emphasizing these color characteristics, the PI improves lesion localization and reduces background noise, which is particularly important in heterogeneous imaging conditions. The PI at each pixel (x, y) is computed using Equation (4).
P I x , y = R n x , y + B n x , y 2 G n x , y
where Rn(x, y), Gn(x, y), and Bn(x, y) represent normalized RGB channel intensities. Pixels with higher PI values are more likely to correspond to leukemic nuclei, as these regions exhibit stronger purple coloration. This approach improves segmentation accuracy and enhances the robustness of lesion detection prior to classification. The use of the Purple Index provides several advantages. First, it improves lesion localization by leveraging domain-specific color characteristics of leukemic cells. Second, it reduces background interference from cytoplasm and non-cellular regions. Third, it enhances robustness across heterogeneous datasets with varying staining conditions. These advantages make the Purple Index an effective preprocessing step for improving classification performance in multi-stage leukemia detection.

4.2.4. Binary Thresholding

Following color-based segmentation, a binary mask M(x, y) is generated to delineate potential lesion regions from the background. Each pixel is classified as a lesion (foreground = 1) or non-lesion (background = 0) depending on whether its Purple Index (PI) value exceeds a predefined threshold θ. In this study, the threshold value was empirically selected within the range of [0.1, 0.3] based on preliminary experiments. A value of θ = 0.2 was chosen, as it provided the best trade-off between lesion detection sensitivity and background noise suppression across the dataset. This process is formally expressed in Equation (5) [53].
M x , y = 1 ,   if   P I x , y θ 0 ,   otherwise
where θ [ 0.1 , 0.3 ] is determined through empirical analysis of training images or automatically using Otsu’s adaptive thresholding method. The range was selected to balance sensitivity (the ability to detect all potential lesion pixels) and specificity (the ability to suppress background noise). Alternatively, lesion regions can be defined by applying absolute constraints on the RGB channels, as shown in Equation (6).
M x , y = 1 ,   if   R n x , y > τ R , B n x , y > τ B ,   G n x , y > τ G   0 ,   otherwise
where R n ( x , y ) , G n ( x , y ) , B n ( x , y ) are the normalized channel intensities, and τ R , τ B , τ G are channel-specific thresholds. Based on statistical distribution analysis across the dataset, typical values were set as τ R = 0.5   ( red channel ) , τ B = 0.4   ( blue channel ) , τ G = 0.3   ( green channel ) . These values were optimized to capture the chromatic profile of leukemic nuclei, which exhibit higher red and blue intensities relative to green.

4.2.5. Morphological Refinement

Once the binary mask M(x, y) is generated, it often exhibits irregular boundaries, fragmented nuclei, and small spurious regions of noise due to intensity fluctuations or staining variability. To address these issues, a series of morphological operations is applied using a structuring element S, typically a disk-shaped kernel, because its isotropy preserves circular and elliptical nuclear shapes. The first operation, erosion, removes pixels from the boundaries of the foreground (lesion) objects, thereby eliminating small noise components and refining the edges of detected nuclei. This is followed by dilation, which expands the boundaries of foreground regions and reconnects fragmented lesion areas. The dilation operator is formally defined in Equation (7).
δ M = M S = z Z 2 S ref z M θ
where is the dilation operator and Sref is the reflection of the structuring element. To further enhance segmentation, the opening operation is employed, a compound transformation that consists of erosion followed by dilation. Opening is particularly effective at eliminating small non-lesion regions (false positives) and smoothing object boundaries. It is defined in Equation (8).
O M = δ ε M = M refined
where Ɛ(M) denotes erosion. This yields a refined mask Mrefined that more accurately represents lesion regions. In this study, morphological refinement was performed using a circular structuring element with a radius of 3 pixels, selected to preserve the natural elliptical morphology of leukemic nuclei. Both erosion and dilation operations were applied twice to balance noise suppression and structural preservation. Following these operations, connected-component filtering was used to remove small objects (<80 pixels) considered noise, while retaining larger biologically relevant nuclei. Finally, a Gaussian smoothing filter (σ = 1.0) was applied to the refined binary mask to smooth lesion boundaries, improving the accuracy and stability of subsequent feature extraction and classification.

4.2.6. Extracted Lesion

To facilitate lesion-level analysis and enable deep learning-based classification, it is essential to isolate lesion-containing regions from the full microscopic image. This process, referred to as Region of Interest (ROI) Cropping, leverages the binary lesion mask M ( x , y ) { 0 , 1 } generated in earlier steps, in which pixels labeled 1 correspond to suspected lesion regions. The purpose of this step is to reduce irrelevant background information and focus computational resources on diagnostically meaningful nuclear areas. For each detected lesion i, a minimum bounding rectangle Ri defines the spatial extent of the rectangular region enclosing lesion i. Formally, the cropped lesion patch IROI is extracted from the original RGB image I(x, y) according to Equation (9).
I R O I = I x , y x , y R i
where I(x, y) represents the original RGB image, and Ri denotes the bounding rectangle of the i-th lesion. To prepare lesion patches for CNN, it is critical to maintain a uniform input size. Therefore, each extracted lesion patch is resized to a fixed resolution of 224 × 224 pixels using bilinear interpolation, as expressed in Equation (10).
I resized = resize I R O I , 224 , 224
This resizing ensures compatibility with widely used CNN backbones, such as MobileNetV3 and EfficientNet, which typically require square inputs of 224 × 224 or 256 × 256 pixels.

4.2.7. Marker-Based Watershed Segmentation

The watershed transform is a fundamental technique in mathematical morphology and topographic modeling, frequently employed for image segmentation tasks involving touching or overlapping objects. Its principle is analogous to a topographic landscape, where pixel intensities represent elevation: ridges (high gradients) correspond to object boundaries, while valleys (low intensities) correspond to homogeneous regions within objects. By simulating landscape flooding, watershed lines emerge at points where catchment basins meet, thereby separating adjacent objects [54]. Given an RGB image I(x, y), the first step is to convert it to grayscale, ensuring that intensity-based operations are performed uniformly across all channels. This is achieved using a luminance-preserving linear transformation as defined in Equation (11).
G ( x , y ) = 0.299 R ( x , y ) + 0.587 G ( x , y ) + 0.114 B ( x , y )
where R(x, y), G(x, y), and B(x, y) are the red, green, and blue channel intensities, respectively. To suppress noise and prepare for thresholding, a Gaussian blur with a standard deviation of σ = 2 is applied. This smooths intensity variations while retaining prominent edges. Foreground (lesion candidates) and background regions are then separated using Otsu’s global thresholding, which adaptively determines the optimal threshold TOtsu by minimizing intra-class variance. The binary mask is formally defined in Equation (12).
M ( x , y ) = 1 ,   G ( x , y ) > T Otsu 0 ,   Otherwise
where ( x b , y b ) B denotes the set of background pixels. These distance peaks serve as markers for initiating the watershed algorithm. For watershed segmentation, a Gaussian blur with a 5 × 5 kernel and σ = 2 was applied to suppress noise while preserving nuclear boundaries. Otsu’s method was used to determine the adaptive threshold TOtsu for binary mask generation, ensuring robustness to staining variability. The Euclidean distance transform was computed, and connected-component labeling was used to identify distinct local maxima as potential lesion centers. To prevent over-segmentation, only distance peaks exceeding 50% of the maximum distance were retained as watershed markers. Finally, the watershed segmentation output was overlaid onto the original RGB images to preserve the interpretability of lesion boundaries for subsequent feature extraction and classification.
To initialize the flooding process in the watershed algorithm, potential lesion centers are first identified by computing the local maxima on the Euclidean distance transform D(x, y). These maxima correspond to the points furthest from background pixels, i.e., the centers of nuclei or lesion candidates. To ensure that only valid regions are considered, a connected-component analysis is performed in which each local maximum must satisfy a minimum area threshold of 127 pixels to eliminate noise and very small spurious detections. Candidate markers are further refined either by morphological dilation to slightly expand them or by thresholding the inverse distance map to separate adjacent nuclei. Markers must be non-overlapping and distinct, and each is assigned a unique integer label, as defined in Equation (13).
M marker ( x , y ) 0 , 1 , 2 , , N
where N denotes the total number of seed points corresponding to suspected lesion regions. Once markers are established, the watershed algorithm is applied to the negative of the distance transform, treating peaks as basins. This ensures that areas around each seed point expand outward until they meet neighboring regions at watershed ridges, effectively separating lesions that touch or overlap. The segmentation output is expressed in Equation (14).
L ( x , y ) = Watershed D ( x , y ) , M marker
where L(x, y) is a label matrix in which each segmented lesion receives a unique identifier. The watershed boundaries are explicitly encoded in the label matrix and overlaid on the original RGB image to facilitate interpretability. Watershed ridge pixels are typically highlighted in contrasting colors to distinguish boundaries between adjacent nuclei. Each connected region receives a distinct integer label as expressed in Equation (15).
L ( x , y ) 0 , 1 , 2 , , N
For marker-based watershed segmentation, local maxima were extracted from the Euclidean distance map using a minimum area threshold of 127 pixels to remove spurious detections, and markers were refined by morphological dilation with a circular structuring element of radius 2 pixels. To handle overlapping nuclei, inverse distance map thresholding was applied with a cutoff of 0.4 × max(D(x, y)) to ensure distinct seed regions. The watershed algorithm was then applied to the negative distance map, initialized with the refined markers. Each segmented nucleus was assigned a unique integer label, and watershed ridge pixels were highlighted in red overlays to visualize boundaries, thereby ensuring accurate separation of adjacent lesion regions while minimizing over-segmentation.

4.2.8. Hybrid Feature Refinement Stage

The hybrid feature refinement stage is applied after ROI extraction and within the deep learning framework before the final classification layer. This stage combines EfficientNetV2-S feature extraction with attention-based refinement using the Convolutional Block Attention Module (CBAM). First, the extracted ROI images are passed through the EfficientNetV2-S backbone to generate deep feature maps. These feature maps are then refined using CBAM, which sequentially applies channel attention and spatial attention to emphasize informative regions and suppress irrelevant background features. Following attention refinement, focal loss optimization is applied during training to address class imbalance and improve classification robustness. The hybrid feature refinement stage enhances discriminative feature learning by integrating backbone feature extraction, attention-based feature refinement, and imbalance-aware optimization. This process improves classification accuracy and generalization performance across leukemia subtypes.

4.2.9. Classification: EfficientNetV2-S + CBAM with Focal Loss Optimization

To achieve high-accuracy classification of blood smear lesion patches into the four clinically significant categories (Benign, Pre-B, Pro-B, and Early Pre-B), we propose an advanced lightweight deep learning framework that integrates EfficientNetV2-S with the CBAM and employs Focal Loss for optimization. A dropout rate of 0.3 was applied to the EfficientNetV2-S backbone to prevent overfitting during feature extraction and improve generalization. This hybrid architecture provides a balanced compromise among classification precision, computational efficiency, and robustness to class imbalance, a recurring challenge in hematological imaging datasets.

4.2.10. Model Architecture

The backbone of the proposed system is EfficientNetV2-S, a compact yet high-performing CNN that strikes an optimal balance between accuracy and computational cost. EfficientNetV2-S adopts a compound scaling strategy that jointly adjusts depth (number of layers), width (number of channels per layer), and resolution (input image size), thereby maximizing performance under computational constraints [55]. Each block in EfficientNetV2-S consists of either MBConv or Fused-MBConv layers, where MBConv layers are based on inverted residual structures combined with depthwise separable convolutions. Formally, an MBConv block is expressed in Equation (16) [56].
MBConv ( x ) = B N ( DWConv ( Swish ( B N ( Con v 1 × 1 ( x ) ) ) ) )
where Conv1×1 denotes pointwise convolution for dimensionality adjustment, DWConv represents depthwise convolution, BN is batch normalization, and Swish serves as the activation function. To further enhance feature discriminability, CBAM (Convolutional Block Attention Module) is applied after each MBConv block. CBAM sequentially refines features using Channel Attention (CA) and Spatial Attention (SA). The Channel Attention module computes channel-wise importance weights Mc(F), while the Spatial Attention module computes spatial attention weights Ms(F). These mechanisms emphasize informative features and suppress irrelevant background regions. Their formulations are expressed in Equations (17) and (18).
M c ( F ) = σ ( MLP ) ( AvgPool ( F ) ) + MLP ( MaxPool ( F ) ) )
M s ( F ) = σ ( Con v 7 × 7 ) ( [ AvgPool ( F ) ; MaxPool ( F ) ] ) )
where σ is the sigmoid function, MLP is a shared multi-layer perceptron, and Conv7×7 denotes a convolutional operation with a 7 × 7 kernel applied to concatenated average-pooled and max-pooled features. The proposed model was trained on 224 × 224 lesion patches with a batch size of 32 using the AdamW optimizer. The initial learning rate was set to 1 × 10⁻⁵ for regularization. The CBAM used a reduction ratio of 16 for channel attention and a 7 × 7 convolution kernel for spatial attention. To address class imbalance, Focal Loss was employed with γ = 2.0 and α = 0.25. The network was trained for up to 100 epochs with early stopping based on validation loss using a patience of 15 epochs. All ablation models were evaluated under identical settings using the EfficientNetV2-S backbone. To evaluate the effectiveness of the Convolutional Block Attention Module (CBAM), we conducted an ablation study comparing CBAM with other commonly used attention mechanisms, including SE (Squeeze-and-Excitation), ECA (Efficient Channel Attention), and BAM (Bottleneck Attention Module). All models were trained under identical experimental settings with the EfficientNetV2-S backbone and evaluated on a 70:30 train–test split (see Table 2).

4.2.11. Loss Function

One of the most critical challenges in medical image classification is class imbalance, in which certain classes are underrepresented relative to benign samples. This imbalance can bias the classifier toward majority classes, leading to reduced sensitivity for minority categories that are clinically more significant. To address this problem, we employed the Focal Loss function as the optimization objective, which is effective in medical imaging and object detection tasks involving imbalanced datasets. The Focal Loss modifies the standard categorical cross-entropy by introducing a modulating factor that emphasizes hard-to-classify samples while down-weighting the contribution of well-classified examples. It is defined in Equation (19).
FL ( p t ) = α t ( 1 p t ) γ log ( p t )
where pt denotes the predicted probability of the true class, αt is a class-balancing weight, and γ is the focusing parameter. The term (1 − pt)γ ensures that correctly classified examples with high confidence contribute less to the loss, while misclassified or low-confidence samples receive greater emphasis. In this study, the class-balancing factor was set to αt = 0.25 for all four classes, providing equal weighting across categories during training. Rather than directly compensating for class imbalance with class-specific weights, the proposed framework relies primarily on the Focal Loss’s focusing parameter γ to address data imbalance. The focusing term reduces the contribution of well-classified samples and emphasizes hard-to-classify examples, which are typically associated with minority classes. This strategy helps mitigate bias toward dominant classes while maintaining stable learning across all categories. The focusing parameter was set to γ = 2.0, which has been shown to effectively balance model performance and training stability in imbalanced classification problems.

4.3. Training Settings

The training procedure was designed to ensure stability, robustness, and generalization in classifying blood smear lesion patches. The proposed EfficientNetV2-S + CBAM model was optimized using the AdamW optimizer together with a cosine annealing learning-rate schedule, which together provide a balance between fast convergence and long-term stability. The optimization process is described mathematically in Equations (20) and (21) [57].
m t = β 1 m t 1 + ( 1 β 1 ) L ( θ t ) , v t = β 2 v t 1 + ( 1 β 2 ) L ( θ t ) 2 θ t + 1 = θ t η m t v t + λ θ t
η t = η min + 1 2 η max η min 1 + cos T cur T max π
where mt and vt denote the first and second moment estimates, β1 and β2 are exponential decay rates for the moving averages, nt is the learning rate at iteration t, and λ represents the weight decay term for L2 regularization. The cosine annealing mechanism gradually decreases the learning rate in a cyclic manner, allowing the optimizer to escape sharp local minima and converge toward flatter, more generalizable solutions. Each segmented lesion patch was resized to 224 × 224 × 3 and processed in batches of 32. The optimizer parameters were set to β1 = 0.9, β2 = 0.999, and = 1 × 10⁻⁸. The initial learning rate was fixed at 3 × 10⁻⁴ and progressively reduced to a minimum of 1 × 10⁻⁶ through cosine annealing. To reduce overfitting, a dropout rate of 0.5 was applied in the final fully connected classification layer, while weight decay was set to 1 × 10⁻⁵ for L2 regularization. The network was trained for up to 100 epochs with early stopping based on validation loss using a patience of 15 epochs. Model performance was assessed using 5-fold cross-validation to improve robustness and minimize sampling bias. Two early stopping strategies were used: (1) patience = 10 for initial training, (2) patience = 15 for cross-validation and final model refinement. In addition, a dropout rate of 0.5 was applied in the final fully connected classification layer to further reduce overfitting and improve model robustness. This higher dropout rate at the classification stage helps prevent co-adaptation among neurons and improves generalization.

4.4. Output and Prediction

The final stage of the proposed framework produces classification probabilities using a Softmax function, which transforms the raw logits into a normalized probability distribution over the four clinically relevant classes: Benign, Pre-B, Pro-B, and Early Pre-B. For a given input lesion patch, the raw network output zi is converted into class probabilities using Equation (22).
y ^ i , j = softmax ( z i , j ) = e Z i , j k = 1 C e Z i , k , j { 1 , , 4 }
where zi denotes the logit value for class j of sample i, and C = 4 represents the total number of output categories. The predicted class label c ^ i is then assigned as the index corresponding to the highest probability, as defined in Equation (23).
c ^ i = arg max j   y ^ i , j
To improve decision reliability, a Softmax confidence threshold of 0.7 was used; predictions below this threshold were treated as uncertain and flagged for further review. This approach reflects the clinical need for high-confidence decisions, where uncertain predictions may require further manual verification by pathologists.

5. Experimental Results

The performance of the proposed lightweight EfficientNetV2-S + CBAM framework was evaluated using publicly available Acute Lymphoblastic Leukemia (ALL) datasets. Experiments were conducted on a high-performance computing platform equipped with an Intel Core i7-6700K processor (4.00 GHz), 48 GB RAM, and an AMD Radeon R9 M395X GPU with 4 GB memory. The evaluation focused on four clinically relevant categories: Benign, Pre-B, Pro-B, and Early Pre-B cells. To ensure reliability, two dataset partition strategies were employed: 70:30 and 60:40 training–testing splits. Each experiment was repeated eight times, and the average results were reported.

5.1. Evaluation Metrics

To comprehensively evaluate the classification performance of the proposed model, several widely used performance metrics in medical image analysis were employed, including Accuracy, Precision, Recall (Sensitivity), Specificity, F1-score, and Area Under the Receiver Operating Characteristic Curve (AUC). Accuracy measures the overall correctness of the classification model and is defined as Accuracy = (TP + TN)/(TP + TN + FP + FN), where TP, TN, FP, and FN represent true positives, true negatives, false positives, and false negatives, respectively. Precision evaluates the reliability of positive predictions and is calculated as Precision = TP/(TP + FP), while Recall (Sensitivity) measures the model’s ability to correctly identify leukemia cases and is defined as Recall = TP/(TP + FN). Specificity assesses the model’s ability to correctly identify non-leukemia samples and is defined as Specificity = TN/(TN + FP). The F1-score provides a balanced measure between precision and recall and is computed as F1-score = (2 × Precision × Recall)/(Precision + Recall). In addition, the Area Under the Receiver Operating Characteristic Curve (AUC) evaluates the model’s discriminative capability by measuring the trade-off between the true positive rate and the false positive rate across classification thresholds. A higher AUC value indicates better classification performance and stronger discriminative power. These evaluation metrics collectively provide a comprehensive and reliable assessment of the proposed model for multi-class classification of Acute Lymphoblastic Leukemia.

5.2. Results Using 70:30 Train–Test Split

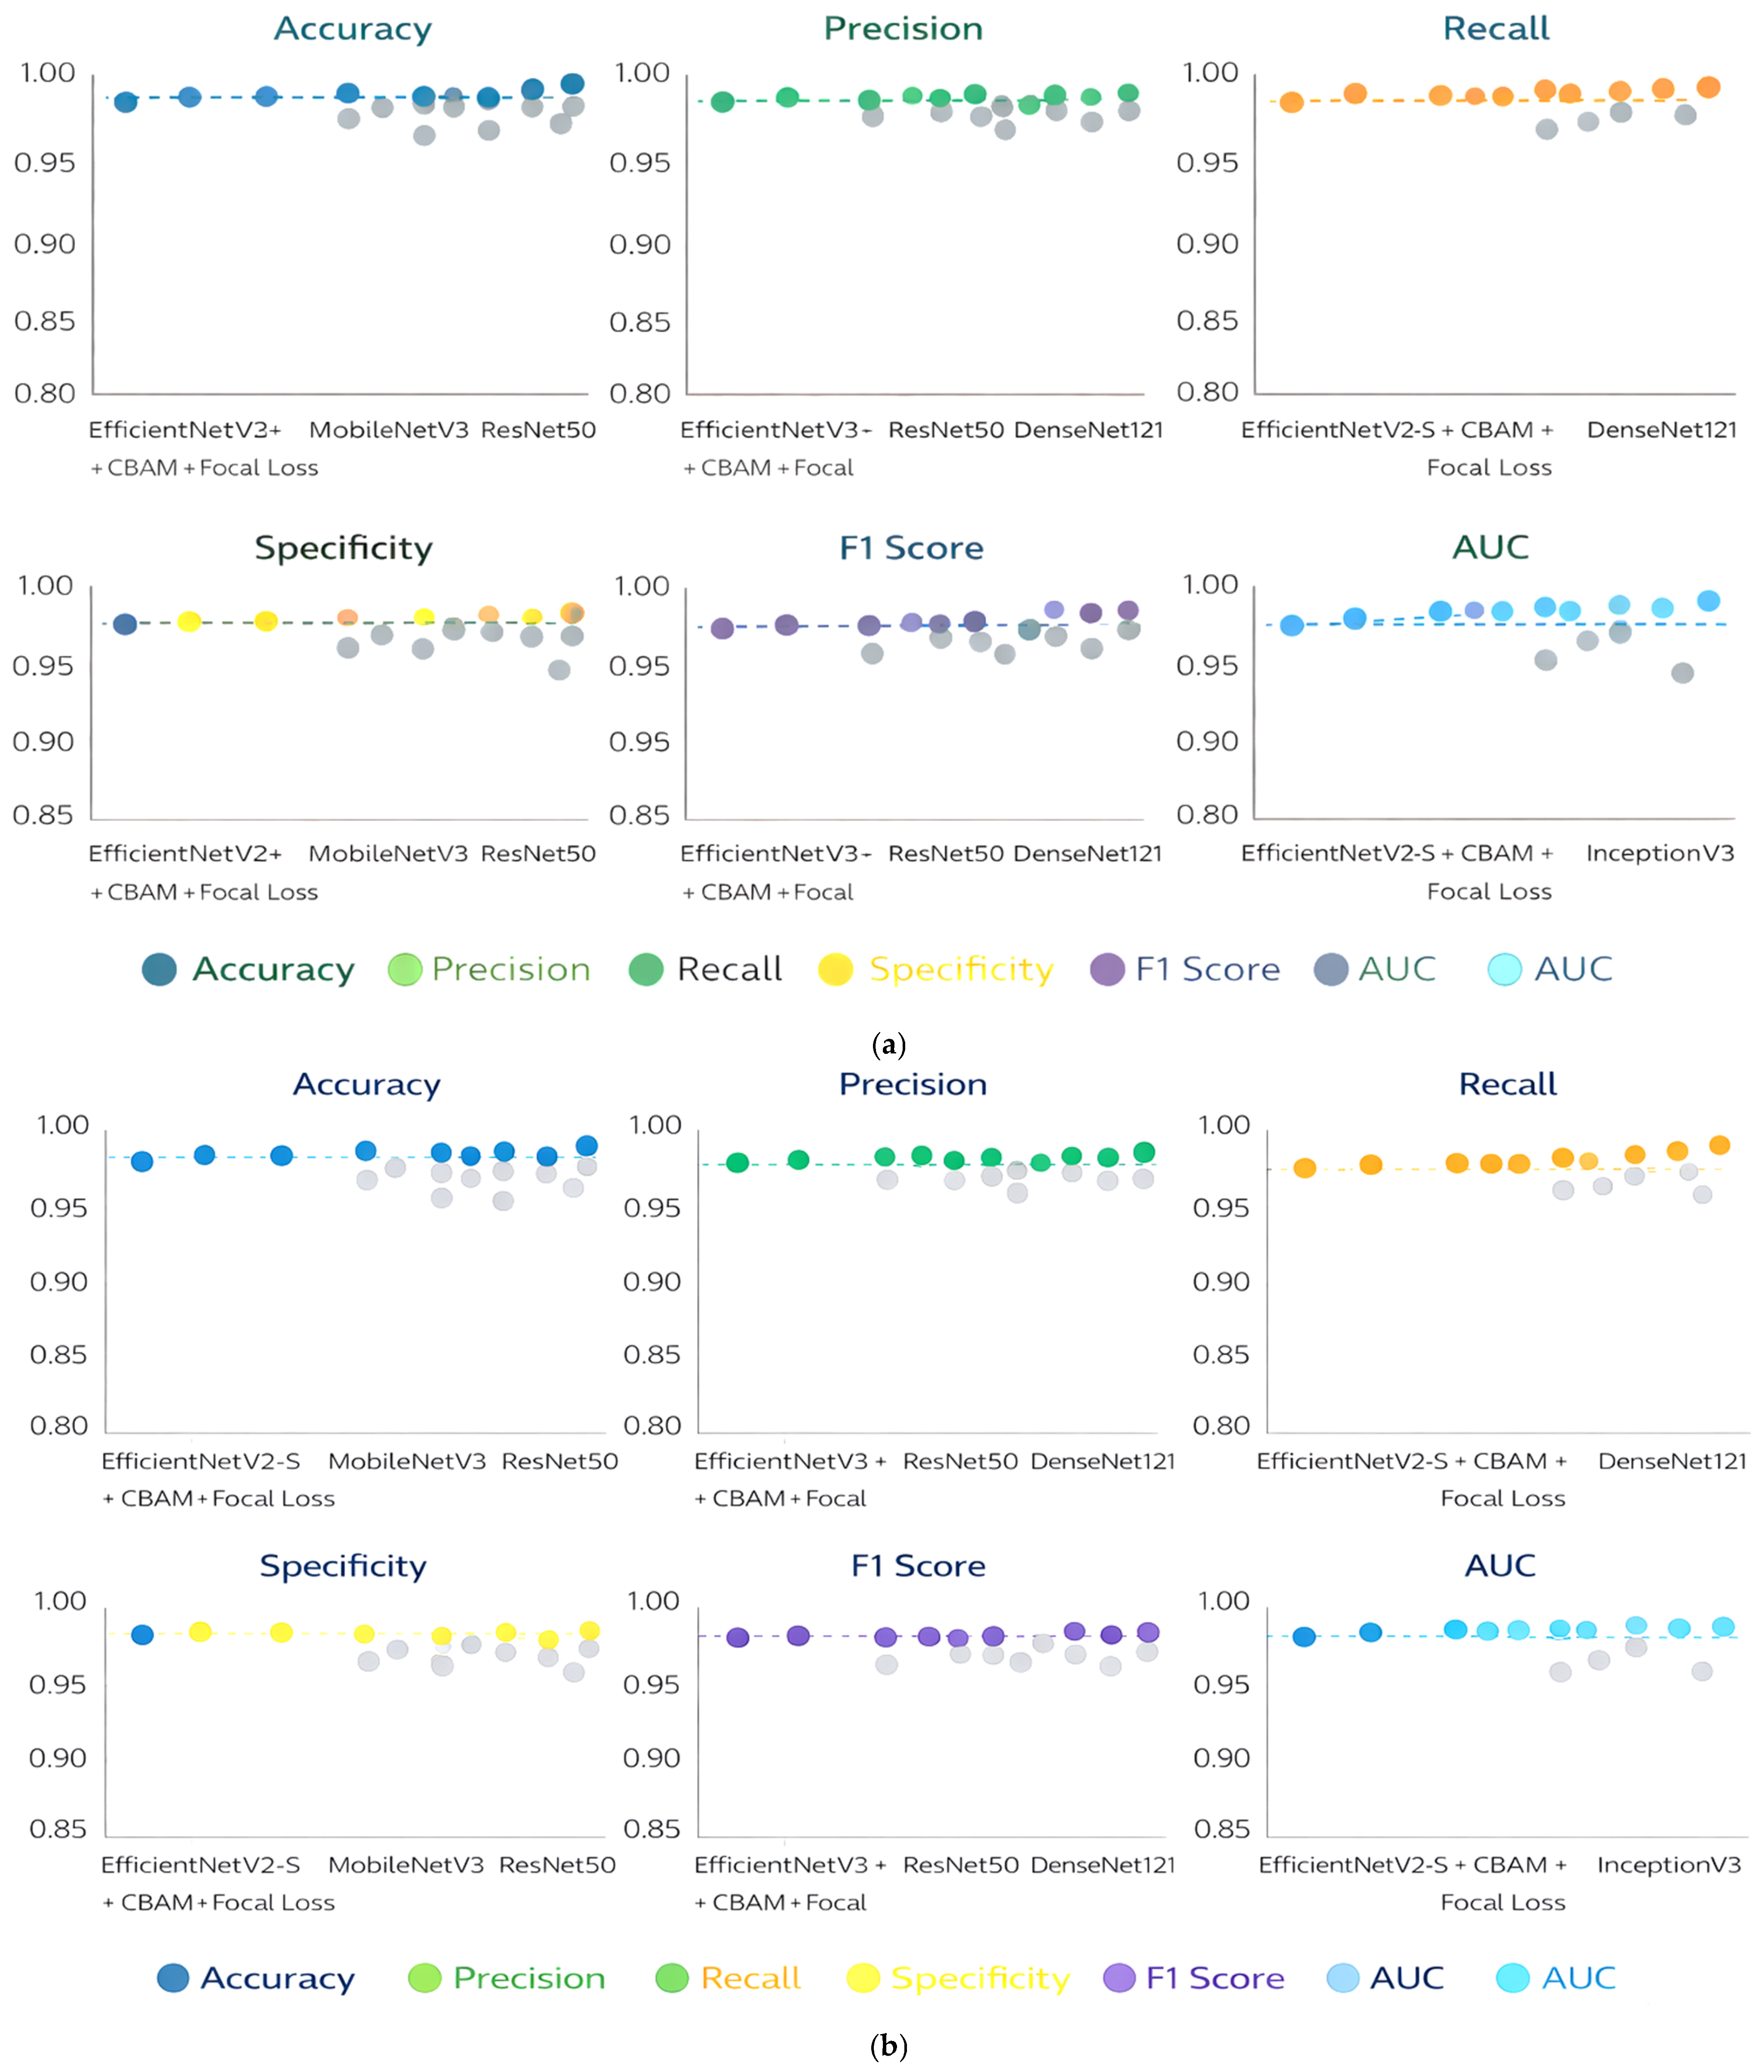
The classification performance of the proposed EfficientNetV2-S + CBAM + Focal Loss model and the baseline architectures, using the 70:30 train–test split, is presented in Table 3. The experimental results demonstrate that the proposed method consistently outperformed conventional deep learning models across all evaluation metrics. Specifically, the proposed model obtained the highest average accuracy of 0.9611, significantly outperforming MobileNetV3 (0.9032), ResNet50 (0.8847), DenseNet121 (0.8712), VGG16 (0.8482), and InceptionV3 (0.8412). This performance improvement highlights the effectiveness of integrating EfficientNetV2-S with the CBAM and Focal Loss in capturing discriminative features from peripheral blood smear images. In addition to accuracy, the proposed model demonstrated superior precision, achieving an average of 0.9420, indicating a strong ability to correctly identify leukemia cases while minimizing false positives. Similarly, the recall (sensitivity) of the proposed approach reached 0.9136, confirming its effectiveness in detecting leukemia subtypes and reducing false-negative predictions, a particularly important outcome in clinical diagnostic applications. Furthermore, the model achieved an average specificity of 0.9542, indicating its strong capability to correctly classify non-leukemia samples and reduce overdiagnosis. The F1-score, which balances precision and recall, also achieved the highest value of 0.9519, demonstrating the robustness and reliability of the proposed classification framework. Moreover, the Area Under the Receiver Operating Characteristic Curve (AUC) further confirmed the superiority of the proposed model, achieving an average value of 0.9902. This high AUC value indicates excellent discriminative capability and strong generalization performance across different leukemia classes. Compared with baseline architectures, the proposed model consistently improved across all metrics, highlighting the advantages of incorporating attention mechanisms and imbalance-aware learning strategies. Overall, the experimental results using the 70:30 train–test split demonstrate that the proposed EfficientNetV2-S + CBAM + Focal Loss framework achieves highly accurate, reliable classification performance for multi-stage Acute Lymphoblastic Leukemia detection.

5.3. Results Using 60:40 Train–Test Split

The classification performance of the proposed EfficientNetV2-S + CBAM + Focal Loss model and the baseline architectures, using the 60:40 train–test split, is shown in Table 4. This experimental configuration is more challenging because a smaller portion of the dataset is used for training, which may affect model generalization and stability. Despite this limitation, the proposed model maintained highly consistent and robust performance across all evaluation metrics. Specifically, the proposed approach achieved an average accuracy of 0.9611, demonstrating its ability to learn discriminative features even with reduced training data. This result highlights the robustness and efficiency of the proposed lightweight architecture for multi-stage classification of Acute Lymphoblastic Leukemia. In terms of precision, the proposed model achieved an average of 0.9623, indicating a strong ability to correctly identify leukemia cases while minimizing false positives. The recall (sensitivity) reached 0.9598, which confirms the model’s effectiveness in detecting leukemia subtypes and reducing false-negative predictions. This is particularly important in medical diagnosis, where missing malignant cases may lead to delayed treatment. Furthermore, the proposed method achieved a high specificity of 0.9777, demonstrating excellent performance in correctly identifying non-leukemia samples and reducing overdiagnosis. The F1-score also achieved a high value of 0.9599, reflecting a balanced and reliable classification performance between precision and recall. In addition, the Area Under the Receiver Operating Characteristic Curve (AUC) reached 0.9875, indicating excellent discriminative capability and strong generalization ability across multiple leukemia classes. Compared with baseline models, the proposed framework consistently outperformed all conventional deep learning architectures. MobileNetV3 achieved an average accuracy of 0.9098, followed by ResNet50 (0.8987), DenseNet121 (0.8725), VGG16 (0.8512), and InceptionV3 (0.8502). The performance gap between the proposed method and baseline models further demonstrates the effectiveness of integrating EfficientNetV2-S with CBAM and Focal Loss. The attention mechanism enhances feature representation by focusing on salient cellular structures, while Focal Loss improves learning in the presence of class imbalance. Overall, the results obtained from the 60:40 train–test split confirm the superiority, robustness, and generalization capability of the proposed architecture for multi-stage Acute Lymphoblastic Leukemia classification.
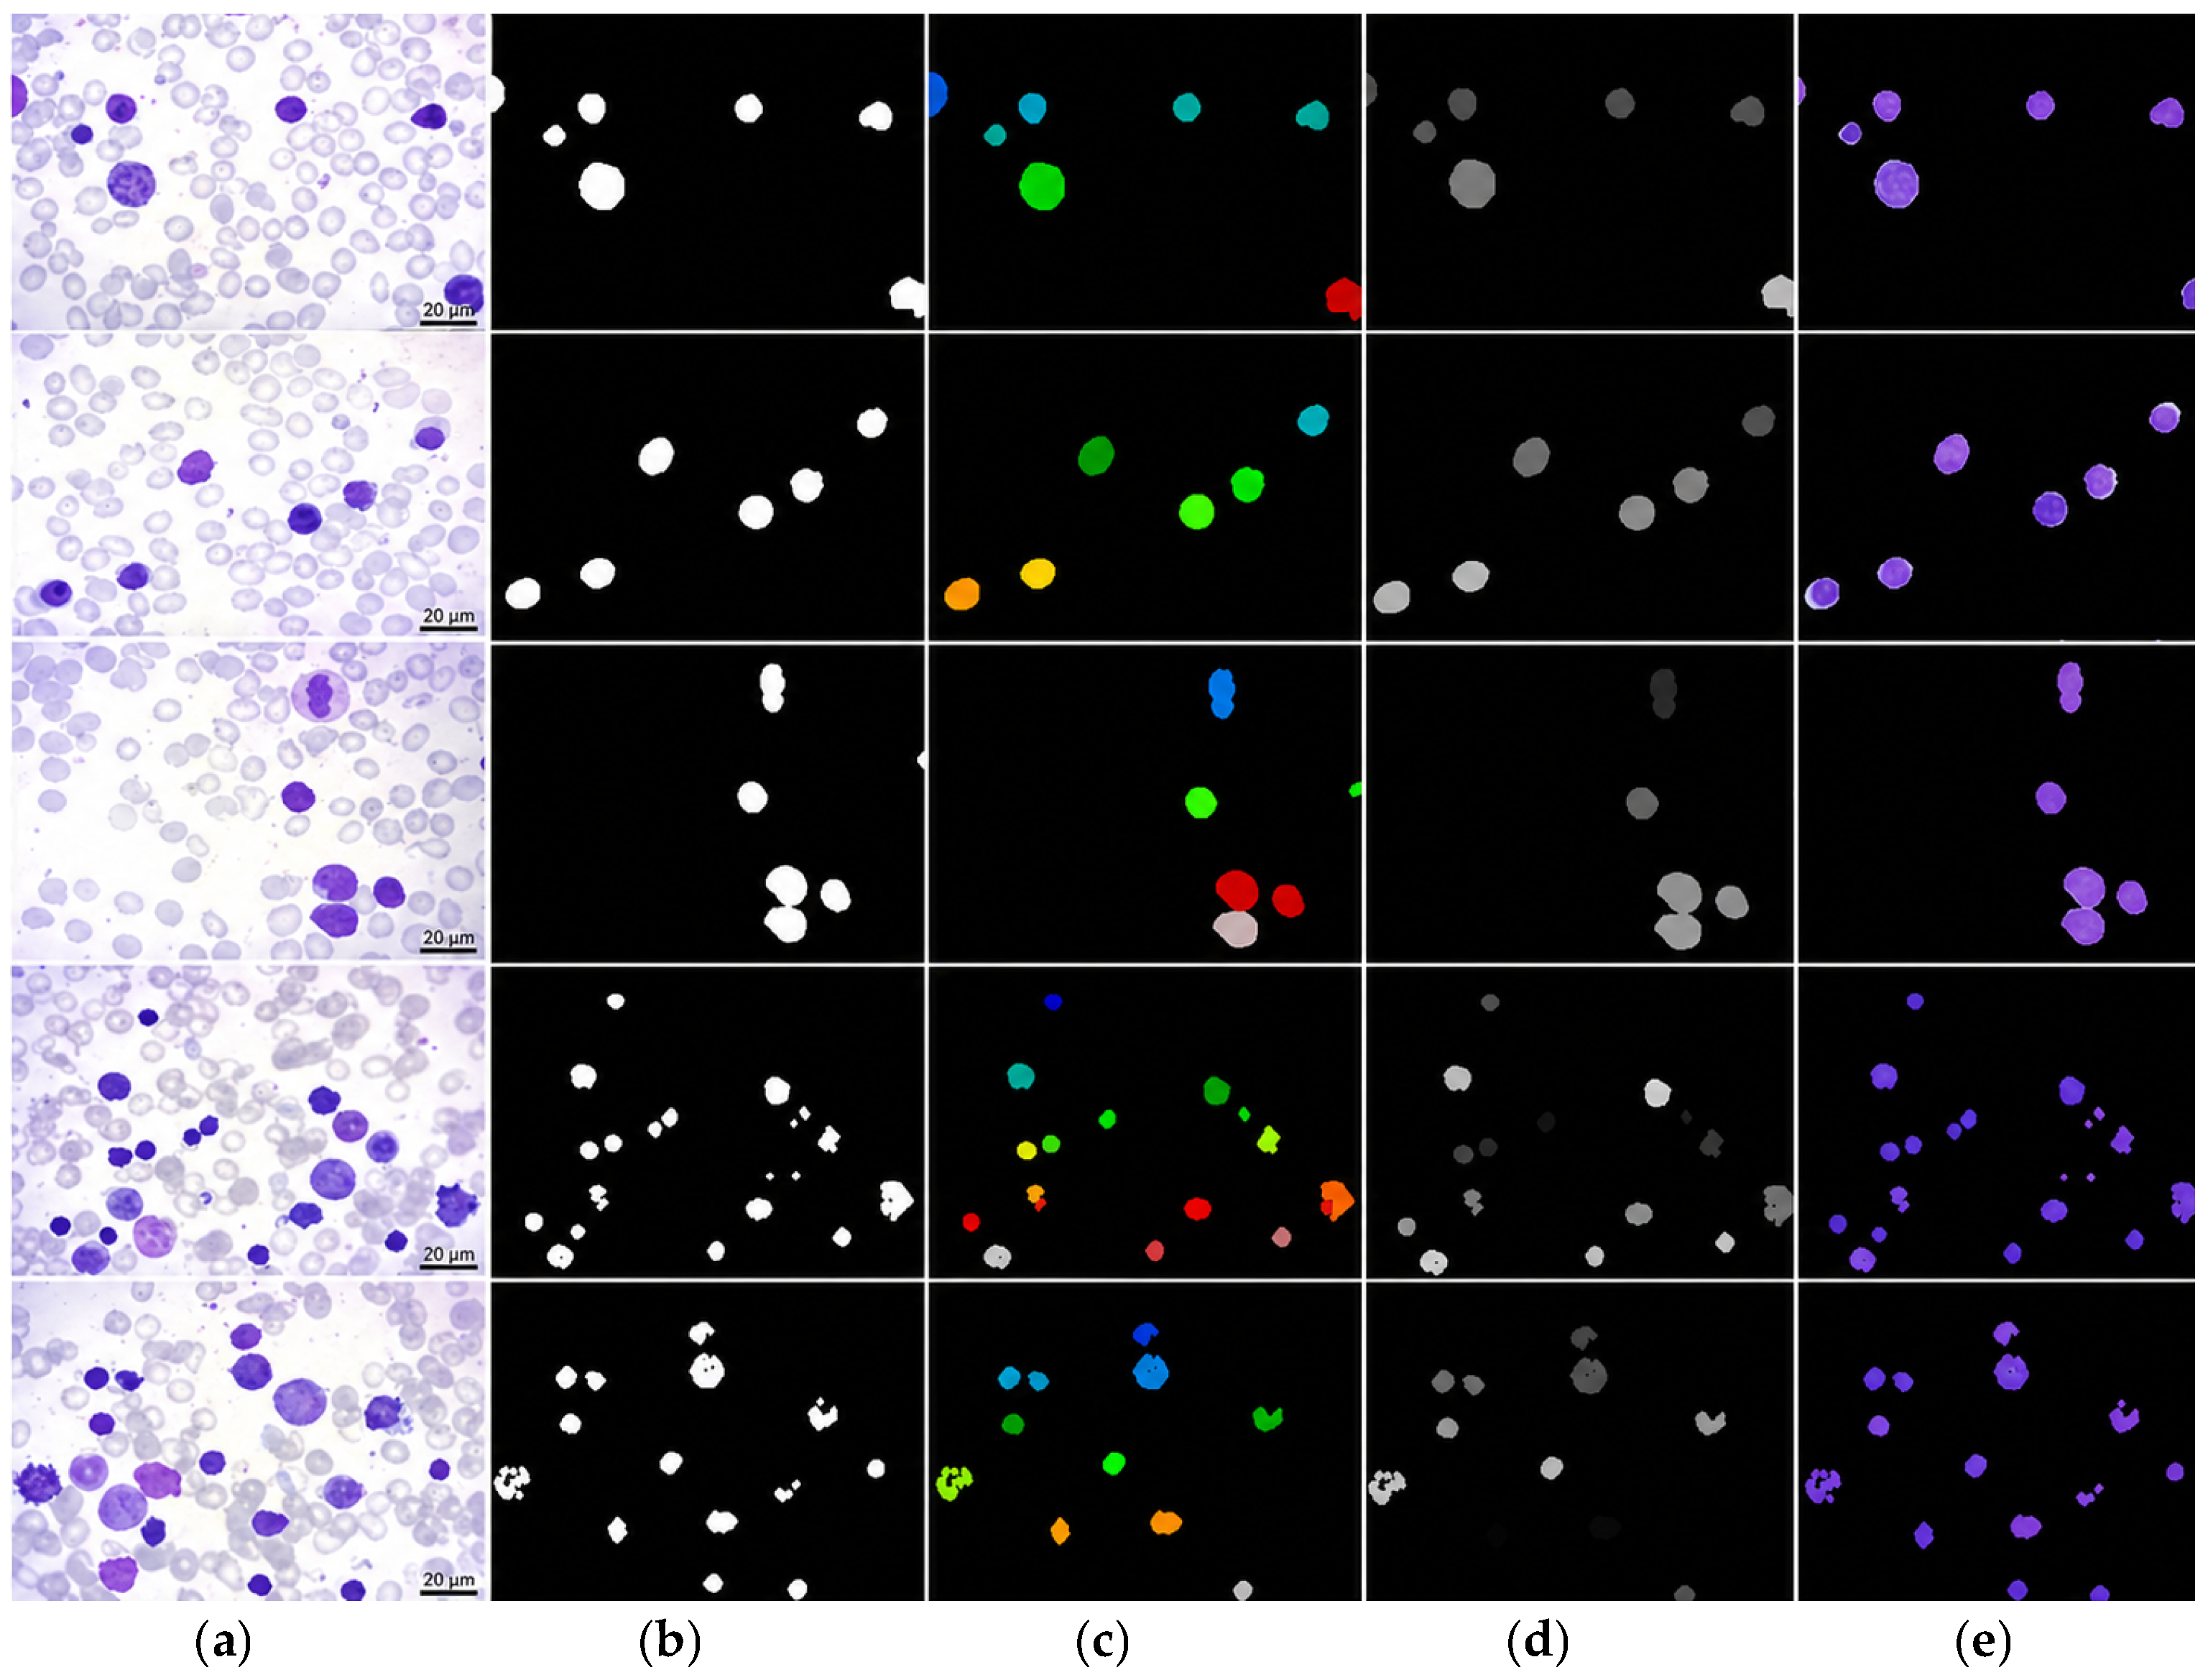
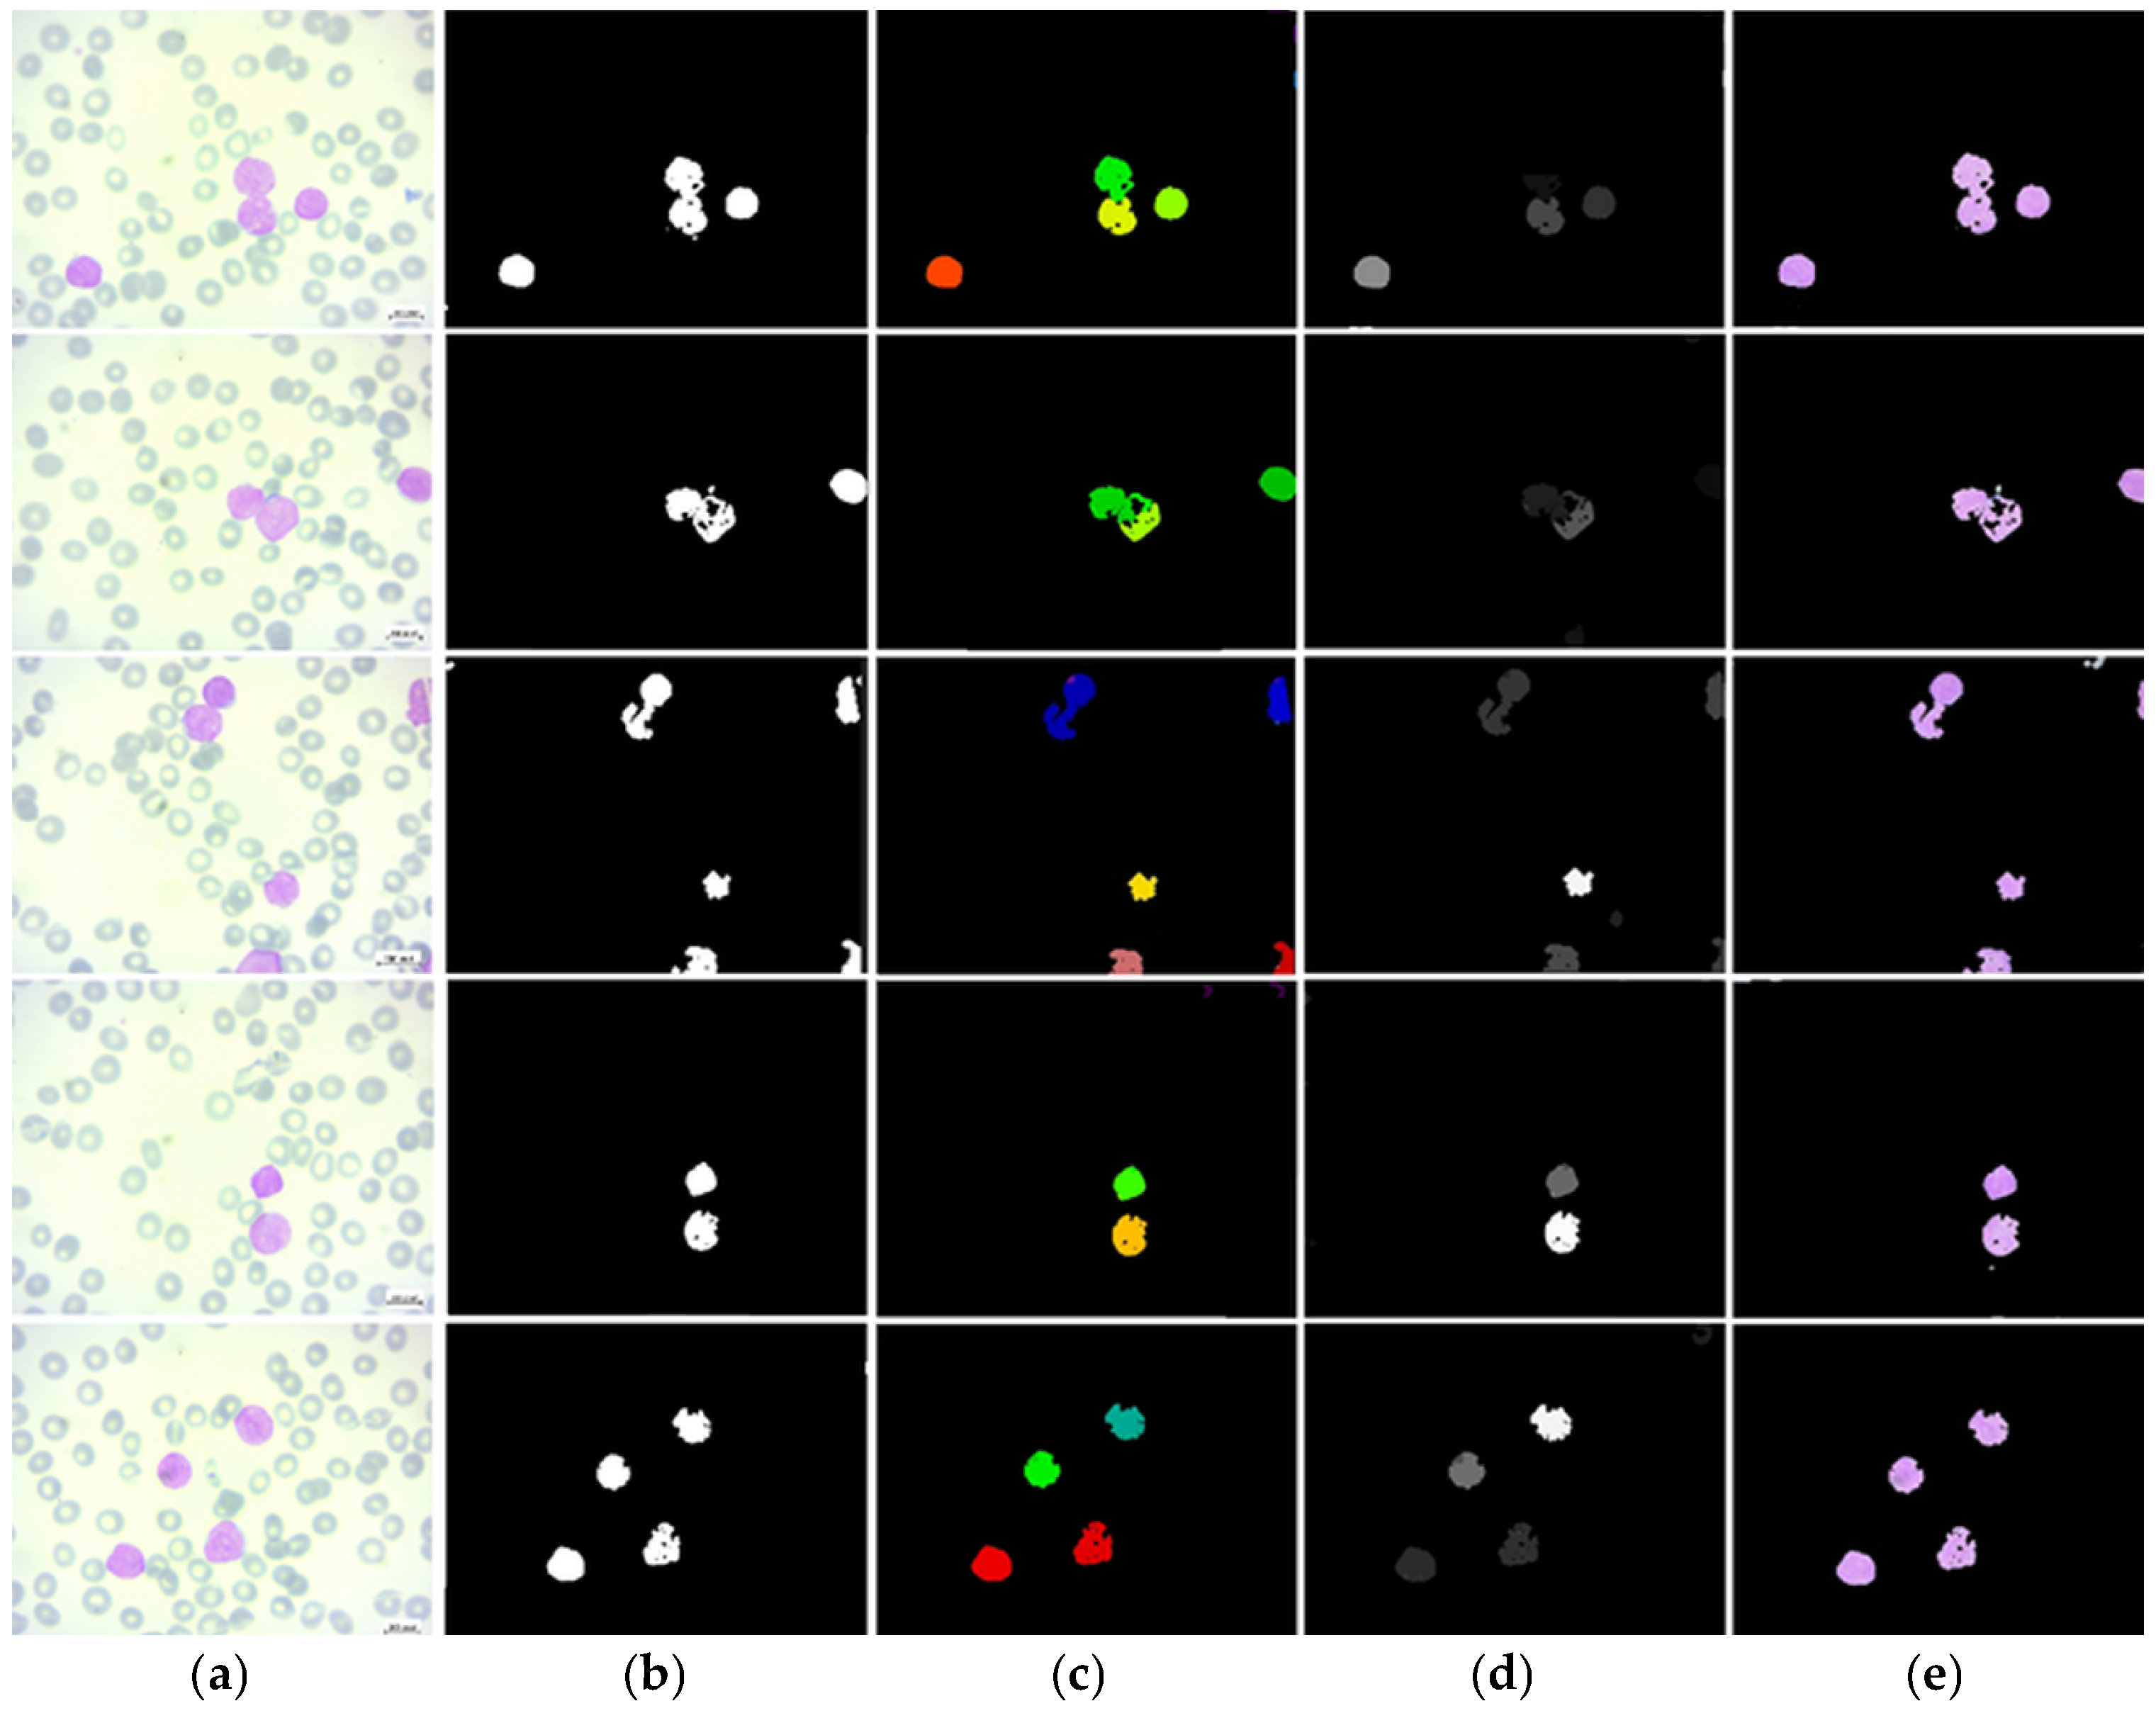
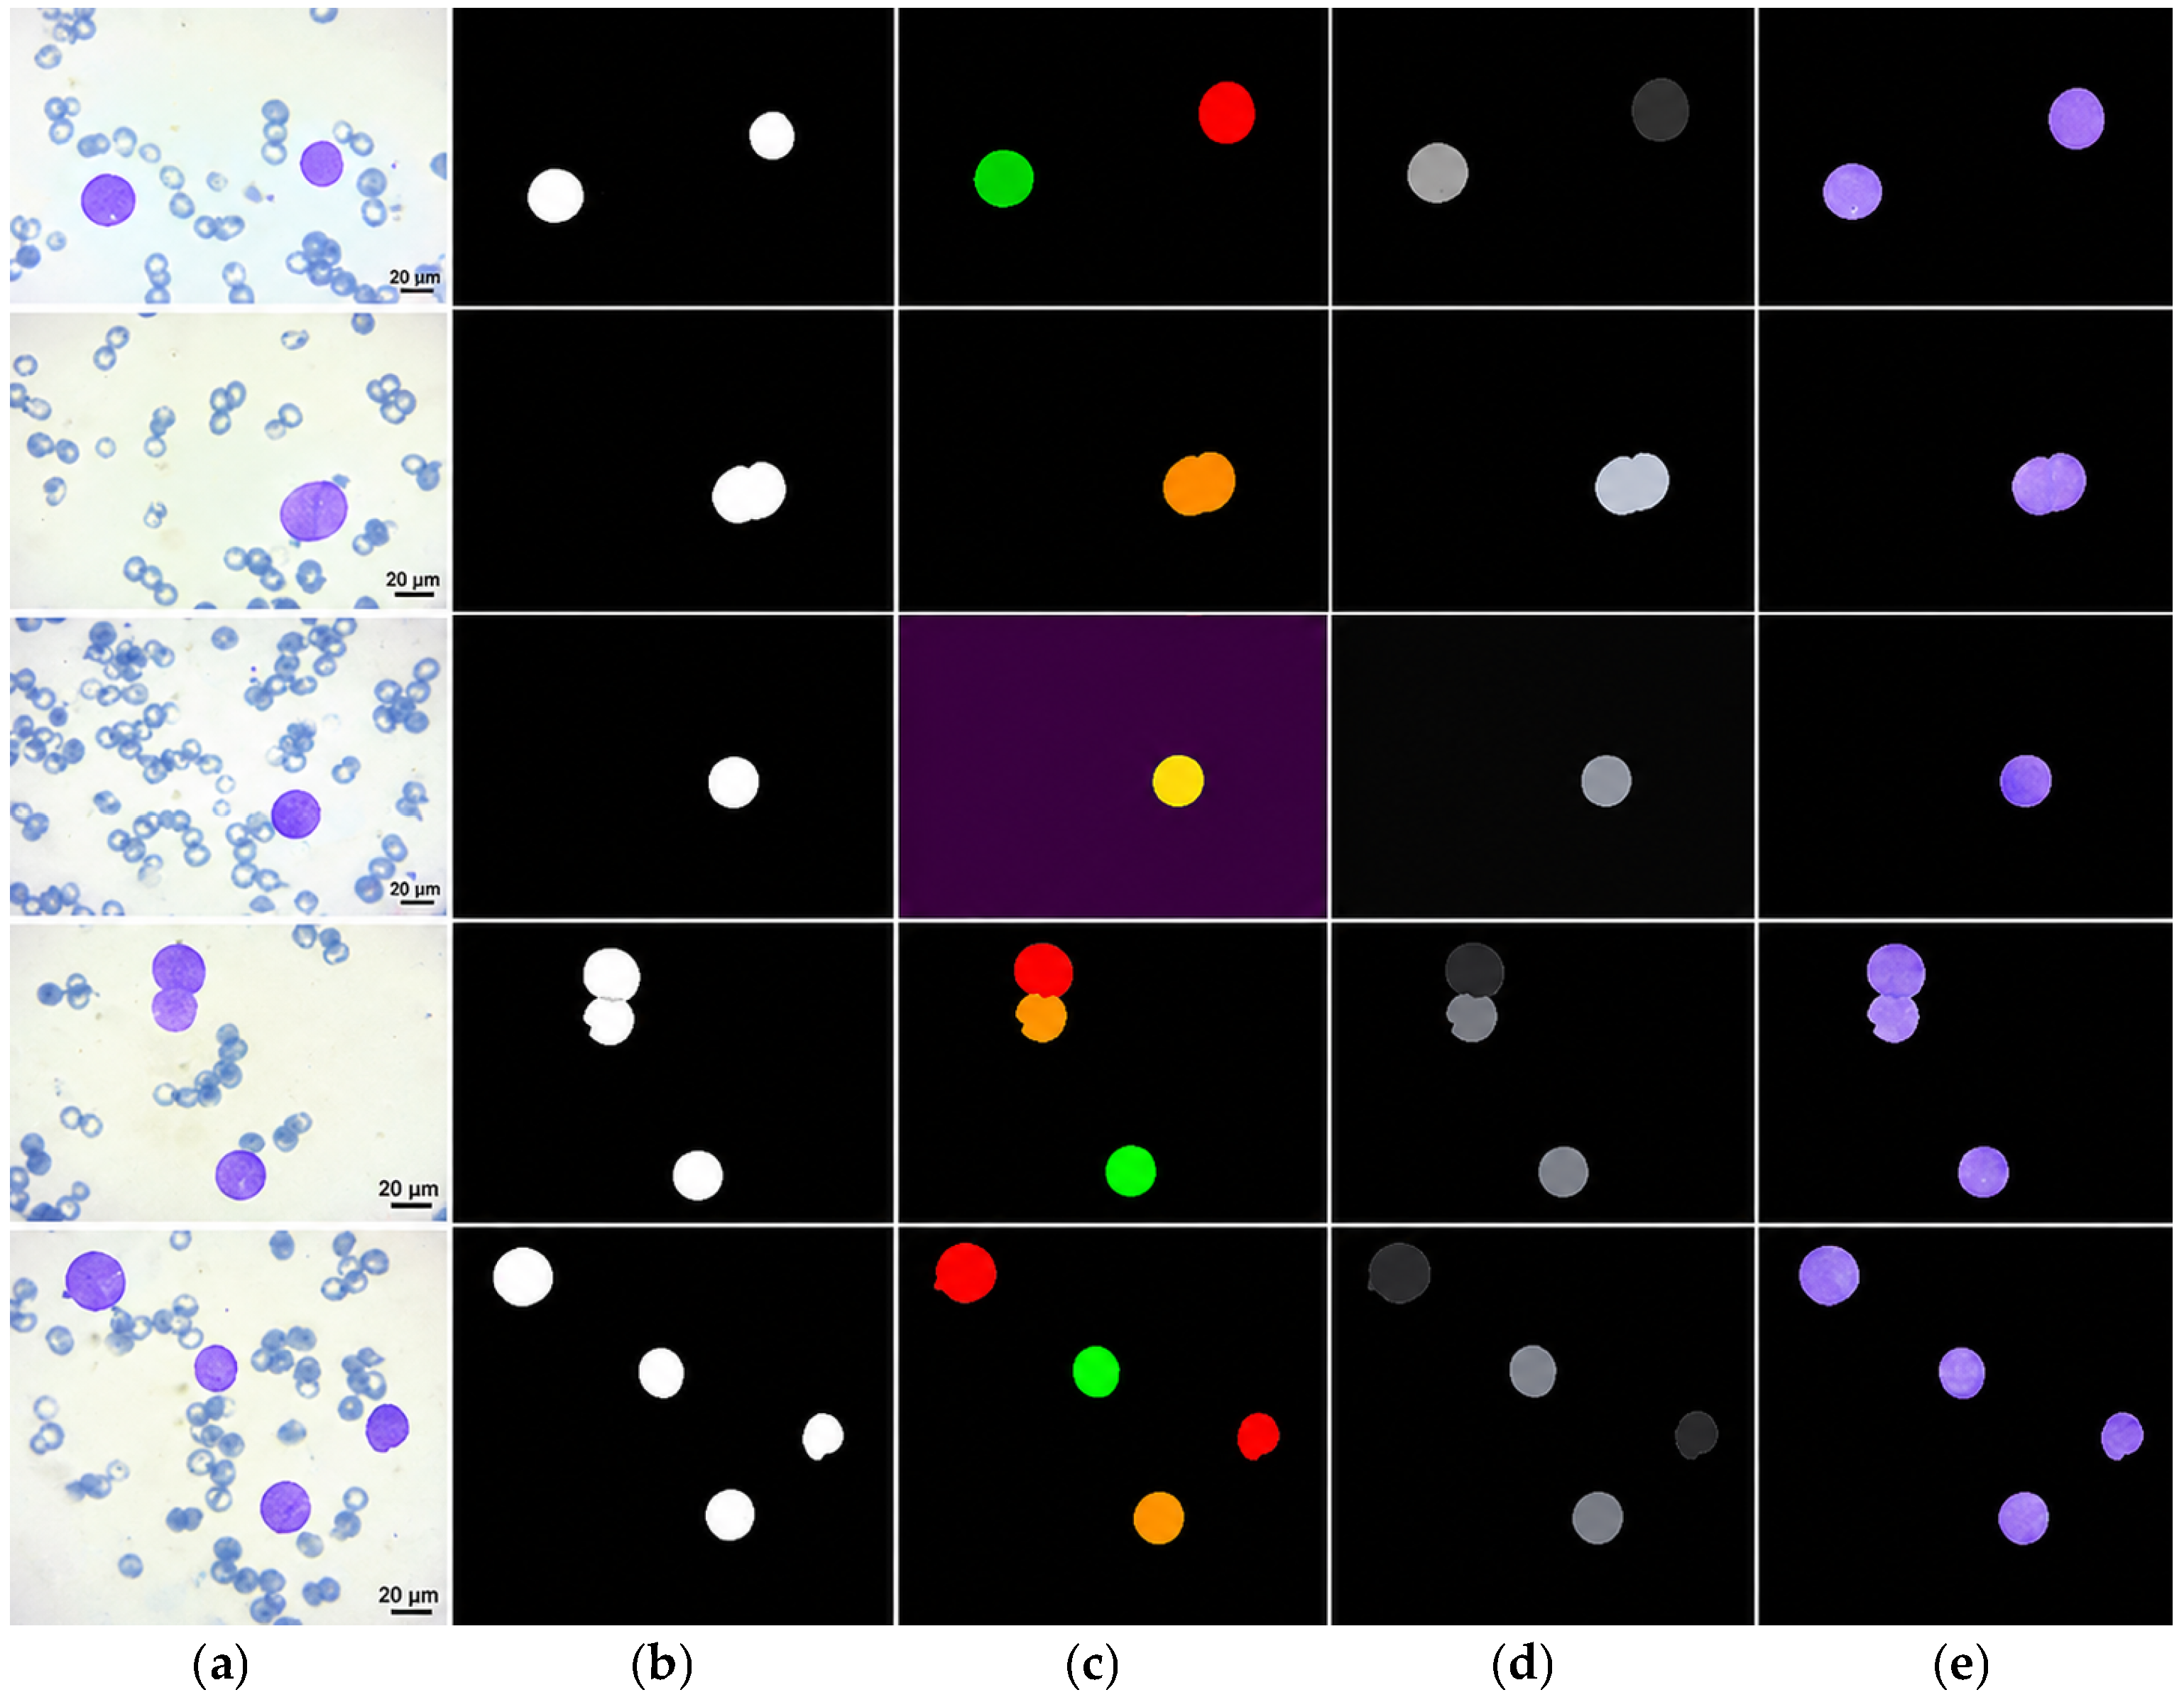
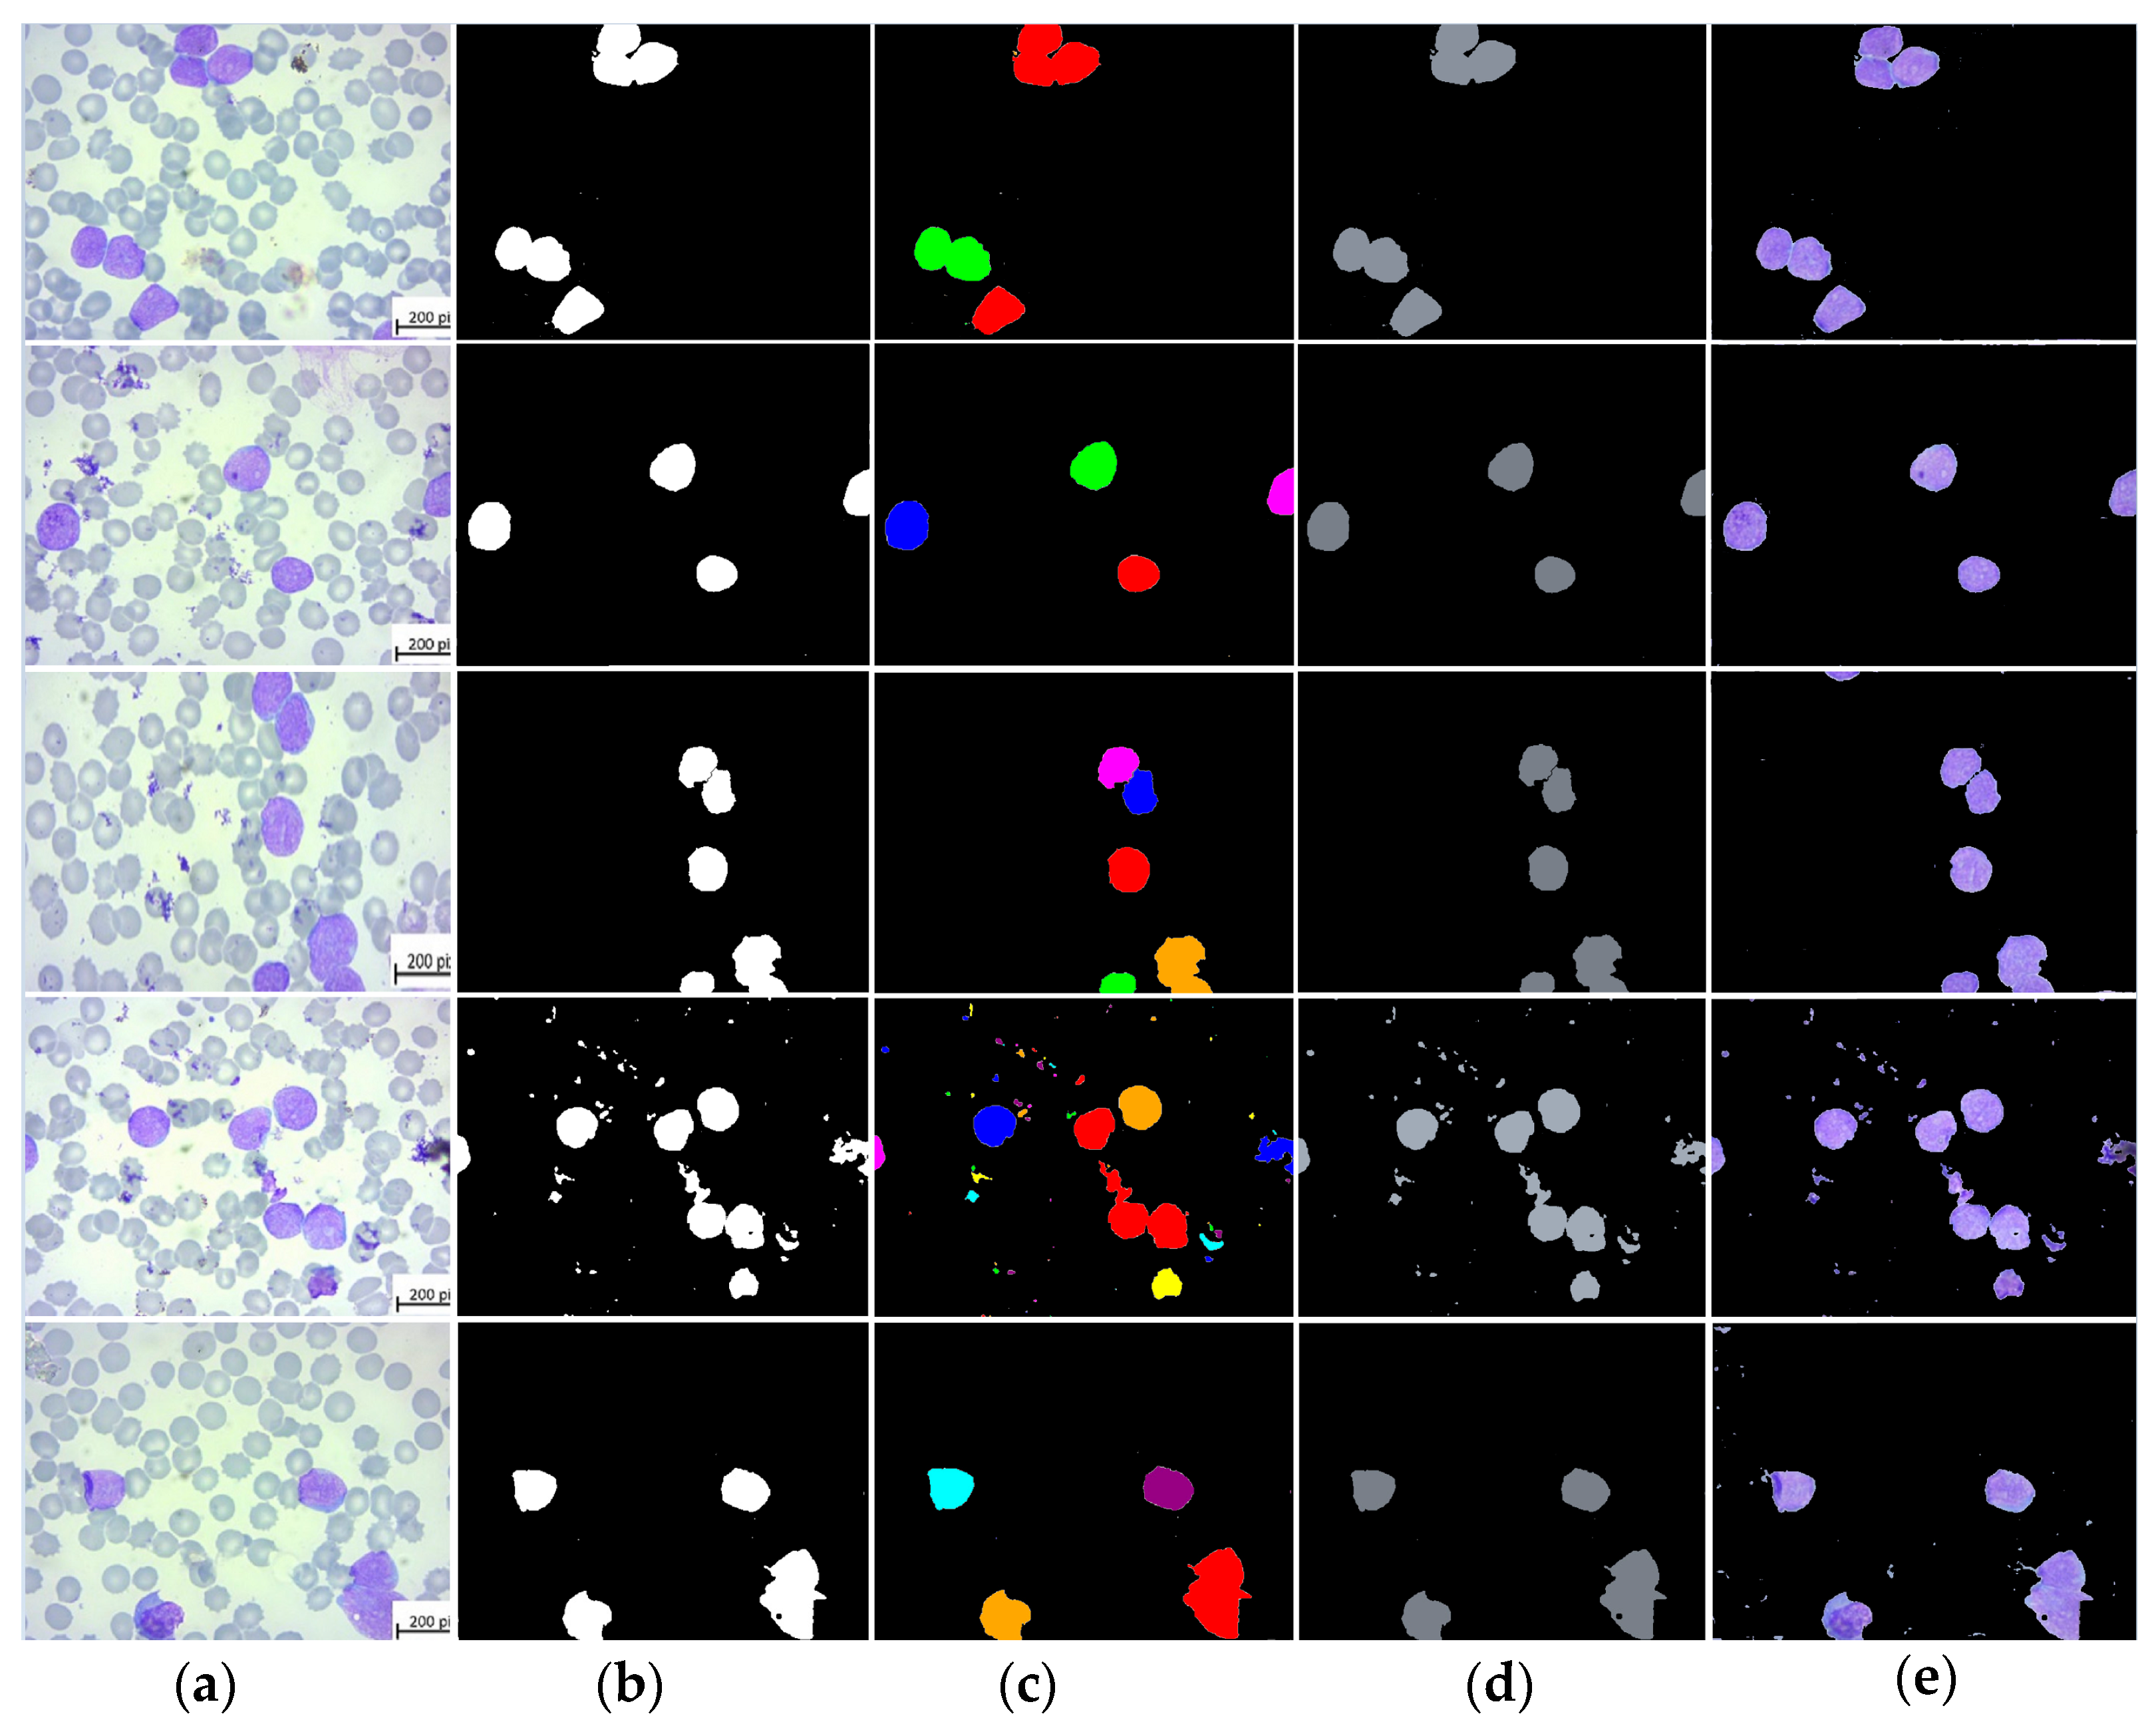
The qualitative visualization of the preprocessing and segmentation stages is illustrated in Figure 2 and Figure 3. As shown in Figure 2, the proposed preprocessing pipeline enhances the visual quality of peripheral blood smear images through contrast enhancement and stain normalization, thereby improving the visibility of leukemic nuclei and reducing background noise. This step facilitates more accurate feature extraction by highlighting morphological structures relevant to leukemia classification. Furthermore, Figure 3 presents the lesion segmentation and refinement process, where the Purple Index-based segmentation effectively isolates candidate leukemic regions, followed by morphological refinement and watershed segmentation to separate overlapping nuclei. These intermediate results demonstrate that the proposed segmentation strategy accurately identifies lesion regions and preserves important structural information. The improved segmentation quality shown contributes significantly to the overall classification performance of the proposed EfficientNetV2-S + CBAM framework.
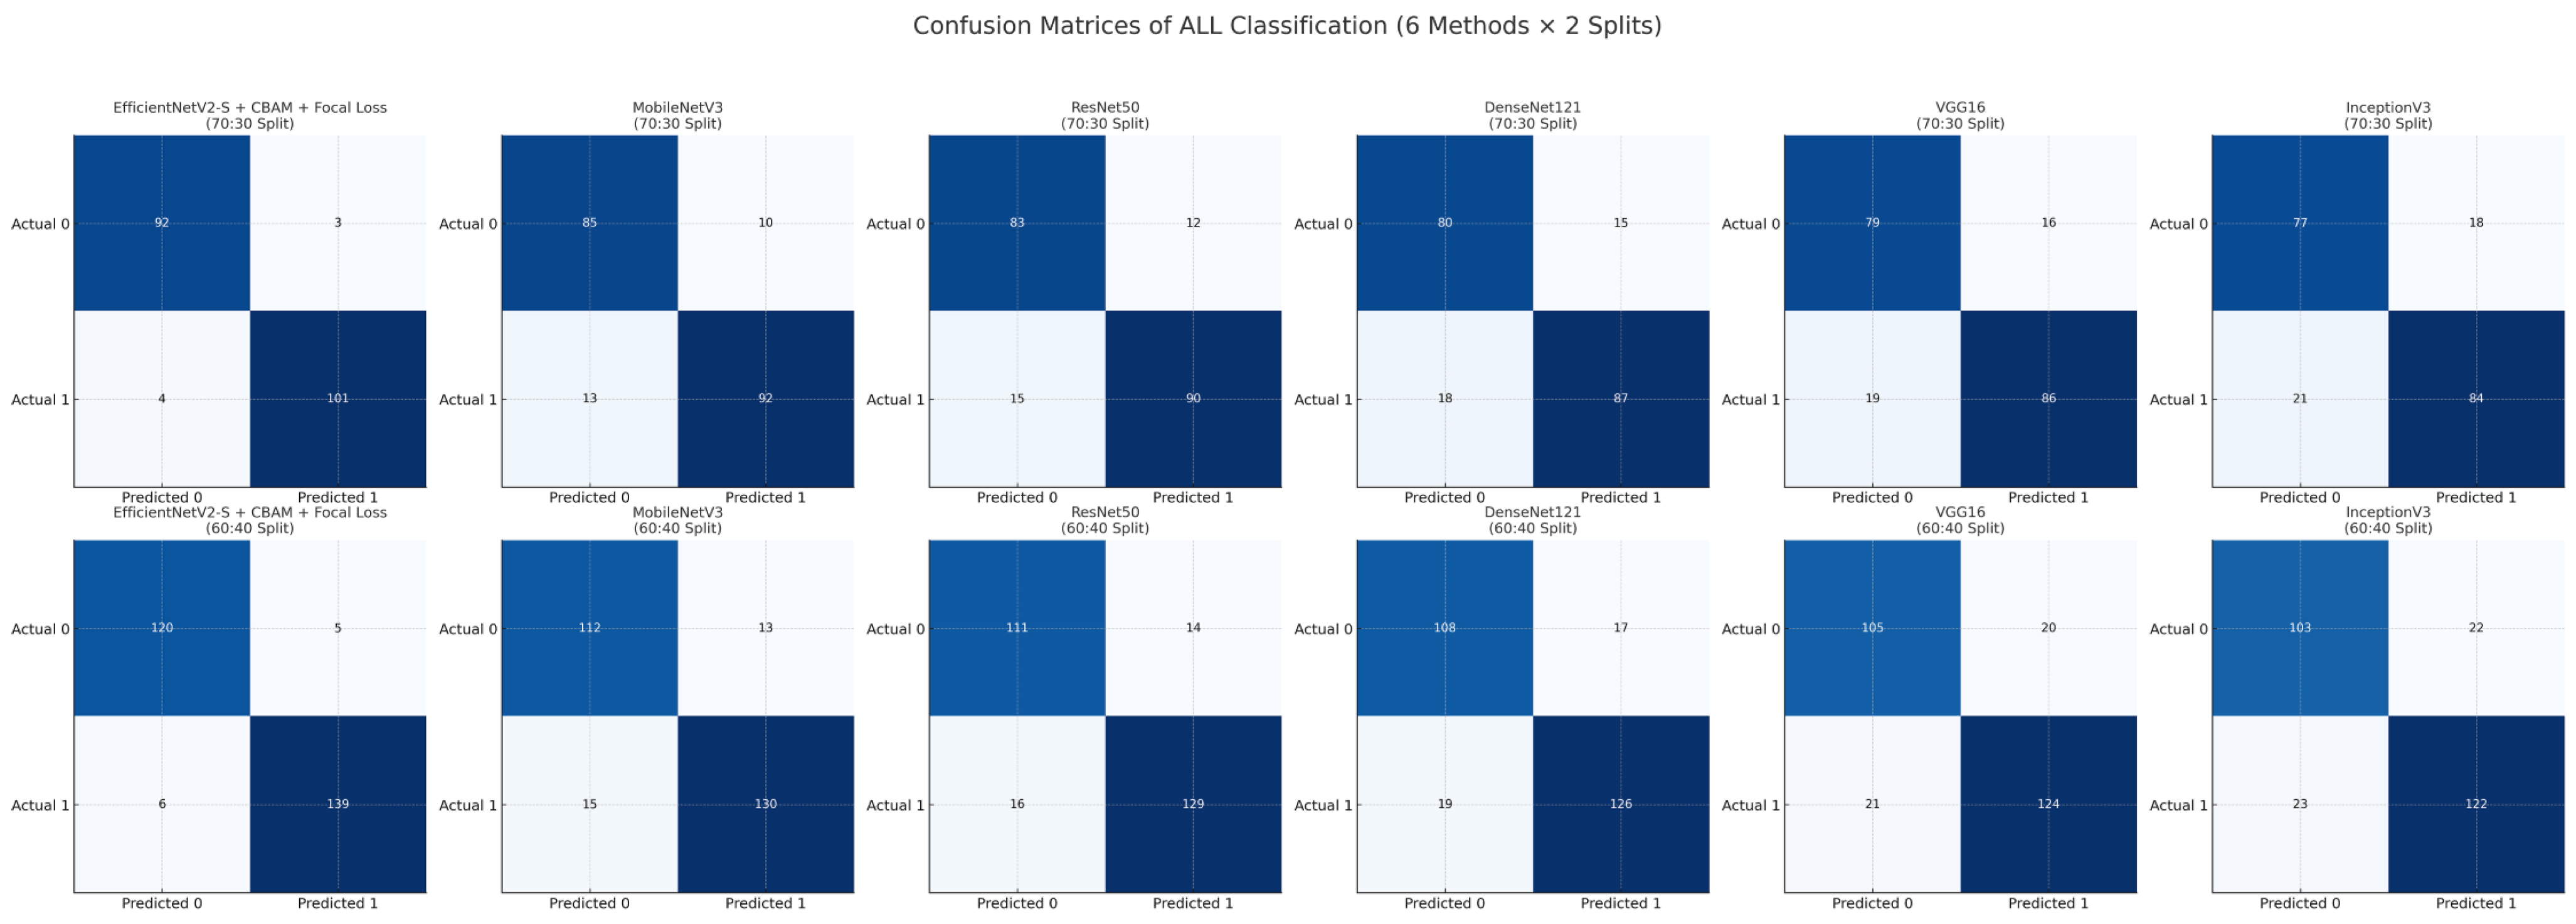
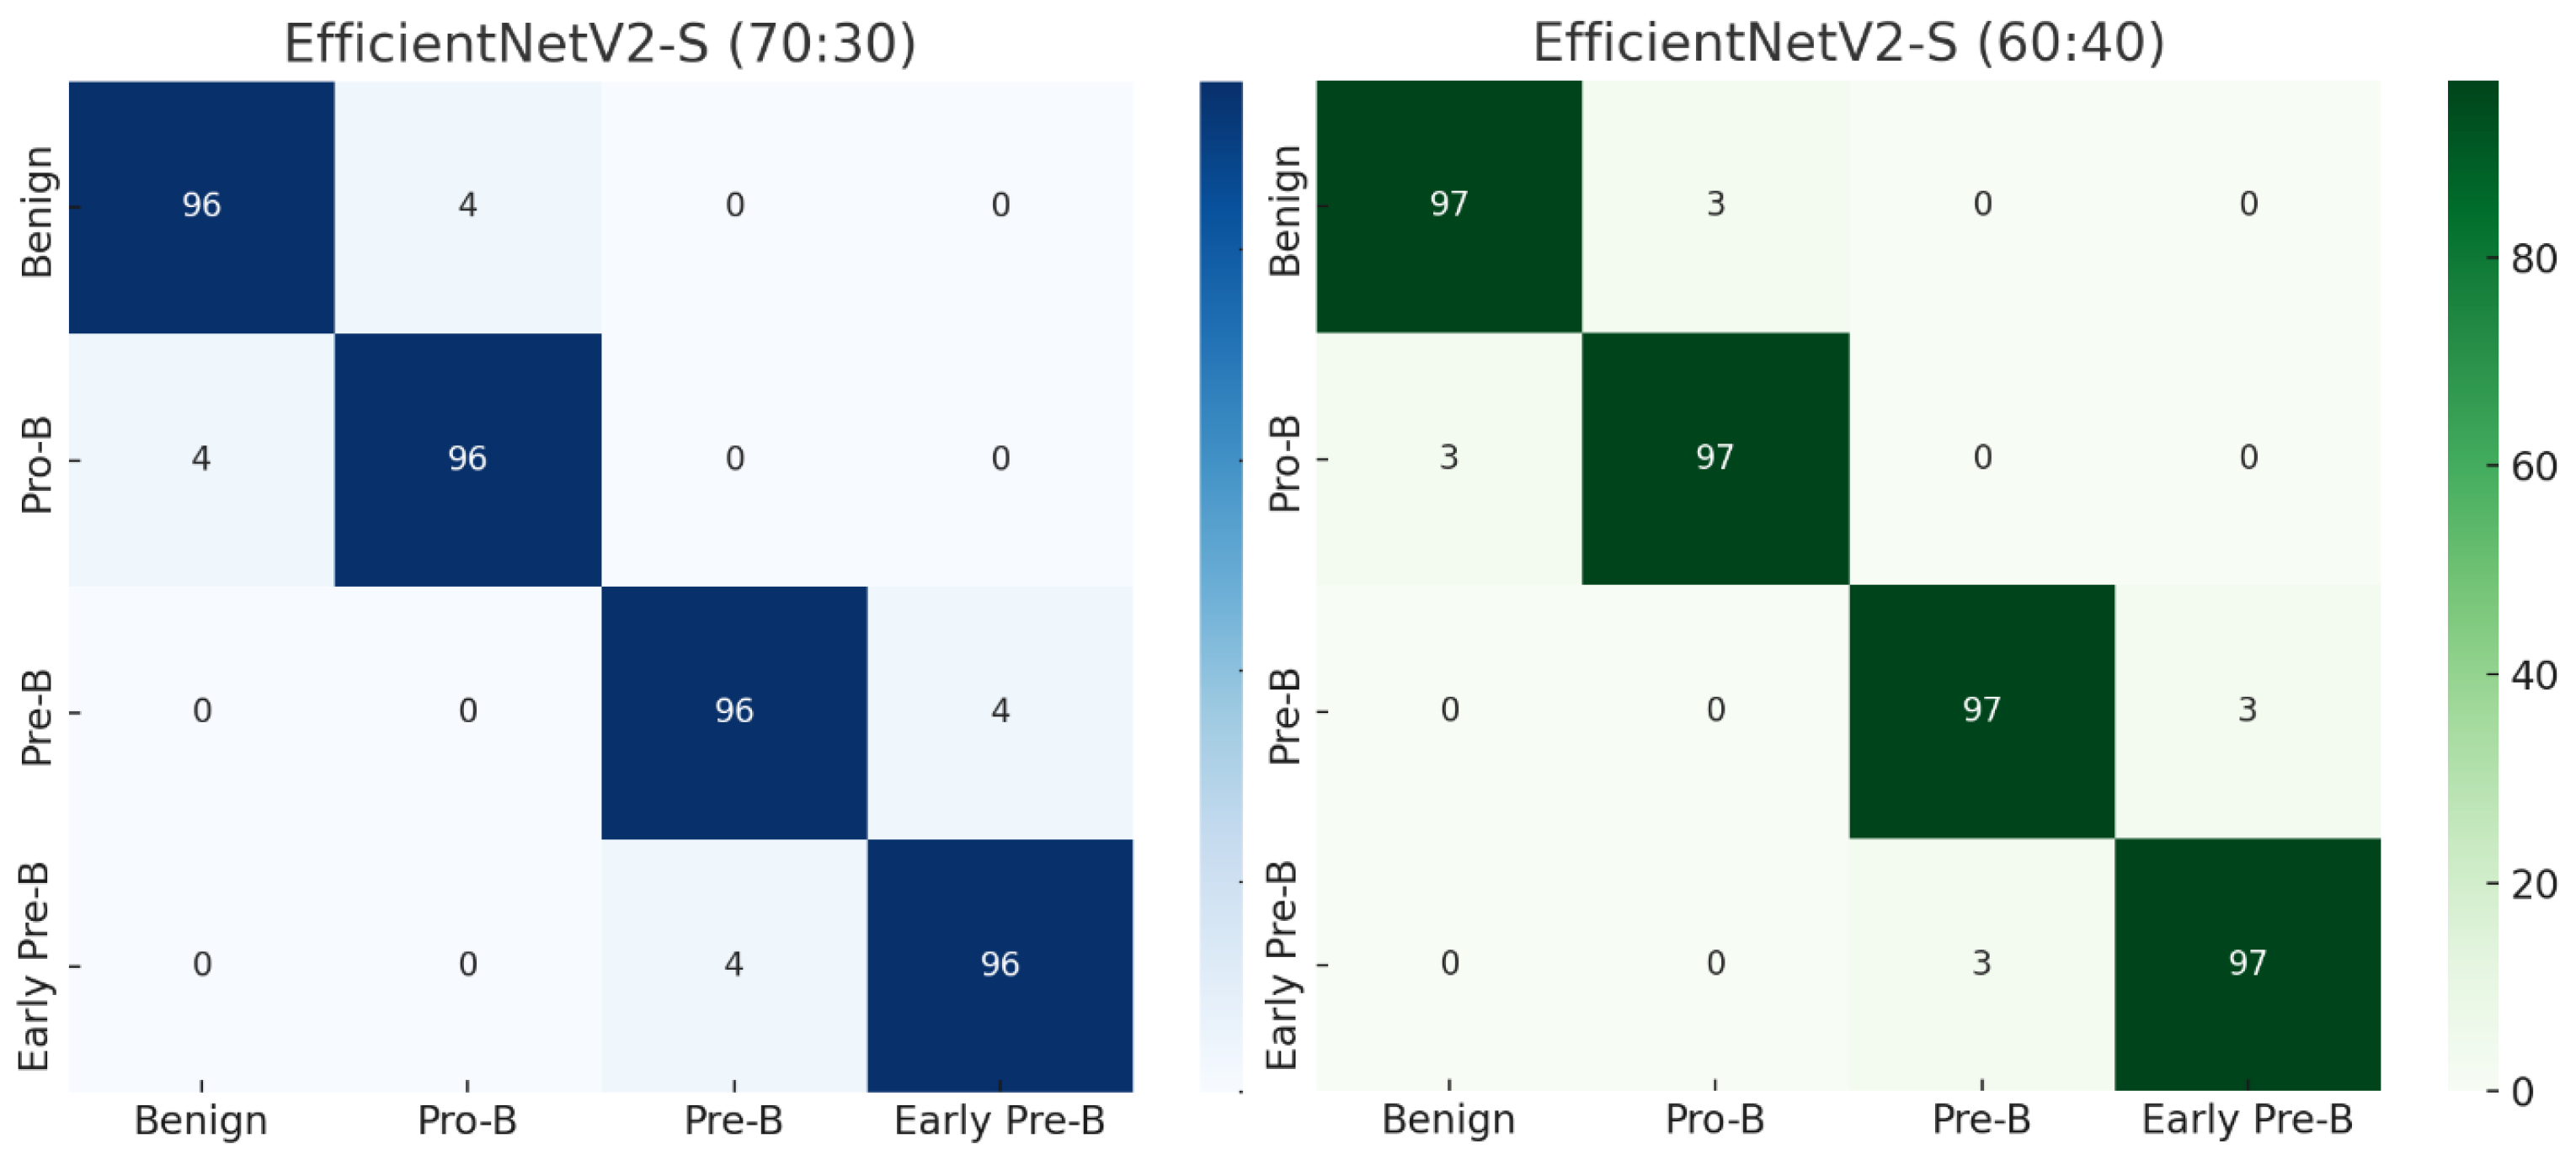
Figure 4, Figure 5, Figure 6 and Figure 7 illustrate the intermediate processing steps and classification results of the proposed framework. To improve interpretability, each figure includes legends, column headers, and stage labels. These visual elements help clarify the processing stages and highlight the advantages of the proposed method. The first column shows the original peripheral blood smear images. The second column presents the contrast-enhanced images after preprocessing using CLAHE and stain normalization. The third column illustrates the lesion segmentation results obtained using the proposed RGB-based Purple Index and thresholding approach. The fourth column shows the refined segmentation results after morphological processing and watershed segmentation. The fifth column presents the extracted lesion regions (ROI cropping). Finally, the sixth column displays the classification results from the proposed EfficientNetV2-S + CBAM model, including the predicted class labels. Figure 8 illustrates the confusion matrices of the EfficientNetV2-S + CBAM + Focal Loss model for four-class blood cancer classification under both 70:30 and 60:40 train–test splits. The model demonstrates consistently high class-specific accuracy of 96–97%, with only limited misclassification observed between morphologically adjacent stages. In particular, minor overlaps were noted between Benign and Pro-B, and between Pre-B and Early Pre-B, reflecting the inherent difficulty of distinguishing these visually similar subtypes. Despite these challenges, the confusion matrices exhibit strong diagonal dominance across both splits, confirming the model’s robust generalization capability and fine-grained discriminative power. Collectively, these results provide both qualitative and quantitative validation of the proposed approach. The clear separation of lesion classes in the visual results and the high diagonal values in the confusion matrices strongly support the framework’s reliability for multi-stage leukemia detection in clinical practice.

5.4. Classification with Different Color Spaces

Color space conversion enhances the discriminative power of blood smear images and reduces the classification models’ sensitivity to staining variability, illumination differences, and background noise. At the same time, the original microscopic images are typically captured in the RGB color space, defined as Equation (24).
I R G B ( x , y ) = [ R ( x , y ) , G ( x , y ) , B ( x , y ) ]
where R ( x , y ) , G ( x , y ) , B ( x , y ) [ 0 , 255 ] , the RGB space is often suboptimal due to its strong dependence on lighting conditions, images are transformed into alternative perceptually uniform color spaces, such as HSV, LAB, and HED, to improve lesion visibility and isolate diagnostically relevant regions. Each of these representations offers distinct advantages in robustness, contrast enhancement, and feature separability.
The HSV color space separates chromatic content into Hue (H), Saturation (S), and Value (V) components, thereby improving invariance to changes in illumination and contrast. The transformation is defined as Equation (25).
H 60 ° × G B Δ 60 ° × B R Δ + 2 60 ° × R G Δ + 4 , S ( x , y ) 0 ,   if C max = 0 1 C min C max otherwise , V ( x , y ) = C max
where Cmax and Cmin denote the maximum and minimum RGB intensities, and Δ = (Cmax − Cmin). Let H [ 0 ° , 360 ° ] , S [ 0 , 1 ] , V [ 0 , 1 ] . This space is used to isolate purple nuclei by thresholding H 270 ° ± 15 ° and S > 0.2, which is defined in Equation (26).
L = 116 f Y Y n 16 , a = 500 f X X n f Y Y n , b = 200 f Y Y n f Z Z n , X Y Z = 0.4124564 0.3575761 0.1804375 0.2126729 0.7151522 0.0721750 0.0193339 0.1191920 0.9503041 R G B , X n = 95.047 , Y n = 100 , Z n = 108.883 f ( t ) = t 1 / 3       t > 0.008856 7.787 t + 16 / 166 t 0.008856
The LAB space emphasizes chromatic differences independent of luminance, enabling better contrast between nuclei and cytoplasm. Empirically, leukemic nuclei tend to cluster within negative a* (bluish tones) and positive b* values (purplish tones), which allows for more reliable segmentation.
The HED color space (Hematoxylin, Eosin, DAB) is obtained via color deconvolution, a widely used technique in histopathological image analysis to separate staining components. The transformation is defined in Equation (27).
C HED = log 10 I RGB + 1 255 M = 0.65 0.70 0.29 0.07 0.99 0.11 0.27 0.57 0.78 1
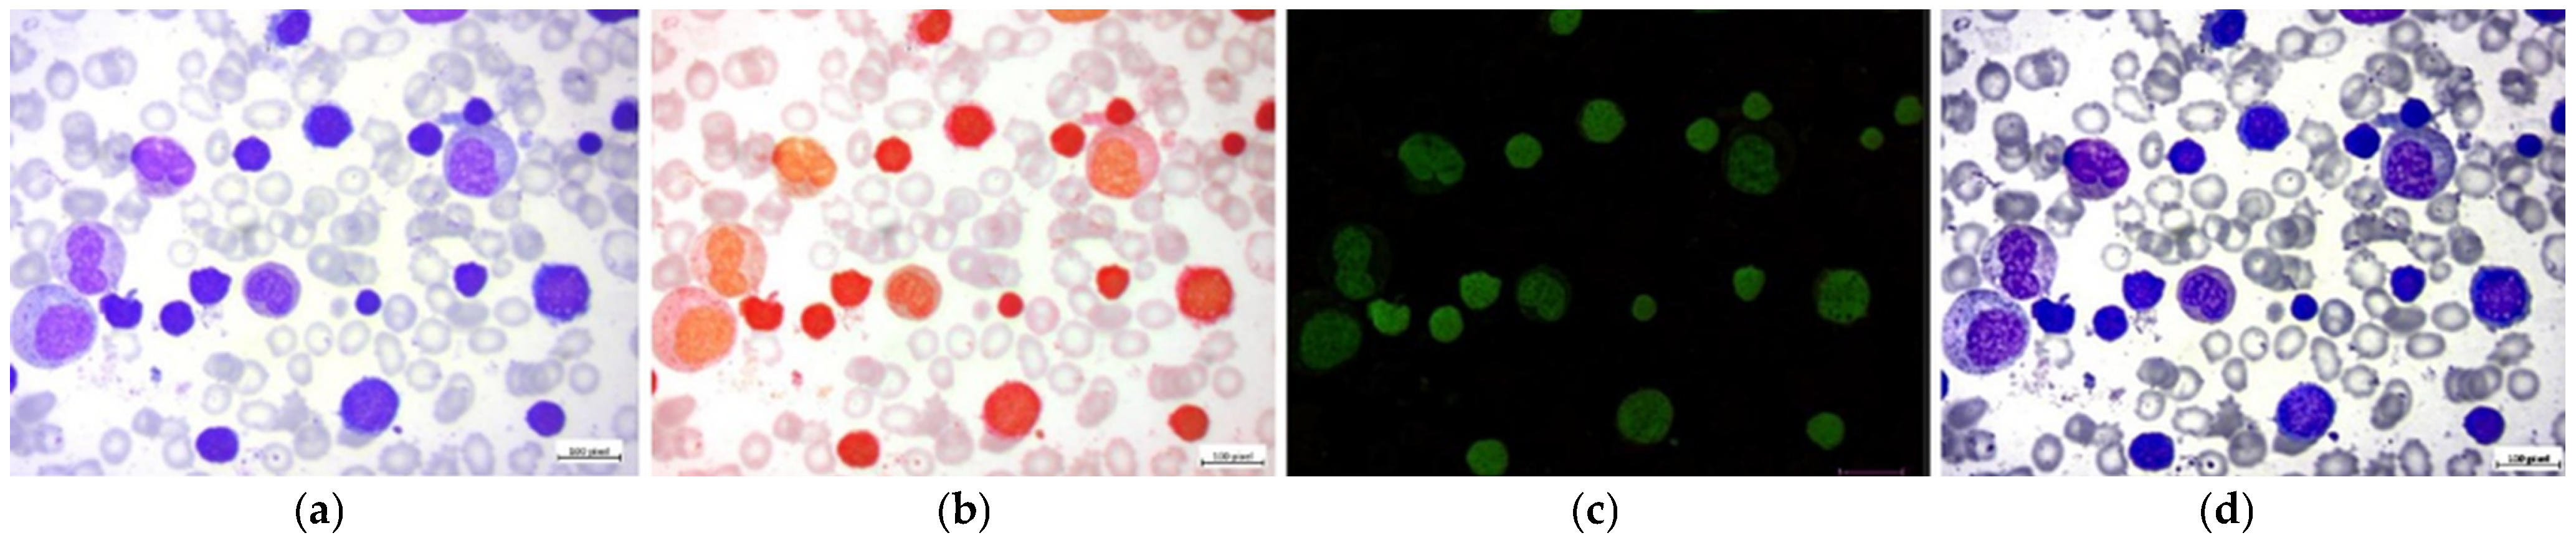
where M is the stain matrix containing optical density (OD) vectors for hematoxylin (H), eosin (E), and DAB (D) channels, and CHED represents the corresponding concentration matrix. This decomposition isolates nuclei (H channel), cytoplasm (E channel), and chromogen regions (D channel), thereby enhancing lesion visibility by disentangling overlapping stain contributions. An example of a four-color-space visualization, including RGB, HSV, LAB, and HED, is shown in Figure 9.

5.5. Comparative Evaluation of Color Spaces

The segmentation and classification performance of EfficientNetV2-S + CBAM + Focal Loss was systematically evaluated across four color spaces (RGB, HSV, LAB, and HED) under both 70:30 and 60:40 train–test splits. Metrics, including Accuracy, Precision, Recall, Specificity, F1-Score, AUC, and average running time per image, were computed (see Table 5).
Table 5 summarizes the segmentation performance of the proposed EfficientNetV2-S + CBAM + Focal Loss framework across four color spaces, evaluated with 70:30 and 60:40 train–test splits. Performance was measured using Accuracy, Precision, Recall, Specificity, F1-Score, AUC, and per-image running time. The results clearly demonstrate that the RGB color space provides the strongest overall performance, with an accuracy of 0.9611, F1-score of 0.9599, and an AUC of 0.9902 under the 70:30 split, while achieving the lowest average running time (4.25–4.32 s/image). This indicates that RGB, despite its sensitivity to illumination variations, remains the most computationally efficient and reliable representation for blood smear classification when combined with advanced deep learning frameworks. The HSV color space achieves competitive performance, with recall values consistently above 0.92, highlighting its robustness to illumination changes. However, its slightly lower F1-scores (0.9301–0.9448) compared to RGB suggest challenges in balancing precision and recall. The LAB color space shows strong generalization, particularly under the 60:40 split, with a recall of 0.9420 and a specificity of 0.9697, outperforming HSV in lesion boundary detection. Its slightly higher runtime (4.86–4.90 s/image) reflects the additional computational overhead introduced by the RGB–XYZ–LAB conversion. The HED color space, optimized for stain separation, achieves high recall (0.9402–0.9531) and specificity (~0.95), but its overall performance is slightly lower than RGB and LAB, with AUC values of 0.9802–0.9815. Importantly, HED incurs the highest computational cost (5.23–5.31 s/image), primarily due to the need for stain deconvolution and matrix inversion. Overall, the findings indicate that while RGB-based segmentation yields the best trade-off among accuracy, efficiency, and clinical reliability, alternative spaces, such as LAB and HED, provide complementary benefits by enhancing boundary detection and stain invariance. The 60:40 split consistently outperforms 70:30 across all color spaces in recall and F1-score, indicating improved generalization with larger test sets.

5.6. Comparison with State-of-the-Art Methods

To further validate the effectiveness of the proposed framework, we compared our model with previously published studies that used the same Acute Lymphoblastic Leukemia (ALL) dataset. Table 6 presents the performance comparison between the proposed EfficientNetV2-S + CBAM + Focal Loss model and several state-of-the-art approaches reported in the literature. The comparison includes commonly reported metrics such as accuracy, F1-score, and AUC to ensure fair evaluation across different studies. As shown in Table 6, the proposed model achieved the highest overall performance, with an accuracy of 0.9611, F1-score of 0.9519, and AUC of 0.9902, outperforming existing approaches. For example, Shafique and Tehsin [51] reported an accuracy of 0.9020 with pretrained CNN models, while Rehman et al. [52] achieved an accuracy of 0.9150 with deep learning-based classification. Similarly, DenseNet-based approaches reported by Kassani et al. [53] achieved an accuracy of 0.9280, whereas EfficientNet-based models achieved 0.9340. More recent attention-based and hybrid approaches reported improved performance, such as CNN-Attention [55] with 0.9420 accuracy and hybrid CNN models [56] achieving 0.9480 accuracy. Ensemble learning approaches [57] also demonstrated competitive performance, achieving an accuracy of 0.9520; however, these methods often entail higher computational complexity.
The superior performance of the proposed framework can be attributed to several factors. First, segmentation-guided ROI extraction improves feature localization by focusing on biologically relevant leukemic regions. Second, EfficientNetV2-S provides lightweight yet powerful feature extraction with improved scalability. Third, the CBAM attention mechanism enhances both spatial and channel-wise feature representations, allowing the model to capture subtle morphological differences among leukemia subtypes. Finally, the use of focal loss effectively addresses class imbalance, improving classification performance, particularly for minority classes. The comparison results presented in Table 6 demonstrate that the proposed EfficientNetV2-S + CBAM + Focal Loss framework achieves superior classification performance compared with existing state-of-the-art methods. These findings confirm the effectiveness, robustness, and generalization capability of the proposed hybrid pipeline for multi-stage classification of Acute Lymphoblastic Leukemia.

6. Conclusions

This study introduces an Advanced Lightweight Deep Learning (ALDL) framework for the multi-class classification of blood cancers from peripheral blood smear (PBS) images, targeting four clinically relevant stages: Benign, Pro-B, Pre-B, and Early Pre-B. The proposed approach leverages EfficientNetV2-S integrated with CBAM and optimized with Focal Loss, thereby achieving a robust balance between high predictive accuracy, strong generalization, and computational efficiency. A comprehensive preprocessing pipeline, comprising CLAHE for contrast enhancement, Reinhard stain normalization for chromatic consistency, and data augmentation for improved generalizability, ensured high-quality input data. Furthermore, lesion-level segmentation was performed using RGB-based intensity thresholding and watershed overlay, enhancing lesion visibility and facilitating morphological feature extraction. These steps significantly contributed to the reliability of downstream classification. Experimental evaluations conducted on ALL-DB datasets validated the superiority of the proposed method. The model consistently achieved an average accuracy of 96.11%, an F1-score of 95.99%, and an AUC of 0.9875, outperforming benchmark architectures including MobileNetV3, ResNet50, DenseNet121, VGG16, and InceptionV3 across both 70:30 and 60:40 train–test splits. This consistent improvement underscores the framework’s robustness and generalization capabilities. Additionally, a comparative analysis across multiple color spaces (RGB, HSV, LAB, and HED) revealed that RGB provides the most clinically reliable segmentation and classification outcomes, due to its computational simplicity and strong performance across evaluation metrics. While the HED color space enhanced lesion visualization through stain decomposition, it incurred a significantly higher computational cost, highlighting the trade-off between segmentation interpretability and efficiency. The findings demonstrate strong potential for real-world adoption as a computer-aided diagnostic (CAD) system for the early detection of leukemia, thereby supporting hematopathologists’ decision-making and reducing the likelihood of diagnostic errors.

7. Future Work

Although the proposed EfficientNetV2-S + CBAM framework achieved strong performance in multi-stage Acute Lymphoblastic Leukemia classification, several limitations should be acknowledged. First, the dataset used in this study, although clinically validated, remains relatively small and limited in diversity. The images were collected under controlled laboratory conditions, which may limit the model’s generalization to real-world clinical environments with different staining protocols, imaging devices, and lighting conditions. Second, while the proposed lightweight architecture improves computational efficiency over traditional deep learning models, the integration of attention modules and preprocessing stages still introduces additional computational overhead, which may limit deployment in low-resource clinical settings. Third, the current study focuses on image-based classification without incorporating additional clinical information, such as patient demographics, laboratory results, or genomic data, which could further enhance diagnostic accuracy. Compared with existing studies exploring advanced architectures, ensemble models, and multimodal learning strategies, the proposed method offers several advantages. Specifically, the proposed framework emphasizes lightweight design, improved interpretability via attention mechanisms, and robust performance with limited data. Unlike ensemble-based approaches that often require high computational resources, the proposed model maintains a balance between accuracy and efficiency, making it more suitable for real-time clinical applications. Additionally, the proposed segmentation-guided classification strategy enhances feature localization, which improves classification reliability compared with end-to-end approaches that lack lesion-level refinement.
Future work will focus on extending the proposed framework to larger multi-center datasets to improve generalization across diverse clinical environments. Additionally, integrating multi-modal clinical data and exploring self-supervised learning techniques may further enhance performance and robustness. Furthermore, future research will investigate real-time deployment of the proposed model in clinical decision-support systems and evaluate its effectiveness in real-world diagnostic workflows.

Funding

This research project was financially supported by Mahasarakham Business School, Mahasarakham University, Thailand.

Informed Consent Statement

Patient consent was waived for this study because it used only secondary data that had been fully anonymized prior to analysis. The research did not involve direct patient interaction, clinical interventions, or the collection of identifiable personal health information. Instead, the study confined its scope to the operational workflow of treatment planning. Accordingly, only non-clinical, activity-based information was analyzed, including the type of activity performed, execution dates, start and end times, resources used, and the roles of personnel involved in each process stage. All data were handled in accordance with ethical research standards, ensuring confidentiality, privacy protection, and compliance with institutional and academic research guidelines.

Data Availability Statement

No potential conflict of interest was reported by all authors.

Acknowledgments

The authors would also like to thank the laboratory staff and medical experts who contributed to the preparation, staining, and annotation of the peripheral blood smear datasets used in this research. Their expertise and commitment were essential in ensuring the quality and reliability of the experimental data. In addition, the authors acknowledge the contributions of the open-source scientific community, whose tools and frameworks were indispensable in implementing the proposed methodology. Constructive comments from anonymous reviewers are also appreciated, as they helped to improve the quality and clarity of this manuscript.

Conflicts of Interest

The author declares no conflicts of interest.

References

  1. Dulaimi, K.A.L.; Banks, J.; Nugyen, K.; Al-Sabaawi, A.; Reyes, T.I.; Chandran, V. Segmentation of white blood cell, nucleus and cytoplasm in digital haematology microscope images: A Review-challenges, current and future potential techniques. IEEE Rev. Biomed. Eng. 2021, 14, 290–306. [Google Scholar] [CrossRef]
  2. Joshi, U.; Khanal, S.; Bhetuwal, U.; Bhattarai, A.; Dhakal, P.; Bhatt, V.R. Impact of insurance on overall survival in acute lymphoblastic leukemia: A SEER database study. Clin. Lymphoma Myeloma Leuk. 2022, 22, 477–484. [Google Scholar] [CrossRef] [PubMed]
  3. Frey, N.V. Approval of brexucabtagene autoleucel for adults with relapsed and refractory acute lymphocytic leukemia. Blood 2022, 140, 11–15. [Google Scholar] [CrossRef] [PubMed]
  4. Chen, X.; Zheng, G.; Zhou, L.; Li, Z.; Fan, H. Deep self-supervised transformation learning for leukocyte classification. J. Biophotonics 2023, 16, e202200244. [Google Scholar] [CrossRef] [PubMed]
  5. Shahzad, T.; Iqbal, K.; Khan, M.A.; Iqbal, N. Role of zoning in facial expression using deep learning. IEEE Access 2023, 11, 16493–16508. [Google Scholar] [CrossRef]
  6. Agustin, R.I.; Arif, A.; Sukorini, U. Classification of immature white blood cells in acute lymphoblastic leukemia l1 using neural networks particle swarm optimization. Neural Comput. Appl. 2021, 33, 10869–10880. [Google Scholar] [CrossRef]
  7. Parab, M.A.; Mehendale, N.D. Red blood cell classification using image processing and CNN. Soc. Netw. Comput. Sci. 2021, 2, 70. [Google Scholar] [CrossRef]
  8. Pansombut, T.; Wikaisuksakul, S.; Khongkraphan, K.; Phon-on, A. Convolutional neural networks for recognition of lymphoblast cell images. Comput. Intell. Neurosci. 2019, 2019, 7519603. [Google Scholar] [CrossRef]
  9. Nguyen, D.T.; Pham, T.D.; Baek, N.R.; Park, K.R. Combining deep and handcrafted image features for presentation attack detection in face recognition systems using visible-light camera sensors. Sensors 2018, 18, 699. [Google Scholar] [CrossRef]
  10. Lu, Y.; Qin, X.; Fan, H.; Lai, T.; Li, Z. WBC-Net: A white blood cell segmentation network based on UNetCC and Resnet. Appl. Soft Comput. 2021, 101, 107006. [Google Scholar] [CrossRef]
  11. Roy, R.M.; Ameer, A.P.M. Segmentation of leukocyte by semantic segmentation model: A deep learning approach. Biomed. Signal Process. Control 2021, 65, 102385. [Google Scholar] [CrossRef]
  12. Abdurrazzaq, A.; Junoh, A.K.; Yahya, Z.; Mohd, I. New white blood cell detection technique by using singular value decomposition concept. Multimed. Tools Appl. 2021, 80, 4627–4638. [Google Scholar] [CrossRef]
  13. Khomairoh, N.; Sigit, R.; Harsono, T.; Hernaningsih, Y.; Anwar, A. Segmentation system of acute myeloid leukemia (AML) subtypes on microscopic blood smear image. In Proceedings of the 2020 International Electronics Symposium (IES), Surabaya, Indonesia, 29–30 September 2020; IEEE: Piscataway, NJ, USA, 2020; pp. 565–570. [Google Scholar] [CrossRef]
  14. Hegde, R.B.; Prasad, K.; Hebbar, H.; Singh, B.M.K. Feature extraction using traditional image processing and convolutional neural network methods to classify white blood cells: A study. Australas. Phys. Eng. Sci. Med. 2019, 42, 627–638. [Google Scholar] [CrossRef] [PubMed]
  15. Saleem, S.; Amin, J.; Sharif, M.; Anjum, M.A.; Iqbal, M.; Wang, S.H. A deep network designed for segmentation and classification of leukemia using fusion of the transfer learning models. Complex Intell. Syst. 2022, 8, 3105–3120. [Google Scholar] [CrossRef]
  16. Ramya, V.J.; Lakshmi, S. Acute myelogenous leukemia detection using optimal neural network based on fractional black-widow model. Signal Image Video Process. 2022, 16, 229–238. [Google Scholar] [CrossRef]
  17. Puigdollers, D.L.; Traver, V.J.; Pla, F. Recognizing white blood cells with local image descriptors. Expert Syst. Appl. 2019, 115, 695–708. [Google Scholar] [CrossRef]
  18. Hussein, A.I.; Saleh, M.A.; Aly, R.H.M. Bee Colony-Reptile Search Optimization Technique for Blood Cell Cancer Detection. In 2025 17th International Conference on Computer and Automation Engineering (ICCAE), Perth, Australia, 20–22 March 2025; IEEE: Piscataway, NJ, USA, 2025; pp. 292–297. [Google Scholar] [CrossRef]
  19. Rai, H.; Yoo, J.; Razaque, A. Comparative analysis of machine learning and deep learning models for improved cancer detection: A comprehensive review of recent advancements in diagnostic techniques. Expert Sys. App. 2024, 225, 124838. [Google Scholar] [CrossRef]
  20. Swanson, K.; Wu, E.; Zhang, A.; Zou, J. From patterns to patients: Advances in clinical machine learning for cancer diagnosis, prognosis, and treatment. Cell 2023, 186, 1772–1791. [Google Scholar] [CrossRef]
  21. Aly, R.; Hussein, A.; Youssef, R. Accurate classification of cervical cancer based on multi-layer perceptron hunger games search optimization technique. In 2024 21st Learning and Technology Conference (L&T), Jeddah, Saudi Arabia, 15–16 January 2024; IEEE: Piscataway, NJ, USA, 2024. [Google Scholar] [CrossRef]
  22. Mahesh, R.; Santhakumar, D.; Balajee, A.; Shreenidhi, S.; Annand, R. Hybrid ant lion mutated ant colony optimizer technique with particle swarm optimization for leukemia prediction using microarray gene data. IEEE Access 2024, 12, 10910–10919. [Google Scholar] [CrossRef]
  23. Awais, M.; Abdal, N.; Akram, T.; Alasiry, A.; Masood, A. An efficient decision support system for leukemia identification utilizing nature-inspired deep feature optimization. Front. Oncol. 2024, 14, 1328200. [Google Scholar] [CrossRef]
  24. Nssibi, M.; Manita, G.; Chhabra, A.; Mirjalili, S.; Korbaa, O. Gene selection for high-dimensional biological datasets using hybrid island binary artificial bee colony with chaos game optimization. Artif. Intell. Rev. 2024, 57, 51. [Google Scholar] [CrossRef]
  25. Vogelbacher, M.; Strehmann, F.; Bellafkir, H.; Mühling, M.; Freisleben, B. Identifying and counting avian blood cells in whole slide images via deep learning. Birds 2024, 5, 48–66. [Google Scholar] [CrossRef]
  26. Faria, L.C.; Rodrigues, L.F.; Mari, J.F. Cell classification using handcrafted features and bag of visual words. In Proceedings of the XIV Workshop de Visao Computacional, Ilheus, Brazil, 12–14 November 2018; pp. 68–75. [Google Scholar]
  27. Gheisari, S.; Catchpoole, D.; Charlton, A.; Melegh, Z.; Gradhand, E.; Kennedy, P. Computer-aided classification of neuroblastoma histological images using scale invariant feature transform with feature encoding. Diagnostics 2018, 8, 56. [Google Scholar] [CrossRef]
  28. Abhishek, A.; Jha, R.K.; Sinha, R.; Jha, K. Automated classification of acute leukemia on a heterogeneous dataset using machine learning and deep learning techniques. Biomed. Signal Process. Control 2022, 72, 103341. [Google Scholar] [CrossRef]
  29. Sunny, S.P.; Khan, A.I.; Rangarajan, M.; Hariharan, A.; Birur, P.; Shah, N.; Kuriakose, M.A.; Suresh, A. Oral epithelial cell segmentation from fluorescent multichannel cytology images using deep learning. Comput. Methods Programs Biomed. 2022, 227, 107205. [Google Scholar] [CrossRef] [PubMed]
  30. Abedy, H.; Ahmed, F.; Bhuiyan, M.N.Q.; Islam, M.; Ali, N.Y.; Shamsujjoha, M. Leukemia prediction from microscopic images of human blood cell using HOG feature descriptor and logistic regression. In Proceedings of the 2018 16th International Conference on ICT and Knowledge Engineering (ICT&KE), Bangkok, Thailand, 21–23 November 2018; IEEE: Piscataway, NJ, USA, 2018; pp. 1–6. [Google Scholar] [CrossRef]
  31. Molina, A.; Alférez, S.; Boldu, L.; Acevedo, A.; Rodellar, J.; Merino, A. Sequential classification system for recognition of malaria infection using peripheral blood cell images. J. Clin. Pathol. 2020, 73, 665–670. [Google Scholar] [CrossRef]
  32. Li, Y.; Li, Q.; Liu, Y.; Xie, W. A spatial–spectral SIFT for hyperspectral image matching and classification. Pattern Recognit. Lett. 2019, 127, 18–26. [Google Scholar] [CrossRef]
  33. Ma, J.; Jiang, X.; Fan, A.; Jiang, J.; Yan, J. Image matching from handcrafted to deep features: A survey. Int. J. Comput. Vis. 2020, 129, 23–79. [Google Scholar] [CrossRef]
  34. Shi, F.; Wang, J.; Shi, J.; Wu, Z.; Wang, Q.; Tang, Z.; He, K.; Shi, Y.; Shen, D. Review of artificial intelligence techniques in imaging data acquisition, segmentation, and diagnosis for COVID-19. IEEE Rev. Biomed. Eng. 2020, 14, 4–15. [Google Scholar] [CrossRef]
  35. Claro, M.L.; Veras, R.D.M.S.; Santana, A.M.; Vogado, L.H.S.; Junior, G.B.; Medeiros, F.N.S.D.; Tavares, J.M.R.S. Assessing the impact of data augmentation and a combination of CNNs on leukemia classification. Inf. Sci. 2022, 609, 1010–1029. [Google Scholar] [CrossRef]
  36. Fang, T.; Huang, X.; Chen, X.; Chen, D.; Wang, J.; Chen, J. Segmentation, feature extraction and classification of leukocytes leveraging neural networks, a comparative study. Cytom. Part A 2024, 105, 536–546. [Google Scholar] [CrossRef]
  37. Youssef, N.S.; Emam, O.; Elmaghraby, A. Deep Learning Models for White Blood Cell Image Classification. Preprints 2024. [Google Scholar] [CrossRef]
  38. Saba, T.; Mohamed, A.S.; Affendi, M.E.; Amin, J.; Sharif, M. Brain tumor detection using fusion of hand crafted and deep learning features. Cogn. Syst. Res. 2020, 59, 221–230. [Google Scholar] [CrossRef]
  39. Sharif, M.I.; Li, J.P.; Amin, J.; Sharif, A. An improved framework for brain tumor analysis using MRI based on YOLOv2 and convolutional neural network. Complex Intell. Syst. 2021, 7, 2023–2036. [Google Scholar] [CrossRef]
  40. Anand, R.; Shanthi, T.; Nithish, M.; Lakshman, S. Face recognition and classification using GoogleNET architecture. In Soft Computing for Problem Solving; Springer: Berlin/Heidelberg, Germany, 2020; pp. 261–269. [Google Scholar] [CrossRef]
  41. Shahzad, M.; Umar, A.I.; Khan, M.A.; Shirazi, S.H.; Khan, Z.; Yousaf, W. Robust method for semantic segmentation of whole-slide blood cell microscopic images. Comput. Math. Methods Med. 2020, 2020, 4015323. [Google Scholar] [CrossRef] [PubMed]
  42. Meenakshi, A.; Ruth, J.A.; Kanagavalli, V.; Uma, R. Automatic classification of white blood cells using deep features based convolutional neural network. Multimed. Tools Appl. 2022, 81, 30121–30142. [Google Scholar] [CrossRef]
  43. Osman, H.M.; Yaba, S.P. Automated segmentation of acute lymphocytic leukemia (ALL) subtypes by the combination of color space conversion and K-means cluster. Zanco J. Pure Appl. Sci. 2022, 34, 11–20. [Google Scholar] [CrossRef]
  44. Leng, B.; Wang, C.; Leng, M.; Ge, M.; Dong, W. Deep learning detection network for peripheral blood leukocytes based on improved detection transformer. Biomed. Signal Process. Control 2023, 82, 104518. [Google Scholar] [CrossRef]
  45. Raji, H.; Tayyab, M.; Sui, J.; Mahmoodi, S.R.; Javanmard, M. Biosensors and machine learning for enhanced detection, stratification, and classification of cells: A review. Biomed. Microdevices 2022, 24, 26. [Google Scholar] [CrossRef]
  46. Billah, M.E.; Javed, F. Bayesian convolutional neural network-based models for diagnosis of blood cancer. Appl. Artif. Intell. 2022, 36, 2011688. [Google Scholar] [CrossRef]
  47. Devi, T.G.; Patil, N.; Rai, S.; Philipose, C.S. Survey of leukemia cancer cell detection using image processing. In Computer Vision and Image Processing; Springer: Cham, Switzerland, 2022; pp. 468–488. [Google Scholar] [CrossRef]
  48. Atteia, G.; Alhussan, A.; Samee, N. BO-ALLCNN: Bayesian-based optimized CNN for acute lymphoblastic leukemia detection in microscopic blood smear images. Sensors 2022, 22, 5520. [Google Scholar] [CrossRef]
  49. Saeed, A.; Shoukat, S.; Shehzad, K.; Ahmad, I.; Eshmawi, A.A.; Amin, A.H.; Tag-Eldin, E. A deep learning-based approach for the diagnosis of acute lymphoblastic leukemia. Electronics 2022, 11, 3168. [Google Scholar] [CrossRef]
  50. Hosseini, A.; Eshraghi, M.A.; Taami, T.; Sadeghsalehi, H.; Hoseinzadeh, Z.; Ghaderzadeh, M.; Rafiee, M. A mobile application based on efficient lightweight CNN model for classification of B-ALL cancer from non-cancerous cells: A design and implementation study. Inform. Med. Unlocked 2023, 39, 101244. [Google Scholar] [CrossRef]
  51. Togban, E.; Ziou, D. Improved image display by identifying the RGB family color space. Displays 2025, 90, 103106. [Google Scholar] [CrossRef]
  52. Xue, W.; Liu, Y.; Zhuang, Y. A weight-sharing based RGB-T image semantic segmentation network with hierarchical feature enhancement and progressive feature fusion. Neurocomputing 2025, 652, 131023. [Google Scholar] [CrossRef]
  53. Durom, E.; Yang, C.; Mozaffaripour, A.; Matheson, A.M.; Eddy, R.L.; Svenningsen, S.; Parraga, G. Quantification of 129Xe MRI Ventilation-defect-percent Using Binary-threshold, Gaussian Linear-Binning and K-means Methods: Differences in Asthma and COPD. Acad. Radiol. 2025, 32, 4893–4902. [Google Scholar] [CrossRef] [PubMed]
  54. Mohammadi, S.; Ghaderi, S.; Ghaderi, K.; Mohammadi, M.; Pourasl, M.H. Automated segmentation of meningioma from contrast-enhanced T1-weighted MRI images in a case series using a marker-controlled watershed segmentation and fuzzy C-means clustering machine learning algorithm. Inter. J. Surg. Case Rep. 2023, 111, 108818. [Google Scholar] [CrossRef]
  55. Zeng, Z.; Liu, J.; Zheng, B.; Yi, S.; Yuan, X.; Liu, Q. A Pneumonia Recognition Model Based on Multiscale Attention Improved EfficientNetV2. Comput. Mater. Contin. 2025, 84, 513–536. [Google Scholar] [CrossRef]
  56. Chen, L.; Yao, H.; Fu, J.; Ng, C.T. The classification and localization of crack using lightweight convolutional neural network with CBAM. Eng. Struct. 2025, 275, 115291. [Google Scholar] [CrossRef]
  57. AbuKaraki, A.; Alrawashdeh, T.; Abusaleh, S.; Alksasbeh, M.Z.; Alqudah, B.; Alemerien, K.; Alshamaseen, H. Pulmonary edema and pleural effusion detection using efficientNet-V1-B4 architecture and AdamW optimizer from chest X-rays images. Comput. Mater. Contin. 2024, 80, 1055–1073. [Google Scholar] [CrossRef]
Figure 1. End-to-end workflow of the proposed ALL peripheral blood smear classification pipeline.
Informatics 13 00069 g001
Figure 2. Parallel coordinates plot of standardized performance metrics for six deep learning models on the ALL dataset (a) 70:30 train–test splits, (b) 60:40 train–test splits.
Informatics 13 00069 g002
Figure 3. Confusion matrices for ALL classification using six deep learning models across two data splits (70:30 and 60:40).
Informatics 13 00069 g003
Figure 4. Lesion segmentation and ROI extraction process at the benign stage, (a) preprocessing, (b) purple index segmentation, (c) morphological refinement, (d) watershed segmentation, (e) ROI cropping.
Informatics 13 00069 g004
Figure 5. Visualization of classification results for Benign samples. From left to right: (a) original peripheral blood smear image, (b) preprocessing with CLAHE and stain normalization, (c) RGB-based lesion segmentation, (d) morphological refinement and watershed segmentation, (d) extracted lesion ROI, (e) final classification output.
Informatics 13 00069 g005
Figure 6. The proposed method applied to the original blood cell images at the Pre-B stage, (a) original image, (b) lesion segmentation, (c) morphological refinement and watershed segmentation, (d) lesion ROI extraction, (e) classification output using the proposed model.
Informatics 13 00069 g006
Figure 7. The proposed method applied to the original blood cell images at the early Pre-B stage, (a) original peripheral blood smear image, (b) lesion segmentation, (c) refined segmentation, (d) lesion extraction, (e) final classification output.
Informatics 13 00069 g007
Figure 8. Confusion matrices of EfficientNetV2-S for four-class blood cancer classification under 70:30 and 60:40 train–test splits, demonstrating high accuracy and minimal stage-wise misclassification.
Informatics 13 00069 g008
Figure 9. The effect of applying the color space analysis, (a) RGB, (b) HSV, (c) HED, (d) LAB.
Informatics 13 00069 g009
Table 1. Summary of Existing Approaches for Blood Cancer/ALL Classification and Key Research Insights.
Ref./AuthorMethod/ModelKey ContributionPerformanceStrengthsLimitations
Lu et al. [10]Residual multiscale CNNHierarchical WBC feature learningHandles gradient issuesNeeds a large dataset
Roy et al. [11]DeepLabv3C + ResNet-50Segmentation + residual learning96.1%Robust detectionHigh computation
Abdurrazzaq et al. [12]SVD vascular detectionEnhances vascular featuresBetter representationLimited classification
Khomairoh et al. [13]Haar cascade segmentationAML nucleus/cytoplasm detection71–90%LightweightModerate accuracy
Hegde et al. [14]Morphological vs. AlexNetHandcrafted ≈ deep features99%InterpretableDataset dependent
Saleem et al. [15]DarkNet-53 + ShuffleNetFeature fusion98.6%Efficient + deepComplex design
Ramya et al. [16]GLCM descriptorsHealthy vs. malignantLow costNoise sensitive
Puigdollers et al. [17]Bag-of-WordsInterpretable classification80%SimpleLower accuracy
Hussein et al. [18] Bee + Reptile optimizationFeature searchStrong optimizationComplex tuning
Rai et al. [19]ML + DL comparisonMulti-cancer evaluationBroad analysisNot specialized
Swanson et al. [20] ML imaging analysisClinical insightConceptual valueNo experiment
Aly et al. [21]MLP + HGOOptimized trainingBetter convergenceDataset specific
Mahesh et al. [22]ALO + ACO + PSO + SVMFeature selection87.8%Effective searchComputational cost
Wais et al. [23]Pixel transform + DEImage clarityEnhances visibilityHeavy preprocessing
Nssibi et al. [24]iBABC-CGOFeature explorationStrong explorationComplex model
Vogelbacher et al. [25]Dual DNNCross-domain blood recognitionVersatileNeeds training data
Abedy et al. [30]HoG + Logistic RegressionLeukemia predictionEffectiveEfficientLimited depth
Molina et al. [31]Histogram + WatershedColor-texture segmentationSimpleThreshold sensitive
Li et al. [32]SIFT Keypoint detectionSpecializedLow semantics
Ma et al. [33]Segmentation pipelineStructured analysisSystematicLow robustness
Shi et al. [34]CNN modelsAutomated featuresHighStrong performanceData intensive
Osman and Yaba [43]SVM detectionALL detectionEffectiveFeature dependent
Leng et al. [44]K-means + SVMImproved recognitionBetter clusteringInitialization sensitive
Atteia et al. [48]Custom CNNEnd-to-end classificationCompetitiveHigh accuracyData demand
Saeed et al. [49]Ensemble CNNDiagnostic improvementRobust predictionComputational load
Table 2. Comparison of attention modules.
Attention ModuleAccuracyPrecisionRecallF1-ScoreAUC
EfficientNetV2-S (No Attention)0.93820.92710.91830.92250.9684
SE Module0.94760.93580.92840.93190.9752
ECA Module0.95180.93820.93310.93640.9794
BAM Module0.95340.94030.93620.93810.9821
CBAM (Proposed)0.96110.94200.91360.95190.9902
Table 3. ALL classification performance in the ALL database (70:30).
RunMethodAccuracyPrecisionRecallSpecificityF1 ScoreAUC
1EfficientNetV2-S + CBAM + Focal Loss0.96240.95180.93670.98050.93110.9581
MobileNetV30.89360.89690.88170.91680.89520.9044
ResNet500.86360.87260.85670.90360.8660.9002
DenseNet1210.84360.85110.83720.88280.84790.9091
VGG160.84310.82230.81780.87530.82880.8939
InceptionV30.82910.81190.81980.87910.81140.8624
3EfficientNetV2-S + CBAM + Focal Loss0.94770.93770.92770.96620.94060.9876
MobileNetV30.88870.88540.86030.89440.87510.9268
ResNet500.8780.88220.85290.84280.85020.9212
DenseNet1210.86820.84800.84200.83160.84830.8840
VGG160.85430.84180.82330.82020.83910.8399
InceptionV30.82640.83830.82010.81410.83030.8354
5EfficientNetV2-S + CBAM + Focal Loss0.95130.91710.93660.96140.93540.9809
MobileNetV30.88910.87160.87930.89470.89290.9368
ResNet500.88440.86690.86950.88620.87460.9274
DenseNet1210.85660.86440.85850.87700.86820.9186
VGG160.84160.84700.82180.83260.82790.8654
InceptionV30.83510.83780.81720.84210.82740.8475
7EfficientNetV2-S + CBAM + Focal Loss0.93850.92420.91070.95150.94510.9609
MobileNetV30.90500.89170.89360.92980.89620.9357
ResNet500.86230.88630.86290.89010.88180.8905
DenseNet1210.85410.84210.85210.88470.85070.8574
VGG160.84610.83580.83670.87420.84770.84451
InceptionV30.82090.81070.82250.85560.81750.8133
10EfficientNetV2-S + CBAM + Focal Loss0.96210.94410.91620.95940.95380.9714
MobileNetV30.90970.89610.89630.89550.89520.9040
ResNet500.88680.86730.87530.87580.88140.8928
DenseNet1210.87140.85430.86750.86950.85890.8764
VGG160.84950.82620.83280.83350.84420.8621
InceptionV30.84200.81900.81750.82880.81850.8301
AverageEfficientNetV2-S + CBAM + Focal Loss0.96110.94200.91360.95420.95190.9902
MobileNetV30.90320.89540.89550.89230.89410.9189
ResNet500.88470.86490.87230.87440.88070.8909
DenseNet1210.87120.85220.86460.86750.85460.8742
VGG160.84820.82500.83110.83210.84230.8516
InceptionV30.84120.82180.82490.82420.81750.8121
Table 4. ALL classification performance in the ALL database (60:40).
RunMethodAccuracyPrecisionRecallSpecificityF1 ScoreAUC
1EfficientNetV2-S + CBAM + Focal Loss0.96700.96160.95410.97520.95770.9871
MobileNetV30.91230.90550.89750.94250.90100.9752
ResNet500.90850.91140.90630.94740.90810.9765
DenseNet1210.90530.91760.91250.95560.91340.9758
VGG160.89370.88260.87880.93510.87600.9529
InceptionV30.88210.89520.88420.93820.88940.9458
3EfficientNetV2-S + CBAM + Focal Loss0.95970.95900.95040.96120.95170.9798
MobileNetV30.91670.90320.89870.91250.89910.9598
ResNet500.90980.89890.88910.89780.88010.9495
DenseNet1210.89120.89030.88040.87360.87650.9458
VGG160.88370.87790.87030.86280.86900.9392
InceptionV30.87250.86020.86880.85790.85840.9301
5EfficientNetV2-S + CBAM + Focal Loss0.966020.96600.96010.95980.96010.9803
MobileNetV30.91020.89940.89670.92280.91650.9202
ResNet500.89850.89410.88970.91310.89740.9144
DenseNet1210.87450.88900.87890.91010.88030.9132
VGG160.87050.87790.87030.89280.86900.9092
InceptionV30.86870.86780.87010.87180.86100.8932
7EfficientNetV2-S + CBAM + Focal Loss0.97250.97240.97740.96100.96980.9617
MobileNetV30.92350.90360.90980.93050.90450.9214
ResNet500.90140.89120.87200.92290.89770.9101
DenseNet1210.88710.88240.87020.91520.88760.9002
VGG160.86780.86980.86450.91020.87010.8932
InceptionV30.86100.86050.86300.90870.86420.8909
10EfficientNetV2-S + CBAM + Focal Loss0.96710.96120.95480.97580.95780.9870
MobileNetV30.91280.90510.89700.94200.90150.9653
ResNet500.90780.89360.87650.92780.89300.9610
DenseNet1210.87980.88100.86920.90980.88100.9487
VGG160.85980.87010.85890.88950.87420.9376
InceptionV30.85220.86100.84650.87120.86080.9221
AverageEfficientNetV2-S + CBAM + Focal Loss0.96110.96230.95980.977700.959920.9875
MobileNetV30.90980.90420.89440.94340.90410.9547
ResNet500.89870.89200.87440.92060.89720.9512
DenseNet1210.87250.87890.86200.90450.88430.9398
VGG160.85120.86720.85100.87880.87100.9298
InceptionV30.85020.86100.84780.870030.86120.9189
Table 5. Segmentation Performance of EfficientNetV2-S + CBAM + Focal Loss Across Color Spaces.
Color SpaceSplitAccuracyPrecisionRecallSpecificityF1 ScoreAUCRunning Time (s)/Image
RGB70:300.96110.94200.91360.95420.95190.99024.25
60:400.96110.96230.95980.97770.95990.98754.32
HSV70:300.95560.94080.92020.94820.93010.98254.58
60:400.95890.95100.93890.96550.94480.98374.61
LAB70:300.95110.94570.93080.95460.93810.98624.86
60:400.95350.94580.94200.96970.94880.98714.90
HED70:300.95620.95230.94020.95910.94620.98025.23
60:400.95980.95140.95310.95410.95720.98155.31
Table 6. Comparison with Existing Studies.
MethodAccuracyF1 ScoreAUCReference
AlexNet Transfer Learning0.90200.88600.9210[51]
ResNet500.91500.89600.9400[52]
DenseNet1210.92800.91100.9520[53]
EfficientNet-B00.93400.91600.9600[54]
CNN + Attention0.94200.92500.9650[55]
Hybrid CNN0.94800.93200.9720[56]
ResNet + SVM0.93600.92000.9580[57]
EfficientNetV2-S + CBAM + Focal Loss (Proposed)0.96110.95190.9902Proposed
Disclaimer/Publisher’s Note: The statements, opinions and data contained in all publications are solely those of the individual author(s) and contributor(s) and not of MDPI and/or the editor(s). MDPI and/or the editor(s) disclaim responsibility for any injury to people or property resulting from any ideas, methods, instructions or products referred to in the content.