Article

Percolation–Stochastic Model for Traffic Management in Transport Networks

by
Anton Aleshkin
1,
Dmitry Zhukov
2,* and
Vadim Zhmud
3,*
1
Institute of Cybersecurity and Digital Technologies, MIREA-Russian Technological University, 78 Vernadsky Avenue, 119454 Moscow, Russia
2
Institute of Radio Electronics and Informatics, MIREA-Russian Technological University, 78 Vernadsky Avenue, 119454 Moscow, Russia
3
Institute of Laser Physics SB RAS, Prosp. Lavrentieva 15b, 630090 Novosibirsk, Russia
*
Authors to whom correspondence should be addressed.
Informatics 2025, 12(4), 122; https://doi.org/10.3390/informatics12040122
Submission received: 23 August 2025 / Revised: 20 October 2025 / Accepted: 31 October 2025 / Published: 6 November 2025

Abstract

This article describes a model for optimizing traffic flow control and generating traffic signal phases based on the stochastic dynamics of traffic and the percolation properties of transport networks. As input data (in SUMO), we use lane-level vehicle flow rates, treating them as random processes with unknown distributions. It is shown that the percolation threshold of the transport network can serve as a reliability criterion in a stochastic model of lane blockage and can be used to determine the control interval. To calculate the durations of permissive control signals and their sequence for different directions, vehicle queues are considered and the time required for them to reach the network’s percolation threshold is estimated. Subsequently, the lane with the largest queue (i.e., the shortest time to reach blockage) is selected, and a phase is formed for its signal control, as well as for other lanes that can be opened simultaneously. Simulation results show that when dynamic traffic signal control is used and a percolation-dynamic model for balancing road traffic is applied, lane occupancy indicators such as “congestion” decrease by 19–51% compared to a model with statically specified traffic signal phase cycles. The characteristics of flow dynamics obtained in the simulation make it possible to construct an overall control quality function and to assess, from the standpoint of traffic network management organization, an acceptable density of traffic signals and unsignalized intersections.

1. Introduction

Traffic management and flow balancing in transport networks are among the most critical challenges faced by modern megacities. Urbanization, industrial development, and increasingly complex coordination generate massive traffic flows within limited road infrastructure. This inevitably leads to congestion, resulting in significant time losses, economic costs, and adverse environmental impacts due to increased emissions of harmful substances into the atmosphere.
According to the TomTom Traffic Index, in 2020, Moscow, Russian Federation, ranked as the city with the most congested road network in the world. By 2024, the ranking was led by London, Mexico City, and New York City (USA). The index covers 500 cities across 62 countries (the full ranking is available at https://www.tomtom.com/traffic-index/). Furthermore, according to INRIX data, as reported by media outlets such as the New York Post and Bloomberg, traffic congestion in the United States resulted in an economic loss of $771 billion in 2024, which is $38 billion more than in the previous year (www.inrix.com/scorecard/#city-ranking-list, accessed on 30 October 2025). These findings confirm the existence of a global problem that affects virtually all areas of human activity.
The aim of this study is to develop a model for managing lane congestion in urban road networks through dynamic switching of traffic light phases based on the stochastic dynamics of traffic flows and the percolation properties of the network.
To illustrate the complexity and breadth of the research domain, we briefly review selected studies addressing existing approaches to traffic system analysis, modeling, and control. Within the scope of this paper, however, we will not provide a detailed historical overview of classical traffic flow models (such as those of Greenshields, Richards, Greenberg, El-Hozaimy, Underwood, Drake, Pipes, the Optimal Velocity Model, the Intelligent Driver Model, and car-following approaches) nor their various classifications.
Recent studies should be considered. For instance, the authors of [1] discuss techniques and technologies for the intellectualization of traffic light control systems in smart cities. Their work focuses on Adaptive Traffic Light Control (ATLC), designed to rapidly resolve traffic situations at intersections, with the possibility of further upgrading the system to grant priority passage to emergency vehicles. The review summarizes ATLC systems developed using existing technologies such as Wireless Sensor Networks (WSN), Vehicular Ad-Hoc Networks (VANET), and image processing methods. The advantages of employing fuzzy logic in traffic management are highlighted, along with popular approaches to the implementation of ATLC.
In [2], the authors investigate the feasibility of implementing a smart traffic light system in Almaty within the framework of the “Smart City” concept. A simulation experiment is conducted to explore the development of a fully integrated traffic light system for the city. Based on neural network technology (YOLO), the authors propose a constructive algorithm for mitigating congestion at a specific intersection and for developing a corresponding software solution.
Using the popular open-source simulation environment SUMO (Simulation of Urban Mobility) [3], the authors of [4,5] construct and analyze a dataset for the MATSim Open Berlin scenario. The scenario developed in [4] is designed for transport modeling in the Berlin metropolitan area and is implemented within the MATSim platform, an agent-based transport simulation framework. It is built on open data, while a fully synthetic procedure generates the traffic flows. Unlike most transport modeling scenarios, statistical input data is not required.
Thus, the scenario generation procedure described in this study can be transferred to other urban environments, facilitating the creation of agent-based transport simulation scenarios for arbitrary cities. Other studies [5,6,7] may also be noted that employ the SUMO simulation environment to model traffic flows in megacities.
In [8], the authors model traffic flows in Seoul, Republic of Korea. To identify the empirical relationship between function and network structure in urban traffic flows, they construct a time-varying traffic flow network. Using percolation theory approaches, the authors analyze the resulting efficiency.
By comparing the real traffic flow network with a corresponding null-model network with a randomized structure, they show that the real network is less efficient than the null model during peak hours but more efficient during off-peak periods. They also observe that, in the real network, lanes with the highest throughput generally perform worse during peak hours compared to lanes with lower capacity. Since the main connecting links in the network are bridges, their congestion has the greatest impact on the global efficiency of the entire infrastructure.
In [9], the authors apply methods and approaches from percolation theory to control traffic flows along dynamically evolving regional perimeters, where the geometry of the boundary changes over time due to congestion dynamics. The percolation-based dynamic perimeter described in the study effectively adapts to spreading congestion and prevents small, congested zones from merging into larger overloaded clusters. The authors demonstrate the effectiveness of the proposed approach using a typical grid network.
The results demonstrate:
  • Percolation analysis can effectively characterize the spatiotemporal evolution of congestion for the purpose of traffic signal control.
  • Dynamic signal adjustment based on percolation-driven congestion analysis successfully balances traffic, thereby increasing overall network throughput.
  • Dynamic percolation-based perimeter control significantly outperforms conventional fixed-perimeter control in terms of network traffic efficiency.
In [10], the authors address a set of problems related to the optimal management of urban traffic flows and present a description of a developed traffic control system that incorporates three modes of operation: manual control, feedback-based control, and programmatic control. Meanwhile, [11] highlights the key mechanisms of optimization in urban traffic management.
In feedback-based traffic control, quantitative characteristics of traffic flows are obtained from road infrastructure detectors, video cameras, inductive loop sensors, and radar sensors. Signal processing from these detectors provides real-time information on traffic conditions.
To determine the switching moments of traffic light phases, the quantitative flow characteristics are fed into a mathematical traffic flow model implemented within the computational environment of an automatic traffic control system.
The presented model consists of a system of finite-difference recurrent equations that describe traffic flow dynamics on each road segment at every time step based on calculated parameters such as flow characteristics across the network, lane capacities, and traffic distribution at intersections with alternative directions.
The model exhibits scalability and aggregation properties. Its structure depends on the topology of the controlled road network graph, where the number of nodes corresponds to the number of analyzed road segments. The primary control of vehicle movement is achieved by adjusting the duration of traffic light phases at signalized intersections.
Contemporary studies also employ artificial intelligence methods and approaches [12,13,14,15], exploring various strategies for traffic management depending on traffic density parameters and stochastic characteristics [16].
At the same time, it is essential to account for the periodicity of traffic flows throughout the day [17] as well as factors related to road safety parameters [18].
The reviewed studies [1,2,3,4,5,6,7,8,9,10,11,12,13,14,15,16] demonstrate the applicability of percolation theory methods and approaches, as well as the fundamental feasibility of developing adaptive solutions for intersection traffic management through the adjustment of traffic signal phase durations.
At present, systems and solutions for adaptive traffic management are widely used in practice, for example, SCATS and SCOOT systems. Modern SCATS versions use fixed pre-optimized coordination plans for groups of intersections and select the most suitable plan; a limitation is that they may underutilize available network capacity. The disadvantage of SCATS is that it does not utilize all the capacity reserves of the road network.
SCOOT, unlike SCATS, uses a “network” calculation. Adjacent intersections with regulated traffic lights and pedestrian/bicycle crossings are combined into groups. SCOOT then calculates the optimal traffic light operating time for the entire group, adjusts the length of the stages, modifies the cycle time to minimize delay, and changes the offset between traffic light settings to ensure maximum coordination of operating time.
The approach proposed in this article is based on slightly different principles. We propose calculating the regulation time not based on predetermined plans, nor for the entire group of intersections, but rather on the percolation properties of the network for each direction at each intersection individually. In this sense, the model described in the article is also adaptive.
In what follows, we outline the essential components of such a solution and describe one possible implementation.

2. Mathematical Framework of the Proposed Model

2.1. Description of Intersection Operation

Building upon our earlier studies [16,17], we define the fundamental entities needed for the formulation of an urban traffic control model. The traffic signal is regarded as the primary control object, where the control variable corresponds to the binary state of granting or denying permission for vehicular movement. Specifically, this state determines whether vehicles are allowed to transition from a designated entry lane (approach segment) to a corresponding exit lane at the intersection.
A traffic signal can be formally represented as an operator that governs the admissible set of entry–exit lane mappings, constrained by the regulatory rules of road traffic. The traffic light forms a unifying mechanism that encapsulates all possible lane-to-lane movement combinations, ensuring compliance with safety and operational requirements.
As an illustrative example, Figure 1 presents a traffic light system that governs 14 traffic lanes. Lanes numbered 1–7 are directly controlled by the traffic signal and represent the entry lanes through which vehicles exit the given intersection. In this example, each entry lane allows between two and four possible exit directions. Consequently, the intersection is characterized by 18 control signals for the 7 entry lanes, corresponding to the total number of possible entry–exit combinations.
Control signals that can be simultaneously activated without violating traffic regulations are grouped into phases, where each phase is defined as a set of compatible control signals along with their activation duration. The task of the control system is thus twofold: to select the proper phase for implementation and to determine the activation time assigned to the selected phase.
To obtain a correct model of intersection operation, it is necessary to monitor the number of vehicles on traffic lanes. We assume that if another vehicle cannot fit on a lane (i.e., the number of vehicles occupying the lane has reached its maximum), then a traffic jam is formed on this lane. The physical parameters of a lane (its length in meters) can be obtained from cartographic data, while the size of a single vehicle is assumed by default to be 7.5 m (5.5 m for the vehicle itself plus 1.0 m of free space in front and 1.0 m behind).
As a node of the studied graph, we take an individual traffic lane, since the lane state (vehicle count) determines the node state (the entrance direction to the intersection may be blocked). The possibility of moving from one lane to another through controlled and unsignalized intersections, as well as lane changes to adjacent lanes, defines the edges in the studied graph.
To determine the lane requiring control and to calculate the activation time of its green and red phases, one can use a stochastic dynamics model, the general characteristics of which are described in [17], while the specifics of its application for modeling traffic flow dynamics will be discussed later in this paper. To avoid activating the traffic light for a period that will not be used for passing through the intersection, only the number of vehicles in the departure lane waiting for a permissive signal will be considered. Also, to avoid redundant waiting intervals under otherwise equal conditions, the lane with the largest number of vehicles will be selected.
To describe the properties of the transport network as a whole and of its individual nodes and connections, one can introduce the concept of exit availability for each direction at a traffic light, which can be defined either by the percolation threshold of the road network calculated on the basis of its graph or by a predefined parameter characterizing the required quality of the road network performance.
The methods and approaches applied in percolation theory study the problem of a network’s transition from an operational to a non-operational state, based on the structural properties of the network and the probability of blocking its individual nodes and/or links. To prevent overload of the road network, we calculate its percolation threshold using percolation theory methods [16]. This is necessary to determine, for example, using stochastic dynamics models of vehicle arrivals at an intersection, the maximum number of vehicles for each traffic lane compared to this percolation threshold, or the timing of traffic signal switching.
The approach presented in this article for traffic management in transport networks is as follows. Reaching the percolation threshold in any network leads to the loss of its connectivity (the impossibility of implementing any randomly selected route). The value of the percolation threshold is the limiting value of the probability of blocking a single element of any network, at which there is a loss of its connectivity (this is one of the main results of percolation theory). If there is a solution to the stochastic equation that describes the dynamics of the vehicle accumulation in any of the directions in front of the traffic light, then, by observing the dynamics of incoming and outgoing flows and knowing the capacity of this direction (the maximum possible number of vehicles for this lane, after reaching which it can be considered blocked), it is possible to calculate the time to achieve blocking for it. The solution of the stochastic equation can be obtained as a time-dependent probability of achieving certain states, including specified states, for any selected network element. Then, as the limit value of this probability, one can choose the value of the percolation threshold and estimate the time to reach the percolation threshold for any direction (considering the inbound and outbound flows, as well as its limiting capacity). Then, one can then sort the obtained time intervals and select the direction for which there will be a minimum time to reach the percolation threshold as a priority for departure [19,20,21].
It is also necessary to discuss the important question of why the probability of loss of network connectivity can be used to determine the optimal (or near-optimal) time for a traffic light signal. If we take a probability greater than the percolation threshold as the threshold, then we obtain an overestimation of the time interval for reaching blockage (blocking will be reached earlier than the estimated interval). The element appears to be blocked, but we continue to assume that it is in an operational state. If we take a value less than the percolation threshold, we obtain an underestimation of the blocking time interval. The element will still have operational capacity, but we will consider it locked. This can cause unnecessary loss of waiting time in other directions at this intersection.

2.2. Fundamental Principles of Percolation Theory

Let us consider principles of percolation theory [22,23,24,25,26] that can be used to describe transport networks. When analyzing the percolation properties of networks, two types of problems can be addressed, which differ significantly in their final outcomes: the node-blocking problem and the link-blocking problem. In this study, when examining the urban transport network, we assume that a blocked traffic lane corresponds to a blocked node of the network. Thus, our focus is specifically on the node-blocking problem rather than the link-blocking problem.
If we denote the probability of blocking a node (or link) as Q i (where i is the node index), then we can introduce the probability density n s ( Q i ) , which represents the probability that a randomly chosen node or link belongs to a cluster of blocked nodes or links of size S (where S is any integer). For small values of Q i , congested nodes are mostly isolated. As Q i increases, clusters appear—groups of S blocked interconnected nodes but not yet forming a single structure. The critical value Q i = Q , at which the formation of a single connected cluster occurs, defines the percolation threshold. For Q i < Q , clusters stay local (isolated) structures, while for Q i Q , local clusters (though not necessarily all) merge into one infinite cluster. The percolation (flow) threshold corresponds to the value of Q i (for a single node or link) at which the entire network loses its conductivity.
The percolation thresholds for planar and non-planar networks with the same density (the average number of links per network node) differ significantly from each other and depend on their distinct structural characteristics. In [27,28,29,30], research results were presented that make it possible to model percolation processes in networks with random topology and to numerically calculate the values of percolation thresholds depending on the density of the network under consideration.

2.3. Stochastic Dynamics Model of Traffic Light Operation

Let us consider the variation in vehicle flows as a random process for each traffic light direction and for each lane of the transport network. We define a critical permissible queue length L (the number of vehicles that can be physically accommodated in each lane). Then, the probability P ( L ,   t ) can be determined, being the likelihood that by time t the number of vehicles in the queue does not exceed L (i.e., no traffic jam is formed).
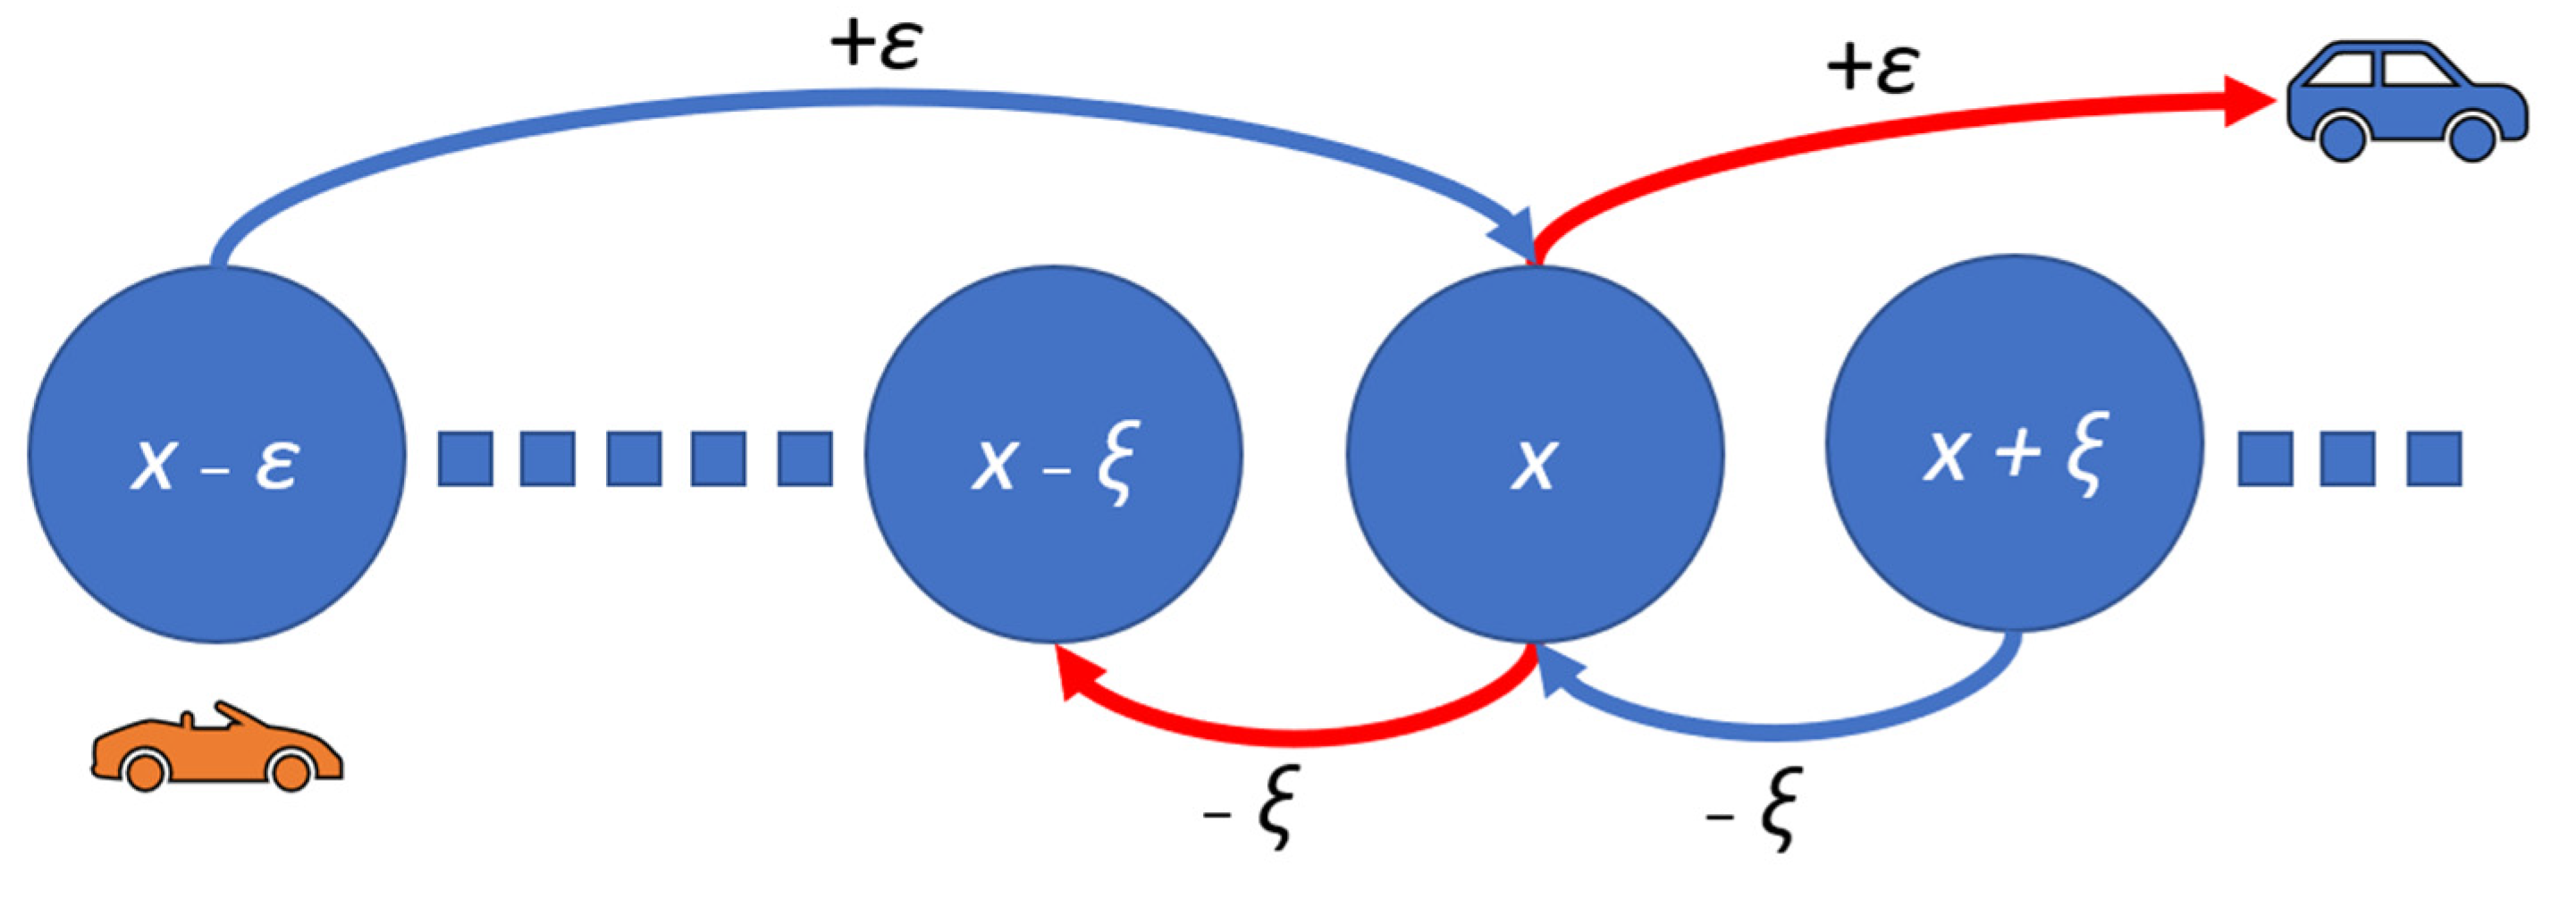
Suppose that over a certain time interval τ , at intersection j and in direction i , ε vehicles arrive in the queue and ξ vehicles leave. The entire process can be represented as consisting of discrete steps h , each of duration τ , where ε τ = λ is the arrival flow intensity, and ξ τ = µ is the departure flow intensity.
Let P x ε , h denote the probability that after h steps there are ( x ε ) vehicles in the queue; P x , h the probability that there are x vehicles; and P x + ξ , h the probability that there are ( x + ξ ) vehicles. Then the probability P x , h + 1 (see Figure 2) that there will be x vehicles at step h + 1 is given by:
P x , h + 1 = P x ε , h   +   P x + ξ , h   P x , h
Let us introduce t = h τ , where t denotes the total process time, and obtain:
P ( x , t + τ ) = P ( x ε , t ) + P ( x +   ξ , t ) P ( x , t )
Expanding the obtained equation into a Taylor series, we obtain:
P x , t + τ P x , t t + τ 2 2 2 P x , t t 2 + = P x , t ε P x , t x + ε 2 2 2 P x , t x 2 + P x , t + ξ P x , t x + ξ 2 2 2 P x , t x 2 + P x , t
The second derivative with respect to t can be omitted, since by its meaning it describes a process in which the vehicles themselves could act as sources of additional vehicles. Considering on the left-hand side the terms having no higher than the first derivative with respect to t , and on the right-hand side no higher than the second derivative with respect to x , we obtain:
τ P x , t t = ε 2 + ξ 2 2 2 P x , t x 2 ( ε ξ ) P x , t x
P x , t t = λ 2 + µ 2 2 µ 2 P x , t x 2 ( λ µ ) P x , t x
Assuming that µ and λ do not depend on x , and introducing the notation a = µ 2 + λ 2 2 µ   μ 2 + λ 2 2 λ = a nd b = λ µ we obtain:
P x , t t = a 2 P x , t x 2 b P x , t x
The term d ρ x , t d t defines the overall change in the system or process state over time; d ρ x , t d x describes an ordered transition either into a state where it increases ( ε > ξ ) or where it decreases ( ε < ξ ); d 2 ρ x , t d x 2 characterizes the random variation in the state.
It should be noted that the outbound traffic flow from a lane is determined by the traffic light signal: a red signal implies that the outbound flow is zero, while a green signal implies that vehicles in the given direction may pass through the intersection with some maximum travel time per vehicle, but they may also not pass if the first vehicle in the queue does not depart in this direction and instead waits for the corresponding permissive signal (this point will be discussed in more detail later).
To demonstrate the cyclic nature of the processes and to correctly control the flows for each direction, we assume that in the sequence of signals red–green–yellow–red, for each direction, the starting point for data collection is the switch from red to green (when the outbound flow ceases to be zero).
Data are collected throughout the green phase, the yellow phase, and the subsequent red phase (during which the outbound flow for this direction becomes zero, although vehicles may still enter the lane from the opposite side, so the inbound flow is not zero in the general sense).
The duration of such a switching cycle is also considered, which makes it possible to record and calculate cycles along with their inbound and outbound traffic flows per unit time (see Figure 3).
Since the introduced function P ( x , t ) is continuous, it is possible to transition from the probability P ( x , t ) to the probability density ρ ( x , t ) , which makes it possible to formulate and solve a boundary-value problem for describing a stochastic model of vehicle flow on an individual lane (direction of movement) with non-deterministic parameters of the statistical distribution law of their arrival times.
When formalizing the description of the stochastic dynamics of an individual node of the road network, the processes occurring within it (and in the network as a whole) can be considered as a set of random transitions between states determined by the random variables of inbound and outbound flows for an individual lane. Such a formalization makes it possible to derive a second-order differential equation (of the Kolmogorov type) that describes the stochastic dynamics of state changes. We shall formulate and solve a boundary-value problem (for describing the operation of a traffic lane), considering its percolation properties, i.e., the maximum admissible number of vehicles that can be accommodated by the lane without violating the operability of the system. When the number of vehicles on the lane reaches the maximum L admissible vehicles, i.e., x = L , the lane becomes blocked and cannot accept more vehicles. In this state, the lane ceases to operate entirely, and therefore the following condition must hold: ρ x , t | x = L = 0 .
The state x = 0 indicates that the lane is completely free. However, since the number of vehicles on the lane cannot be negative, we must impose a reflection condition at x = 0 : ρ x , t | x = 0 = 0 .
These boundary conditions can be considered model constraints in the sense that if we consider the probability density as a probability flux to a particular state, then they impose a constraint that near the right-hand boundary (when the limiting capacity of a transport network element L, e.g., a lane, is reached), the flow to this state must decrease (vehicles cannot physically enter it). In the vicinity of the left boundary (0 vehicles), the choice of the condition ρ x , t | x = 0 = 0 is somewhat artificial, but as additional substantiation, we can note that in reality zero vehicles are rarely observed in the lane and therefore the probability flow in this state can be set equal to zero (the probability density of detecting such a state is zero). At the same time, the choice of these boundary conditions does not impose restrictions on the physical model of traffic. After leaving a given direction vehicles can follow any of the permitted directions or change lanes following the route built for them. These conditions are necessary to solve the boundary-value problem and estimate the blocking time to rank the directions for traffic light control.
Since at the initial moment t = 0 there may already be a number x 0 of vehicles in the network, the initial state condition is set as follows:
ρ x , t = 0 = δ x x 0 d x = 1 , x = x 0 0 , x x 0
Since the initial state condition contains a delta function, the solution for ρ ( x , t ) is divided into two regions, for x > x 0 and for x x 0 . Using the methods of operational calculus, for the probability densities ρ 1 ( x , t ) and ρ 2 ( x , t ) describing the state of the lane at one of the values within the interval from 0 to L, the corresponding functions can be obtained:
For x x 0 :
ρ 1 x , t = 2 L e x x 0 ε ξ ε 2 + ξ 2 e ε ξ 2 t 2 ( ε 2 + ξ 2 ) τ n = 1 M sin π n x L sin π n L x 0 L cos ( π n ) e π 2 n 2 ε 2 + ξ 2 t 2 L 2 τ
For x > x 0 :
ρ 2 x , t = 2 L e x x 0 ε ξ ε 2 + ξ 2 e ε ξ 2 t 2 ( ε 2 + ξ 2 ) τ n = 1 M sin π n x 0 L sin π n L x L cos ( π n ) e π 2 n 2 ε 2 + ξ 2 t 2 L 2 τ
Next, if we compute the integral:
P ( L , t ) = 0 x 0 ρ 1 x , t d x + x 0 L ρ 2 x , t d x
Then the function P ( L , t ) will specify the probability that, by time t , the state of the traffic lane lies within the interval from 0 to L , i.e., that lane blockage does not occur.
Thus, the probability Q i ( L , t ) that lane blockage will occur by time t can be defined as follows:
Q L , t = 1 P ( L , t )
In our model, for each traffic lane, the value Q ( L , t ) can be represented by the calculated percolation threshold of the transport network, obtained from the analysis of its graph [16].
By calculating the number of nodes (traffic lanes) in our graph and the connections between them, it is possible to determine the density parameter of the studied road network. Conventionally considering the inbound directions at an intersection as “nodes”, one can, using the transport network graph, find for each such node the number of possible signal-controlled exits.
Based on this number, the percolation threshold value can then be obtained (i.e., the probability of blockage of a given inbound direction at the intersection at which its blockage affects the blockage of the entire transport network as a whole).
This probability can later be used as Q L , t in the stochastic dynamics model described above to determine the possible time t at which blockage of the considered direction may occur.
It should also be noted that, since the direction of movement of a vehicle located on a lane is, in the general sense, known only to the vehicle itself, for each traffic lane the parameters L and x 0 will coincide for all directions in which the given lane participates. However, for each direction, the values of the inbound ( λ ) and outbound ( μ ) flows may differ according to the switching of the green traffic signal (see Figure 3).
By calculating these flows, it is possible to determine the time to reach a specified probability of lane blockage (through the percolation threshold). This time estimate can be used both for selecting the control lane and for recalculating the phase-switching intervals of traffic signals.

3. Algorithm for Generating Control of Traffic Signal Phases

The algorithm for traffic signal control obtained using this approach has the following form (see Figure 4):
Step 1. Determine the state of the exit lanes (the lanes onto which vehicles proceed after the signal) and set a red signal for those lanes that are already in an overloaded state, i.e., those lanes where the number of vehicles has exceeded the percolation threshold for the given road network.
Step 2. Select a candidate lane.
  • Use the stochastic dynamics model to compute the times at which departure lanes are expected to overload. If such lanes are found, select the lane with the nearest predicted time to the overloaded/blocked state. Verify that an exit lane is available (not overloaded) for the selected departure lane and confirm that the exit lane has sufficient capacity for the waiting vehicles.
  • Among the directions where a green phase is admissible, find the lane that has not been opened for the longest time and select it as the candidate lane.
  • If, considering the lanes closed by red signals, no candidate can be found, then select a candidate disregarding the restriction imposed by the closed red signals.
Step 3. For the selected control lane, construct a dynamic signal phase: switch the selected lane to green; add green signals for directions that, according to traffic regulations, do not conflict with the selected direction; set red signals for all incompatible directions and for directions closed in Step 1. Transmit the resulting set of control signals to actuate the traffic signal switching.
Step 4. Determine the time interval for activating the traffic-signal phase. For the selected control direction (entry-exit), in the newly constructed phase (Step 3), calculate:
  • The time needed to clear the current queue from the lane,
  • The capacity of the exit lane, i.e., how much time is available before this lane becomes filled,
  • The maximum permissible duration of the green signal,
  • The minimum of these calculated values.
To avoid zero or single-unit durations, compare the obtained minimum with the allowed smallest green signal time. If the computed value is less than the allowed minimum (4 s in our simulation), set the phase duration equal to the established minimum.
The calculated duration of the green phase is supplemented with a threshold time for maneuver completion, corresponding to the yellow signal (6 s in our simulation), after which the system computes a new cycle phase.
The described algorithm has limitations. In particular, the intended direction of each individual vehicle is not read (although this is feasible in simulation tests, obtaining such data in practical cases is difficult).
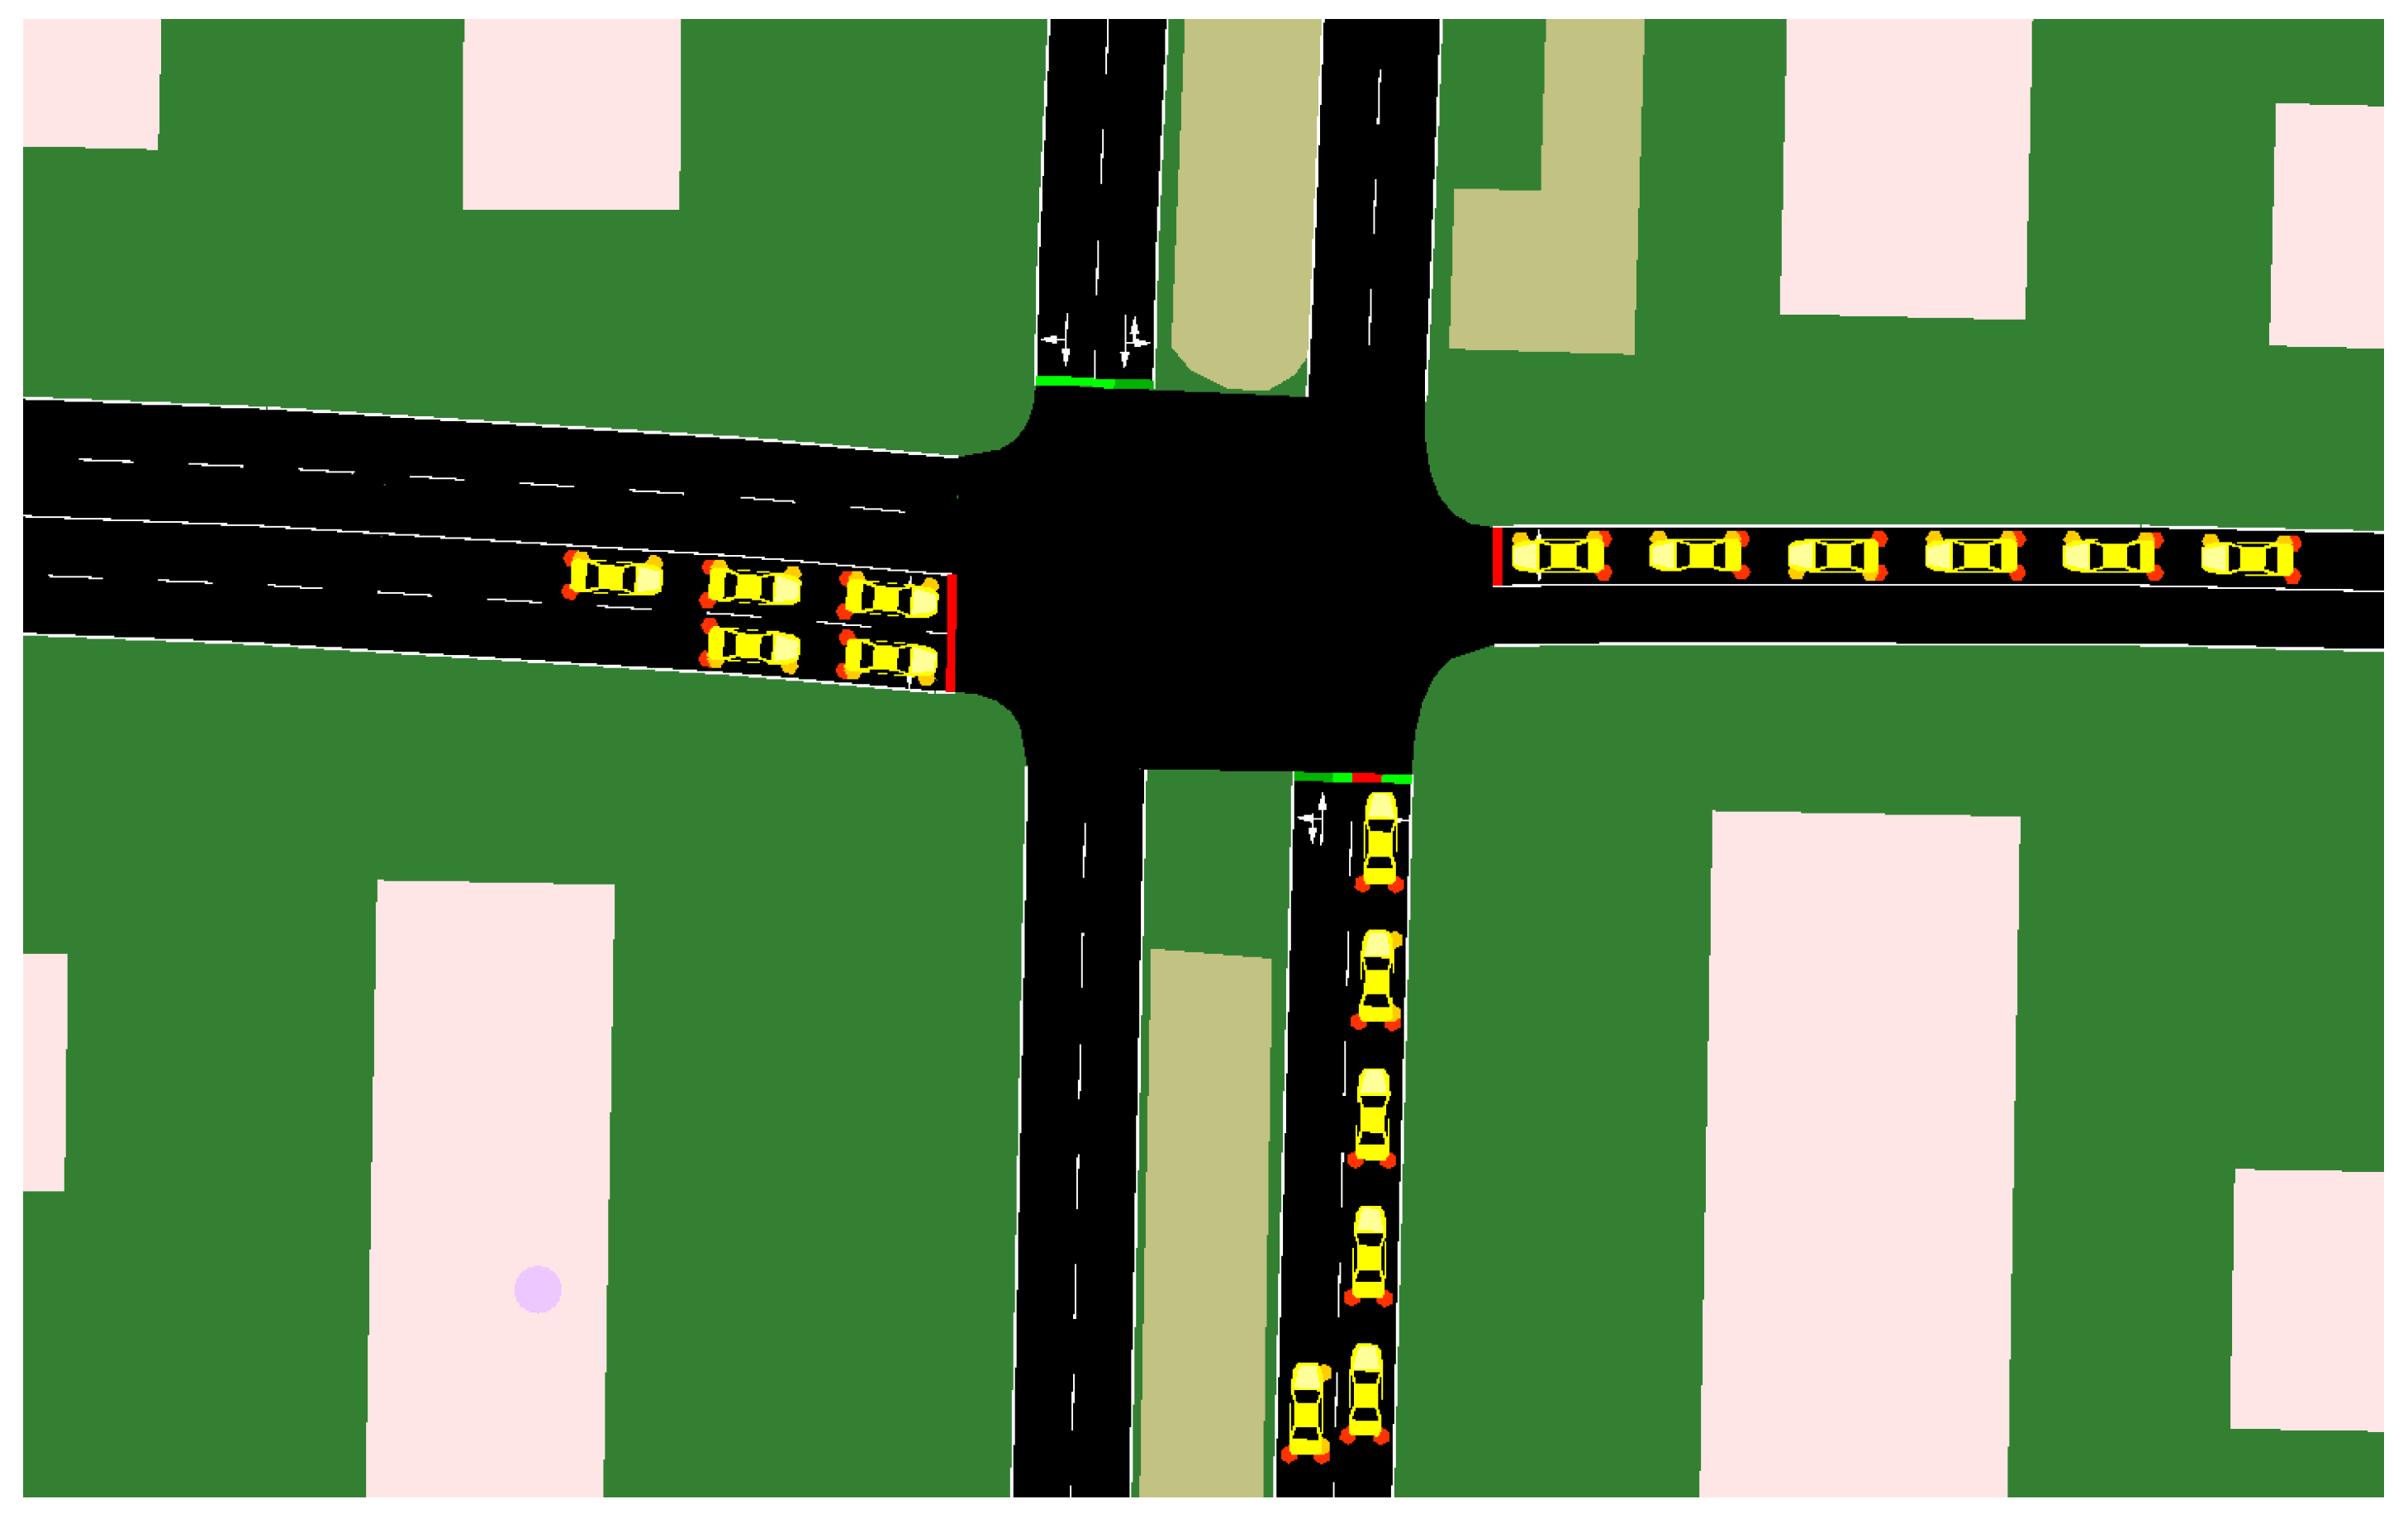
Consequently, if the permitted signals do not match the vehicle’s chosen direction of travel, the flow will not be discharged through the intersection. This situation is illustrated in Figure 5.
On the departure lane (see lane 2 in Figure 1), the lead vehicle intends to proceed straight through the intersection; however, the exit in that direction is blocked, and the algorithm, observing that this lane has the maximum waiting time, enables a right turn. Since the lead vehicle will wait for the permissive signal corresponding to its intended movement, the flow becomes blocked in this situation.
To account for limitations of this kind, the algorithm must additionally store the departure lane selected for control at the earlier step and, for the current step, verify whether the state of the selected lane has changed. If the state has not changed, then selecting the same departure–exit direction as in the earlier step is not permissible; instead, the next direction in the priority order must be chosen for the current cycle. The implementation of the presented algorithm can take this limitation into account.

4. Verification of the Developed Traffic Flow Model and Analysis of Simulation Results

For traffic flow simulation and verification of the developed model, the open-source software SUMO (Simulation of Urban Mobility) [3] was used. During the modeling process, the capability to import data from OpenStreetMap was also employed. To conduct the simulations and validate the model, portions of the road networks from New York (USA), Tokyo (Japan), Moscow (Russia), Berlin (Germany), and other cities were used, including interchanges, real road networks, and actual traffic lights.
The choice of cities was based on various rankings of transport network congestion. In general, the described simulations can also be performed using data from other cities worldwide.
For the selected fragments of the urban network, a list of routes can be generated from one random point to another random point within the given city area.
Based on this list of routes, traffic simulations were conducted using different models of traffic signal control. Boundary effects of the road network—such as the formation of dead-end exits or the inability to move through the network due to the absence of a turnaround or a lane in the opposite direction—can be eliminated by verifying the validity of the routes (i.e., ensuring that the destination point is reachable from the starting point).
To analyze the quality of traffic control using the developed percolation–stochastic model, it is necessary to compare the obtained results with those that can be achieved using existing control methods. At present, traffic signal control is mainly implemented based on a statistical model of signal phase cycles with predefined switching intervals (static control cycle).
For simulating traffic signal operation under a static cycle, cyclic switching of phases was applied with a standard cycle consisting of 24 s for the permissive (green) phase and 6 s for clearing the intersection (yellow phase), followed by switching to the next possible phase.
For simulating dynamic traffic signal control, the described algorithm for dynamic phase formation in traffic signal management was applied.
For the simulations, randomly generated routes were constructed (4000 routes per simulation). An example of the coverage of the selected simulation area, such as a section of Shanghai, is shown in Figure 6: on the left, a fragment of the city’s road network is depicted, and on the right, the same fragment is shown with the generated routes overlaid (colored lines).
In both dynamic and static simulations, identical sets of generated routes for individual vehicles within the urban network were used. In this way, we established for both control approaches conditions that are, if not identical, sufficiently close to identical, and thus comparable to each other.

4.1. Selection of Cities for Simulation

According to data from one of the mapping services (https://www.tomtom.com/traffic-index/, accessed on 5 May 2025), New York is among the cities with the most complex transport networks to manage. We considered a section of the city encompassing Manhattan Island (the origin of the term “Manhattan traffic”) and note that, both visually and structurally, the city’s road network resembles a square grid, a standard network structure studied in percolation theory.
Other cities selected for the simulations include Moscow, Tokyo, Berlin, Shanghai, and Mexico City—megacities that are consistently ranked among the most congested worldwide. Furthermore, these cities are of interest for modeling because they exhibit significantly different ratios of signalized to unsignalized intersections.
For illustration, Figure 7 presents examples of modeled map sections from the selected cities (New York and Tokyo). Maps of other cities selected for modeling have a similar appearance to those shown in the illustration. The general parameters of the urban areas selected for simulation are presented in Table 1.
The selected simulation area in New York is nearly twice as large as the areas in the other cities. This is because the simulation was conducted entirely within Manhattan Island.
The remaining parameters of the simulations are comparable, which implies the possibility of obtaining similar modeling results. The choice of the number of vehicles for the simulations was constrained by the available computational resources.
The number of vehicles introduced into each simulated urban area was chosen based on the following factors:
  • The initialization can be performed simultaneously across all simulated city areas.
  • A certain number of traffic jams are formed initially, but the roads (including unsignalized segments) are not completely blocked.
Practical runs of the model showed that, for the selected areas, a range of 8000–4000 vehicles provide a representative example, and 4000 vehicles per experiment were chosen as the minimally sufficient representative number to obtain comparable results.
An important parameter in the developed model is the percolation threshold for the considered road network. According to [30], the percolation threshold (denoted as N ) for a road network with arbitrary topology is related to its density ρ n e t (the average number of connections per node) and can be calculated using the following equation:
N = e 1.71 ρ n e t + 0.04
where ρ n e t is the network density (the number of connections per node).
We also considered the structural features of the selected urban networks. Figure 8 shows the distribution of the number of possible exit directions from a lane following a signalized intersection for the selected areas of New York (USA) and Tokyo (Japan). In other words, it presents the proportions (out of the total) of directions having 1 ,   2 ,   3 ,   4 ,   etc. exit options after the traffic signal, illustrating the connectivity of each departure direction. The distribution of the number of possible exit directions for Moscow (Russia), Berlin (Germany), Shanghai (China), and Mexico City (Mexico) is similar to that shown in Figure 8. The general analysis shows that the share of possible exit directions equal to 2–3 is predominant.
Table 2 presents the calculated values (using Equation (12)) of the percolation threshold for different numbers of outgoing connections of a selected direction. The data in Table 2 show that the greater the number of outgoing connections an inbound direction has, the higher the probability of its blockage must be for this blockage to affect the entire transport network.
The percolation threshold N , according to the proposed model, can be taken as the probability Q i ( L , t ) that lane blockage will occur by time t . This makes it possible, using Equation (11), to find the potential time to block the lanes (depending on the number of exits from each) and to use this as a metric for selecting the sequence and duration of traffic signal switching. In addition, the stochastic dynamics model considers the length of the queue of vehicles entering in the given direction.
The average network density can be calculated using transport network maps, after which the percolation threshold for the entire network can be determined (see Table 3). This calculated threshold can then be used as a parameter for defining the probability that lane blockage will occur over time.

4.2. Simulation Methodology

For performing the simulations and obtaining results, the Simulation of Urban Mobility (SUMO) environment [3] was used. The simulation environment handles executing vehicle movements, ensuring material balance, generating route lists, and modeling vehicle accelerations, stops, and maneuvers.
Vehicle presence control on a lane guarantees material balance in terms of the number of vehicles, starting from the vehicle’s entry onto the first lane (provided there is available space) and ending with the final lane of the route for a given vehicle.
The collection of primary metrics is conducted by the traffic simulation environment itself. However, the collection of additional metrics and parameters for analysis, as well as the control of traffic signal switching (for implementing carousel-based switching with static phase times and optimized control accounting for the stochastic dynamics and percolation properties of the road network), is performed by specialized software developed during this study. This software is integrated with the simulation environment through the available TraCI API interface.
Data exchange is performed at each simulation step, with the simulation interval set to one second. The tracked data include the number of vehicles on lanes controlled by traffic signals. The changes recorded at each simulation step make it possible to evaluate the magnitudes of inbound and outbound flows (see Figure 3).
Thus, a test scenario is formed that can be repeated under the same or similar conditions. The general simulation scenario takes the following form:
  • Choice of a city area and import of data from OpenStreetMap.
  • Construction of the urban environment for traffic simulation based on the imported data.
  • Random generation of route sets for the selected areas.
  • For each selected area (6 cities) and for each route set (2 sets), separate simulations are created (2 simulations):
    a.
    Simulation of static control of traffic signal phase switching.
    b.
    Calculation of the percolation threshold and simulation of dynamic control of traffic signal phase switching (see Table 3).
Two sets of routes were selected to obtain statistically more reliable results. Figure 9 presents, as an example, the density distribution plots of the number of routes with respect to their lengths for the selected simulation areas of two of the studied cities—New York and Tokyo. Each route length was rounded to the nearest 100 m interval.
The total number of routes within each interval was summed, and the result is shown in the plot. It should be noted that the routes for each set were generated randomly.
As the visual analysis shows (see Figure 9), route sets 1 and 2 used in the simulations show strong pairwise similarity, which makes the obtained results statistically dependable. The same result is observed for the route sets in Moscow, Mexico City, Berlin, and Shanghai.
When designing traffic-signal phases using cyclic control schemes, it is very important to take into account the duration of each individual phase as well as the overall traffic-signal cycle. The total number of signal phases in this context affects the maximum waiting time for a permissive signal indication (the number of signal phases is usually minimized), and there is also a trade-off: With a longer green interval we increase the total waiting time for all other vehicles and lengthen the overall cycle until the next green; on the other hand, we allow a larger number of vehicles to pass through the signalized intersection at once.
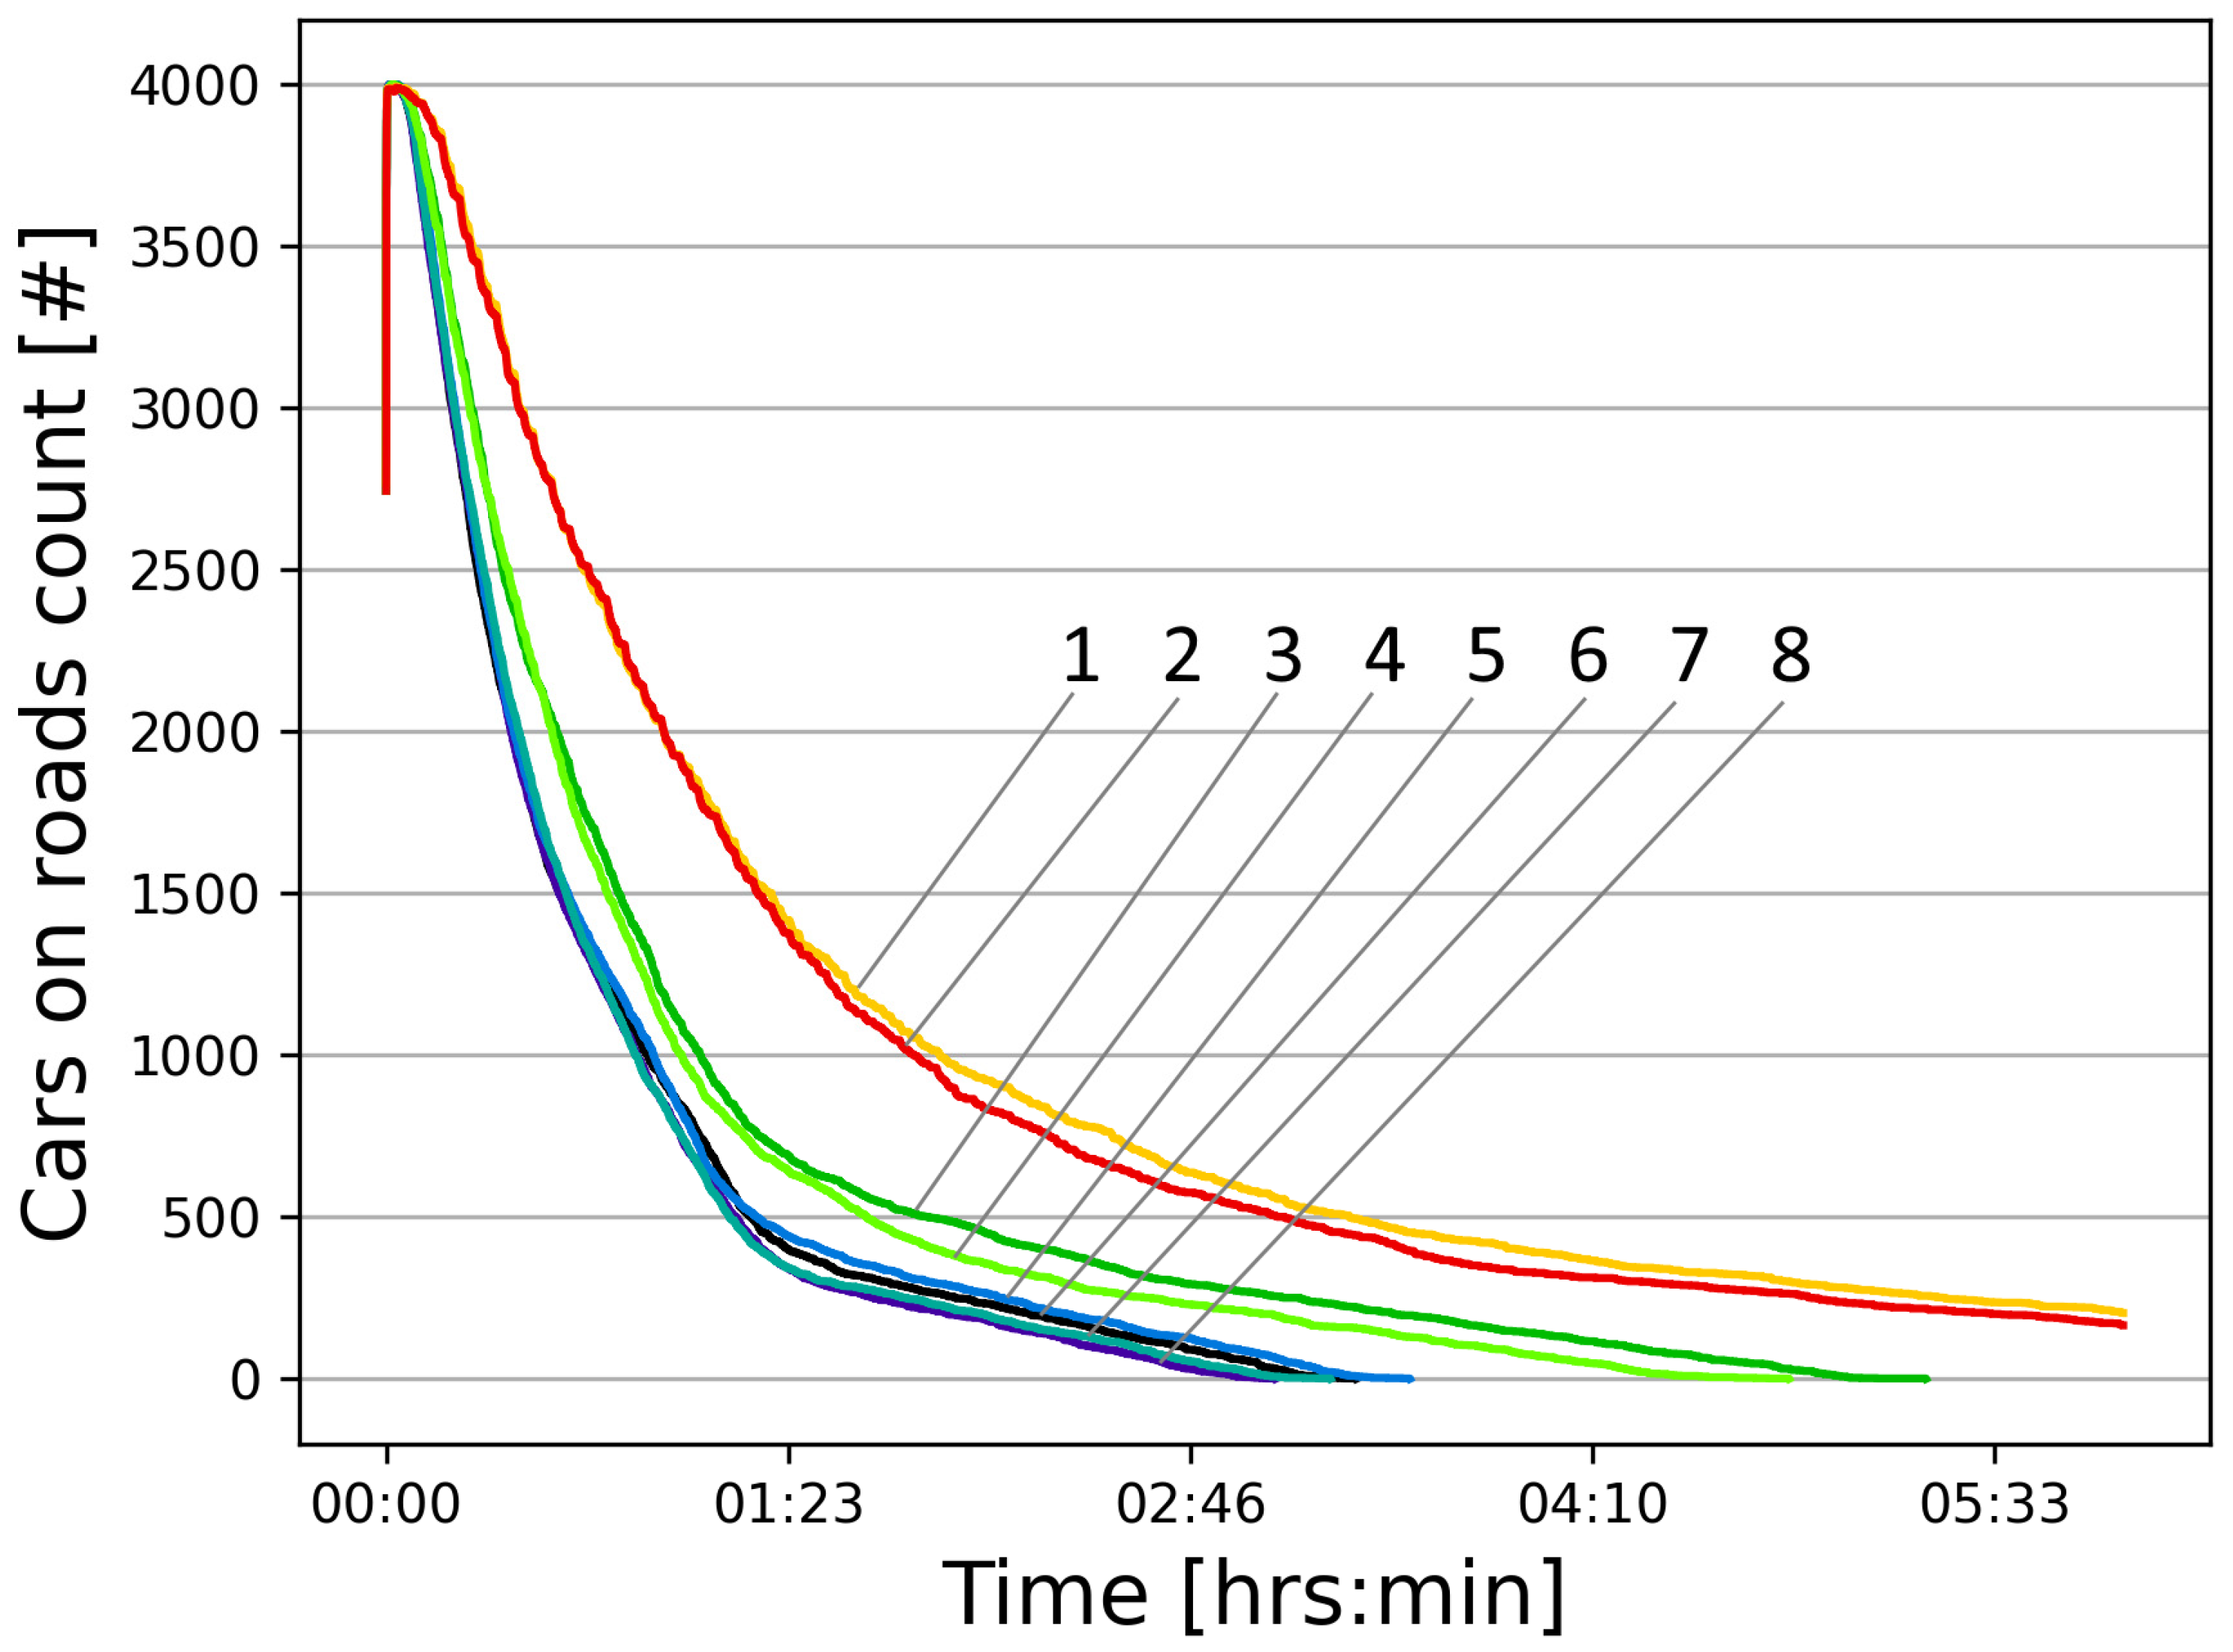
Figure 10 shows the simulation results of the influence of the green-phase duration in traffic-signal switching on the change in the number of vehicles present in the road network (that have not reached their destination). As an example, New York City was chosen, using in the simulation two previously described sets of routes:
  • Curve 1—NY-1-120 (route set No. 1, switching cycle 120 s);
  • Curve 2—NY-2-120 (route set No. 2, switching cycle 120 s);
  • Curve 3—NY-1-60 (route set No. 1, switching cycle 60 s);
  • Curve 4—NY-2-60 (route set No. 2, switching cycle 60 s);
  • Curve 5—NY-1-30 (route set No. 1, switching cycle 30 s);
  • Curve 6—NY-2-30 (route set No. 2, switching cycle 30 s);
  • Curve 7—NY-1-15 (route set No. 1, switching cycle 15 s);
  • Curve 8—NY-2-15 (route set No. 2, switching cycle 15 s).
From the data shown in the graphs, it can be seen that when the duration of the green phase of the traffic signal is increased to 60 s (lines NY-1-60 and NY-2-60) and further to 120 s (lines NY-1-120 and NY-2-120), the total arrival time of all vehicles at the terminal points of their routes increases (see Table 4).
On the other hand, using small values of the green signal phase of 15 s (lines NY-1-15 and NY-2-15) and 30 s (lines NY-1-30 and NY-2-30) yields comparable results, with the total arrival time of all 4000 vehicles ranging from 3 to 3.5 h.
The simulation results obtained indicate the need to minimize the green-phase duration of the traffic signal to 30 s or less, which allows a 30 s setting to be used as a baseline for further comparisons.
When describing the simulation methodology, it is also necessary to consider its critical computational aspects: the time to calculate the percolation threshold, real-time scalability for thousands of intersections, and the behavior of the system.
The time to calculate the percolation threshold is not particularly important for estimating the computational resource intensity, since the percolation threshold depends on the structural characteristics of the road network, which do not change in the main cycles of operation. These characteristics are calculated in advance and can be stored in the database. In this work, we used a generalized calculation for a percolation threshold, which requires calculating the average density of the road network (this is done once and can be stored in a database). This is not a particularly difficult computational task, although it depends on the number of elements of the road network: the number of road lanes and the number of connections between them.
The algorithm we propose depends on the observation data of a specific traffic lane/specific intersection, so it can be easily scaled to a separate set of systems that calculate values only for a specific road lane/specific intersection. In our simulations, the number of calculations performed is optimized (cached values are used; calculations are not performed every cycle but are performed on demand) and simulations on personal computers showed acceptable performance for our conditions and limitations. For example, for 4000 cars in a part of the city with 2000 traffic lights, the calculation cycle of switching traffic lights took less than 1 s (not all traffic lights in the city switch at the same time), and one cycle of city traffic simulation with all stages and the collection of data and metrics took approximately 2–5 s of real time.

4.3. Simulation Results and Their Analysis

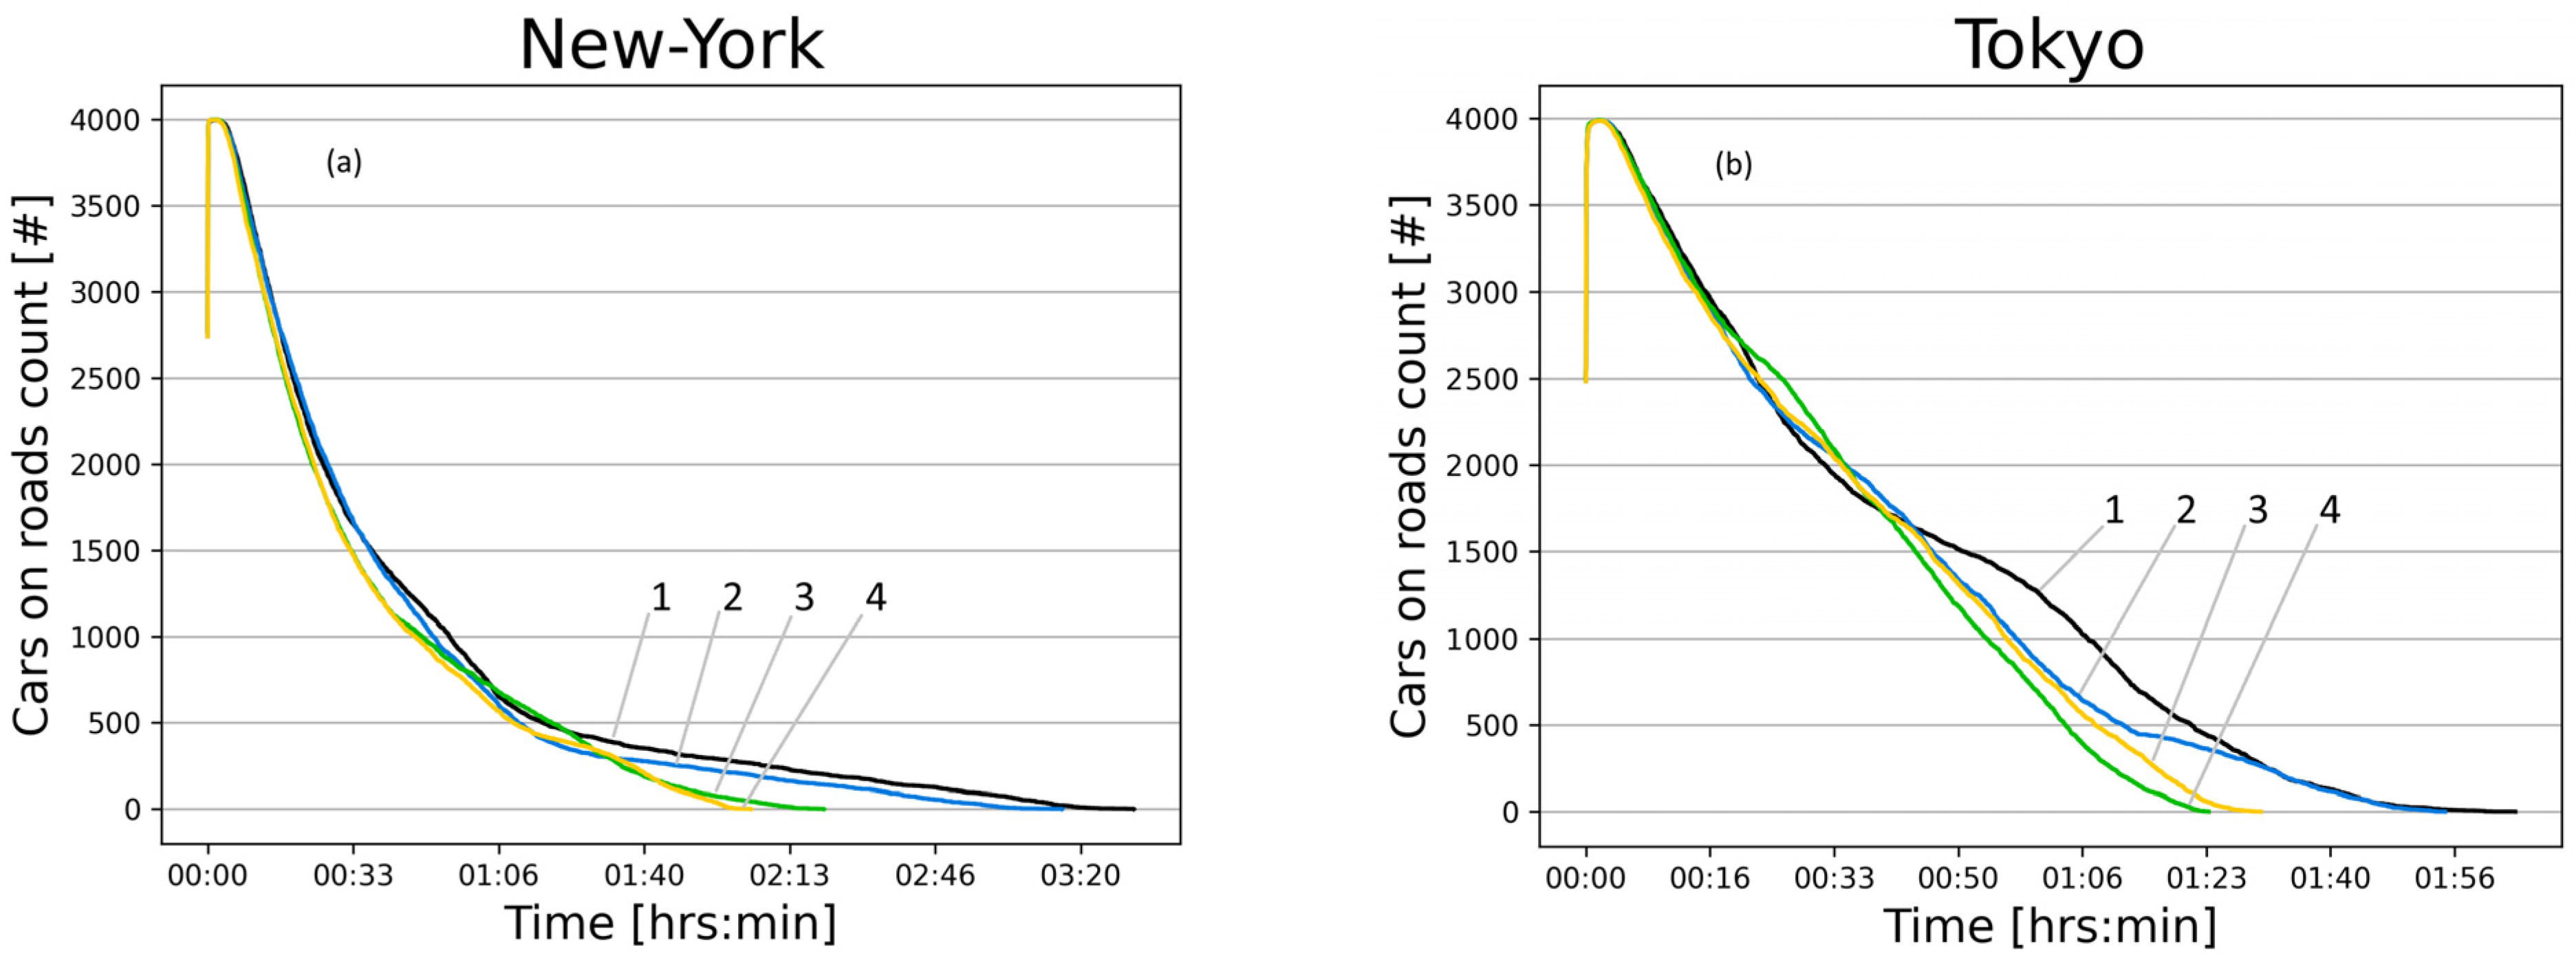
First, let us consider the obtained simulation results in terms of the number of vehicles simultaneously present in the road network. At the beginning of the experiment, all vehicles are placed into the network, where they begin to move in accordance with traffic regulations and signal control (see Figure 11: a peak in the number of vehicles in the network is observed at the start of the simulation cycle, on the left side). As vehicles complete their routes, they exit the road network, which leads to a gradual decrease in the total number of vehicles in the network over time as transport units finish their movement.
The simulation is carried out either until all vehicles complete their movement or until the remaining vehicles come to a complete stop for a 10 min interval (which covers a sufficiently large number of traffic signal cycles, a situation that never occurs under real conditions).
Curves 1 in Figure 11a (New York example) and Figure 11b (Tokyo example) correspond to route set No. 1 under static traffic signal control with a 24 s switching cycle; curves 2 correspond to route set No. 2 under static traffic signal control with a 24 s switching cycle; curves 3 correspond to route set No. 1 under the proposed dynamic model; curves 4 correspond to route set No. 2 under the proposed dynamic model.
Up to approximately the 16th minute of numerical simulation, the behavior of the models is nearly identical for all the transport networks considered (see Figure 11). This is associated with the initial dispersion of vehicles along the main urban routes: network congestion during this period is nearly at its peak, and the subsequent decline reflects the completion of shorter routes where possible.
After the 16th minute, the model behaviors diverge depending on whether dynamic or static traffic signal control is applied. According to the data illustrated in Figure 11, a noticeable improvement in throughput is observed for the proposed dynamic model compared to the static cyclic model. At the same time, there is strong pairwise consistency between curves 1–2 and 3–4 for route sets No. 1 and No. 2.
Similar simulations were also conducted for route sets No. 1 and No. 2 in Moscow, Mexico City, Berlin, and Shanghai.
As a performance metric for traffic control quality, an integral indicator can be used—the total number of vehicles present on the roads throughout the entire simulation (calculated as the area under the curves in Figure 11a,b). The larger the area, the greater the number of vehicles that remained on the roads until completing their routes.
The ratio of the difference between the mean value for the dynamic model and the mean value for the static cyclic model to the mean value of the dynamic model, expressed as a percentage, was calculated as an integral estimate for New York, Tokyo, Moscow, Mexico City, Berlin, and Shanghai. These results are presented in Table 5 (relative number of vehicles on the roads over the entire simulation period, in percent).
For New York and Mexico City, the improvement in this indicator for the dynamic model compared to the static cyclic model amounts to 13.40% and 17.79%, respectively. Tokyo and Shanghai show improvements of 9.75% and 8.81%, respectively. The lowest results, approximately 2.41–2.75%, are observed for Berlin and Moscow.
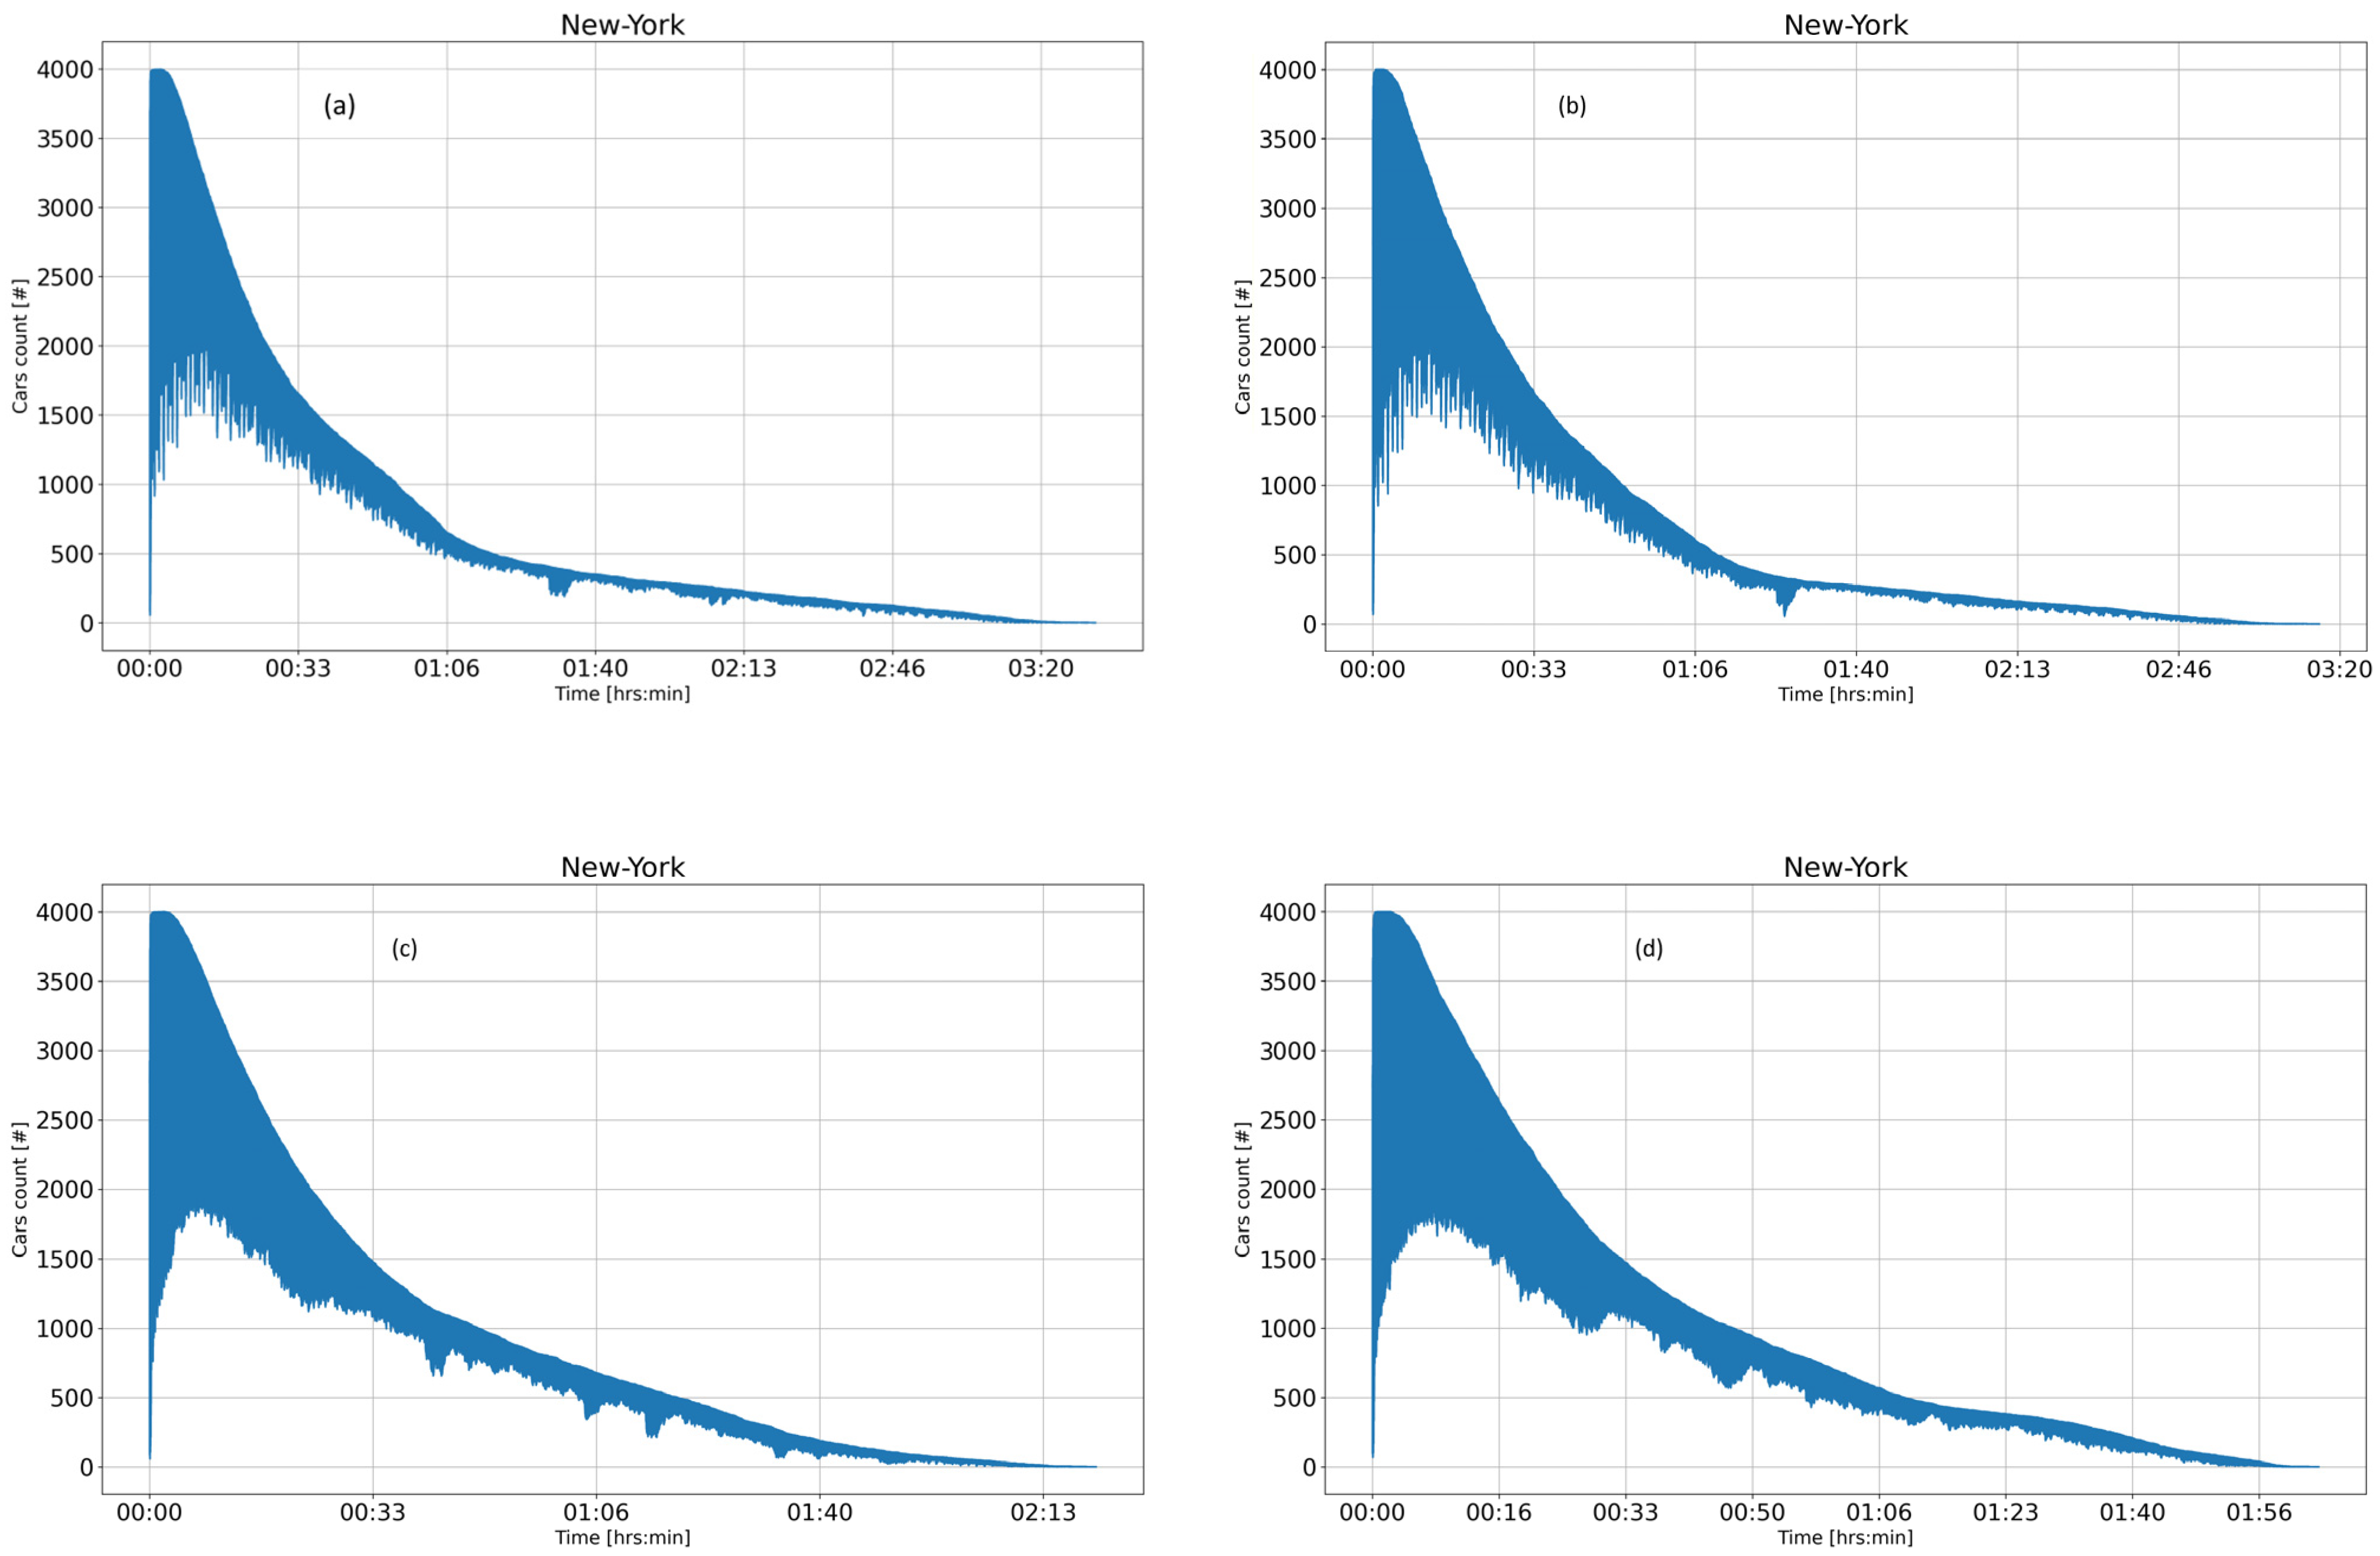
To approximate optimal control, one can impose the condition that at each moment the maximum possible number of vehicles should be moving without idle time. As an example, Figure 12 presents the graphs of vehicle movement/idle dynamics for route sets 1 and 2 under static cyclic and dynamic signal control for New York. The graphs for Tokyo, Moscow, Mexico City, Berlin, and Shanghai show a similar pattern.
  • Figure 12a shows the simulation results for static cyclic traffic signal switching with route set No. 1.
  • Figure 12b shows the simulation results for static cyclic traffic signal switching with route set No. 2.
  • Figure 12c shows the simulation results for dynamic traffic signal switching with route set No. 1.
  • Figure 12d shows the simulation results for dynamic traffic signal switching with route set No. 2.
The shaded areas in the graphs show the difference between the number of vehicles in the road network at a given simulation step and the number of idling vehicles. Table 6 presents, in percentage terms, for New York, Tokyo, Moscow, Mexico City, Berlin, and Shanghai, the change in the ratio of the difference between the mean value of this indicator for the dynamic model and the mean value for the static model to the mean value for the dynamic model (i.e., the relative difference—between dynamic and static traffic signal switching cycles—between the number of vehicles in the network at a given simulation step and the number of idling vehicles).
For New York, this indicator shows an improvement of 11.17% when using the proposed percolation–stochastic model compared to the static cyclic switching model, while for the other cities the improvement ranges from 2.65% to 5.48%.
Another indicator of traffic management quality is the formation of a “jam” (congestion), defined as a state of a traffic lane in which all available space is occupied, and a vehicle cannot physically occupy a space on that lane, even in violation of traffic rules. The presence of free space or “reserve” can be important for several reasons: it allows the possibility of yielding to emergency vehicles (ambulances, road inspection vehicles, and other special-purpose transport), and it also prevents overloading of the lane that follows the current one.
Within the framework of the conducted study, for each simulation step it is possible to calculate the number of lanes that are fully occupied by vehicles. These may include truly short lanes connecting individual directions as well as full road segments. Such lanes can be either signal-controlled or not; however, technical lanes that connect entry–exit directions at intersections are not included in the statistics.
  • Figure 13 presents the graphs showing the statistics of fully occupied traffic lanes during the simulation for route sets 1 and 2 under static (cyclic) and dynamic traffic signal control, using New York as an example. The graphs for Tokyo, Moscow, Mexico City, Berlin, and Shanghai show a similar pattern.
  • Figure 13a shows the simulation results for static cyclic traffic signal switching with route set No. 1.
  • Figure 13b shows the simulation results for static cyclic traffic signal switching with route set No. 2.
  • Figure 13c shows the simulation results for dynamic traffic signal switching with route set No. 1.
  • Figure 13d shows the simulation results for dynamic traffic signal switching with route set No. 2.
Figure 13. Dynamics of congestion formation for New York City: (a) dynamic control and first routes set; (b) dynamic control and second routes set; (c) static control and first routes set; (d) static control and second routes set.
Informatics 12 00122 g013aInformatics 12 00122 g013b
The relative difference (between dynamic and static traffic signal switching cycles) in the integral “congestion” indicator, expressed as a percentage, is presented in Table 7. The data for New York, Tokyo, Moscow, Mexico City, Berlin, and Shanghai show that the described algorithm prevents the percolation threshold from being exceeded on individual traffic lanes. Thus, when comparing the integral indicators (see Table 7), the obtained result is consistent and expected.
Table 7 presents the change in the integral «congestion» indicator for New York, Tokyo, Moscow, Mexico City, Berlin, and Shanghai when using the dynamic control model compared to the static traffic signal control cycle. With dynamic traffic signal control, this indicator shows an improvement ranging from 19.02% to 51.07% (with an average value of 28.94%).
The answer to the question about the impact of an increase in the number of routes during numerical simulation on control quality metrics is of interest. The answer to this question is not so unambiguous. Numerical simulations show that an increase in the number of routes leads to a decrease in the average speed. In particular, for the value of 4000 routes used in most of the experiments, the average speed, taking into account their total length and the length of roads of the cities selected for the simulation, was: Tokyo—8.82 km/h; Berlin—12.89 km/h; Moscow—21.25 km/h; Shanghai—25.58 km/h; Mexico City—25.82 km/h; New York City is 16.13 km/h, and for 40,000 routes, the average speed in New York is 1.33 km/h. According to regulations and standards such as the Highway Capacity Manual (HBS2015) [31,32], the average speed indicator affects the quality of service (LOS) and when the average speed decreases, the level of service decreases (LOS F, breakdown). Speeds below 5.0 km/h are considered congestion.
Use of 40,000 routes in the simulation leads to the fact that immediately, starting from the first second, the entire transport network is in a state of congestion or collapse. It can be assumed that in such conditions the dynamic model of transport management cannot work, since there is no possibility of balancing flows, since almost all directions are already overloaded and the share of directions that have not reached this state is not very large, which reduces the ability to rank directions by the time of reaching the block. An increase in the number of cars entering the roads at the same time leads to the maximum occupancy of the road network and a decrease in the average speed to a state where the entire network is already in a state of congestion. The model of static cycles for switching traffic lights can show better results in controlling flows, because in this case the process is carried out according to the principle “first in line, he passes”.
Interpreting the presented model as a system that redefines the resources of the road and transport network in accordance with the priorities set by the percolation threshold and the number of cars waiting to leave at the traffic lights, we note that in a situation of complete blocking of the road network or a state of “dead traffic jam”, the system does not have a free resource for redistribution. In this state, traditional static control works more reliably, which can be confirmed by simulations.
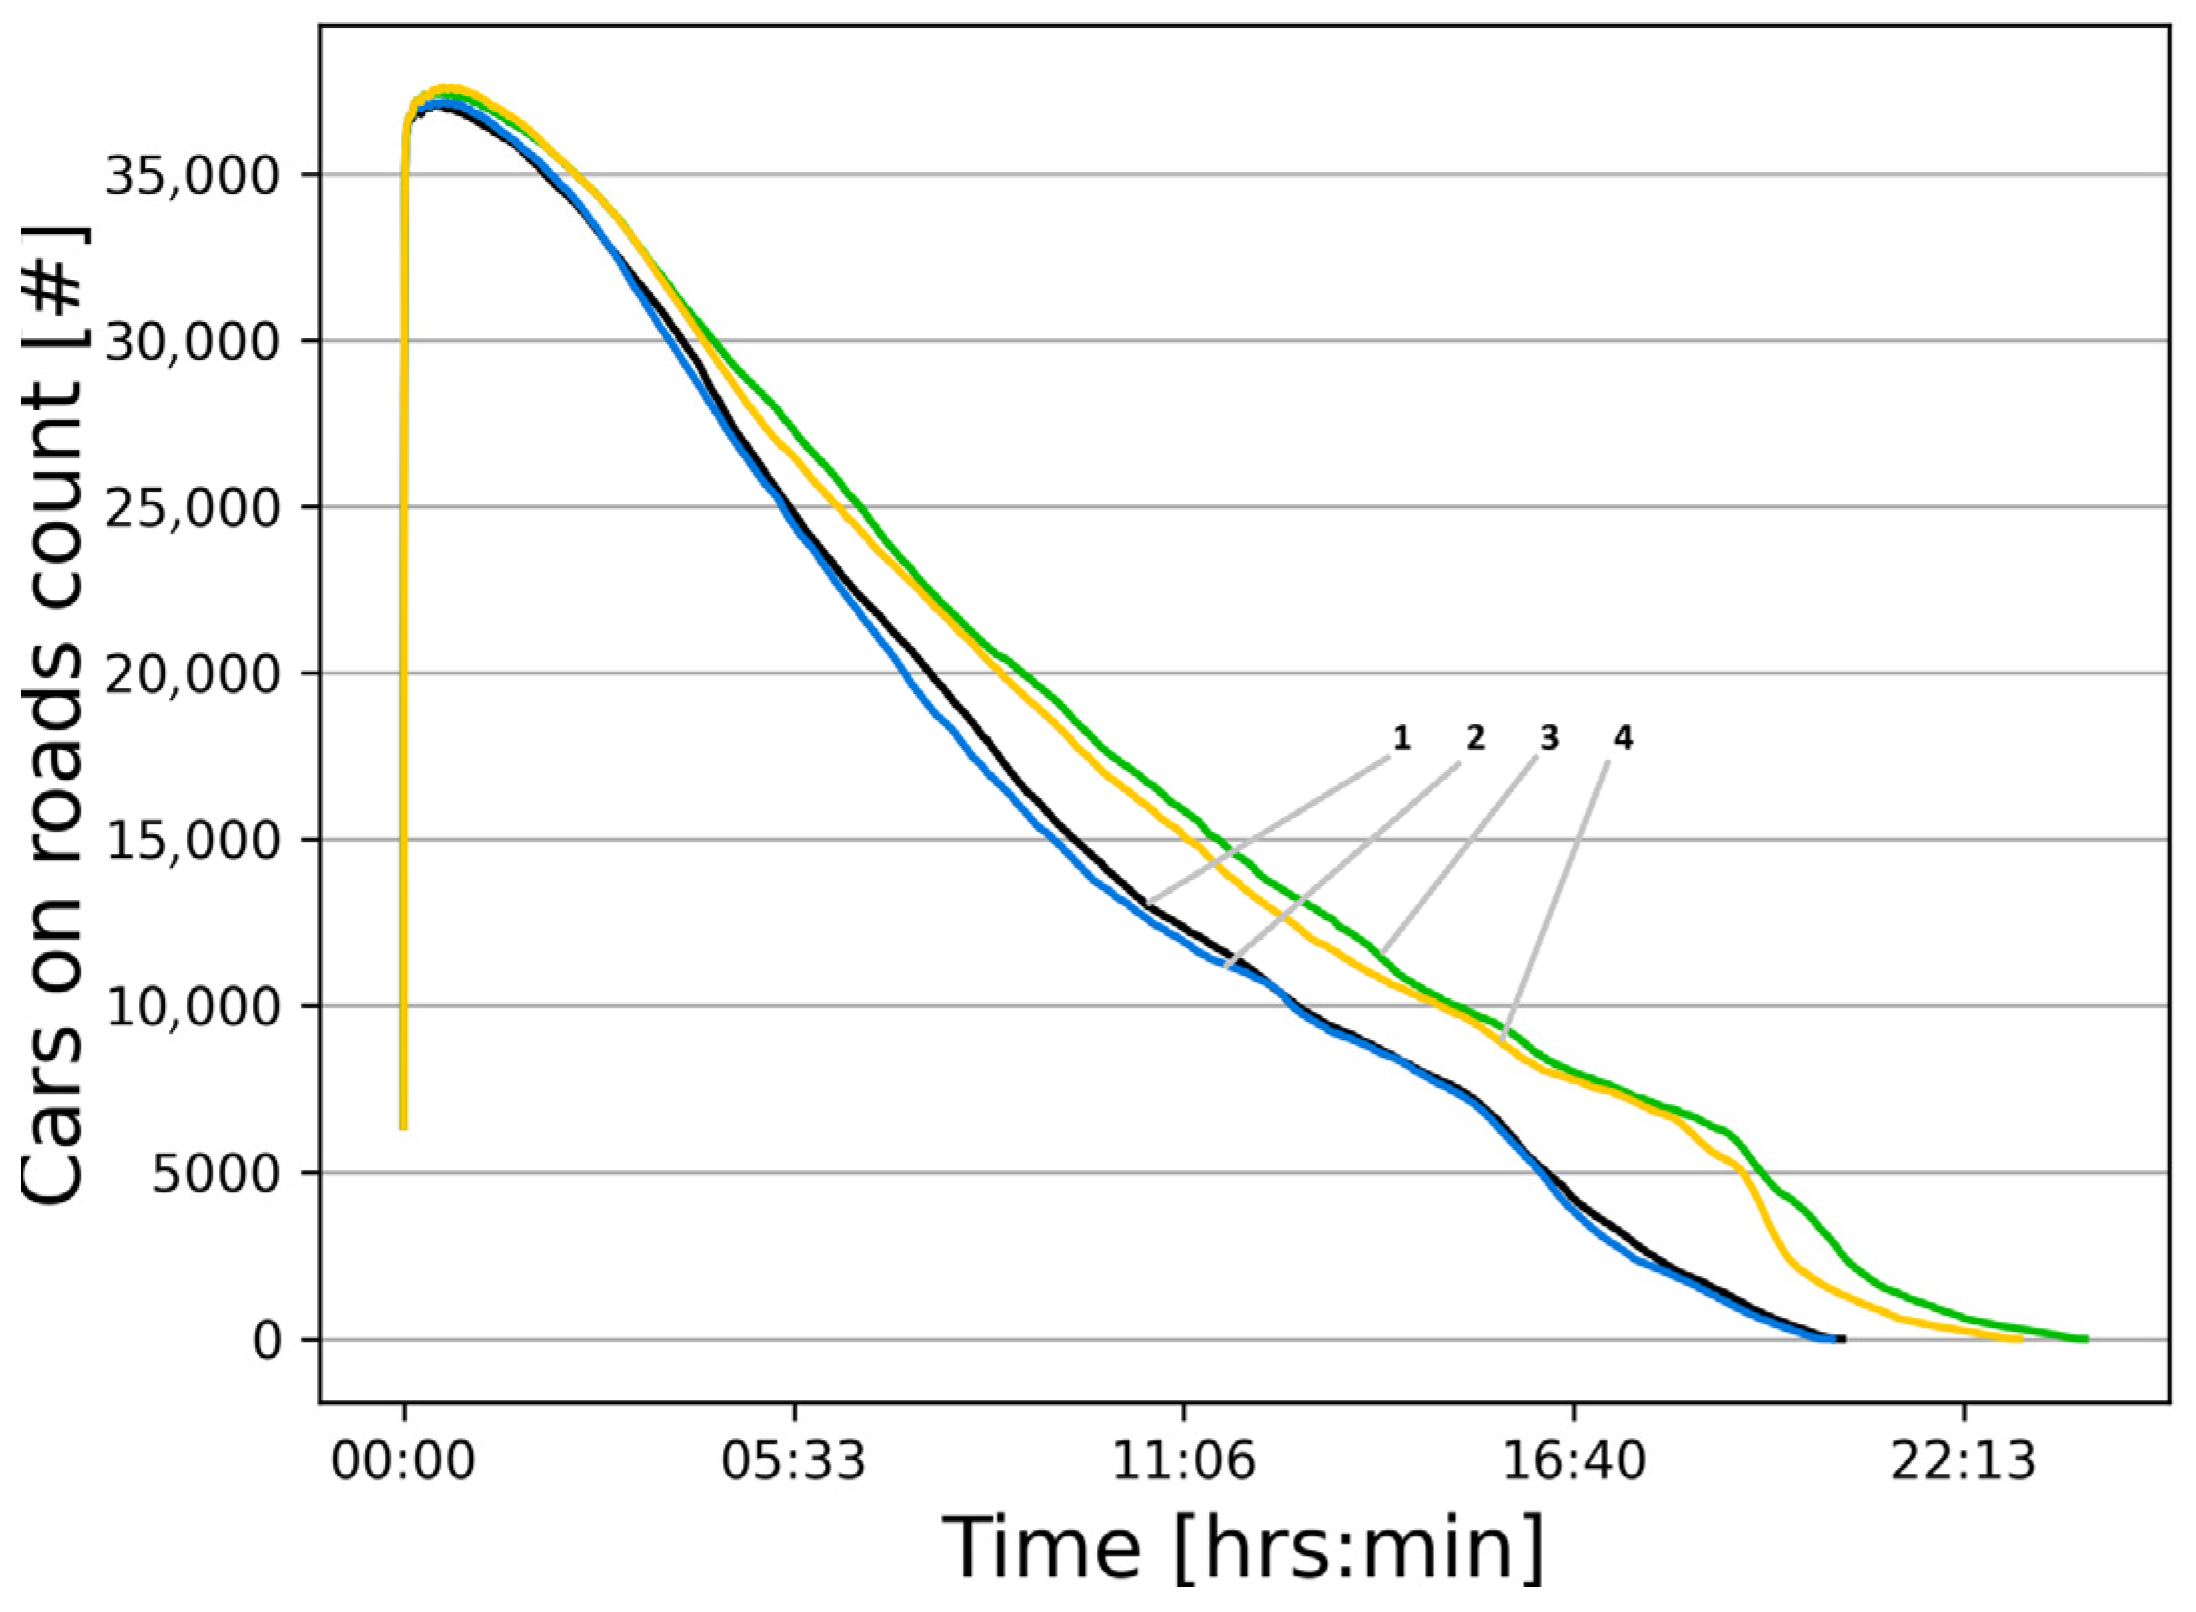
Numerical simulations have shown (see Figure 14) that if the entire network is in a state of congestion (the average speed for New York is 1.33 km/h), then the dynamic model (curves 3 (route set No 1) and 4 (route set 2) in Figure 14) show results inferior to the control model with static cycles (curve 1 (route set No 1) and 2 (route set 2) in Figure 14). The deterioration of management quality indicators is: according to the metric “Relative number of vehicles on the roads over the entire simulation period” minus 16.79%; according to the metric “Relative difference between the number of vehicles in the road network at a given simulation step and the number of idling vehicles” minus 0.20%; according to the metric “Relative difference in the integral ‘congestion’ indicator” minus 4.33%, which shows the lack of resources for the redistribution of flows.

4.4. Determination of Near-Optimal Values of Traffic Light Density and Unsignalized Intersections in the Transport Network

A critical aspect of traffic management is understanding the influence of transport network parameters—such as the density of traffic lights per kilometer and the density of unsignalized intersections—on the considered integral indicators. These differential parameters and integral indicators for the selected urban areas of New York, Tokyo, Moscow, Mexico City, Berlin, and Shanghai are presented in Table 8.
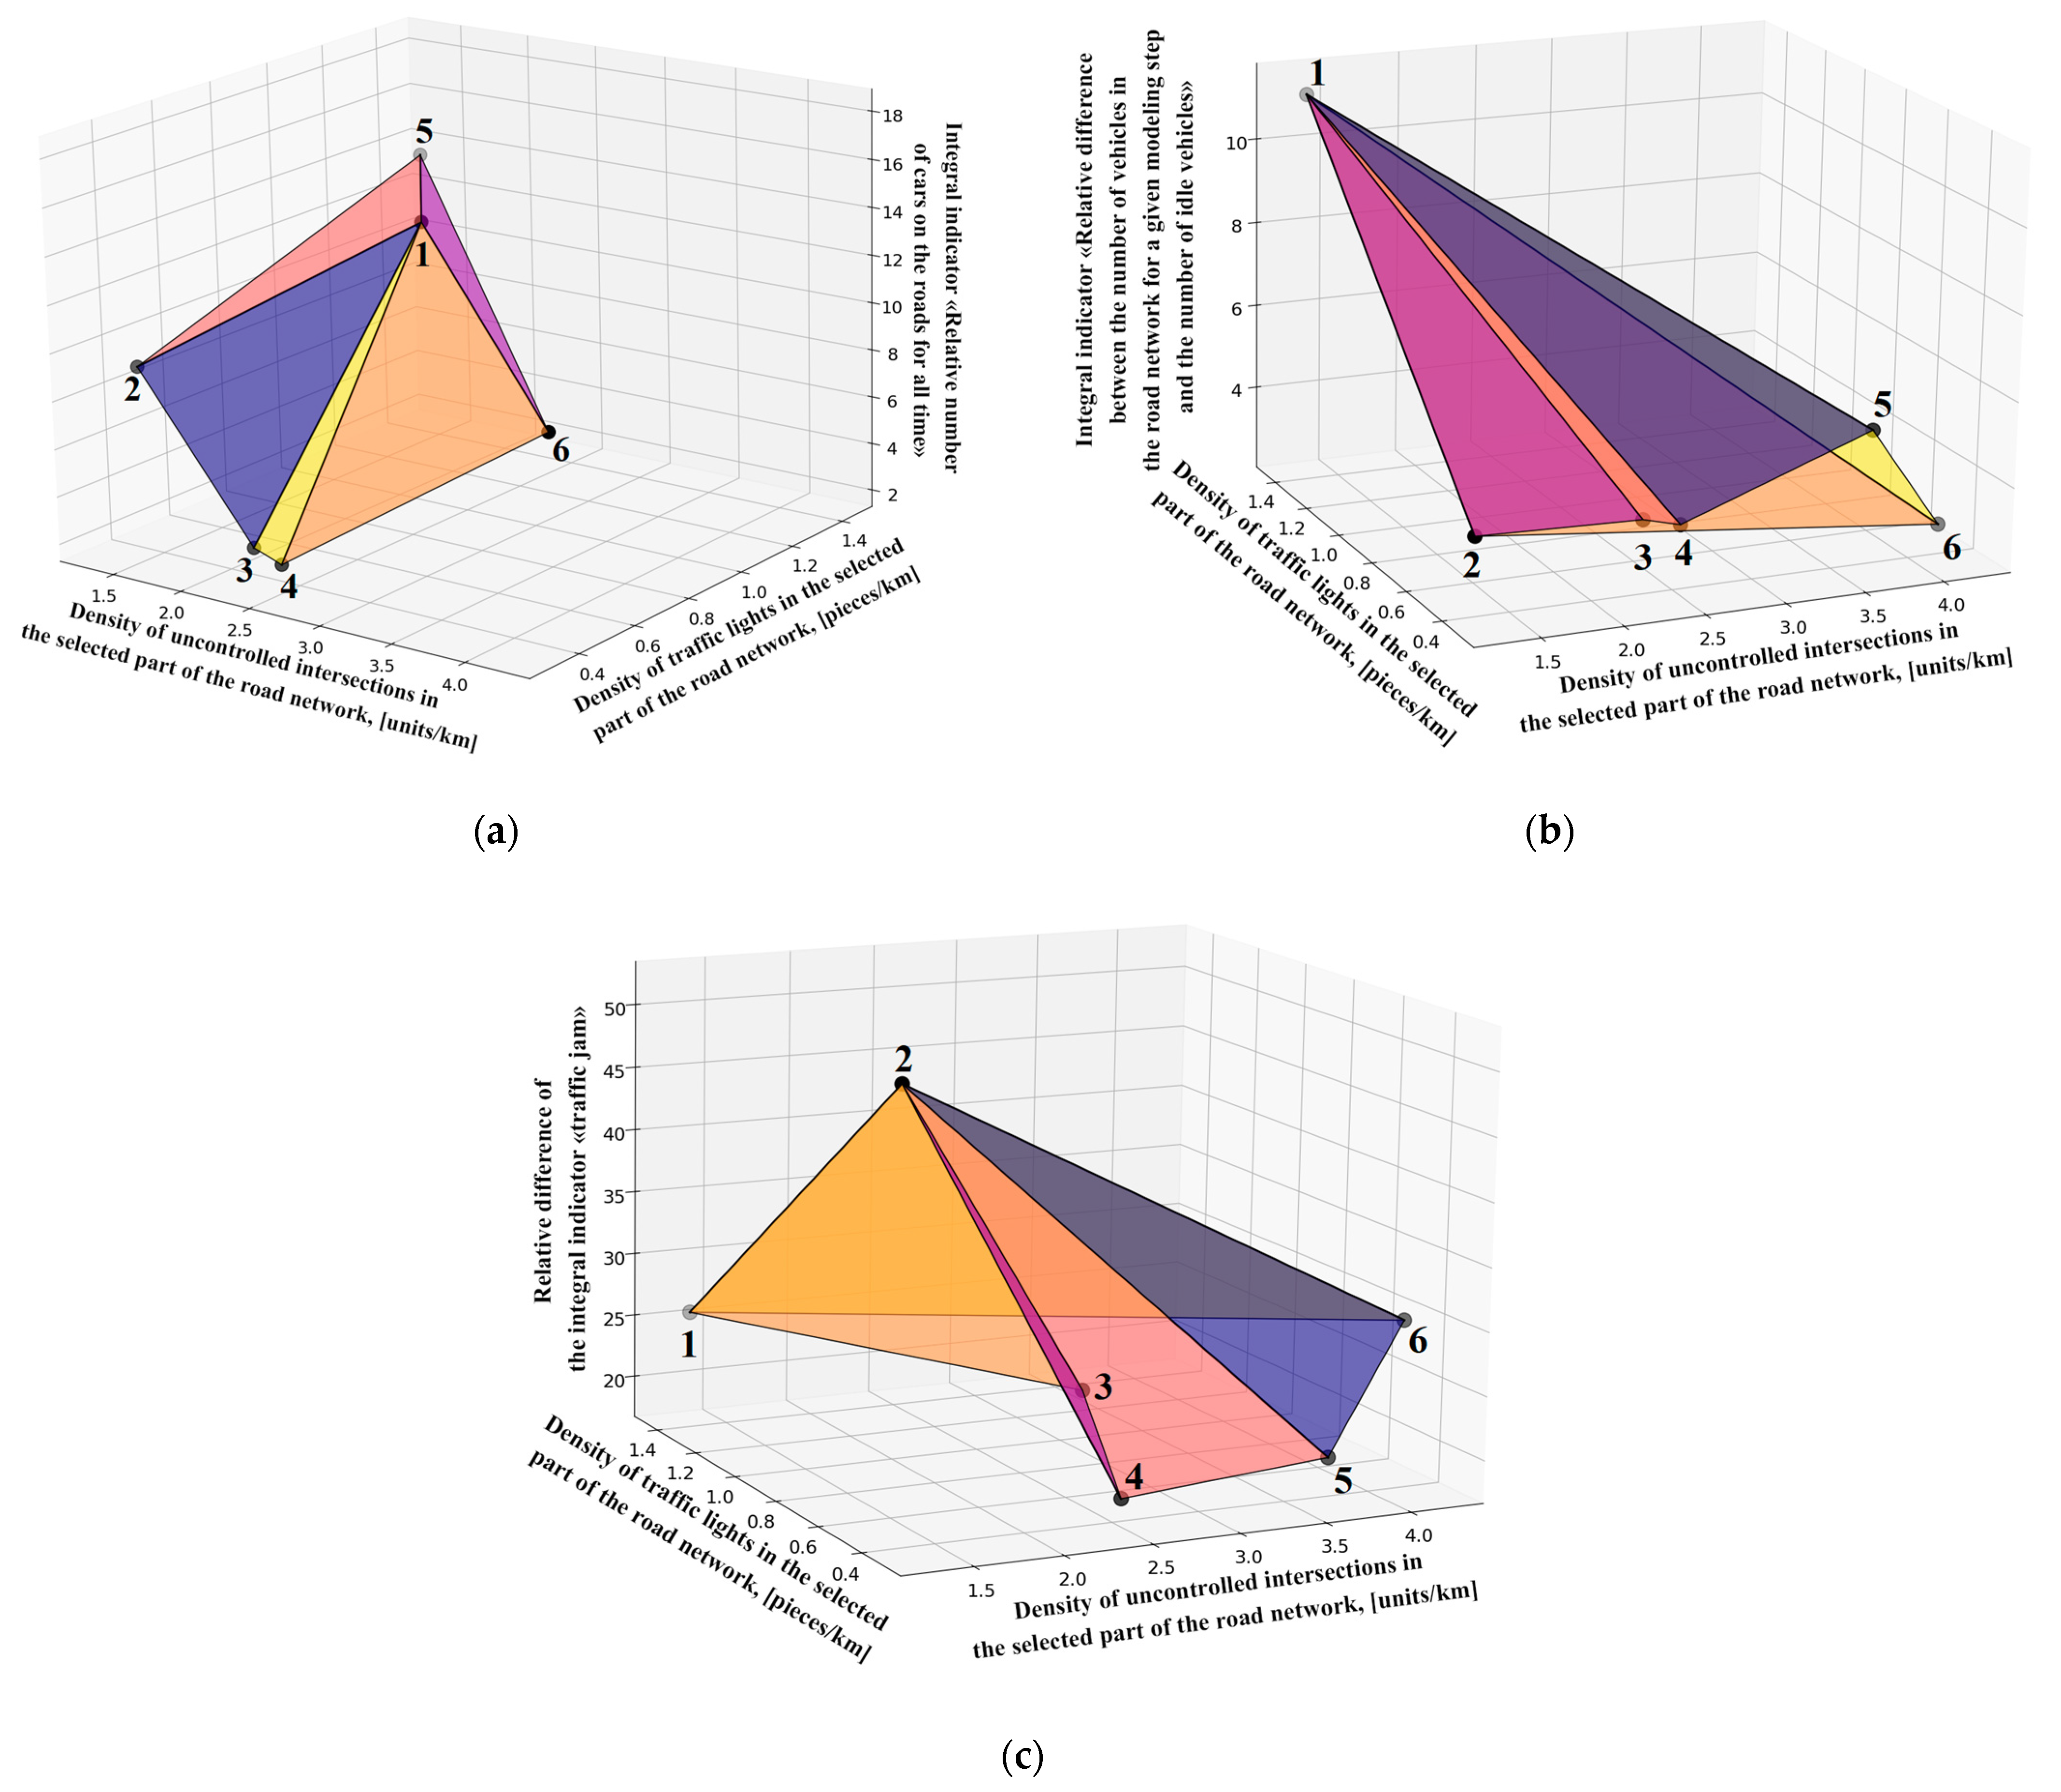
Further, Figure 15a–c present 3D plots of the dependencies of the integral indicators of traffic flow management quality on the density of unsignalized intersections [units/km] and the density of traffic lights in the selected part of the road network [units/km] (see data in Table 8).
In Figure 15a–c, the density of traffic lights per kilometer of the transport network is plotted along the X-axis, and the density of unsignalized intersections along the Y-axis. The third dimension (Z-axis) is:
  • In Figure 15a, the integral indicator of the relative number of vehicles on the roads over the entire simulation period (see Table 8),
  • In Figure 15b, the integral indicator of the relative difference between the total number of vehicles in the road network and the number of idling vehicles,
  • In Figure 15c, the integral “congestion” indicator.
The point numbers in Figure 15a–c correspond to the dataset numbers for the cities listed in Table 8.
Although the limited number of data points does not allow for the construction of relatively smooth surfaces for each of the integral indicators and the precise identification of their maximum and minimum, it is nevertheless possible to build approximate piecewise-linear surfaces composed of five triangles. This can be achieved using the following method:
  • Connect the nearest points with straight lines to form a perimeter enclosing the domain of the integral indicator.
  • Select the point with the maximum value of the integral indicator (the vertex), treating it as the maximum within its domain.
  • Connect the corner points of the perimeter with the selected maximum point.
The behavior of the dependencies of the integral indicators on traffic light density and the density of unsignalized intersections (see Table 8 and Figure 15a–c) suggests that these relationships are ambiguous and nonlinear in nature.
To obtain smoother surfaces and to find maxima and minima, it is necessary to calculate a larger number of data points and perform more simulations. However, this is associated with challenges of data accumulation and processing, as well as the computational cost of the tasks. All these factors prevent the current study from providing precise characteristics, but they nevertheless make it possible to evaluate the influence of transport network parameters—namely, traffic light density per kilometer and the density of unsignalized intersections—on the considered integral indicators.
It should be noted that the development of a traffic network management system involves significant financial costs for equipment. Therefore, it is necessary to assess at which values of traffic light density and unsignalized intersection density per kilometer of the transport network it is possible to achieve management characteristics that are close to optimal, while minimizing expenses. For this purpose, the data presented in Table 8 and Figure 15a–c can be used.
Considering that each of the integral indicators of traffic network management may be no less important than the others, the following data processing of Table 8 was conducted:
  • For each column of integral indicators in Table 8, the maximum value of the indicator was taken as unity, and normalization was performed (so that each indicator ranges from 0 to 1).
  • Next, the union (geometric summation with a weight of 1/3) of all three surfaces shown in Figure 15a–c was calculated. The result of this geometric union is presented in Figure 16.
Along the X-axis in Figure 16, the traffic light density is plotted (X-coordinates taken from Table 8); along the Y-axis, the density of unsignalized intersections is plotted (Y-coordinates taken from Table 8); and along the Z-axis, the value is shown that can be interpreted as the overall quality function (defined as the weighted sum, with a weight of 1/3, of the normalized integral indicators Z = Z 1 + Z 2 + Z 3 3 .):
Z 1 —relative number of vehicles on the roads.
Z 2 —relative difference between the total number of vehicles in the road network and the number of idling vehicles.
Z 3 —“congestion” indicator.
The summation is conducted at points with identical X and Y coordinates, which belong to the corresponding triangles on each of the piecewise-linear surfaces. All the piecewise-linear surfaces shown in Figure 15a–c share the same projection (an irregular hexagon) onto the XOY plane. This is because, for different Z values, a coordinate grid with a certain step in X and Y can be superimposed on this projection, and at each point of the grid the height up to the intersection with the triangles of any of the three piecewise-linear surfaces (shown in Figure 15a–c) can be determined. Each of these heights corresponds to the values Z 1 , Z 2 , and Z 3 .
To find the values of Z 1 , Z 2 , and Z 3 , individual triangles in Figure 15a–c can be considered. Knowing the coordinates of the triangle vertices, one can apply methods of analytical geometry to construct the equations of the corresponding planes. Then, using the X and Y coordinates of the points lying inside the triangles together with the plane equations, it is possible to obtain the normalized values of Z 1 , Z 2 and Z 3 . Finally, the overall quality function can be calculated as Z = Z 1 + Z 2 + Z 3 3 .
The surface in Figure 16 can be approximated by triangles, for each of which the equation of its corresponding plane can be constructed. Figure 16a–d show that, as a result of the geometric union of the planar triangles presented in Figure 15a–c, a complex surface is obtained, containing a region of high values with a nearby saddle point located at the junction of triangles (vertices 1–2–a) and (vertices 1–a–b) in Figure 16a. Figure 16a–d present views of this surface from different angles. The point numbers in Figure 16 correspond to the same X and Y coordinates as the points in Figure 15a–c.
The equation of the plane containing triangle (vertices 1–2–a) in Figure 16a is: 0.047 x + 0.157 y 1.150 z + 0.576 = 0 , and the equation of the plane containing triangle (vertices 1–a–b) is: 0.077 x 0.173 y + 0.964 z 0.373 = 0 .
The equation of the line (vertices 1–2) in canonical form is ( x 1.31 ) / 0.02 = ( y 0.42 ) / 1.02 = ( z 0.6115 ) / 0.1398 , and the equation of the line (vertices 1–b) is ( x 1.33 ) / 2.058 = ( 1.44 y ) / 1.015 = ( 0.7514 z ) / 0.0171 , where:
  • X —density of unsignalized intersections in the selected road network section [units/km].
  • Y —density of traffic lights in the selected road network section [units/km].
  • Z —numerical value of the overall quality function.
The value of the overall quality function depends in a complex manner on the density of unsignalized intersections ( X -coordinate) and traffic lights ( Y -coordinate).
It decreases sharply in the region where Y 0.4 . The X and Y coordinates of the points along the line in the XOY plane where Z = 0 define the minimum density of traffic lights and unsignalized intersections at which the percolation–stochastic model and the static traffic signal cycle model yield identical results.
On one side of this line (where the overall quality function is positive), the use of the percolation–stochastic model improves traffic network management.
On the other side of the line (where the quality function is negative), the use of the percolation–stochastic model degrades traffic network management (a state of over-regulation arises).
The obtained result makes it possible to estimate the acceptable density of traffic lights and unsignalized intersections from the perspective of traffic management. Using these results, one can select a minimally costly solution for upgrading the existing traffic light system. For example, values of traffic light density and unsignalized intersection density close to the existing ones can be chosen by applying the equations of the planes on which triangles (vertices 1–2–a) and (vertices 1–a–b) lie, or the equations of the lines (vertices 1–2) and (vertices 1–b). A minimal modernization effort can then be undertaken to bring the system in line with these parameters.
To evaluate the accuracy of identifying values of traffic light density and unsignalized intersection density per kilometer of the transport network that are close to optimal using the obtained results, simulation modeling was carried out for sections A (high intersection density) and B (significantly lower intersection density) of the road network in Shanghai, as well as for the cities of San Francisco (USA) and Toronto (Canada). The characteristics of the selected sections are presented in Table 9.
In the coordinate space X , Y , and Z , the simulation result for section A of the transport network has the coordinates ( 1.47 ;   0.88 ;   0.64 ) , with Z A = 0.64 . In Figure 16a–d, this is point A , and its projection onto the X O Y plane falls inside the perimeter of the projection of the complex surface onto this plane ( A ). The point of intersection of the vertical line passing through point A with the surface in Figure 16a–d has a Z -coordinate equal to 0.68 . This gives a relative error estimate of 5.88 % .
Point B (see Figure 16a–d) has the coordinates ( 1.13 ;   0.26 ;   0.12 ) , and its projection (point B ) falls outside the perimeter of the surface projection onto the X O Y plane, which makes it impossible to determine the intersection point of the vertical line through point B with the surface in Figure 16a–d, and therefore the relative error cannot be evaluated for this experiment.
Point C (San Francisco) (see Figure 16a–d) has the coordinates ( 2.57 ;   0.73 ;   0.58 ) , with Z C = 0.58 , and its projection onto the X O Y plane falls inside the perimeter of the surface projection onto this plane (point C ). The point of intersection of the vertical line through point C with the surface in Figure 16a–d has a Z -coordinate equal to 0.72 . This gives a relative error estimate of 19.44 % .
Point D (Toronto) (see Figure 16a–d) has the coordinates ( 2.71 ;   0.44 ;   0.77 ), with Z D = 0.77 , and its projection onto the X O Y plane falls inside the perimeter of the surface projection onto this plane (point D ). The point of intersection of the vertical line through point D with the surface in Figure 16a–d has a Z -coordinate equal to 0.69 . This gives a relative error estimate of 10.40 % .
Thus, the average relative error for points A , C , and D is about 11.90 % .

5. Conclusions

The obtained results demonstrate the feasibility of constructing a system for dynamic traffic management using the percolation–stochastic model. Based on the methods and approaches of percolation theory, the density of the road network can be calculated using its graph, and the threshold (probability) of lane blockage can be determined. Furthermore, by applying the stochastic dynamics model of lane occupancy and its blockage probability, it is possible to calculate the times of lane blockage in the directions of intersection passage and, based on collected vehicle flow data, to generate a program for controlling traffic signal phases.
Using the SUMO simulation system, traffic flow modeling was carried out for two route sets and two control strategies—traffic signal switching based on statically predefined phases and traffic signal switching with dynamically calculated phases using the developed percolation–dynamic traffic balancing model—on fragments of road networks in cities such as New York (USA), Moscow (Russia), Tokyo (Japan), Berlin (Germany), Shanghai (China), and Mexico City (Mexico).
The collection of primary metrics was carried out by the traffic simulation environment; however, additional metrics and parameters for analysis were also collected, and traffic signal control was implemented (to perform switching according to the carousel algorithm with static phase durations, as well as for optimized control taking into account the stochastic dynamics and percolation properties of the road network) using specialized software integrated with the simulation environment through the available TraCI API interface. This software was developed during the present research.
The simulation results show that with dynamic traffic signal control, the integral indicator “Relative difference (between dynamic and static traffic signal switching cycles) in percentage between the number of vehicles in the road network at a given simulation step and the number of idling vehicles” improves by 2.65–11.17% (see Table 6).
The value of the indicator “Relative percentage of vehicles on the roads over the entire period” (see Table 5) is less significant for describing the quality of traffic management than the congestion indicator, but even in this case an improvement of 2.41–17.79% is observed. This is because in traffic simulations not all route segments pass through signal-controlled intersections and traffic jams block vehicle movement for the remaining part of the network. Nevertheless, for this indicator as well, dynamic control in most cases proves to be substantially more effective than the static model of traffic signal phase switching.
It should be noted that the main improvement in traffic management is demonstrated by the integral “congestion” indicator (assessment of the occupancy of individual lanes in traffic simulation), which shows an improvement of 19.02–51.07% (see Table 7), without deterioration of other traffic parameters, due to the implementation of dynamic calculation mechanisms for traffic signal phase durations.
Table 8 presents a summary of the characteristics of the selected simulation areas in the considered cities and the improvement of the integral indicators of traffic quality achieved by the proposed percolation–stochastic model of traffic signal switching time adjustment compared to the static cycle of their operation.
The traffic dynamics characteristics obtained through simulation make it possible to construct a general traffic management quality function. Its value depends in a complex way on the density of unsignalized intersections ( X -coordinate) and traffic lights ( Y -coordinate). In particular, the quality function decreases sharply in the region where Y 0.4 (density of unsignalized intersections). The X and Y coordinates of the points, and the line in the XOY plane where Z = 0 , define the minimum density of traffic lights and unsignalized intersections at which the percolation–stochastic model and the static traffic signal cycle model produce identical results. On one side of this line (where the quality function is positive), the use of the percolation–stochastic model will improve traffic network management, while on the other side (where the quality function is negative), the use of the percolation–stochastic model will degrade traffic network management (a state of over-regulation arises).
The obtained results (see Table 8) show that the proposed traffic signal phase switching model demonstrates an advantage in all cases compared to the static switching cycle and can be recommended for practical applications.
We also performed an assessment of the acceptable density of traffic lights and unsignalized intersections from the perspective of transport network management. Using the results presented, it is possible to select the best solution (in terms of minimizing the cost of upgrading the existing traffic light system). The average relative error in finding such an optimal value of traffic light and unsignalized intersection density per kilometer of the transport network was approximately 12.0%.
The challenges of traffic management are compounded by the need to model control within the framework of the existing traffic light system, which has an established topology. To achieve greater optimization in management, it is necessary to change the existing topology of traffic light placement, which can be done effectively using the obtained results. For example, values of traffic light density and unsignalized intersection density close to the existing ones can be chosen, and by applying the equation describing the dependence of the overall quality function surface on traffic light and unsignalized intersection density, minimal changes to the traffic light network can be made to bring the indicators to the required values. Subsequently, the duration of traffic control signals can be regulated based on the proposed percolation–stochastic model. Using the proposed simulation methodology, it becomes possible to evaluate the effect of traffic management optimization.

6. Directions for Further Research

The research conducted has certain limitations that indicate directions for further investigation:
  • The approach proposed in this article will be compared with other models and systems, including adaptive control systems, such as SCATS and SCOOT.
  • Model studies will be conducted when the number of vehicles (possible routes) is increased to 50,000 using static switching cycles of 90, 120 and more seconds. To analyze the performance of our model, we used the SUMO simulation tool with a static 24 s cycle as a benchmark for comparison. The results obtained from this comparison can be used to compare different models with each other, i.e., to use it as a standard measure for each model. However, this represents a certain limitation of the results obtained, as does the number of routes used in modeling (4000). In addition, to collect more comprehensive statistics, it is planned to conduct experiments with larger routes sets.
  • A detailed study of the model’s accuracy through indirect measurements will be conducted based on the method of constructing the surface of the overall quality function (described in Section 4.4). To construct this surface, it is planned to use, among other things, the data obtained when increasing the number of vehicles to 50,000 and the duration of static cycles of switching traffic lights.
  • The proposed modeling technique will be studied using the Fokker-Planck Equation (13) and fractional differential Equation (14):
ρ ( x , t ) t = x μ x · ρ x , t + 1 2 2 x 2 D x · ρ x , t
where D(x) is the x-dependent coefficient that determines the random change in state (“diffusion”) x, and μ(x) is the x-dependent coefficient that determines the purposeful change in state x (“drift”).
β ρ ( x , t ) t β = D α ρ ( x , t ) x α
where α and β are indices of the fractional derivative (according to Caputo) and are positive real numbers, and D is a constant coefficient.

Author Contributions

Conceptualization and methodology D.Z.; software A.A.; validation V.Z.; formal analysis A.A. and D.Z.; data curation A.A.; writing—original draft preparation V.Z.; visualization A.A. All authors have read and agreed to the published version of the manuscript.

Funding

This research received no external funding.

Data Availability Statement

Data are contained within the article.

Conflicts of Interest

The authors declare no conflicts of interest.

References

  1. Paulus, R.; Agrawal, A. Intelligent traffic light design and control in smart cities: A survey on techniques and methodologies. Int. J. Veh. Inf. Commun. Syst. 2020, 5, 436. [Google Scholar] [CrossRef]
  2. Nurmukhanbetov, S.N.; Nurmagambetov, G.B. The Efficiency of Smart Traffic Light in the “Smart City” Concept Based on Neural Networks for Object and Image Recognition. Sci. Aspect 2023, 20, 2549–2560. [Google Scholar]
  3. Alvarez Lopez, P.; Behrisch, M.; Bieker-Walz, L.; Erdmann, J.; Flötteröd, Y.-P.; Hilbrich, R.; Lücken, L.; Rummel, J.; Wagner, P.; Wießner, E. Microscopic Traffic Simulation using SUMO. In Proceedings of the 2018 21st International Conference on Intelligent Transportation Systems (ITSC), Maui, HI, USA, 4–7 November 2018. [Google Scholar] [CrossRef]
  4. Ziemke, D.; Kaddoura, I.; Nagel, K. The MATSim Open Berlin Scenario: A multimodal agent-based transport simulation scenario based on synthetic demand modeling and open data. Procedia Comput. Sci. 2019, 151, 870–877. [Google Scholar] [CrossRef]
  5. Großmann, T.; Schrab, K.; Protzmann, R.; Radusch, I. Modeling Bus Traffic for the Berlin SUMO Traffic Scenario. SUMO Conf. Proc. 2025, 6, 101–115. [Google Scholar] [CrossRef]
  6. Pradhananga, R.; Williams, S.; Aygun, S.; Chen, L.; Tu, Y.; Crow, W.; Aakur, S.; Tzeng, N.F. Digital Twin-Aided Municipal Traffic Control. SUMO Conf. Proc. 2025, 6, 149–161. [Google Scholar] [CrossRef]
  7. Ostendorf, N.; Garlichs, K.; Wolf, L. HaTS-Hanover Traffic Scenario for SUMO. SUMO Conf. Proc. 2025, 6, 117–132. [Google Scholar] [CrossRef]
  8. Kwon, Y.; Jung, J.-H.; Eom, Y.-H. Global efficiency and network structure of urban traffic flows: A percolation-based empirical analysis. Chaos Interdiscip. J. Nonlinear Sci. 2023, 33, 113104. [Google Scholar] [CrossRef]
  9. Hamedmoghadam, H.; Zheng, N.; Li, D.; Vu, H. Percolation-based dynamic perimeter control for mitigating congestion propagation in urban road networks. Transp. Res. Part C Emerg. Technol. 2022, 145, 103922. [Google Scholar] [CrossRef]
  10. Konstantinov, S.; Kazaryan, D.; Diveev, A.; Sofronova, E.; Daryina, A.; Seliverstov, Y.; Baskin, L. Utilizing multi-source real data for traffic flow optimization in CTraf. Comput. Res. Model. 2024, 16, 147–159. [Google Scholar] [CrossRef]
  11. Soori, S. Optimization techniques in traffic management. Int. J. Multidiscip. Res. 2025, 7, 1–11. [Google Scholar] [CrossRef]
  12. Prasan, U.; Vital, T.; Khyati, B.; Deepika, K.; Nitya, C.; Harshavardhan, P.; Himanthkumar, C. Deep Learning Approaches to Intelligent Traffic Signal Systems. GRENZE Int. J. Eng. Technol. 2025, 11, 1182–13788. [Google Scholar]
  13. Kumar, G.A. AI Traffic Monitoring. Int. J. Sci. Res. Eng. Manag. 2025, 9, 1–19. [Google Scholar] [CrossRef]
  14. Chen, Y.; Lu, J. Research on traffic state prediction method based on traffic flow prediction under multi-time granularity. Sci. Rep. 2025, 15, 24317. [Google Scholar] [CrossRef] [PubMed]
  15. Abduljabbar, R.; Dia, H.; Liyanage, S. Machine Learning Traffic Flow Prediction Models for Smart and Sustainable Traffic Management. Infrastructures 2025, 10, 155. [Google Scholar] [CrossRef]
  16. Sun, W.; Cui, H.; Zhu, M. Traffic Congestion Analysis and Probability Estimation Based on Stochastic Characteristics of Traffic Arrival. Promet Traffic Transp. 2025, 37, 585–597. [Google Scholar] [CrossRef]
  17. Shokrolah Shirazi, M.; Chang, H.-F. Evaluation of traffic signals for daily traffic pattern. J. Smart Cities Soc. 2025, 4, 137–151. [Google Scholar] [CrossRef]
  18. He, Y.; Xia, J. Comprehensive Evaluation on Traffic Safety of Mixed Traffic Flow in a Freeway Merging Area Based on a Cloud Model: From the Perspective of Traffic Conflict. Symmetry 2025, 17, 855. [Google Scholar] [CrossRef]
  19. Alyoshkin, A. The Influence of Transport Link Density on Conductivity If Junctions and/or Links Are Blocked. Mathematics 2021, 9, 1278. [Google Scholar] [CrossRef]
  20. Alyoshkin, A.; Zhukov, D. Percolation in Road Networks. In Proceedings of the 2022 4th International Conference on Control Systems, Mathematical Modeling, Automation and Energy Efficiency (SUMMA), Lipetsk, Russia, 9–11 November 2022; pp. 158–163. [Google Scholar] [CrossRef]
  21. Alyoshkin, A.; Zhukov, D. Percolation Model of Road Line Overloading. In Proceedings of the 2023 5th International Conference on Control Systems, Mathematical Modeling, Automation and Energy Efficiency (SUMMA), Lipetsk, Russia, 8–10 November 2023; pp. 861–864. [Google Scholar] [CrossRef]
  22. Grimmet, G. Percolation, 2nd ed.; Springer: Berlin, Germany, 1999; 444p. [Google Scholar] [CrossRef]
  23. Sahimi, M. Applications of Percolation Theory; Tailor & Francis: London, UK, 1994; 276p. [Google Scholar] [CrossRef]
  24. Stauffer, D.; Aharony, A. Introduction to Percolation Theory; Tailor & Francis: London, UK, 1992; 192p. [Google Scholar] [CrossRef]
  25. Feder, J. Fractals, 3rd ed.; Plenum Press: New York, NY, USA; London, UK, 2013; 284p. [Google Scholar] [CrossRef]
  26. Kramarov, S.O.; Popov, O.R.; Dzhariev, I.E.; Petrov, E.A. Percolation and connectivity formation in the dynamics of data citation networks in high energy physics. Russ. Technol. J. 2025, 13, 16–27. [Google Scholar] [CrossRef]
  27. Zhukov, D.; Khvatova, T.; Lesko, S.; Zaltsman, A. Managing social networks: Applying the Percolation theory methodology to understand individuals’ attitudes and moods. Technol. Forecast. Soc. Change 2017, 123, 234–245. [Google Scholar] [CrossRef]
  28. Zhukov, D.O.; Khvatova, T.Y.; Lesko, S.A.; Zaltsman, A.D. The influence of connection density on clusterization and percolation threshold during information distribution in social networks. Inform. I Primen. (Inform. Their Appl.) 2018, 12, 90–97. [Google Scholar] [CrossRef]
  29. Lesko, S.; Aleshkin, A.; Zhukov, D. Reliability Analysis of the Air Transportation Network when Blocking Nodes and/or Connections Based on the Methods of Percolation Theory. IOP Conf. Ser. Mater. Sci. Eng. 2020, 714, 012016. [Google Scholar] [CrossRef]
  30. Zhukov, D.O.; Andrianova, E.G.; Lesko, S.A. The Influence of a Network’s Spatial Symmetry, Topological Dimension, and Density on Its Percolation Threshold. Symmetry 2019, 11, 920. [Google Scholar] [CrossRef]
  31. Wu, N. German Highway Capacity Manual (HBS2015). In Proceedings of the World Transport Convention 2018, Beijing, China, 18–21 June 2018. [Google Scholar] [CrossRef]
  32. Wu, N. Traffic Quality Assessment at Signalized Intersections—Procedures in the New German Highway Capacity Manual (HBS 2015). In Proceedings of the 15th COTA International Conference of Transportation Professionals (CICTP 2015), Beijing, China, 24–27 July 2015; pp. 2474–2485. [Google Scholar] [CrossRef]
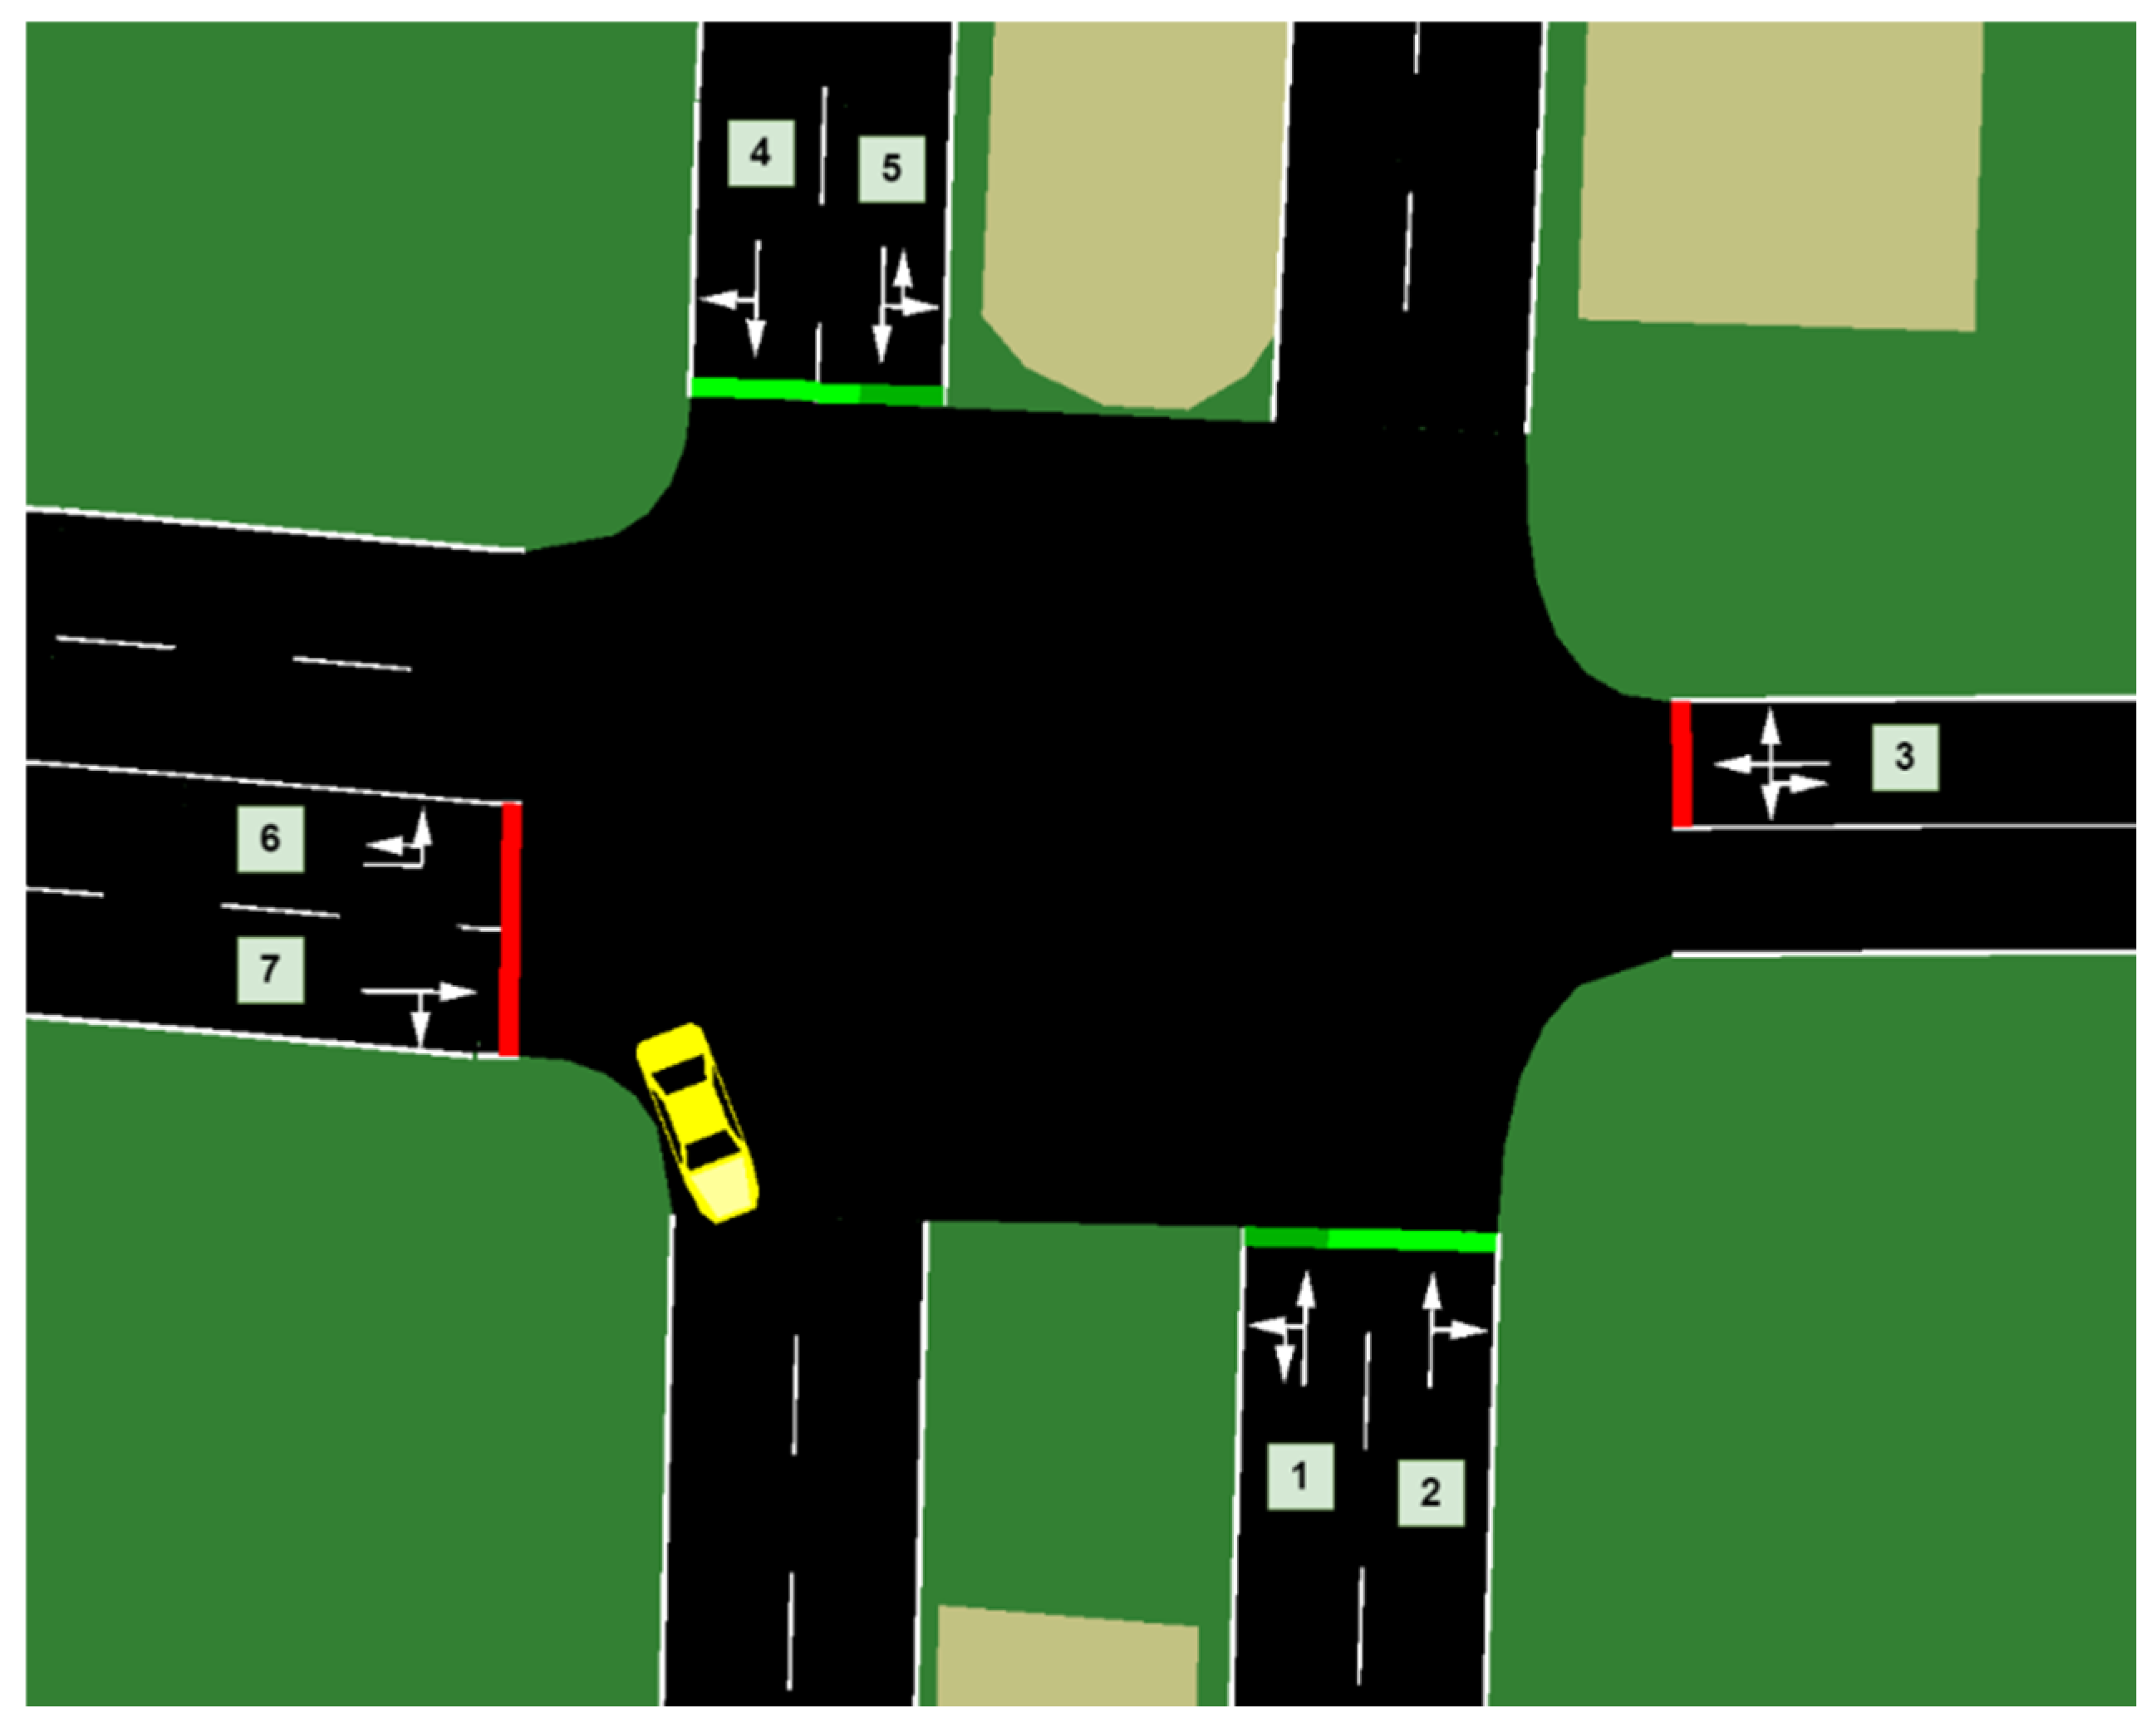
Figure 1. Example of traffic light control at an intersection (SUMO simulation screenshot with extra markings).
Informatics 12 00122 g001
Figure 2. Scheme of possible transitions between states characterizing the number of vehicles at intersection j , in direction i , at step h + 1 of traffic light operation.
Informatics 12 00122 g002
Figure 3. Calculation periods of inbound and outbound flows of vehicles for each direction of a signalized intersection.
Informatics 12 00122 g003
Figure 4. Graphical representation of the presented algorithm.
Informatics 12 00122 g004
Figure 5. Limitations of the described approach (SUMO simulation screenshot).
Informatics 12 00122 g005
Figure 6. Coverage of the road network with generated routes, illustrated using the example of Shanghai (China) (SUMO road map and routes visualization).
Informatics 12 00122 g006
Figure 7. Examples of traffic light placement for the cities selected in the modeling (SUMO traffic lights map visualization: for example, maps of New York (a), USA, and Tokyo, Japan (b); maps of Moscow, Russia, Berlin, Germany, Shanghai, China, Mexico City, Mexico have a similar appearance).
Informatics 12 00122 g007
Figure 8. Distribution of the possible number of exit directions from a signalized intersection for the selected urban fragments of (a) New York and (b) Tokyo.
Informatics 12 00122 g008
Figure 9. Comparison of route length distributions in sets 1 and 2 for the selected simulation areas of (a) New York and (b) Tokyo.
Informatics 12 00122 g009
Figure 10. Change in the dynamics of vehicle movement through New York City for different traffic-signal phase durations (t = 15 s., 30 s., 60 s., 120 s.).
Informatics 12 00122 g010
Figure 11. Vehicle movement dynamics for route sets 1 and 2 under dynamic and static traffic signal control on map fragments of (a) New York and (b) Tokyo (as examples).
Informatics 12 00122 g011
Figure 12. Vehicle movement/idle dynamics under dynamic and static traffic signal control on a map fragment of New York City: (a) dynamic control and first routes set; (b) dynamic control and second routes set; (c) static control and first routes set; (d) static control and second routes set.
Informatics 12 00122 g012
Figure 14. Traffic dynamics in New York City when the number of cars (routes) increases to 40,000.
Informatics 12 00122 g014
Figure 15. Dependence of integral indicators of road traffic quality on the density of traffic lights per kilometer of the transport network and the density of unsignalized intersections (a) for the relative number of vehicles on the roads; (b) for the relative number of vehicles on the roads (another angle); (c) for the integral indicator “congestion”).
Informatics 12 00122 g015
Figure 16. Different views of the surface of the overall quality function as a function of traffic light density and unsignalized intersection density: (a) view 1; (b) with rotation; (c) additional rotation; (d) additional rotation.
Informatics 12 00122 g016aInformatics 12 00122 g016b
Table 1. Characteristics of the selected sections of the cities and routes selected for modeling.
CityCoordinatesNumber of Vehicles in the ExperimentNumber of Traffic LightsNumber of Unsignalized IntersectionsRatio of Signalized to Unsignalized Intersections
New York−74.023056, 40.735354,
−73.906099, 40.830413
4000195718021.09
Moscow37.565399, 55.734592,
37.679815, 55.779358
400019212200.16
Tokyo139.697486, 35.678460,
139.757845, 35.742650
400022021880.10
Berlin13.323501, 52.498585,
13.428170, 52.536943
400018713360.14
Shanghai121.405481, 31.179804,
121.573106, 31.277710
400099230810.32
Mexico City−99.191556, 19.293875,
−99.080280, 19.438003
400083598040.09
Table 2. Calculated percolation thresholds for various possible connections of the object.
Number of Outgoing Connections
12345678
Calculated percolation threshold (N)0.190.440.590.680.740.780.820.84
Table 3. Percolation thresholds for the entire network in the selected simulation areas of the cities and their differential characteristics.
CityLength of the Selected Road Network Section [km]Number of Traffic Lights in the Selected SectionTraffic Light Density in the Selected Section [units/km]Number of Unsignalized IntersectionsDensity of Unsignalized Intersections in the Selected Section [units/km] Density of the Selected Road Network ( ρ n e t ) Calculated Percolation Threshold (N)
New York1355.6619571.4418021.332.510.53
Moscow563.361920.3612202.262.370.50
Tokyo518.972200.4221884.222.790.56
Berlin539.061870.3513362.482.540.53
Shanghai2351.269920.4230811.312.750.55
Mexico City2705.938350.3198043.622.640.54
Table 4. Departure times of the last vehicle in the route set for different durations of the traffic signal’s green phase.
Line in the PictureSwitching DurationEnd of Movement Time [s]End of Movement Time [h:mm:ss]Vehicles Remaining on the Roads
NY-1-120120 s21,6006:00:00203
NY-2-120120 s21,6006:00:00165
NY-1-6060 s19,1485:19:080
NY-2-6060 s17,4464:50:460
NY-1-3030 s12,7313:32:110
NY-2-3030 s11,7443:15:440
NY-1-1515 s12,0633:21:030
NY-2-1515 s11,0583:04:180
Table 5. Comparison of simulation results for route sets. Integral indicator of the number of vehicles in the network.
CityRoute Set 1, Static ControlRoute Set 2, Static ControlRoute Set 1, Dynamic ControlRoute Set 2, Dynamic ControlRelative Number of Vehicles on the Roads over the Entire Simulation Period [%]
New York9,942,9099,319,8438,458,1088,222,97513.40%
Moscow4,456,4905,331,3394,635,5574,883,2712.75%
Tokyo9,997,5529,374,4398,640,6268,843,1609.75%
Berlin8,020,8447,908,2507,581,4417,964,4332.41%
Shanghai7,449,9066,492,9596,670,0306,045,1268.81%
Mexico City6,812,3756,668,0355,622,6405,458,98717.79%
Table 6. Comparison of simulation results for route sets. Integral evaluation of movement/idle time.
CityRoute Set 1, Static ControlRoute Set 2, Static ControlRoute Set 1, Dynamic ControlRoute Set 2, Dynamic ControlRelative Difference Between the Number of Vehicles in the Road Network at a Given Simulation Step and the Number of Idling Vehicles [%]
New York3,118,4713,105,0983,439,2513,479,51211.17%
Moscow2,137,7072,217,3762,227,8652,297,0773.90%
Tokyo1,913,0711,928,0521,983,8771,959,0002.65%
Berlin2,460,4742,422,7372,550,9342,513,3403.71%
Shanghai2,185,1792,187,3222,250,5992,287,5453.79%
Mexico City2,183,8872,170,9882,321,2692,272,1045.48%
Table 7. Integral assessment of lane congestion in traffic simulation.
CityRoute Set 1, Static ControlRoute Set 2, Static ControlRoute Set 1, Dynamic ControlRoute Set 2, Dynamic ControlRelative Difference in the Integral “Congestion” Indicator [%]
New York253,520257,974182,383198,23025.59%
Moscow91,511112,58772,45375,45427.53%
Tokyo408,372379,448264,090290,18429.64%
Berlin212,144213,756166,060178,82219.02%
Shanghai241,414188,795106,077104,44151.07%
Mexico City146,641163,328123,475122,07020.78%
Table 8. Integral assessments in traffic simulation.
CityDataset Number (Points in Figure 15 and Figure 16)Ratio of Signalized to Unsignalized IntersectionsDensity of Unsignalized Intersections in the Selected Road Network Section [units/km]Density of Traffic Lights in the Selected Road Network Section [units/km]Integral Indicator “Relative Number of Vehicles on the Roads over the Entire Period”Integral Indicator “Relative Difference Between the Number of Vehicles in the Road Network at a Given Simulation Step and the Number of Idling Vehicles”Relative Difference in the Integral “Congestion” Indicator [%]
New York11.091.331.4413.40%11.17%25.59%
Shanghai20.321.310.428.81%3.79%51.07%
Moscow30.162.260.362.75%3.90%27.53%
Berlin40.142.480.352.41%3.71%19.02%
Mexico City50.093.620.3117.79%5.48%20.78%
Tokyo60.104.220.429.75%2.65%29.64%
Table 9. Characteristics of the sections selected to assess the accuracy of the method for finding the near-optimal density of traffic lights and unsignalized intersections.
ParameterShanghai—Section AShanghai—Section BSan FranciscoToronto
Total road length547.31591.951301.761275.76
Number of traffic lights480156954556
Number of unsignalized intersections80367033503465
Traffic light density [units/km]0.880.260.730.44
Unsignalized intersection density [units/km]1.471.132.572.72
Density of the selected road network section2.662.792.912.71
Percolation threshold0.550.560.580.55
Integral indicator “Relative number of vehicles on the roads over the entire period” (normalized value in parentheses, with respect to the maximum value given in the table)1.32%
(0.07)
0.27%
(0.02)
9.35%
(0.52)
21.81%
(1.23)
Integral indicator “Relative difference between the total number of vehicles in the road network at a given simulation step and the number of idling vehicles” (normalized value in parentheses, with respect to the maximum value given in the table)10.42%
(0.94)
3.60%
(0.32)
8.30%
(0.74)
1.00%
(0.09)
Relative difference in the integral “congestion” indicator (normalized value in parentheses, with respect to the maximum value given in the table)46.74%
(0.92)
0.98%
(0.02)
23.07%
(0.45)
50.75%
(0.99)
Numerical value of the overall quality function Z0.640.120.570.77
Disclaimer/Publisher’s Note: The statements, opinions and data contained in all publications are solely those of the individual author(s) and contributor(s) and not of MDPI and/or the editor(s). MDPI and/or the editor(s) disclaim responsibility for any injury to people or property resulting from any ideas, methods, instructions or products referred to in the content.