Article

Enhancing Clinical Decision Support for Precision Medicine: A Data-Driven Approach

by
Nasim Sadat Mosavi
* and
Manuel Filipe Santos
Algoritmi Centre/LASI, University of Minho, 4804-533 Guimarães, Portugal
*
Author to whom correspondence should be addressed.
Informatics 2024, 11(3), 68; https://doi.org/10.3390/informatics11030068
Submission received: 29 April 2024 / Revised: 27 August 2024 / Accepted: 29 August 2024 / Published: 13 September 2024
(This article belongs to the Section Medical and Clinical Informatics)

Abstract

:
Precision medicine has emerged as a transformative approach aimed at tailoring treatment to individual patients, moving away from the traditional one-size-fits-all model. However, Clinical decision support systems encounter challenges, particularly in terms of data aspects. In response, our study proposes a data-driven framework rooted in Simon’s decision-making model. This framework leverages advanced technologies such as artificial intelligence and data analytics to enhance clinical decision-making in precision medicine. By addressing limitations and integrating AI and analytics, our study contributes to the advancement of optimal clinical decision-making practices in precision healthcare.

1. Introduction

The concept of tailoring treatment to individual patients is not new. As early as 1946, Austin Bradford Hill’s successful demonstration of streptomycin’s efficacy in treating tuberculosis marked a pivotal moment in clinical research. This achievement spurred rapid methodological progress in clinical trial design and analysis, reshaping the landscape of clinical trials. Hill’s work laid the foundation for evidence-based medicine, where clinical decisions are increasingly guided by empirical data, with randomized controlled trials emerging as the gold standard for generating reliable evidence [1]. However, despite these advancements, the integration of data, physician expertise, and experience, coupled with clinical judgment, often led to a medical decision-making process reliant on trial and error. This symptom-driven model, founded on empirical evidence, tends to generalize solutions and treat all patients with similar symptoms uniformly [2,3]. For decades, this evidence-based medicine has been the primary approach for all patients regardless of the individual patient’s variabilities and disease conditions; this approach views patients with a single disease and multiple conditions from one lens only and has resulted in over-treatments, costly, inefficient, and complex medication protocols [4,5]. In addition, delays in disease diagnosis and uncertainties regarding treatment response significantly impact disease progression and treatment outcomes [6,7,8]. Moreover, the recent literature underscores the prevalence of medication errors and delayed treatments. Despite these figures, the analysis of fatalities resulting from incorrect medication remains inadequate [9]. Estimates indicate that approximately 44 million individuals worldwide are currently living with dementia. As the global population continues to age, projections suggest that this number will more than triple by the year 2050. With this demographic shift, the economic burden of dementia is also expected to escalate significantly. In the United States alone, experts anticipate that the annual cost associated with dementia may surpass an astonishing $600 billion by 2050 [10].
The rise of precision medicine (PM) gained significant momentum in 2011, when the concept of PM was introduced by the National Research Council, emphasizing the tailoring of medical interventions to individual patient characteristics. This approach involves categorizing patients based on their susceptibility to diseases and treatment responses. PM plays a pivotal role in guiding healthcare decisions, enhancing the quality of care while minimizing unnecessary tests and therapies. As highlighted by Geoffrey S. Ginsburg and Kathryn A. Phillips in 2018, this method optimizes interventions, directing resources where they yield the greatest benefits and mitigating costs and potential side effects for patients [11].
According to the U.S. National Library of Medicine, PM represents an emerging paradigm that considers individual differences, including genes, environment, and lifestyle, to prevent and treat specific diseases for everyone [12,13,14]. The U.S. National Cancer Institute also defines PM as “a form of medicine that uses information about a person’s genes, proteins, and environment to prevent, diagnose, and treat disease” [14,15,16].
This progressive methodology seeks to replace the antiquated “one size fits all” model with a patient-centric “patient like me” approach. Its core mission is to address issues such as inefficient treatments and medical errors, ultimately reducing the burden of overtreatment and hospitalization while saving more lives [17]. Moreover, this approach represents a pivotal shift in medical science, where the core objectives include predicting the likelihood of developing a disease, achieving precise diagnoses, and optimizing the most effective treatment for individual patients [18]. The overarching goal is to usher in a new era of healthcare that is not only more personalized but also more effective in addressing the unique needs of each patient [19,20].
Widely embraced definitions of PM span several dimensions. Alternatively, PM is perceived as an all-encompassing, data-driven paradigm that underscores the significance of integrating diverse types of data, incorporating clinical information and other pertinent data sources. This data integration enables the categorization of patients into distinct subgroups, with the expectation that these subgroups share a common foundation of disease susceptibility and presentation. Ultimately, this data-driven approach aims to facilitate more accurate and personalized therapeutic solutions. These dual aspects of PM collectively underscore its commitment to tailoring medical care to individual patients while leveraging advanced data analysis and integration techniques for enhanced diagnosis and treatment [19,20,21,22,23].
Despite the development of clinical decision support systems (CDSS), which have been in use since the 1980s and their advancements, CDSS face several limitations and challenges. Issues such as data quality, data processing and management, transportability/interoperability, and integration with other hospitals or systems pose significant hurdles. Moreover, the disrupted/fragmented workflow associated with CDSS can make them inefficient, hindering the dissemination and scaling of otherwise high-quality systems [24,25,26]. Additionally, they often fall short in addressing requirements related to genetic/genomic and biological data, such as interpreting genetic test results and understanding their implications for family members and future generations in medical decision-making [15,27].
In the early twenty-first century, the limitations of traditional clinical decision-making models became evident, exacerbated by the vast amount of healthcare big data available, which often overwhelmed human cognition in making timely decisions [28]. This period also witnessed transformative changes in the healthcare landscape, driven by technological advancements such as cognitive computing (CC), artificial intelligence (AI), and big data analytics [8,29].
Recognizing the inherent complexity of patient heterogeneity in treatment assessment, particularly highlighted in the late twentieth century, alongside the rise of data analytics around 2010 and subsequent advancements in AI and CC from 2015 to 2020, has emphasized the necessity for a data-driven approach. This paradigm shift prioritizes precise and timely decision-making tailored to individual variables [30,31].
This shift aims to optimize the utilization of patient clinical data and harness the power of AI and CC to tailor precise treatment pathways [32,33]. Through deep research and extensive literature studies, PM has evolved from a theoretical concept to a practical approach to maximize treatment efficacy and patient outcomes [34,35,36].
Inspired by the evolving landscape of data-driven decision-making PM, our study stands as a dedicated endeavor to contribute significantly to this dynamic protocol. In addition to exploration, our focus is to intricately detail how data-driven insights can not only shape the framework but also drive the development of applications in PM. We envision our research as a catalyst, actively advancing the integration of data-driven methodologies, thereby fostering a transformative shift in clinical decision-making for the betterment of precision healthcare. Hence, this research seeks to address the fundamental question: “How can data-driven insights shape the framework of Clinical Decision Support Systems and advance optimal clinical decision-making?”. To achieve this overarching goal, a set of interconnected objectives will guide the investigation.
Our primary objective is to introduce a cutting-edge, data-driven framework firmly rooted in the concept of a “Decision Support System” strategically designed to address the complex challenges inherent in the interdisciplinary field of PM. This framework harbors the potential to instigate a revolutionary shift away from the conventional “One-Size-Fits-All” approach to medical decision-making towards an innovative paradigm we term “Patient-Like-Me.” Envisioned as a transformative leap forward, this framework is poised to optimize decision-making processes in PM. With a meticulous focus on tailoring strategies to suit the unique circumstances of each patient, our research endeavors to offer actionable insights that drive the formulation of personalized and highly effective treatment plans. Through these concerted efforts, our project aspires to make substantial strides in advancing the landscape of precision healthcare. Furthermore, this study, which utilized diverse datasets aligned with the research question, aimed to address crucial aspects of data processing, particularly focusing on data integration and standardization. These initiatives have yielded significant enhancements in analytical insights, empowering decision-makers to traverse the clinical journey of patients, meticulously observing and analyzing their current health status. Furthermore, they have substantially streamlined our predictive analysis processes, empowering us to discern patterns and correlations within data behaviors.
The integration of predictive analysis and analytical insights has significantly advanced the task of decision-making. At the application level, our research illuminates critical aspects such as patient monitoring and health profiling, enabling the identification of at-risk patients, evidence-based treatment, early detection, cutting the cost of over-treatment, resource optimization, and increasing patient engagement. Ultimately, this leads to more precise decision-making and enhances the overall quality of clinical services.
The evolution of intelligent decision support systems for precision medicine is a dynamic and rapidly advancing field. Despite extensive research at the application level, numerous challenges and scientific gaps persist in the development of data-driven clinical decision support systems. Figure 1 summarises key obstacles and gaps encountered in the data processing area, which is the main focus of our contribution to this research question.
Patient data in precision medicine is highly heterogeneous, including genetic, clinical, lifestyle, and imaging data [37].
In the realm of digitized healthcare platforms, a prevalent scenario involves the continuous monitoring and storage of various patient variables, resulting in a vast amount of collected data. The integration of these data is crucial for studying their correlation with other information generated during a patient’s treatment journey and other clinical aspects. Ensuring that these data sources can work together seamlessly is essential for precision medicine, but it remains a technical challenge. Moreover, the presence of outliers and abnormal data introduces bias, necessitating the filtration of such data from modeling and study scenarios [38,39]. Despite the promising strides in big data analysis in clinical research, which are marked by a growing number of peer-reviewed articles, addressing these challenges remains limited. A concerted effort is needed to validate the knowledge extracted from clinical big data and seamlessly implement it in clinical practice [40,41].
Numerous studies have contributed fragmented solutions to address these challenges. Table 1 highlights a few major efforts that present promising frameworks. For instance, the “attention scores” technique for feature importance in time series clinical data is a complex yet applicable method suitable for nonlinear data [42]. Other research endeavors leverage summaries of patient time series data from the ICU, focusing on the early prediction of in-hospital mortality. This approach involves static observations and physiological data, including labs and vital signs, aggregated based on hourly circumstances, thereby addressing data extraction and integration within the context of data aggregation [42].
Another significant limitation faced by clinical data for processing pertains to storage and computing, particularly concerning high-frequency data such as physiological indicators. The “Electron” framework has emerged as a solution designed to store and analyze longitudinal physiologic monitoring data [43]. Moreover, the topological data analysis (TDA) approach proves effective for large-scale datasets, utilizing algebraic topology to analyze big data by reducing dimensionality, especially for geometric representations, to extract patterns and gain insights into them. To cope with the velocity of these data, the introduction of “anytime algorithms” to learn from data streaming has proven useful for time series data, contingent upon the computational capacity they can handle. Additionally, addressing heterogeneous data (data variety), the generalized non-negative matrix tri-factorization (GNMTF) framework is an efficient solution for data integration, although its competency complexity increases with the number of data types to be integrated [42,44,45].
As discussed above, to overcome these limitations, researchers and practitioners have delved into diverse solutions, where those existing approaches have provided solutions to manage specific challenges such as feature importance, feature selection, dimensionality reduction, and addressing issues related to data processing tasks.
This study draws inspiration from Simon’s model of decision-making: the “intelligence design-choice” model.
Simon introduced the concept of bounded rationality to address the reality that human decision-making often falls short of achieving truly optimal outcomes. He highlighted that human cognition is inherently limited, making it impossible for individuals to consider and analyze every conceivable alternative and its consequences during problem-solving. Consequently, decisions may be influenced by individual preferences rather than being strictly rational. In response to these limitations, Simon devised a systematic and logical framework, initially consisting of “Intelligence-Design-Choice” to guide rational decision-making. Later, he added an “Implementation” phase as a fourth step, incorporating monitoring and feedback from each preceding phase to validate, verify, and refine the decision-making process [46,47].
The “Intelligence” phase encompasses activities such as information gathering and scanning. This stage also involves the critical task of problem identification and definition. Moving to the “Design” phase, the focus shifts to conceptualizing the problem, defining assumptions, generating alternative solutions, and constructing models. Finally, the “Choice” phase pertains to goal attainment, involving the evaluation and selection of the best possible course of action [47,48].
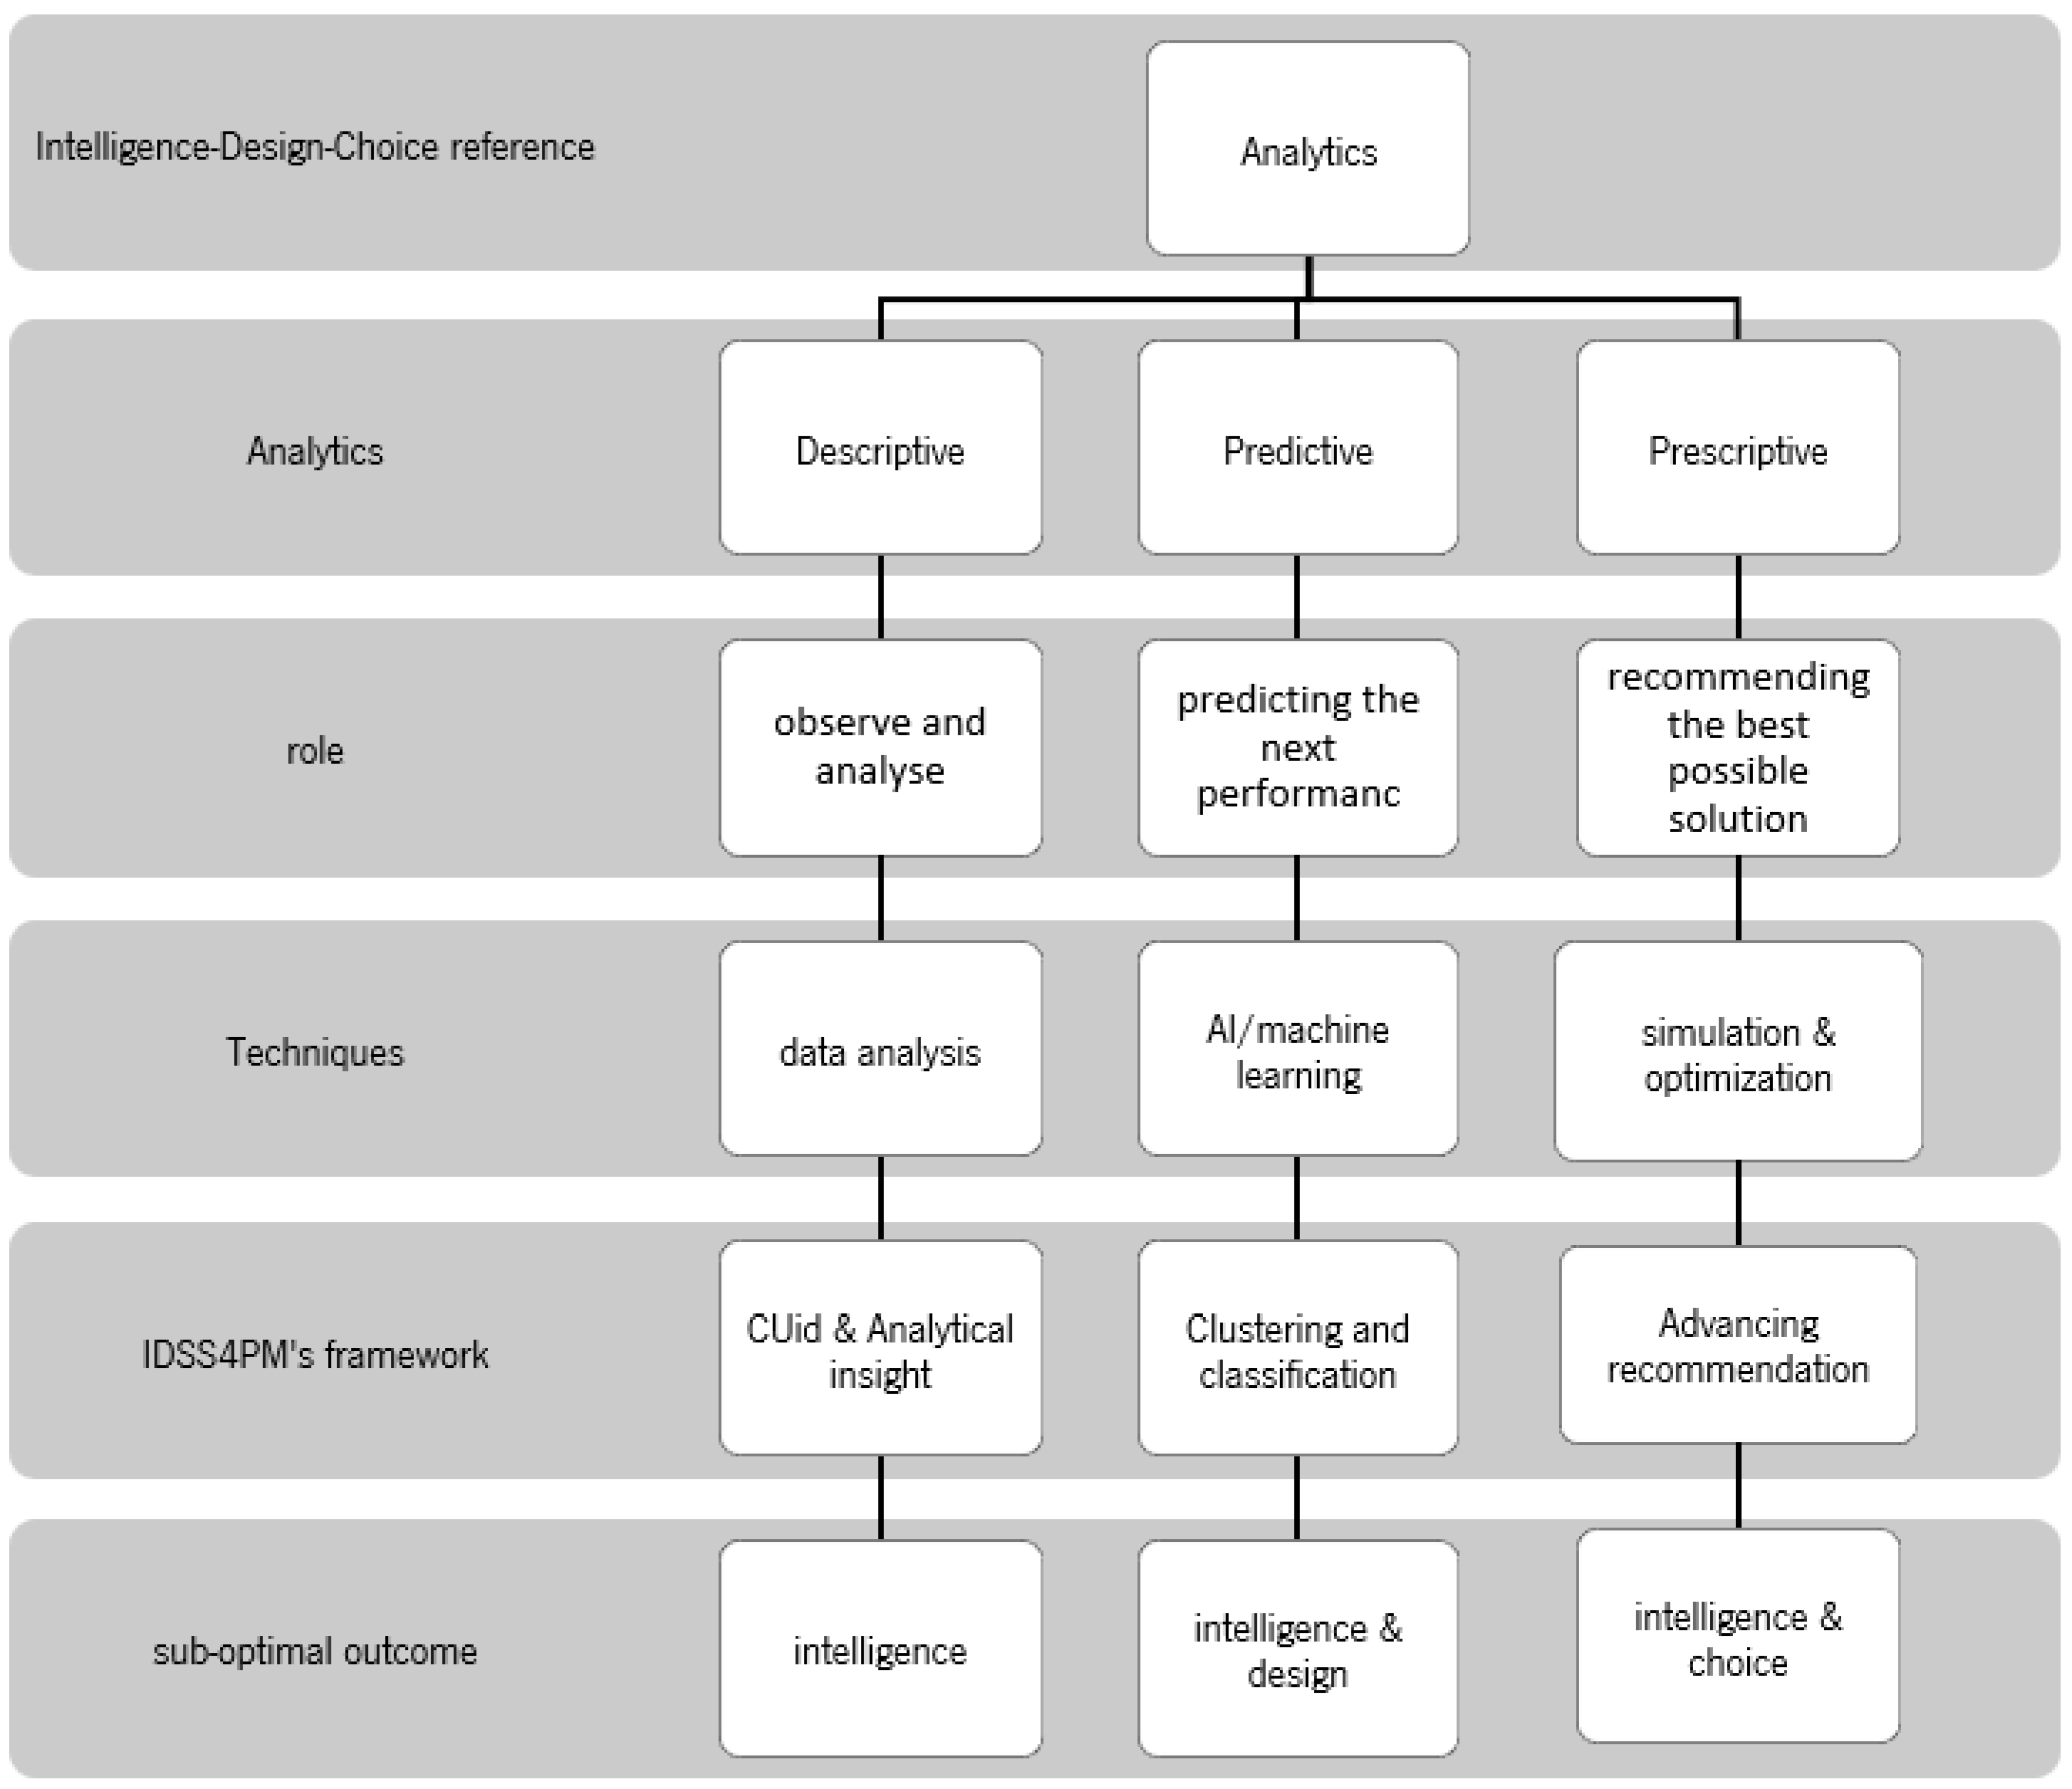
Considering the role of analytics in rational decision-making, it becomes evident that each type of analytics corresponds to specific phases within this framework. Descriptive and diagnostic analytics are instrumental in data collection and analysis, problem definition, and knowledge extraction, aligning with the “Intelligence” phase. Predictive analytics, which involves formulating and generating alternatives, is well-suited to the “Design” phase, given its capacity to provide insights and options [49]. Additionally, because predictive analytics offers informative capabilities, it also aligns with the “Intelligence” phase. Last, prescriptive analytics, with its focus on providing actionable recommendations and achieving optimal outcomes, naturally corresponds to the “Choice” phase. In summary, each analytics approach serves distinct functions within the decision-making process, contributing to a more informed and rational approach to clinical decision-making [50,51].
We utilize this model as a benchmark to validate the proposed framework, aiming to support a novel approach in clinical decision-making, specifically within the realm of PM. Our objective is to maximize the utilization of data and advanced technologies, including AI and analytics, to enhance the decision-making process. As a result, the findings of this study contribute to the advancement of optimal clinical decision-making practices.
This article follows structured research, beginning with an exploration of the datasets and techniques employed in the Materials and Methods section to fulfill our objectives. We present the outcomes of our work, starting with the introduction of the clinical event identity (CEid) artifact, followed by the analytical insights derived from our novel data processing approach facilitated by CEid. Subsequently, we delve into the discussion of temporal clustering, culminating in health profiling. Moreover, in the discussion section, we extensively elucidate our commitment to a data-driven clinical decision-making model within the precision medicine framework, underpinned by the theoretical foundation of Simon’s decision-making model.

2. Materials and Methods

2.1. Data Collection and Exploration

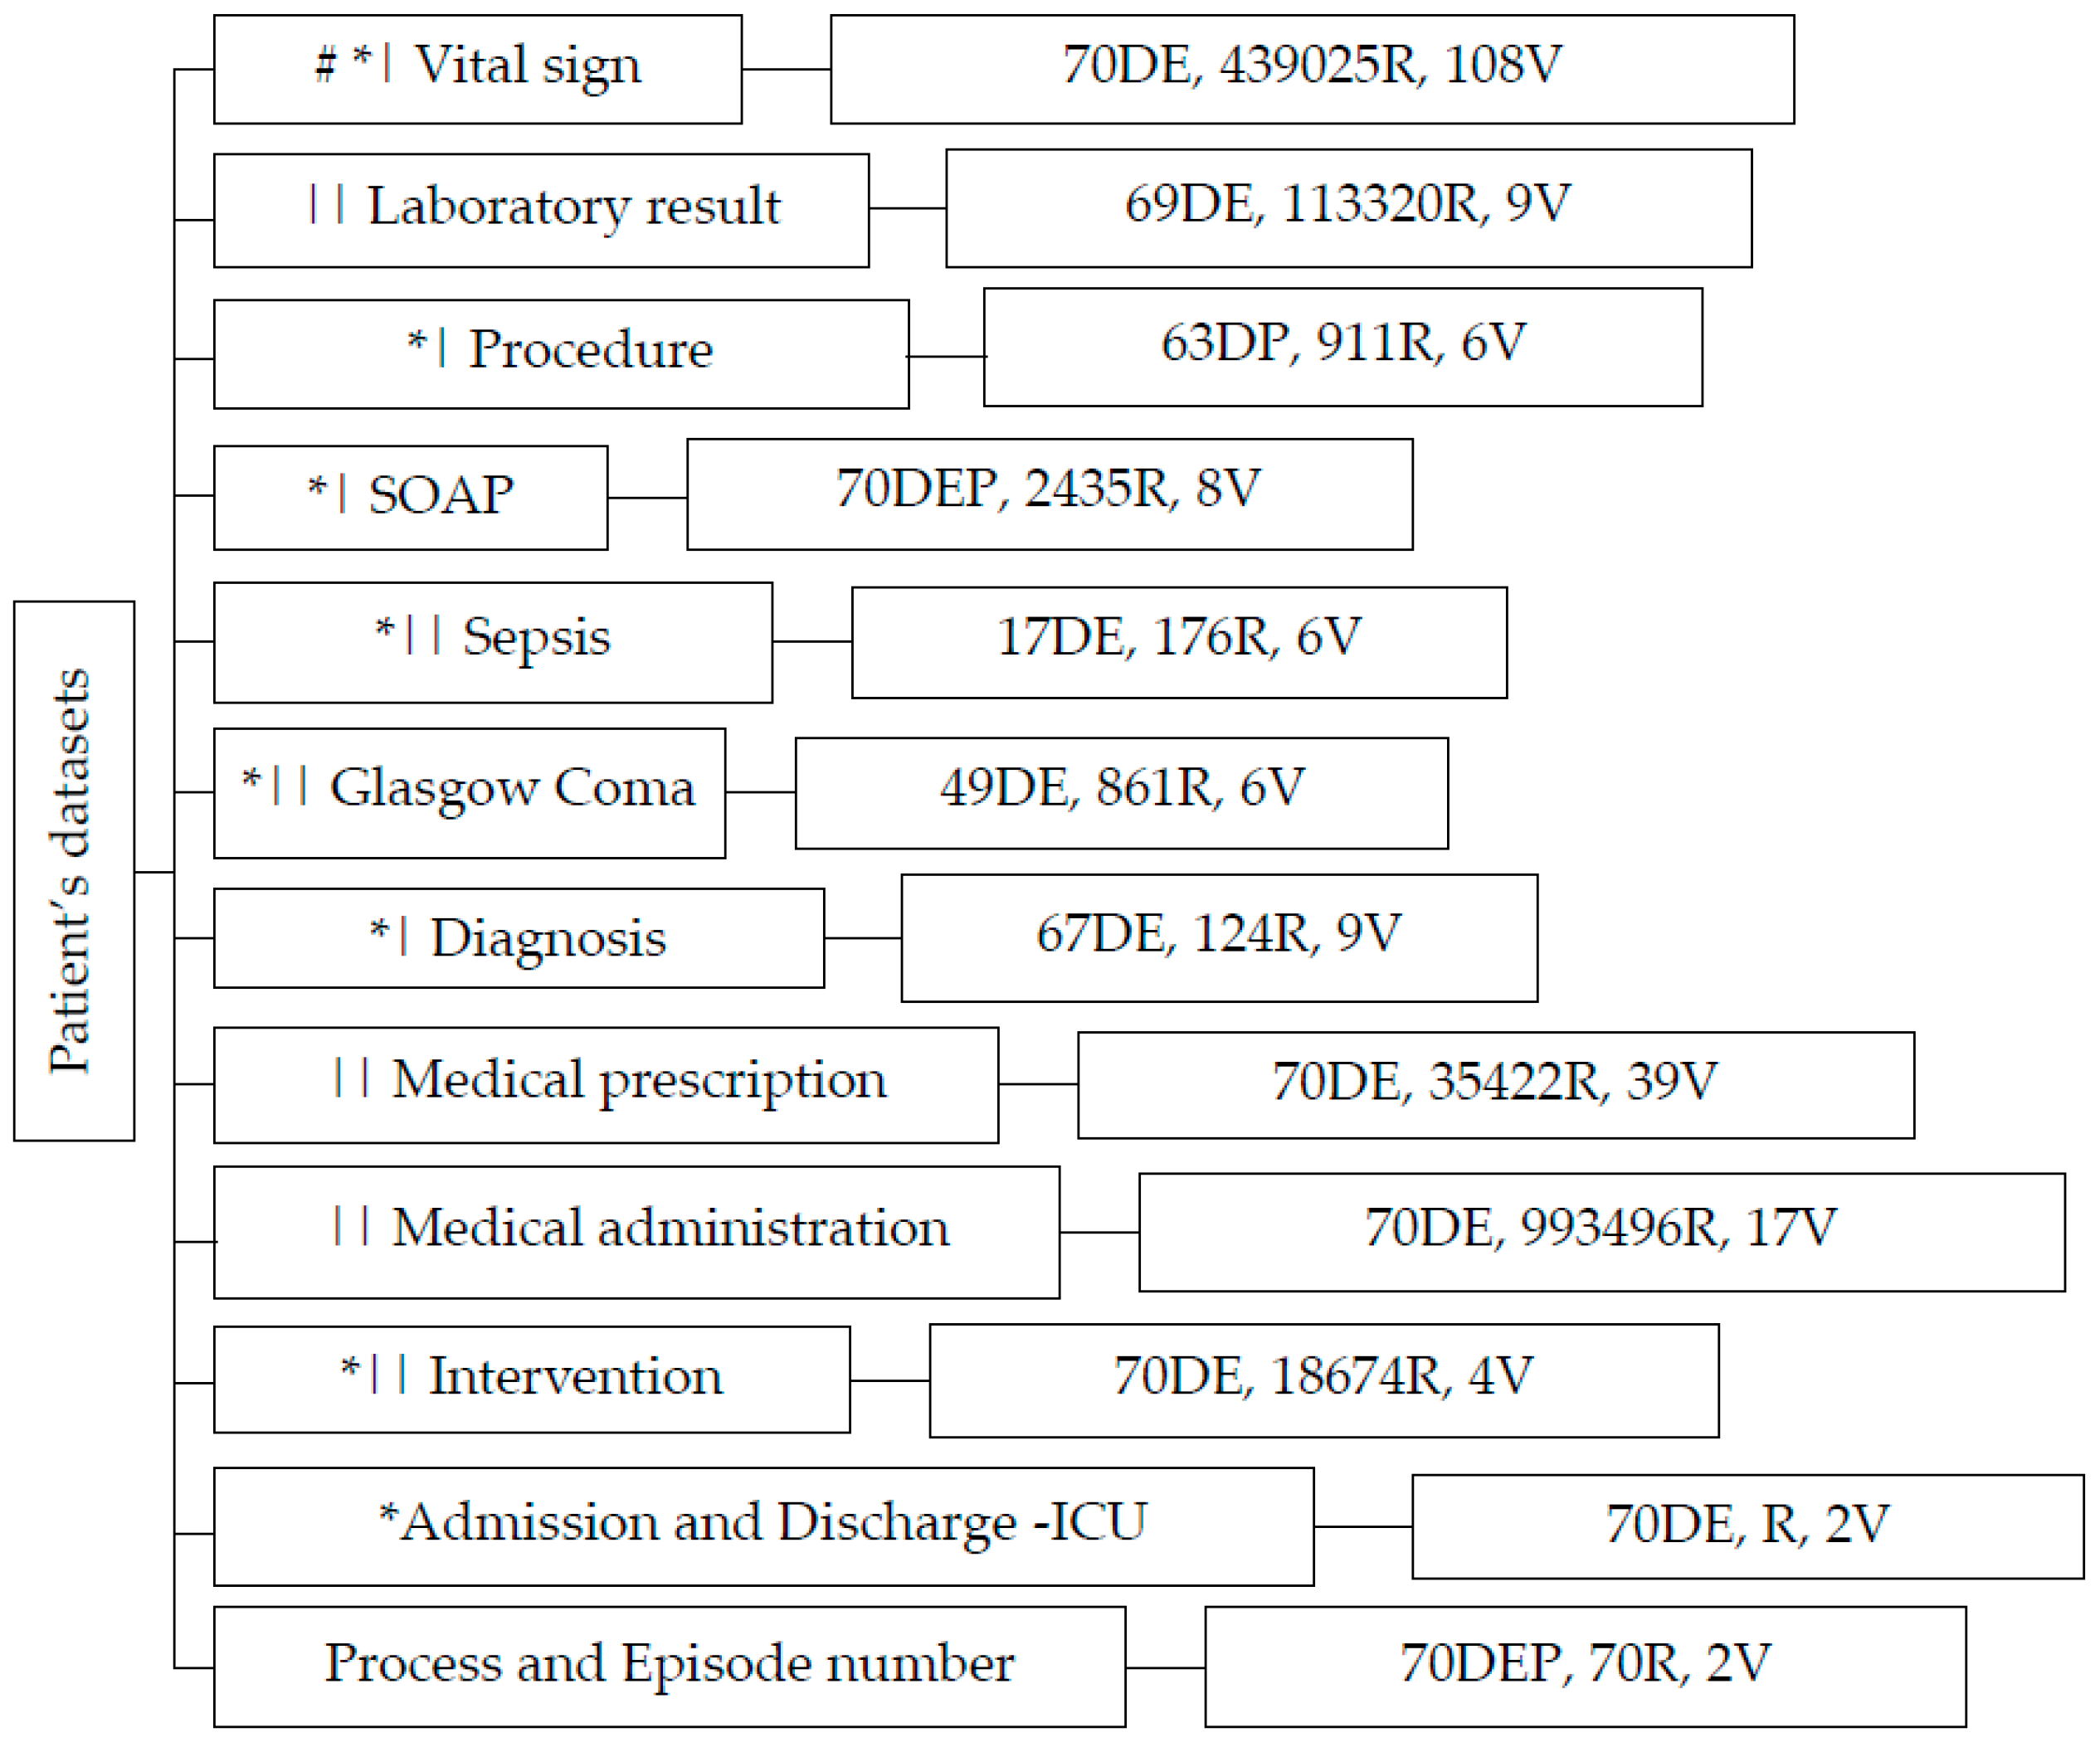
This study collected data from an intensive care unit (ICU). According to Figure 2, the dataset encompasses 10 distinct categories, each providing valuable insights into various facets of patient health and medical interactions. Specifically, these data pertain to the clinical background of 70 patients who have been in the ICU.
  • “Vital Signs”: This dataset contains 439,025 records and 108 biological variables, focusing on vital signs that play a crucial role in assessing a patient’s overall condition.
  • “Laboratory Results”: Comprising 113,320 records and 9 variables, this dataset provides information about various laboratory exams conducted, aiding in diagnosing and monitoring patients’ health.
  • “Procedures”: With 911 records and 6 variables, the “Procedure” dataset sheds light on the medical actions recommended and prescribed by healthcare professionals.
  • “Sepsis (Gravity Score)”: Capturing data from 176 records and 6 variables, this category gauges the severity of patients’ conditions, particularly in cases of sepsis.
  • “Glasgow Coma Scale”: Containing 861 records and 6 variables, this dataset evaluates patients’ consciousness levels, a vital indicator of neurological well-being.
  • “Diagnosis”: Encompassing 124 records and 9 variables, the “Diagnosis” section focuses on recording signs, symptoms, and potential medical conditions.
  • “Medication Prescriptions”: This category, with 35,422 records and 39 variables, provides data on medications prescribed by clinicians, helping track patient treatment plans.
  • Medical administration: with 993,496 records and 17 variables associated with drug administration.
  • SOAP: encompassing 2435 records and 8 variables, contains critical data related to the Subject, Object, Assessment, and Plan components following the SOAP framework
  • “Intervention Actions”: Capturing information about various interventions, this category showcases actions taken to manage patients’ health.
  • ICU Admission and Discharge: “Admin-Discharge” houses data about patients’ admissions and discharges from the ICU, facilitating comprehensive patient care management. This dataset consists of the date and time of admission and discharge.
  • Reference Dataset: Serving as a point of reference, this dataset includes episode and process numbers, wherein the episode number represents clinical events, while the process number signifies patient identity.
In Figure 2, datasets marked by: “|” (“vital sign”, “procedure”, and “diagnosis”) have the time or date of the clinical event, and others with || include both (time and date). In addition, the symbol: “*” shows that data are associated with the ICU (all tables except “med prescription). Moreover, in this table, “R” shows the number of records, and “V” means the number of variables. Moreover, two variables include distinct values, whether “Process Number” (DP) or “Episode Number” (DE).
It is crucial to note that this dataset served as the foundation for our preliminary investigations into clustering analysis, employing methodologies different from this work. The outcomes of these endeavors have been documented and published as our initial findings [1,2].
We performed a series of pivotal data processing tasks to enhance the quality and applicability of these collected data. Table 2 summarises key tasks revolve around critical aspects such as:
  • Feature Selection: Employing a meticulous approach to feature selection, we leveraged domain knowledge, statistical analyses, and data quality assessments. In instances such as the vital sign dataset, variables with over 90% missing data were systematically excluded.
  • Feature Engineering: In several datasets, we introduced novel variables to enhance analytical insight and harness valuable information. A prime illustration involves deriving the length of hospital-ICU stay by utilizing admission and discharge dates, thus transforming raw data into meaningful metrics.
  • Extraction and Processing: The effectiveness of analytical performance was significantly amplified through rigorous data extraction. An illustrative example is the extraction of demographic details such as age and gender from diverse datasets, culminating in the creation of a consolidated dataset that streamlined subsequent data processing.
  • Conditional Columns: Our transformative approach extended to the creation of conditional columns, converting raw data into actionable information. An example is our utilization of laboratory references for each exam, enabling a systematic comparison with exam results to ascertain their normal or abnormal status.
  • Grouping and aggregating time-series data for vital indicators, thus addressing sporadic data registration issues encountered with biological sensors in the ICU. By adopting an hourly aggregation approach, we effectively mitigated the challenge of infrequent data updates.
  • Cleaning-Missing cells: In addressing gaps within the vital sign dataset, a meticulous strategy was employed: we judiciously populated missing cells by computing the average value from neighboring cells preceding and following the voids. Similarly, within another dataset, a pragmatic approach was taken by eliminating missing cells.
As an integral part of our preparations, we meticulously fine-tuned all datasets to ensure they boasted fitting data types and pertinent features.
Table 2. Key Transformations.
Key Data ProcessingDescription|Example
Exploratory data analysisIdentify mean, max, min, missing cells, and data quality
Feature SelectionUsing Knowledge of domain and missing cells
Feature engineeringConstruct new variables such as length of stay
Data extractionDemography table; Extract age and gender
Conditional featureCreate Laboratory result status
The correct type of dataConsidering categorical, numerical, and also time series data
Group and aggregationFor handling infrequent data generation, particularly from biological sensors
Missing cellsImputation method and elimination.

2.2. Techniques and Metrics

Based on Table 3, our study employed the following techniques to augment the outcome:
  • Clustering: Clustering is a technique used in unsupervised learning to group similar data points together based on certain features or characteristics. It helps identify inherent structures within data without the need for predefined labels.
  • K-means Nearest: The K-means algorithm is a popular method for clustering data. It iteratively assigns data points to K clusters based on their proximity to the cluster centroids. The “nearest” aspect refers to how each data point is assigned to the nearest centroid during each iteration.
  • Classification: Classification is a supervised learning task where the goal is to assign predefined labels or categories to input data based on their features. It involves training a model on labeled data to make predictions on new, unseen data.
  • Random Forest: Random forest is an ensemble learning algorithm that builds multiple decision trees during training. Each tree in the forest independently classifies input data, and the final prediction is determined by a majority vote or averaging.
  • Elbow Method: The elbow method is a technique used to determine the optimal number of clusters in a dataset for K-means clustering. It involves plotting the within-cluster sum of squares (WCSS) against the number of clusters and identifying the “elbow” point, where the rate of decrease in WCSS slows down.
  • Silhouette Score: The silhouette score is a metric used to evaluate the quality of clustering. It measures how similar a data point is to its cluster compared with other clusters. A higher silhouette score indicates better-defined clusters.
  • K-Fold Cross Validation: K-Fold cross-validation is a technique used to assess the performance of a machine learning model by splitting the data into K subsets (folds) of equal size. The model is trained K times, each time using K-1 folds for training and the remaining fold for validation. This process is repeated K times, with each fold serving as the validation set exactly once. The performance metrics are then averaged across all K iterations to provide a more reliable estimate of the model’s performance on unseen data and reduce the variance of the evaluation. K-fold validation helps to ensure that the model’s performance is not heavily influenced by the particular random split of data into training and test sets.
  • Accuracy: Accuracy is a measure of the proportion of correctly classified instances among all instances. It is calculated as the number of correct predictions divided by the total number of predictions.
  • Precision: Precision is a measure of the proportion of true positive instances among all predicted positive instances. It indicates the accuracy of positive predictions.
  • Recall: Recall is a measure of the proportion of true positive instances among all actual positive instances. It measures the ability of a classifier to identify all relevant instances.
  • Kappa: Kappa is a statistic that measures inter-rater agreement for categorical items. It compares the observed agreement between raters to the agreement expected by chance.
  • F1 Score: The F1 Score is the harmonic mean of precision and recall. It balances both precision and recall and is useful when the classes are imbalanced.
  • AUC (Area Under Curve): AUC is the area under the receiver operating characteristic (ROC) curve. It measures the performance of a binary classification model across different threshold settings. A higher AUC indicates better model performance.
Table 3. Techniques and Metrics.
NameDescriptions
ClusteringGrouping data points based on similarity or proximity.
K means nearestA clustering algorithm that partitions data into K clusters based on centroids.
ClassificationAssigning labels or categories to data points
Random ForestA machine learning algorithm that builds multiple decision trees to classify data.
Elbow MethodA technique to determine the optimal number of clusters in clustering analysis.
Silhouette ScoreA metric to evaluate the quality of clustering
Fold Cross ValidationK-FoldCV repeatedly splits data into K subsets, training on K-1 and validating on one to assess model performance.
AccuracyThe proportion of correctly classified instances among all instances.
PrecisionThe proportion of true positive instances among all predicted positive instances.
RecallThe proportion of true positive instances among all actual positive instances.
KappaA statistic that measures inter-rater agreement for categorical items.
F1 scoreA statistic that measures inter-rater agreement for categorical items
AUC(Area Under Curve): The area under the Receiver Operating Characteristic (ROC) curve indicates model performance for binary classification.

3. Results

3.1. Crafting CEid and Interrelating Clinical Events

This phase harnessed a formula to craft a distinct key, uniquely pointing to each clinical event for individual patients. Illustrated in Figure 2, this key exhibits a structured composition: the initial number designates the event’s day, followed by an abbreviation denoting the data type. Additionally, the third and fourth components encompass the patient’s process number and episode number, respectively. The sequential order of events during a specific period is encapsulated within the event sequence, an ascending value ranging from one to n, culminating in the count of parallel events transpiring on the same day.
Figure 3 serves as an illustrative example, underscoring an event linked to an episode number (20016701) attributed to a patient identified by process number 859785. This informative data point delineates the event’s occurrence on the fifth day within the ICU context (vital sign data), constituting the eleventh clinical transaction.
Creating this new variable holds significance in establishing connections among clinical transactions through a unique timeline based on the day of the clinical event. This process aims to streamline the creation of an analytical dashboard, where this code acts as a guide to crucial patient information and aids in conducting clustering analysis.

3.2. Analytical Insight through CEid

Conducting analytical insight for the temporal analysis of interrelated clinical events stands as a potent data visualization tool in clinical decision-making. The paramount goal is to shed light on the chronological sequence and interconnections among a myriad of clinical events, providing invaluable insights into the temporal facets of patients’ medical trajectories. This process enhances our understanding of the intricate web of events, contributing to a more nuanced comprehension of patients’ healthcare experiences.
The innovative integration of CEid further enhances the interrelation of these clinical events, providing a foundation for the development of advanced analytical insight. This integration using the multidimensional model of tables provides a holistic perspective on patients’ medical trajectories. Moreover, introduces a range of filters such as “gender”, “process number”, “episode number”, “day of a clinical event”, “age”, and “type of clinical transaction”, empowering decision-makers to meticulously observe and analyze the distinctive clinical journey of each patient over a timeline, especially during their hospital stay. This allows for the identification of trends and patterns within these data.

3.2.1. Length of Stay in ICU

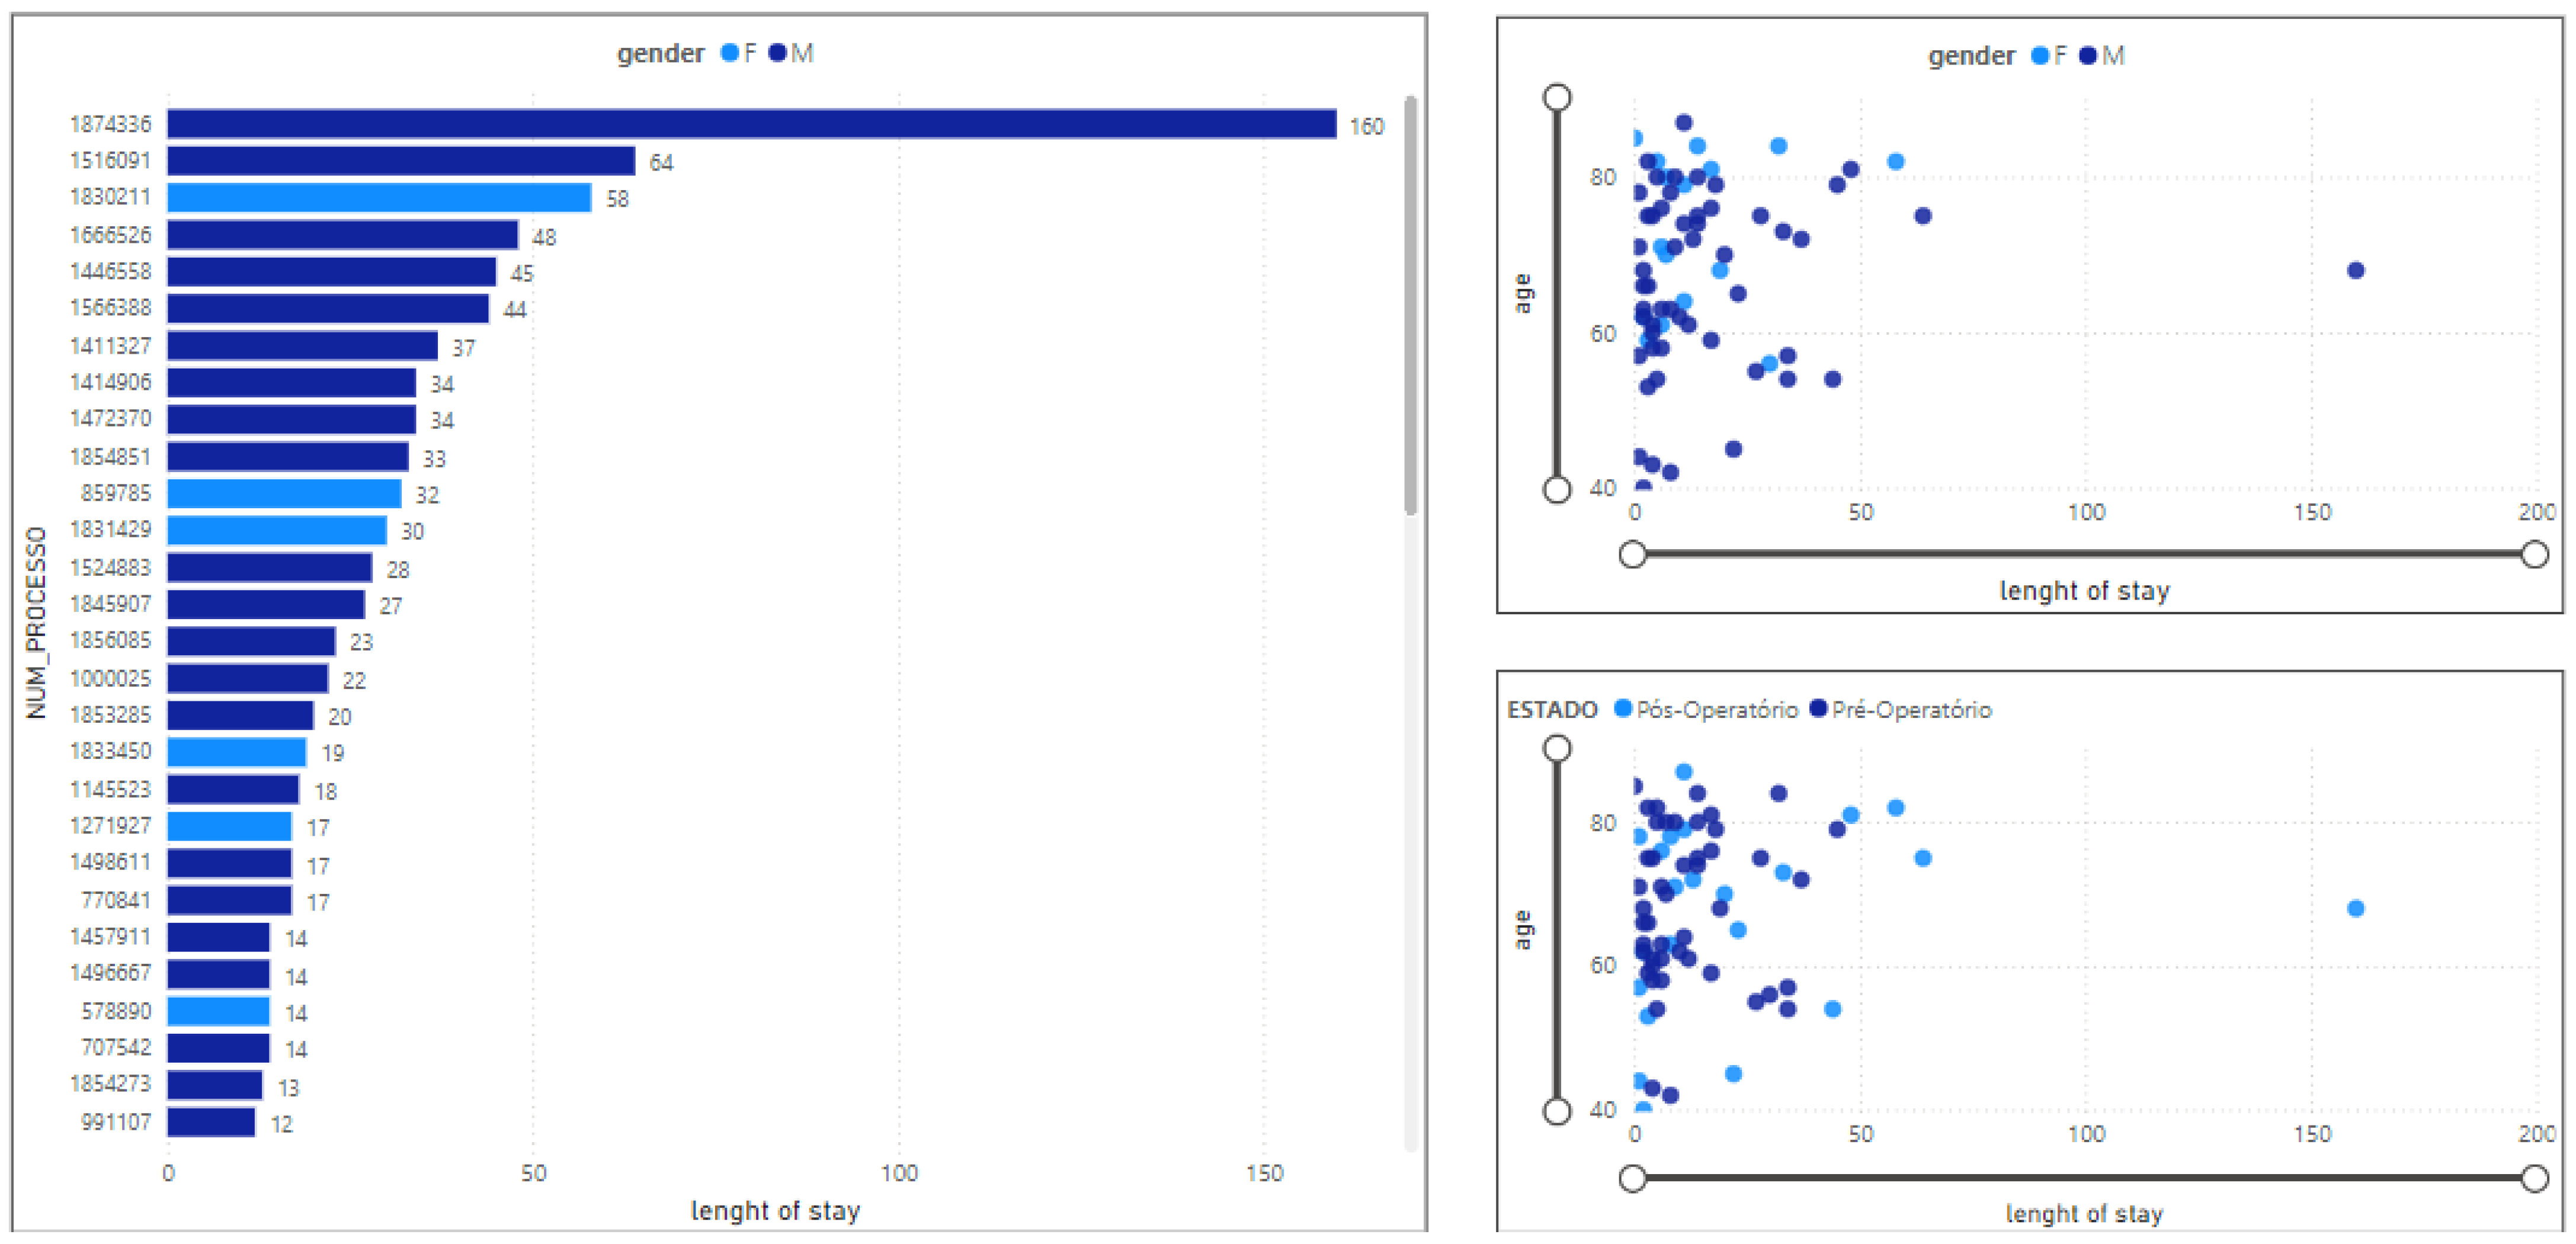
In Figure 4, the bar chart illustrates the length of stay in the ICU for each patient, with the process number serving as the identifier. The legend distinguishes between genders, indicating whether the patient is female or male. Additionally, the presentation includes pre-operation and post-operation distinctions in the scatter chart. Furthermore, a scatter chart showcases the relationship between the length of stay and age. This diverse set of information can be accessed and presented using various filters, providing insights into demographics alongside the length of stay for each patient.
To present a comprehensive view of diverse clinical information on an integrated platform based on the “day of a clinical event”, we focused on a specific patient with a process number equal to “1000025”, as depicted in Figure 5. The total number of clinical transactions (TS) associated with this patient is 7798, with 5977 distinct transactions recorded. Notably, the patient is a 45-year-old male with the pathology code “N979.” Their ICU status indicates “post-operation”, with a total ICU stay of 22 days.

3.2.2. Total Number of Clinical Events

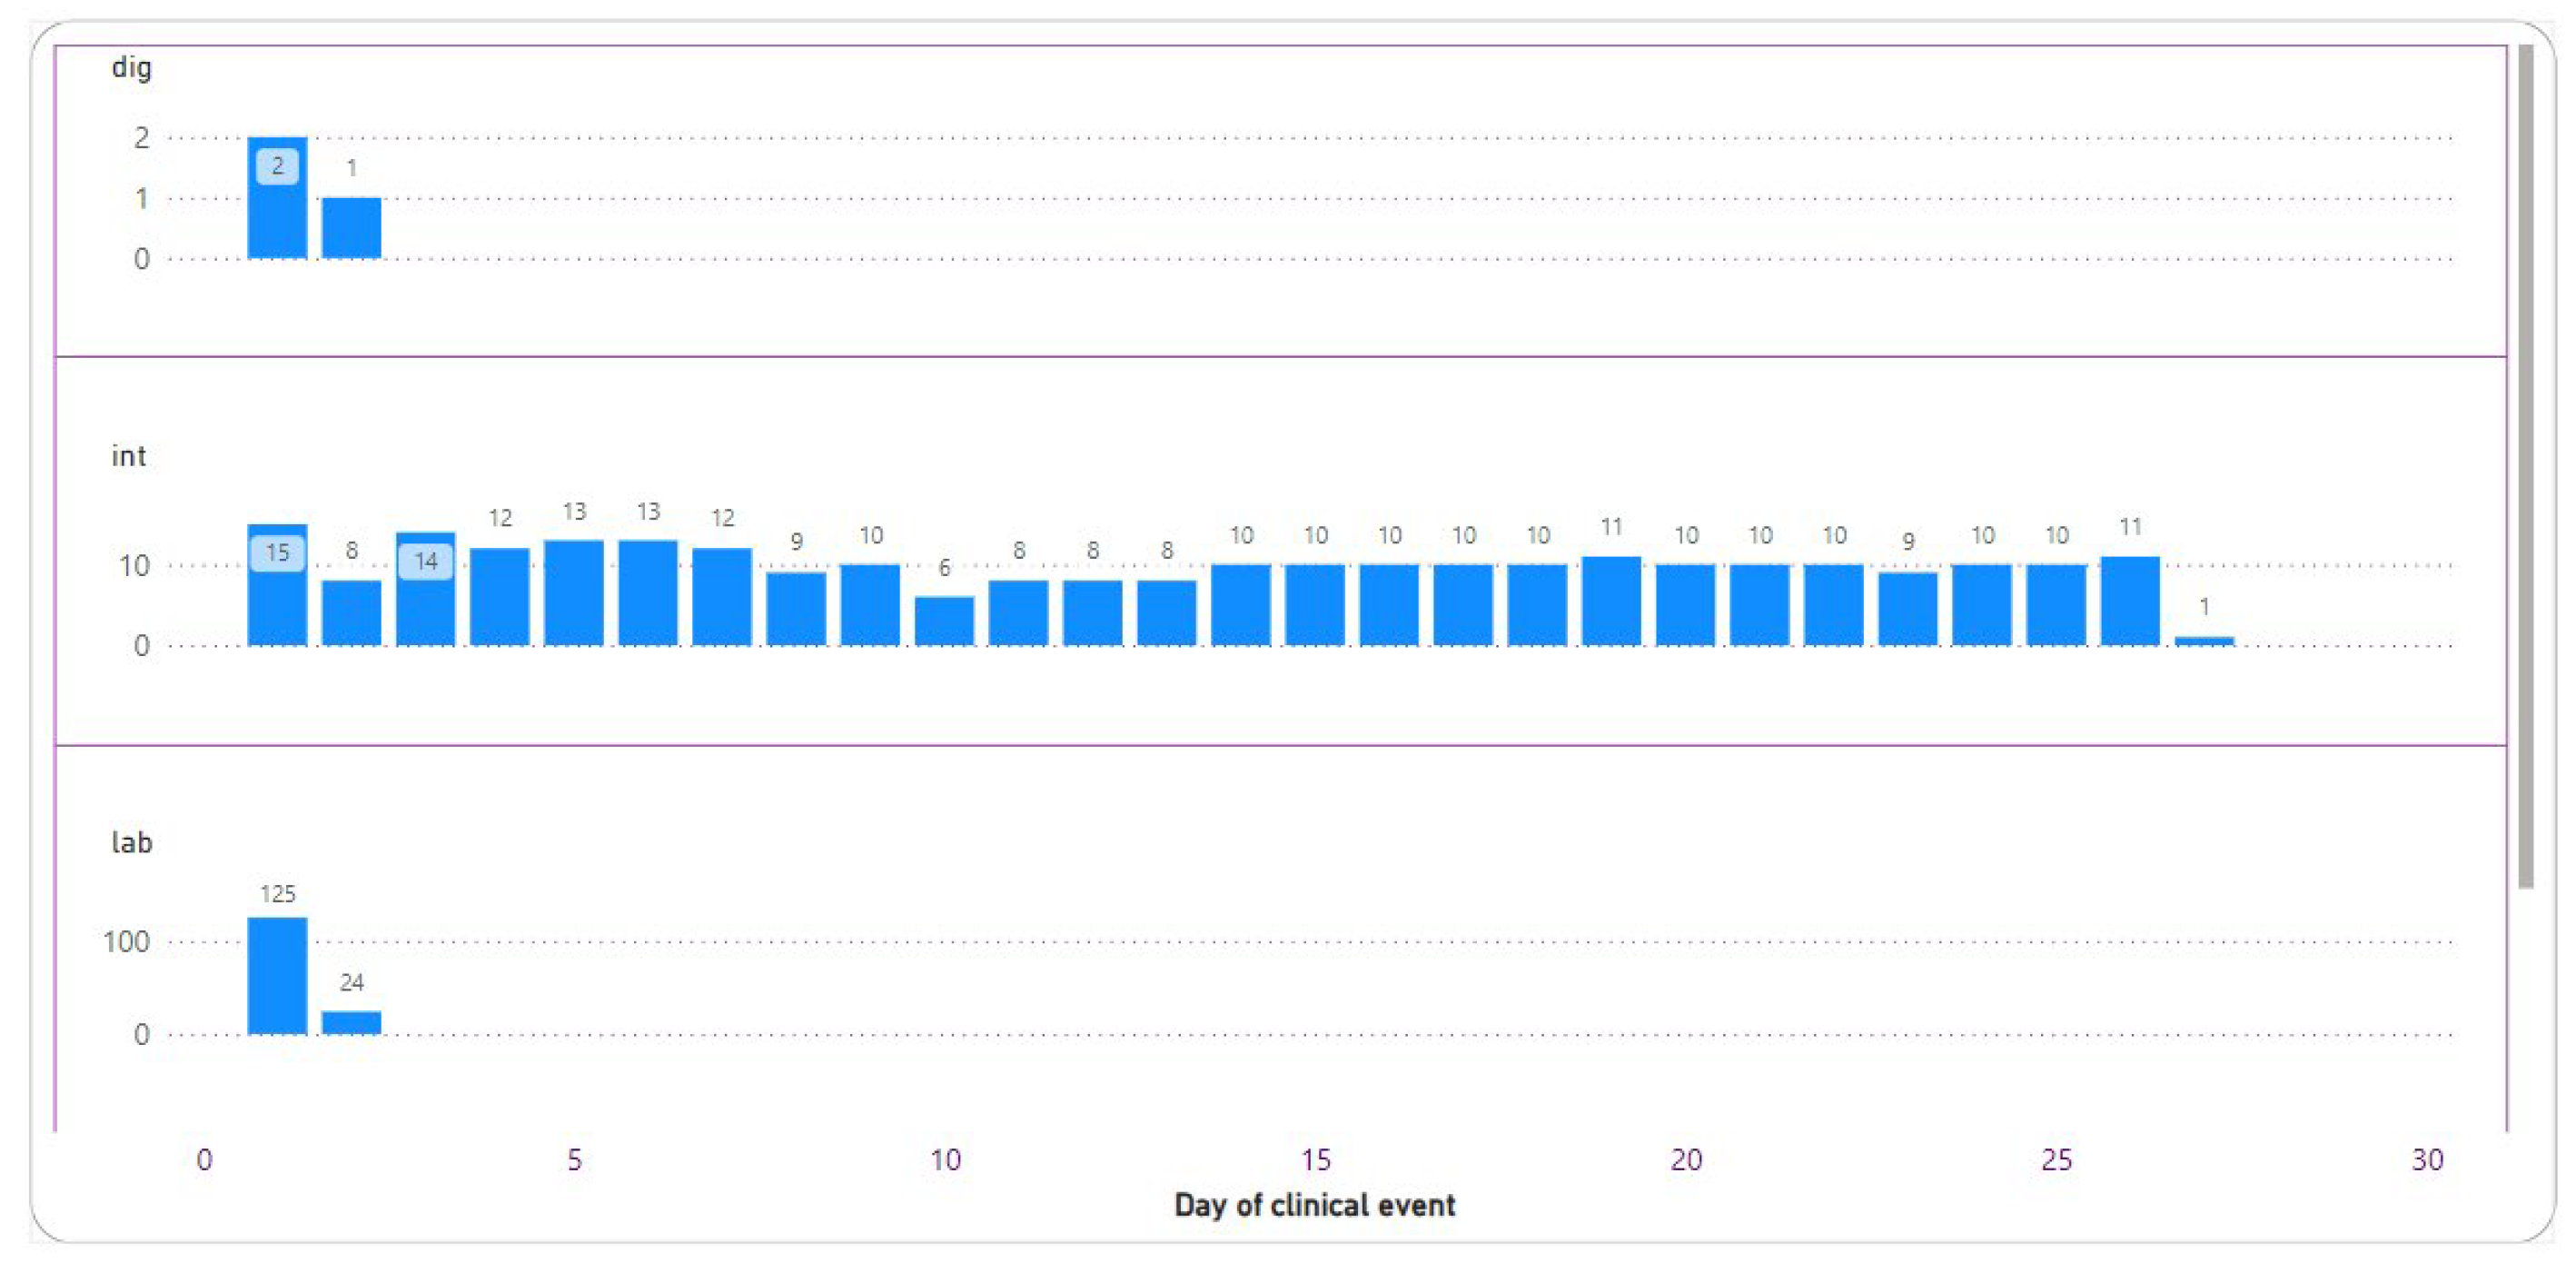
In Figure 6, the x-axis effectively chronicles the progression of days throughout the patient’s tenure in the hospital, while the y-axis aptly quantifies the tally of clinical events, neatly categorized by transaction type.
This informative bar chart represents a filtered view, concentrating on three pivotal event types for patients sharing a common process number of “1000025”: diagnostics (dig), interventions (int), and laboratory exams (lab). A discerning glance at this chart reveals that diagnostic events were notably concentrated on the first two days, with just a few transactions recorded. Furthermore, intervention actions persevered for a remarkable 27-day duration.
Moreover, 125 laboratory exams on day one were reduced to 24 exams on day two.

3.2.3. Diagnostics

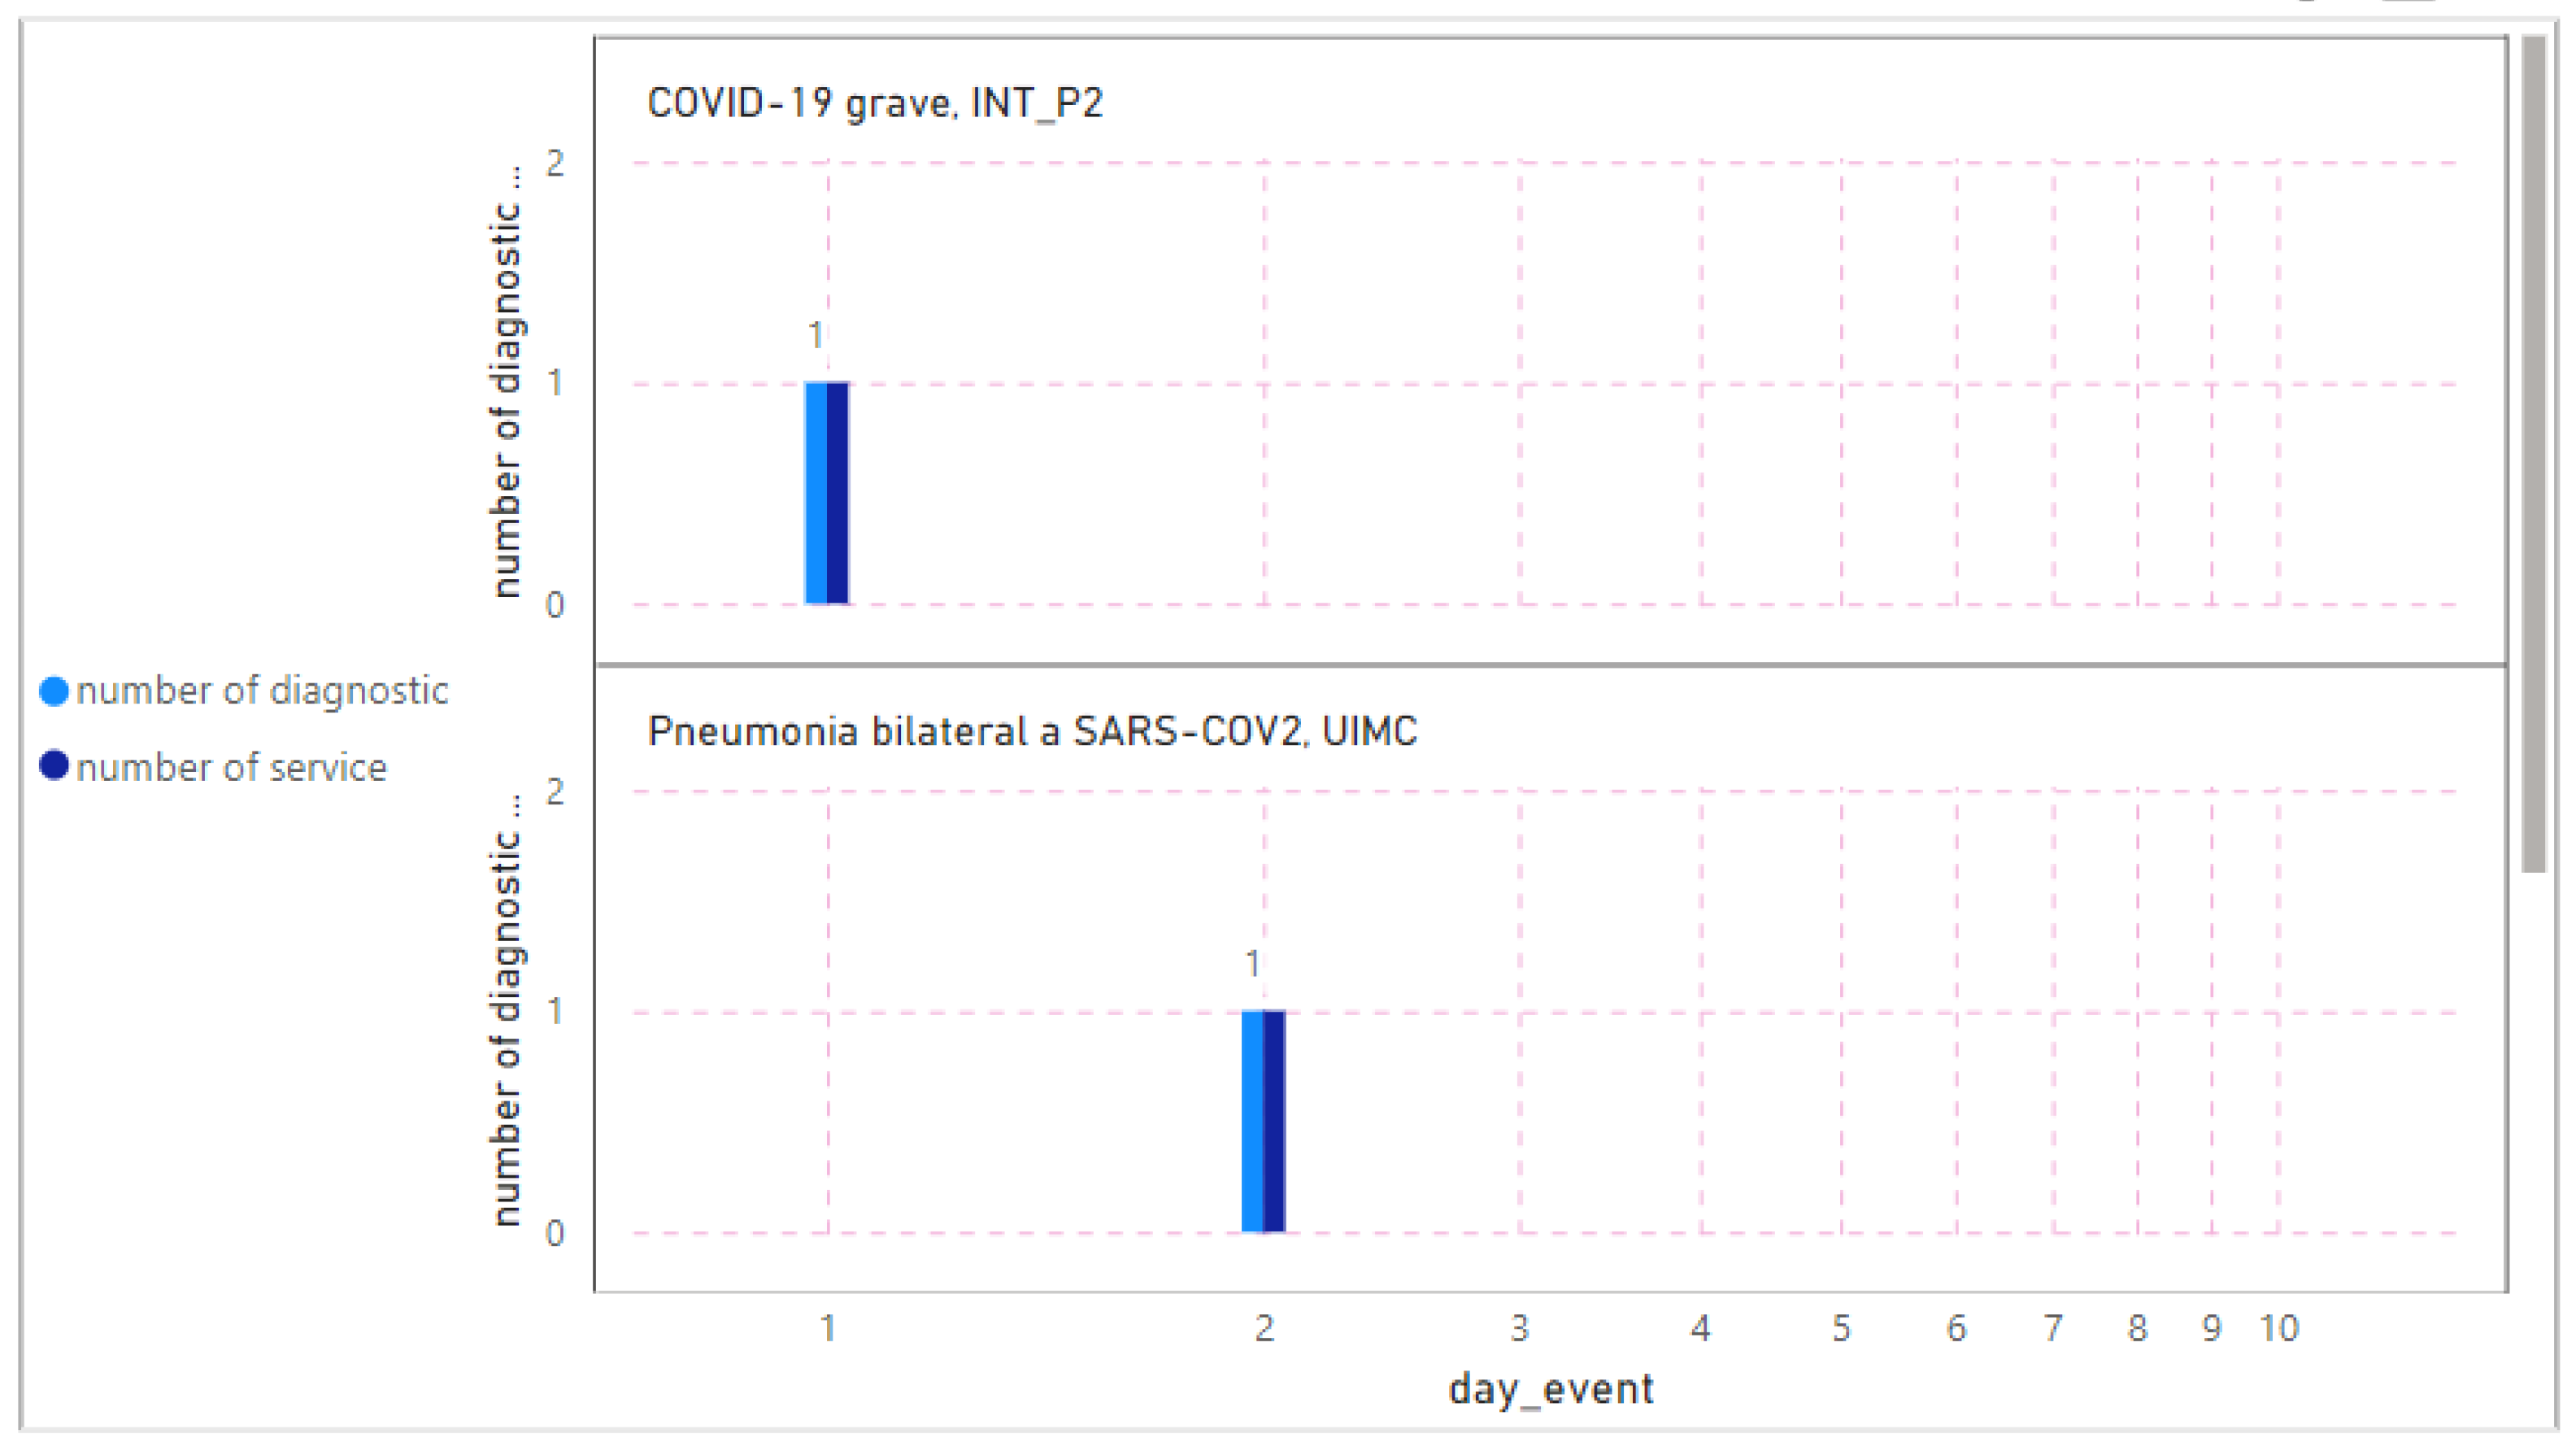
Figure 7 illustrates the number and types of diagnoses for the selected patient. It reveals that COVID-19 was diagnosed on day one, followed by a diagnosis of SARS on day two. This observation and analysis provide valuable insights into the patient’s health status over a distinct period, facilitated by the unique periodic platform of the day of a clinical event.

3.2.4. Intervention

Figure 8 displays two types of interventions repeated from day 1 to day 21 and day 30. The y-axis represents the total number of each specific type of intervention.

3.2.5. Vital Signs

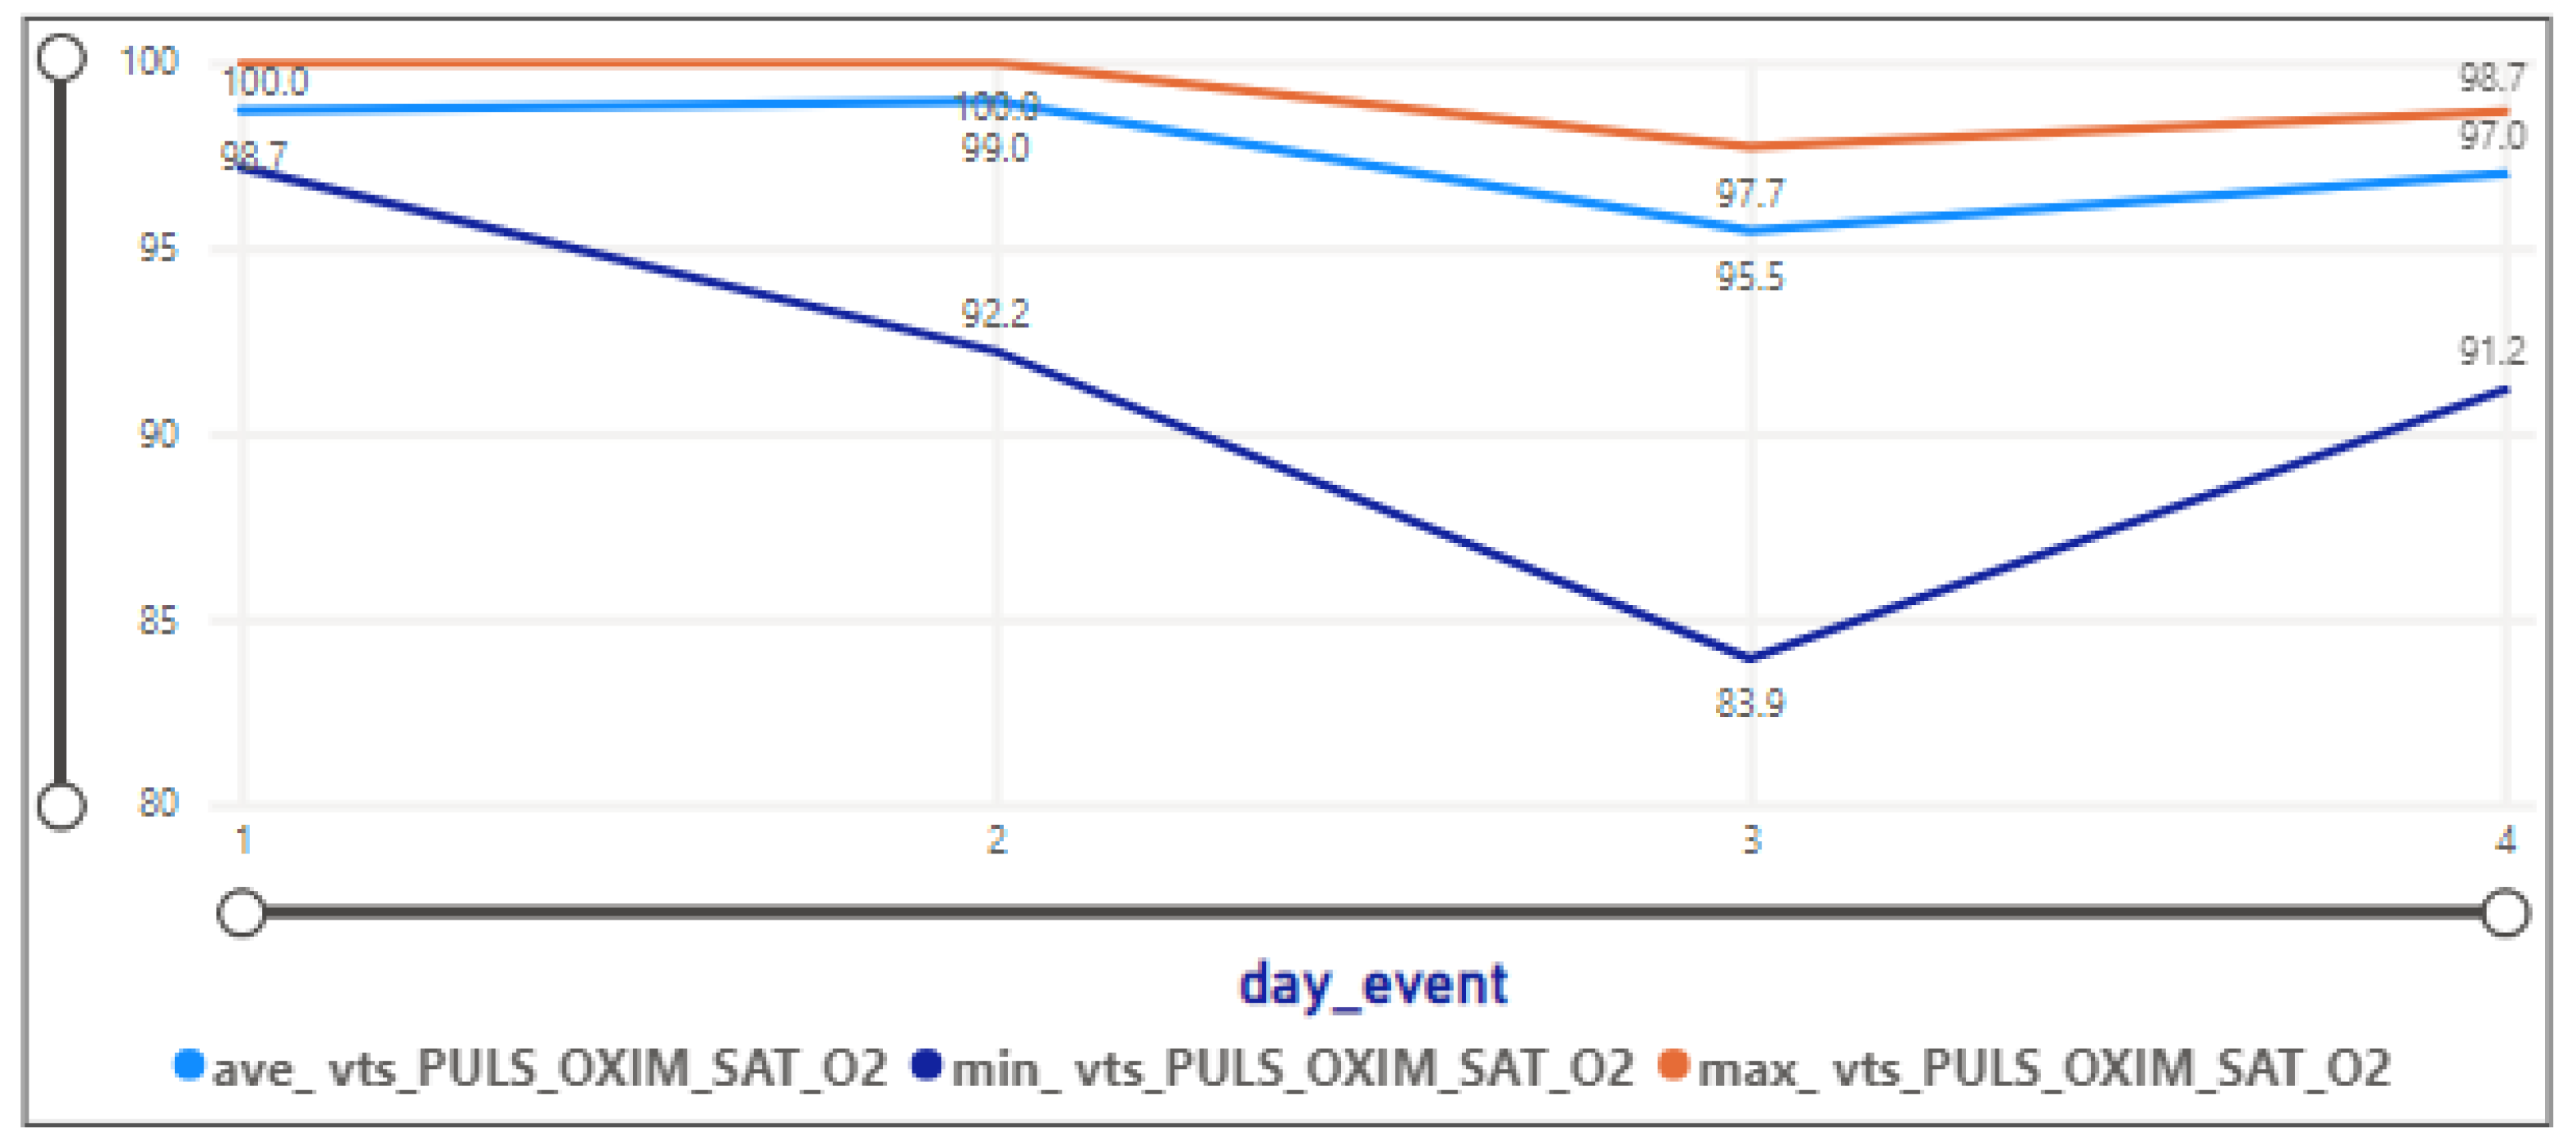
The vital sign dataset includes seven biological indicators registered by sensors in the ICU; after hourly aggregation and transformation, all data points are placed in a timeline regardless of the time and date of data acquisition. Thus, it is possible to monitor the average, minimum, and maximum value of each vital sign during the days of stay in the ICU. Figure 9 presents the fluctuation in the average oxygen saturation value (light blue), the maximum value (orange line), and the minimum value (blue line). The minimum value was observed on day three with a value of 83.9, and the maximum value of oxygen saturation was registered on days one and two with a value of 100. During four days of monitoring, fluctuations in the average value were observed to range between 100 and 97”.
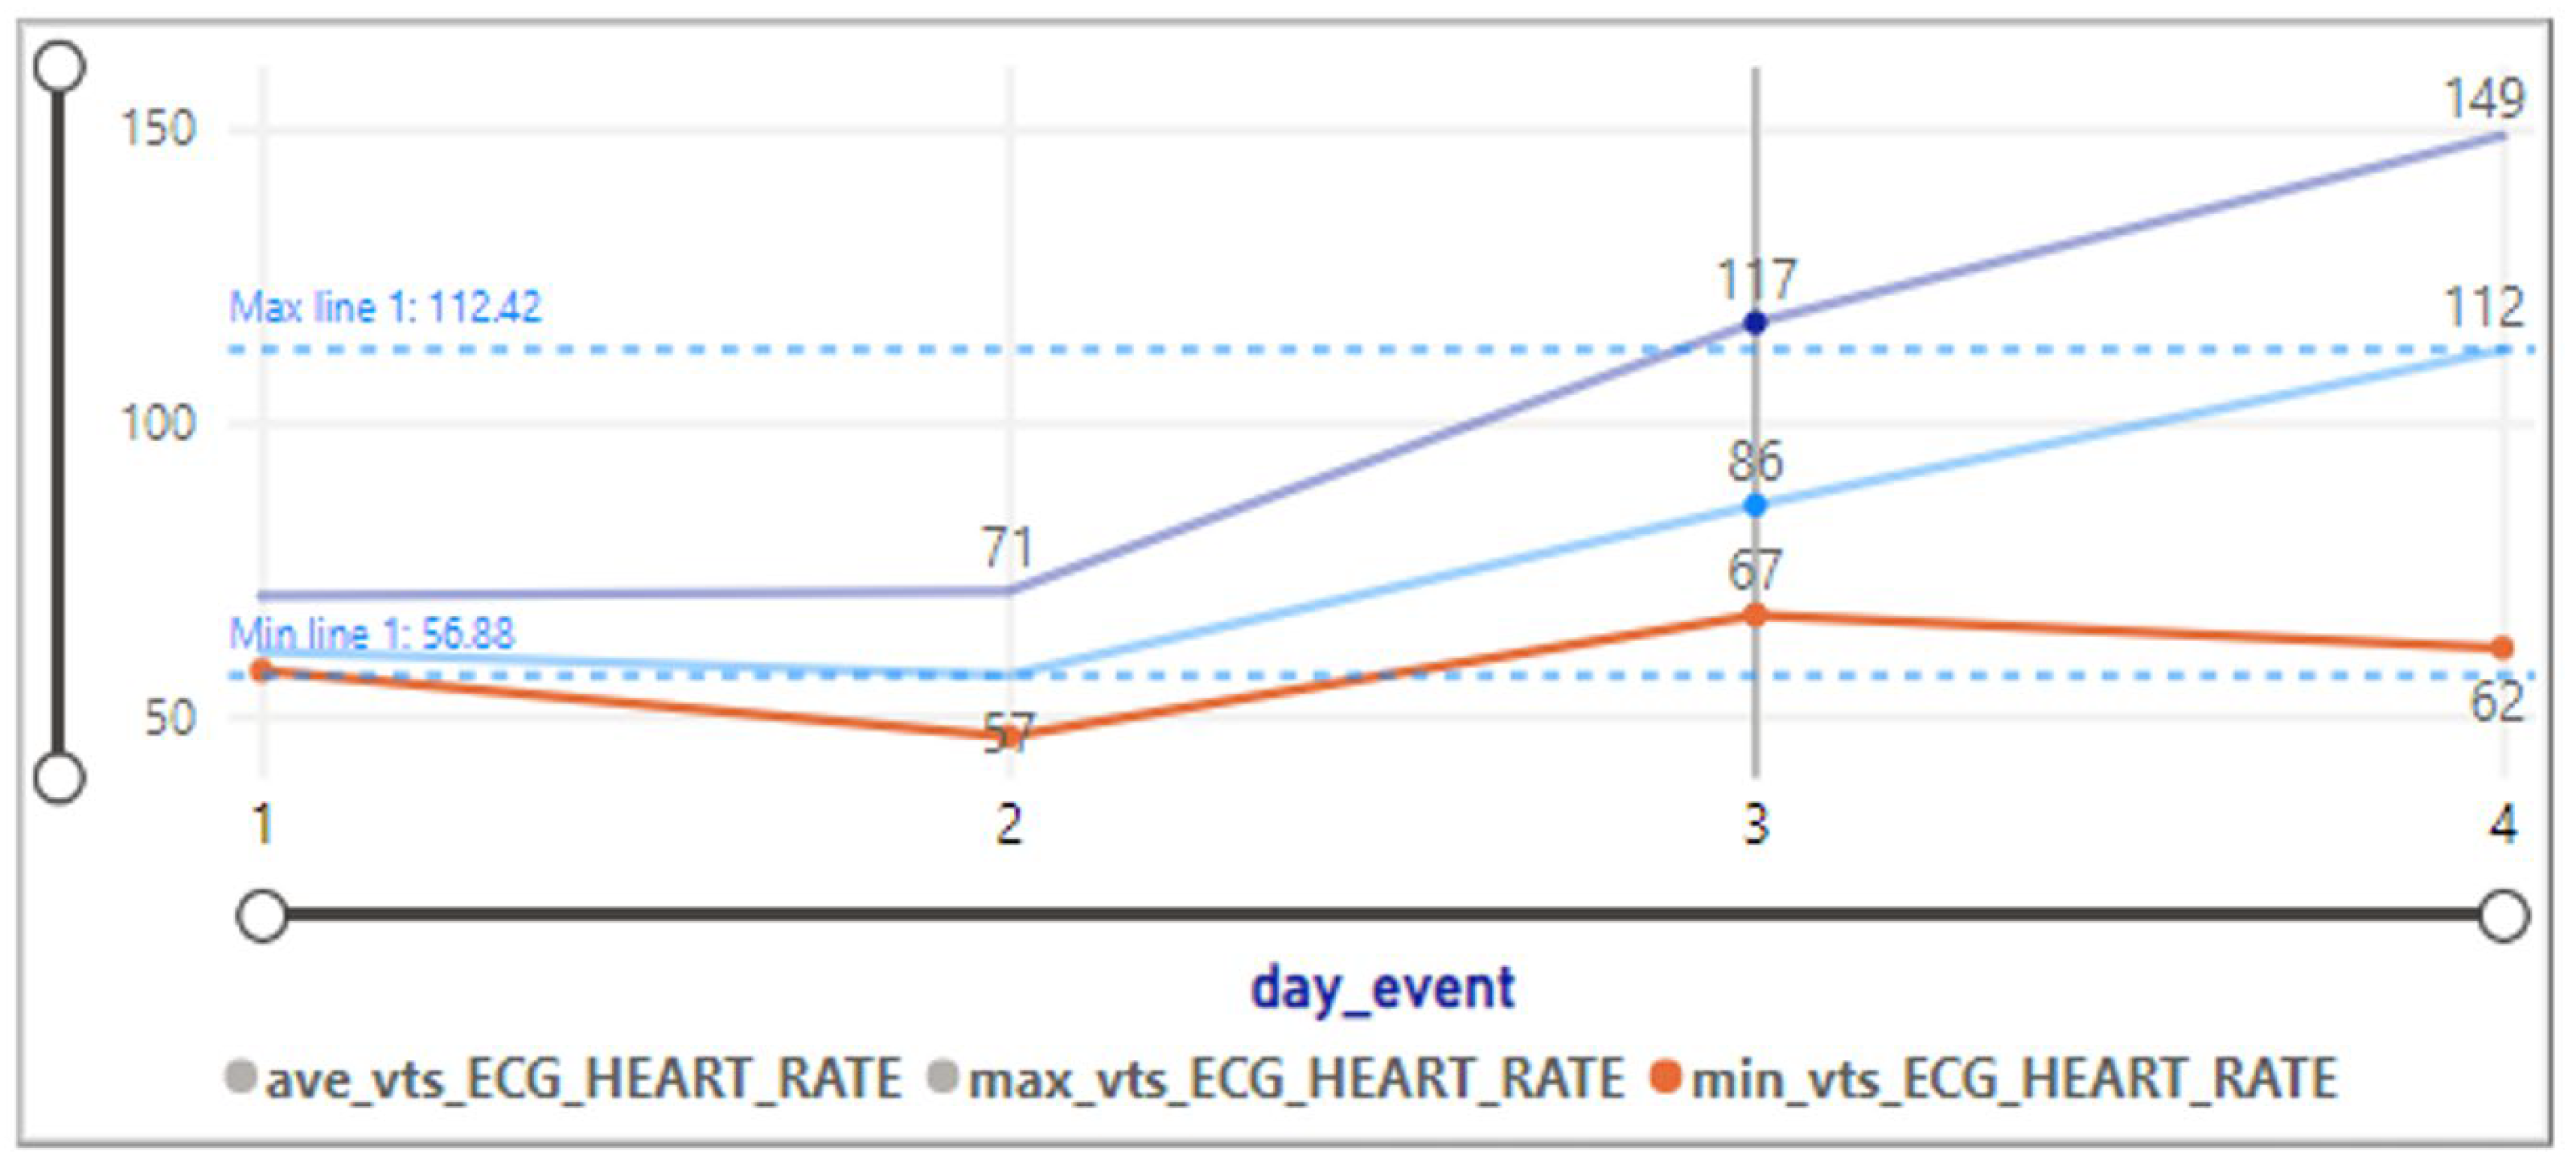
Figure 10 illustrates a line chart that provides a detailed view of the fluctuation in heart rate (HR) values throughout the patient’s stay in the ICU. The y-axis of the chart represents the HR values, showcasing the minimum, maximum, and average HR values recorded each day. This visualization offers valuable insights into the patient’s HR trends during their ICU stay. On the second day of the patient’s admission, the chart indicates a minimum HR value of 56.88 beats per minute (bpm). In contrast, the HR reached its highest point on the fourth day, recording a maximum value of 148.87 bpm.

3.2.6. Laboratory Result

Figure 11 shows the results of laboratory exams under the specific category. We transformed the minimum and maximum references associated with each test to define a conditional column. This feature construction identifies the condition of the result. Based on that, “Lr” means lower than minimum, “mr” is more than maximum, and “nr” means neural. According to the line chart, the number of “Neutrophiles” dropped from 81 to 6 on day one. It means that the value decreased from more than the maximum to a normal level. This method extracts significant information on the condition of a specific patient regarding the particular laboratory exam, and analyzing such information helps clinical decision-makers observe necessary laboratory results over days of stay in the hospital.

3.2.7. Sepsis

Figure 12 presents a graphical representation illustrating the occurrence of four distinct sepsis events over four days. Each instance is denoted by a recorded value, which remained constant at 53 for the first, second, and third days. However, on the fourth day, a noticeable increase is observed, with the recorded value rising to 60. This chart provides a clear and concise visualization of the timeline of sepsis events, offering valuable insight into the progression and severity of these occurrences over the observed period.

3.2.8. Medication Prescription

Figure 13 provides insights into four different types of prescribed medications, complete with average dosages and their respective units of measurement. Notably, on day 26, a prescription for 500 milliliters (mL) of ‘glucose 10%’ was administered. ‘Brometo de ipratropium’ was consistently prescribed from day 14 to day 40 at a fixed dose of 500 milligrams (mg). ‘Colloredo de sodio’ was recommended for 40 days, with varying dosage levels. Last, ‘hydrocortisone’ was prescribed from day 13 to day 26, with a notable decrease in dosage from 200 mg to 50 mg during this period.

3.3. Unveiling Patterns throughout Temporal Clustering Analysis

In preparation for the k-means clustering approach, we focused exclusively on numerical variables, omitting the “Process Number” too. Our data preparation encompassed several crucial steps, including handling missing cells, discarding columns with more than 50% missing values (Glasgow Coma, Sepsis), and eliminating corresponding rows with missing data. This involved meticulous selection of numerical variables, rectifying variable types, and ensuring the dataset’s integrity by addressing duplicates. Consequently, the refined dataset earmarked for clustering comprises six hundred and ninety-two rows and nine variables, each intricately linked to seventy patients across a span of 39 days of clinical events.
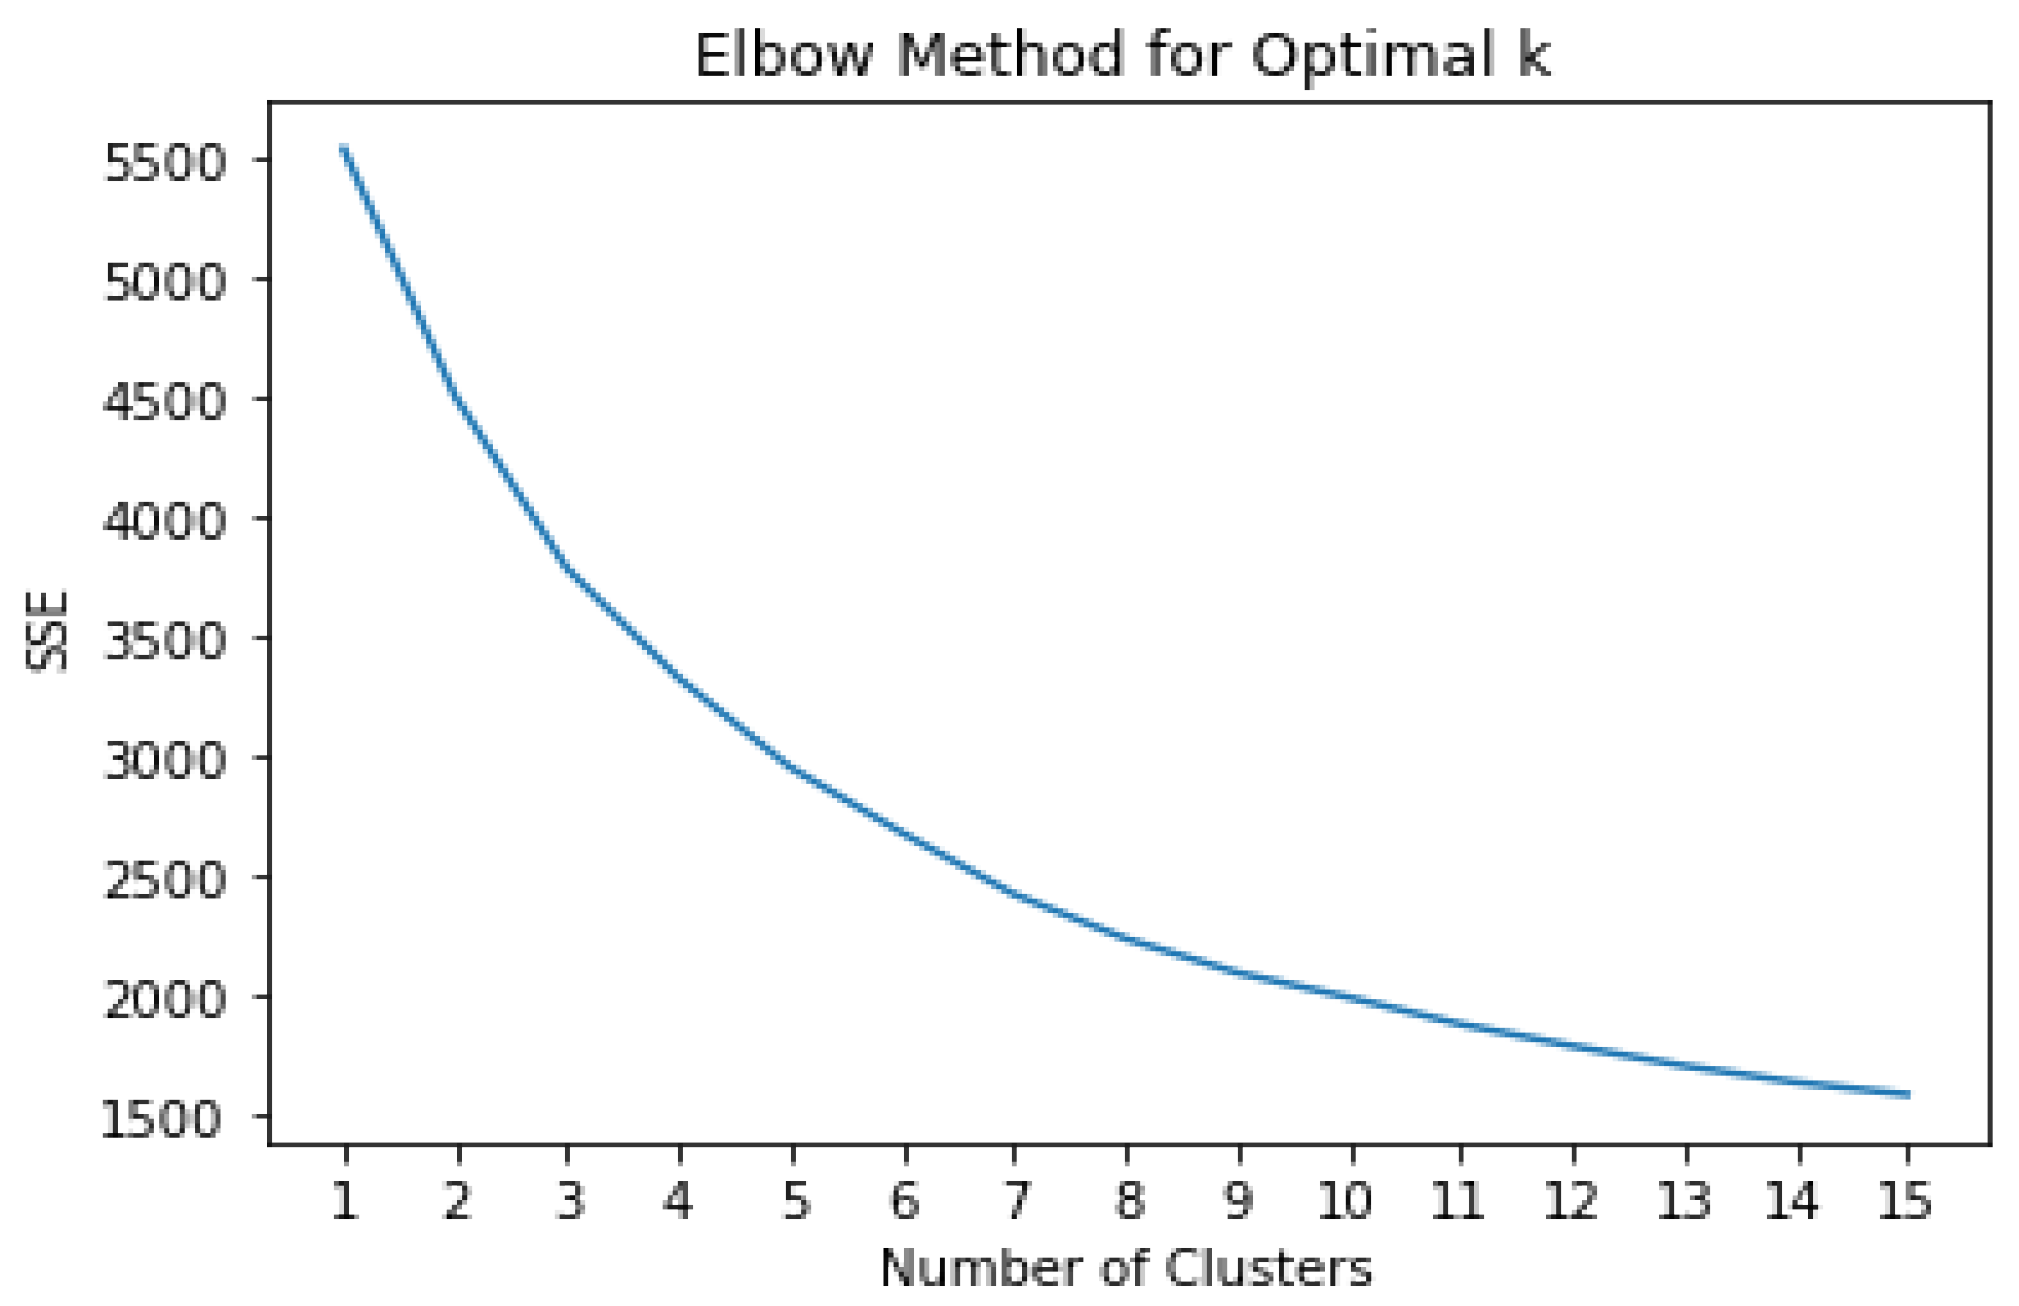
To choose the optimal number of clusters, we used the elbow method. Figure 14 depicts the application of the elbow method to determine the optimal number of clusters. In addition to the elbow method, we explored a cluster range from n = 2 to n = 7, utilizing the average silhouette score for each cluster configuration. Through this analysis, we identified n = 4 as the optimal number of clusters, ensuring a balance between cohesion within clusters and separation between clusters. The silhouette score is a valuable metric for assessing the quality of clustering, and our approach aimed to leverage it effectively in determining the most suitable cluster count for the given dataset.

3.3.1. Identifying Patterns and Cluster References

To analyze the characteristics of each cluster, we extracted the average and standard deviation (std) of each variable in each cluster. The presented Table 4 outlines key numerical indicators across four distinct clusters (CLUSTER 0, CLUSTER 1, CLUSTER 2, and CLUSTER 3), each characterized by a silhouette score denoting the cohesion and separation of data points within the cluster. Additionally, the table includes data distribution statistics, specifying the number of data points (rows) in each cluster.
  • The key observation of Cluster 0 with the silhouette score equal to 0.23 and data distribution equal to 271 rows shows:
    The average pulse rate of the arterial blood pressure is 100.66, with a standard deviation of 12.20.
    Diastolic arterial blood pressure is around 64.18, with a standard deviation of 9.6.
    Systolic arterial blood pressure is notably higher at 118.81, with a standard deviation of 15.46.
    Mean arterial blood pressure is 82.65, with a standard deviation of 11.14.
    Heart rate is 99.18, with a standard deviation of 17.49.
    The pulse oximetry oxygen saturation level is relatively high at 94.21, with a small standard deviation of 4.44.
    Body temperature is around 36.17, with a standard deviation of 1.27.
    The day of the clinical event is, on average, 10.60, with a relatively high standard deviation of 8.00.
  • Cluster 1, with a silhouette score equal to 0.12 and data distribution of 44, has a lower silhouette score, indicating less cohesion and separation.
    Variables exhibit higher standard deviations, suggesting greater variability within this cluster.
    Body temperature has a relatively high standard deviation of 2.72, indicating variability in this aspect.
  • Cluster 2 silhouette has a higher silhouette score, suggesting better-defined clusters (score: 0.26), and the data distribution is equal to 285 rows. In this cluster
    Variables such as systolic arterial blood pressure and mean arterial blood pressure show significant variability with standard deviations of 15.13 and 12.20, respectively.
    The pulse oximetry oxygen saturation level has a low standard deviation, indicating more consistency.
  • Cluster 3 has the highest silhouette score, indicating well-defined clusters (silhouette score: 0.36), and data distribution is equal to 92 rows. The key observations show:
    Systolic arterial blood pressure is notably high at 129.29, with a standard deviation of 15.13.
The day of the clinical event has the lowest average at 4.98, suggesting events are concentrated around this day.
In terms of any possible trends and patterns:
  • Cluster 3 stands out with the highest silhouette score, indicating the most distinct cluster.
    Systolic arterial blood pressure is a key differentiator among clusters, with Cluster 3 having the highest values.
The day of the clinical event shows variation, with Cluster 2 having the highest average and Cluster 3 having the lowest.
In this phase, we extracted the minimum and maximum values for each variable within every cluster. These extremal values serve as proximate references to be applied to the original dataset. By filtering the original dataset based on these boundaries, each data point is assigned to its respective cluster.
Table 3 shows the minimum and maximum values of each variable across all clusters, offering a comprehensive overview of the distribution and range within each cluster.
Based on that, the subsequent section of the table details the minimum (min) and maximum (max) values for various physiological parameters within each cluster. For instance, parameters such as pulse rate, arterial blood pressure, heart rate, oxygen saturation level, body temperature, and the day of the clinical event are captured. These min-max values offer a comprehensive view of the range and variability of each parameter within the respective clusters. For example, in CLUSTER 0, the pulse rate of arterial blood pressure ranges from 70.54 to 144.32, providing insights into the dispersion of this physiological metric within that specific cluster. This detailed breakdown facilitates a nuanced understanding of how clusters differ in terms of physiological characteristics. In addition, it will facilitate mapping and cluster assignments (next phase).

3.3.2. Cluster-Based Mapping and Assignment

This phase encompasses crucial steps aimed at grouping similar data points, both categorically and numerically. As illustrated in Figure 15, our initial approach involves leveraging cluster references for data extraction, followed by assigning clusters and data mapping. Subsequently, we meticulously analyze each cluster to gain insights and draw meaningful conclusions.
In this pivotal phase, our focus was on translating the identified clusters into actionable insights within the original dataset. Leveraging the minimum and maximum values established for each numerical variable in every cluster, we meticulously mapped and assigned rows to their corresponding clusters. By employing these cluster references, we extracted pertinent data points from the original dataset and systematically tagged each entry with its designated cluster number.
By determining cluster references through the minimum and maximum values of each variable within each cluster, we not only surmounted the challenge of clustering mixed data types but also successfully addressed the grouping of columns with 50% missing data previously omitted during clustering.
This pioneering approach emerged as a cornerstone, seamlessly accommodating the diversity inherent in clinical data types—both categorical and numerical. The final step involved a thorough observation and analysis of each profile, offering a comprehensive understanding of the distinctive characteristics encapsulated within every cluster.

3.3.3. Cluster Overview

In the current phase of our study, we have successfully mapped and assigned clusters to a dataset comprising 1,631,242 records, encompassing 19 variables. This comprehensive analysis allows us to understand the distribution of data across different clusters, providing valuable insights into distinct health patterns.
Based on that, the total size of mapped clusters is 1,631,242 rows with 19 variables. The individual Cluster Breakdown shows:
  • Cluster 0: 598,266 rows
  • Cluster 1: 110,042 rows
  • Cluster 2: 593,192 rows
  • Cluster 3: 325,289 rows
It is noteworthy that, within the total dataset, there are 4453 unclustered data points. These unclustered data points represent instances that may not align with the identified patterns in the current clustering approach or could have missing/distinctive values that need further investigation.
This cluster distribution summary provides a clear overview of the sizes and composition of each cluster, setting the stage for more detailed analyses and insights into the specific characteristics associated with each health pattern. Additionally, attention to unclustered data points allows for a more comprehensive understanding of the dataset and potential areas for refinement in future analyses.

3.3.4. Exploring Health Profiles

Analyzing the minimum, maximum, and mean variables in each cluster enhances the ability to understand the distribution of health parameters, identify characteristic patterns, and glean insights into the diverse health profiles. These insights, as shown in Table 5, contribute to more informed decision-making and the development of precise healthcare strategies.
  • Cluster 0:
    The day of the clinical event ranges from 1 to 37, with a mean of 1.06. events are spread across the observed period.
    Glasgow Coma Scale: Varies between 3 and 15, with a mean of 12.27. Indicates a range of consciousness levels, potentially reflecting diverse patient conditions.
    Sepsis: Ranged from 61 to 63, with a mean of 61.13. This variable shows minimal variability within the cluster.
    Arterial blood pressure ranges from 70.54 to 136.56, with a mean of 111.04. Suggests a spectrum of blood pressure levels, potentially indicating varying severity of cardiovascular conditions.
    Systolic arterial blood pressure varies between 77.92 and 114.91, with a mean of 108.65. Indicates a range of systolic blood pressure levels.
    Mean arterial blood pressure ranges from 48.81 to 104.75, with a mean of 96.04. Indicates variations in overall blood pressure within the cluster.
    Diastolic arterial blood pressure varies from 31.27 to 38.01, with a mean of 64.57. Shows a range of diastolic blood pressure levels.
    Temperature: Consistent at a mean of 36.52, reflecting stability in body temperature within the cluster.
    Oxygen saturation levels range from 49.18 to 99.13, with a mean of 96.04. Indicates variability in oxygen saturation.
    Heart rate varies between 47.72 and 137.94, with a mean of 107.05. Shows a range of heart rates within the cluster.
    The laboratory results display a wide range, spanning from −0.6 to 88,033, with an average value of 109.55. This considerable variability suggests a spectrum of diverse clinical conditions.
  • Cluster 1:
    Event Day: Similar to Cluster 0, with a mean of 1.09, indicating events spread across the observed period.
    Glasgow Coma Scale: Consistently low at 5.33, indicating a uniform level of consciousness within the cluster.
    Sepsis: Not provided, limiting insights into this variable.
    arterial blood pressure ranges from 45.15 to 88.72, with a mean of 90.43. Indicates a moderate range of blood pressure levels.
    Systolic arterial blood pressure varies between 31.65 and 60.13, with a mean of 55.58. Indicates a range of systolic blood pressure levels.
    Mean arterial blood pressure ranges from 10.83 to 53.51, with a mean of 27.02. Shows variability in overall blood pressure within the cluster.
    Diastolic arterial blood pressure varies from 23.54 to 38.64, with a mean of 35.65. Shows a range of diastolic blood pressure levels.
    Temperature: Consistent at a mean of 27.02, reflecting stability in body temperature within the cluster.
    Oxygen saturation levels range from 57.39 to 142.82, with a mean of 73.15. Indicates variability in oxygen saturation.
    Heart rate varies widely from 0 to 59,065.7, with a mean of 77.68. The wide range may be due to potential outliers.
  • Cluster 2:
    Day of clinical event: Similar to Clusters 0 and 1, with a mean of 1.09, indicating events spread across the observed period.
    Glasgow Coma Scale: Varies between 7 and 15, with a mean of 14.52. Indicates a higher level of consciousness within the cluster.
    Sepsis: Ranges from 28 to 66, with a mean of 51.18. This variable shows variability within the cluster.
    Arterial blood pressure ranges from 42.69 to 101.35, with a mean of 79.01. Indicates a moderate range of blood pressure levels.
    Systolic arterial blood pressure varies between 67.61 and 149.12, with a mean of 101.39. Indicates a range of systolic blood pressure levels.
    Mean arterial blood pressure ranges from 37.01 to 98.28, with a mean of 93.86. Shows variability in overall blood pressure within the cluster.
    Diastolic arterial blood pressure varies from 31.04 to 38.64, with a mean of 56.27. Shows a range of diastolic blood pressure levels.
    Temperature: Consistent at a mean of 30.01, reflecting stability in body temperature within the cluster.
    Oxygen saturation levels range from 57.85 to 142.82, with a mean of 80.84. Indicates variability in oxygen saturation.
    Heart rate varies between −1 and 44,302.5, with a mean of 75.21. The wide range may be due to potential outliers.
  • Cluster 3:
    Day of clinical event: Similar to Clusters 0 and 1, with a mean of 1.22, indicating events spread across the observed period.
    Glasgow Coma Scale: Varies between 3 and 15, with a mean of 14.11. Indicates a higher level of consciousness within the cluster.
    Sepsis: Ranges from 39 to 97, with a mean of 49.97. This variable shows variability within the cluster.
    Arterial blood pressure ranges from 55.28 to 121.17, with a mean of 74.88. Indicates a moderate range of blood pressure levels.
    Systolic arterial blood pressure varies between 58.62 and 103.86, with a mean of 128.07. Indicates a range of systolic blood pressure levels.
    The mean arterial blood pressure ranges from 43.49 to 84.62, with a mean of 95.41. Shows variability in overall blood pressure within the cluster.
    Diastolic arterial blood pressure varies from 16.75 to 32.63, with a mean of 64.98. Shows a range of diastolic blood pressure levels.
    Temperature: Consistent at a mean of 36.53, reflecting stability in body temperature within the cluster.
    Oxygen saturation levels range from 86.72 to 99, with a mean of 95.41. Indicates variability in oxygen saturation.
    Heart rate varies between −0.35 and 49,300, with a mean of 80.84. The wide range may be due to potential outliers.
While the comprehensive interpretation of physiological indicators necessitates domain knowledge and expertise to optimize their utility in clinical decision-making, a preliminary analysis provides an overarching glimpse into the trends and variations across distinct clusters. This preliminary assessment can serve as a foundation for further, more nuanced investigations, acknowledging the importance of domain-specific insights for a more refined understanding.

3.4. Insight into the Data Behavior within Clusters

The below visual presentations (Figure 16, Figure 17, Figure 18, Figure 19, Figure 20, Figure 21, Figure 22, Figure 23, Figure 24, Figure 25 and Figure 26) demonstrate a general view of the mean, maximum, and minimum values associated with each numerical indicator based on each cluster. Analyzing the patterns and trends across the clusters reveals valuable insights into the characteristics of each group:

3.4.1. Glasgow Coma Scale (GSC)

Based on Figure 16, Clusters 2 consistently exhibit higher mean GCS values (15),
Cluster 1, with mean GCS values of 5, represents groups with relatively low consciousness levels.

3.4.2. Systolic Arterial Blood Pressure

According to Figure 17, Cluster 2 exhibits the highest values for the minimum, maximum, and average systolic arterial blood pressure, while Cluster 1 demonstrates the lowest values for these parameters.
Likewise, the mean arterial blood pressure is highest in Cluster 3 and lowest in Cluster 1, as illustrated in Figure 18.
Furthermore, Figure 19 shows that the pulse rate of arterial blood pressure demonstrates its highest values (maximum, minimum, mean) within Cluster 0, while the lowest values are observed in Cluster 1.
In Figure 20, Cluster 0 exhibits the highest minimum, maximum, and average values of diastolic arterial blood pressure, while these values are notably lower in Cluster 1.

3.4.3. Oxygen Saturation

Based on Figure 21, Clusters 0, 2, and 3 display elevated maximum oxygen saturation levels (99), with cluster 0 boasting the highest average value (96) and the lowest minimum value (49).

3.4.4. Heart Rate

In Figure 22, it is notable that Cluster 1 exhibits a higher mean heart rate of 143, along with the highest average heart rate of 107. Conversely, Cluster 0 displays the lowest minimum heart rate at 48, suggesting heightened cardiovascular activity within this cluster.

3.4.5. Temperature

The temperature remains relatively stable across Clusters 0 and 2. However, according to Figure 23, Cluster 1 displays the highest maximum value of body temperature (39), while Cluster 3 exhibits the lowest minimum body temperature at 17.

3.4.6. Sepsis

From Figure 24, it is evident that Cluster 0 displays minimal variability in sepsis (ranging from 61 to 63), hinting at a relatively uniform response to sepsis within this group. On the other hand, Cluster 2 exhibits moderate variability (ranging from 28 to 66), indicating differing degrees of sepsis conditions within the cluster. Additionally, Cluster 3 demonstrates the highest maximum value of sepsis at 97, while the lowest minimum value is found in Cluster 2 at 28.

3.4.7. Days of Clinical Events

The average day of clinical events across all clusters is approximately 1.1, suggesting a relatively even distribution of events throughout the observed period. However, as depicted in Figure 25, Cluster 1 exhibits the highest number of maximum days associated with clinical transactions (39 days), while Cluster 3 has the least (19 days).
In summary, considering the vital signs, Clusters 0 and 3 appear to represent groups with more critical conditions, as indicated by higher GCS values, elevated blood pressure, and a wider range of laboratory results. Moreover, Cluster 1 signifies a group with consistently lower GCS, moderate blood pressure, and wider variability in heart rate and laboratory results. Additionally, Cluster 2 reflects a mix of conditions, with higher GCS, moderate blood pressure, and variability in oxygen saturation and sepsis indicators. These trends provide a foundation for further investigation and highlight the need for domain-specific knowledge to interpret the clinical significance of the observed patterns. Additionally, outlier detection and data validation are crucial for a more accurate understanding of the dataset.

3.4.8. Temporal Distribution of Clusters

One of the paramount advantages of temporal analysis lies in its capability to delve into the behavioral patterns of clusters over time. In this context, proposing the utilization of CEid facilitates the extraction of clinical event data daily during the clustering phase-processing. This step significantly advances the identification of patterns and trends over time, offering a more comprehensive understanding of temporal dynamics.
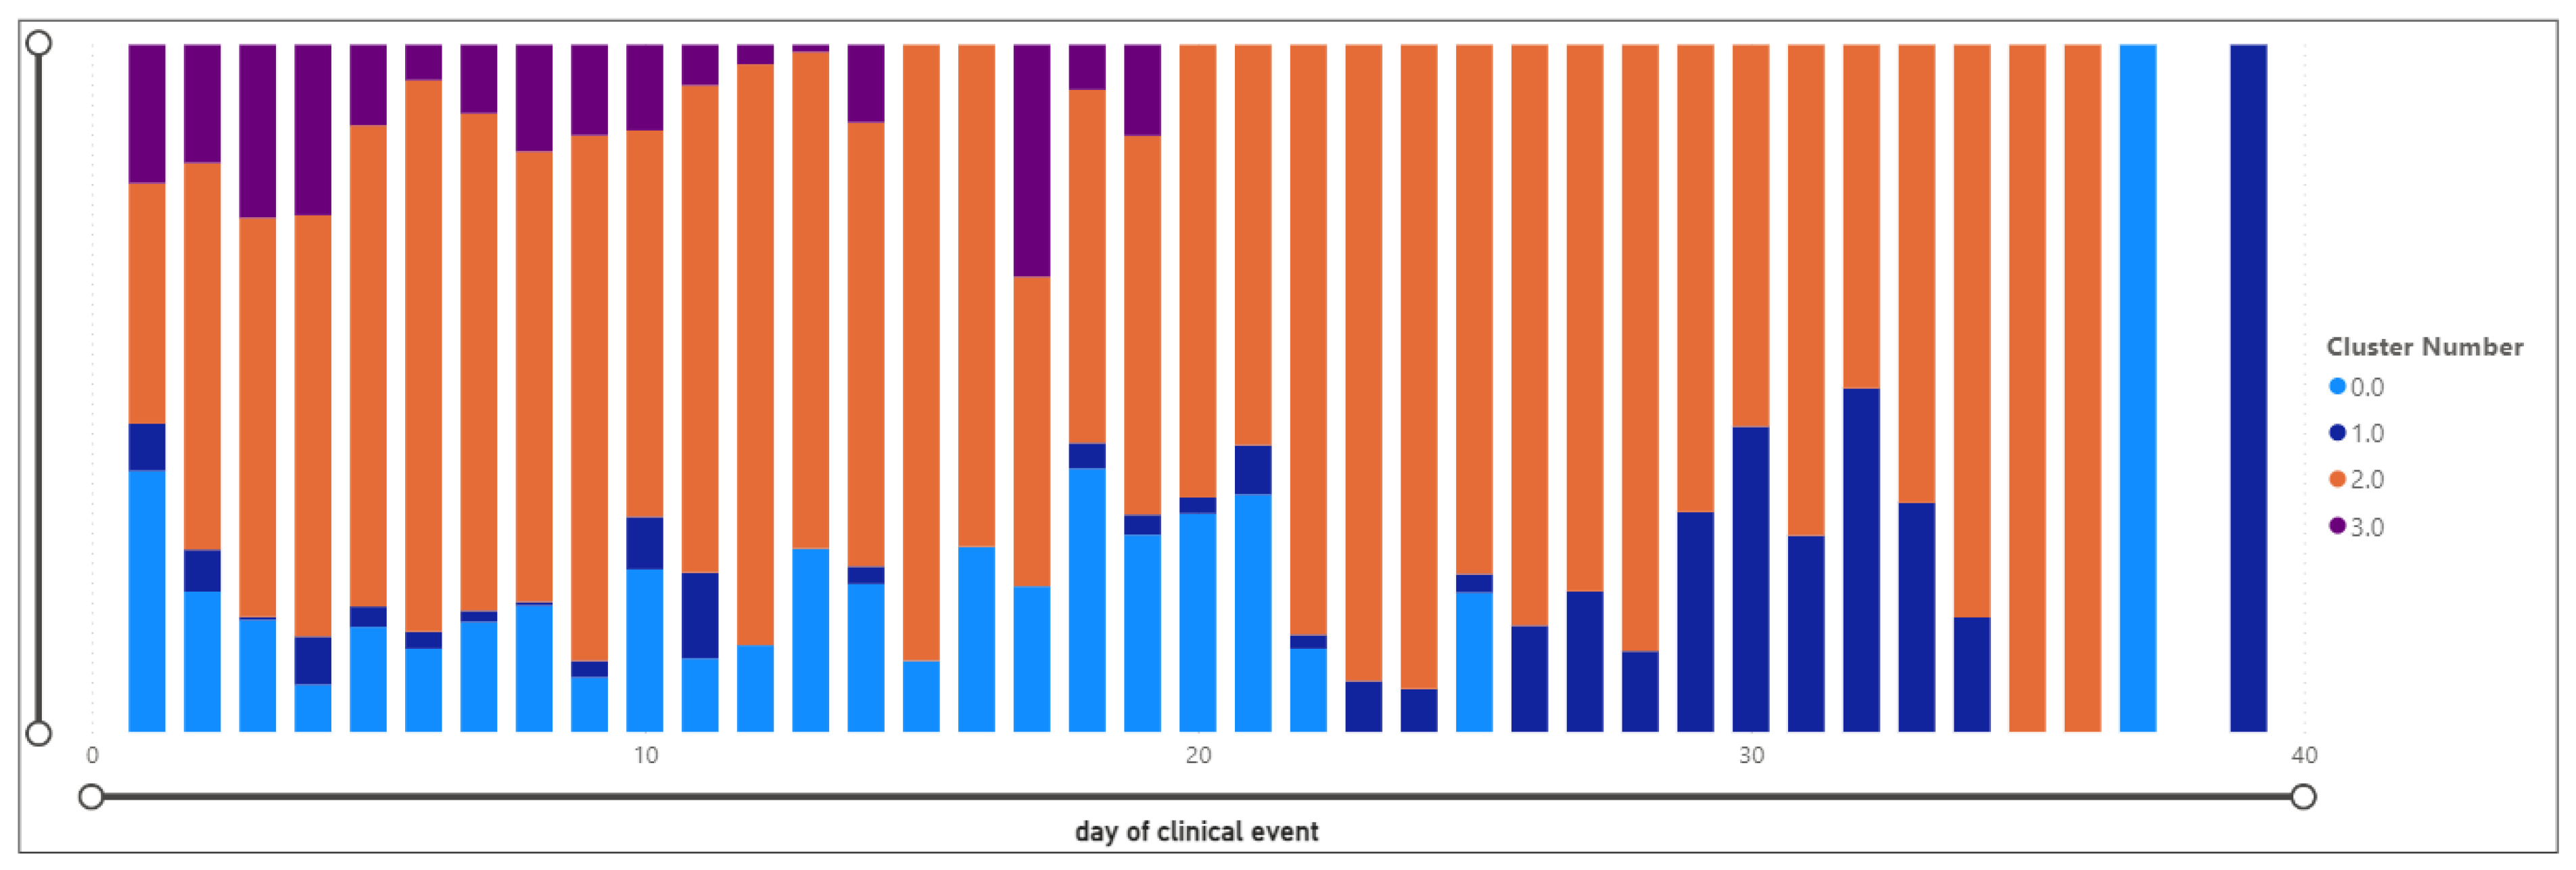
Figure 26 illustrates the temporal distribution of each cluster. For instance, Cluster 2 is observed on all days except days 37 and 39. Another noteworthy observation is that after day 34, a singular cluster is exclusively assigned to that specific day. Additionally, Cluster 3 is assigned only during the initial 19 days.
In summary, temporal analysis in the context of cluster distribution provides a dynamic view of patients’ health trajectories, aiding precision medicine by enabling timely interventions, enhancing predictive modeling, and fostering a nuanced understanding of the temporal aspects of clinical data.

3.4.9. Laboratory Exams and Results

The bar chart displayed in Figure 27 offers a comprehensive glimpse into the variety of laboratory examinations within each cluster, detailing the results as either normal or abnormal. The legends conveniently provide the codes for each examination. Hence, this visualization and analysis offer the opportunity to explore and examine the union, intersection, and distinctions of each cluster in terms of laboratory codes. This analytical insight holds paramount importance for decision-makers seeking to discern the distinct behavioral patterns of each cluster.
For instance, within this analysis, cluster 1 exhibits the lowest count of examinations yielding abnormal results, suggesting a relatively healthier profile. On the other hand, Cluster Two stands out with the highest number of examinations, producing both abnormal and normal results. Such granular insights enable decision-makers to better understand and interpret the diverse dynamics within each cluster, facilitating more informed and targeted decision-making processes.

3.4.10. Interventions

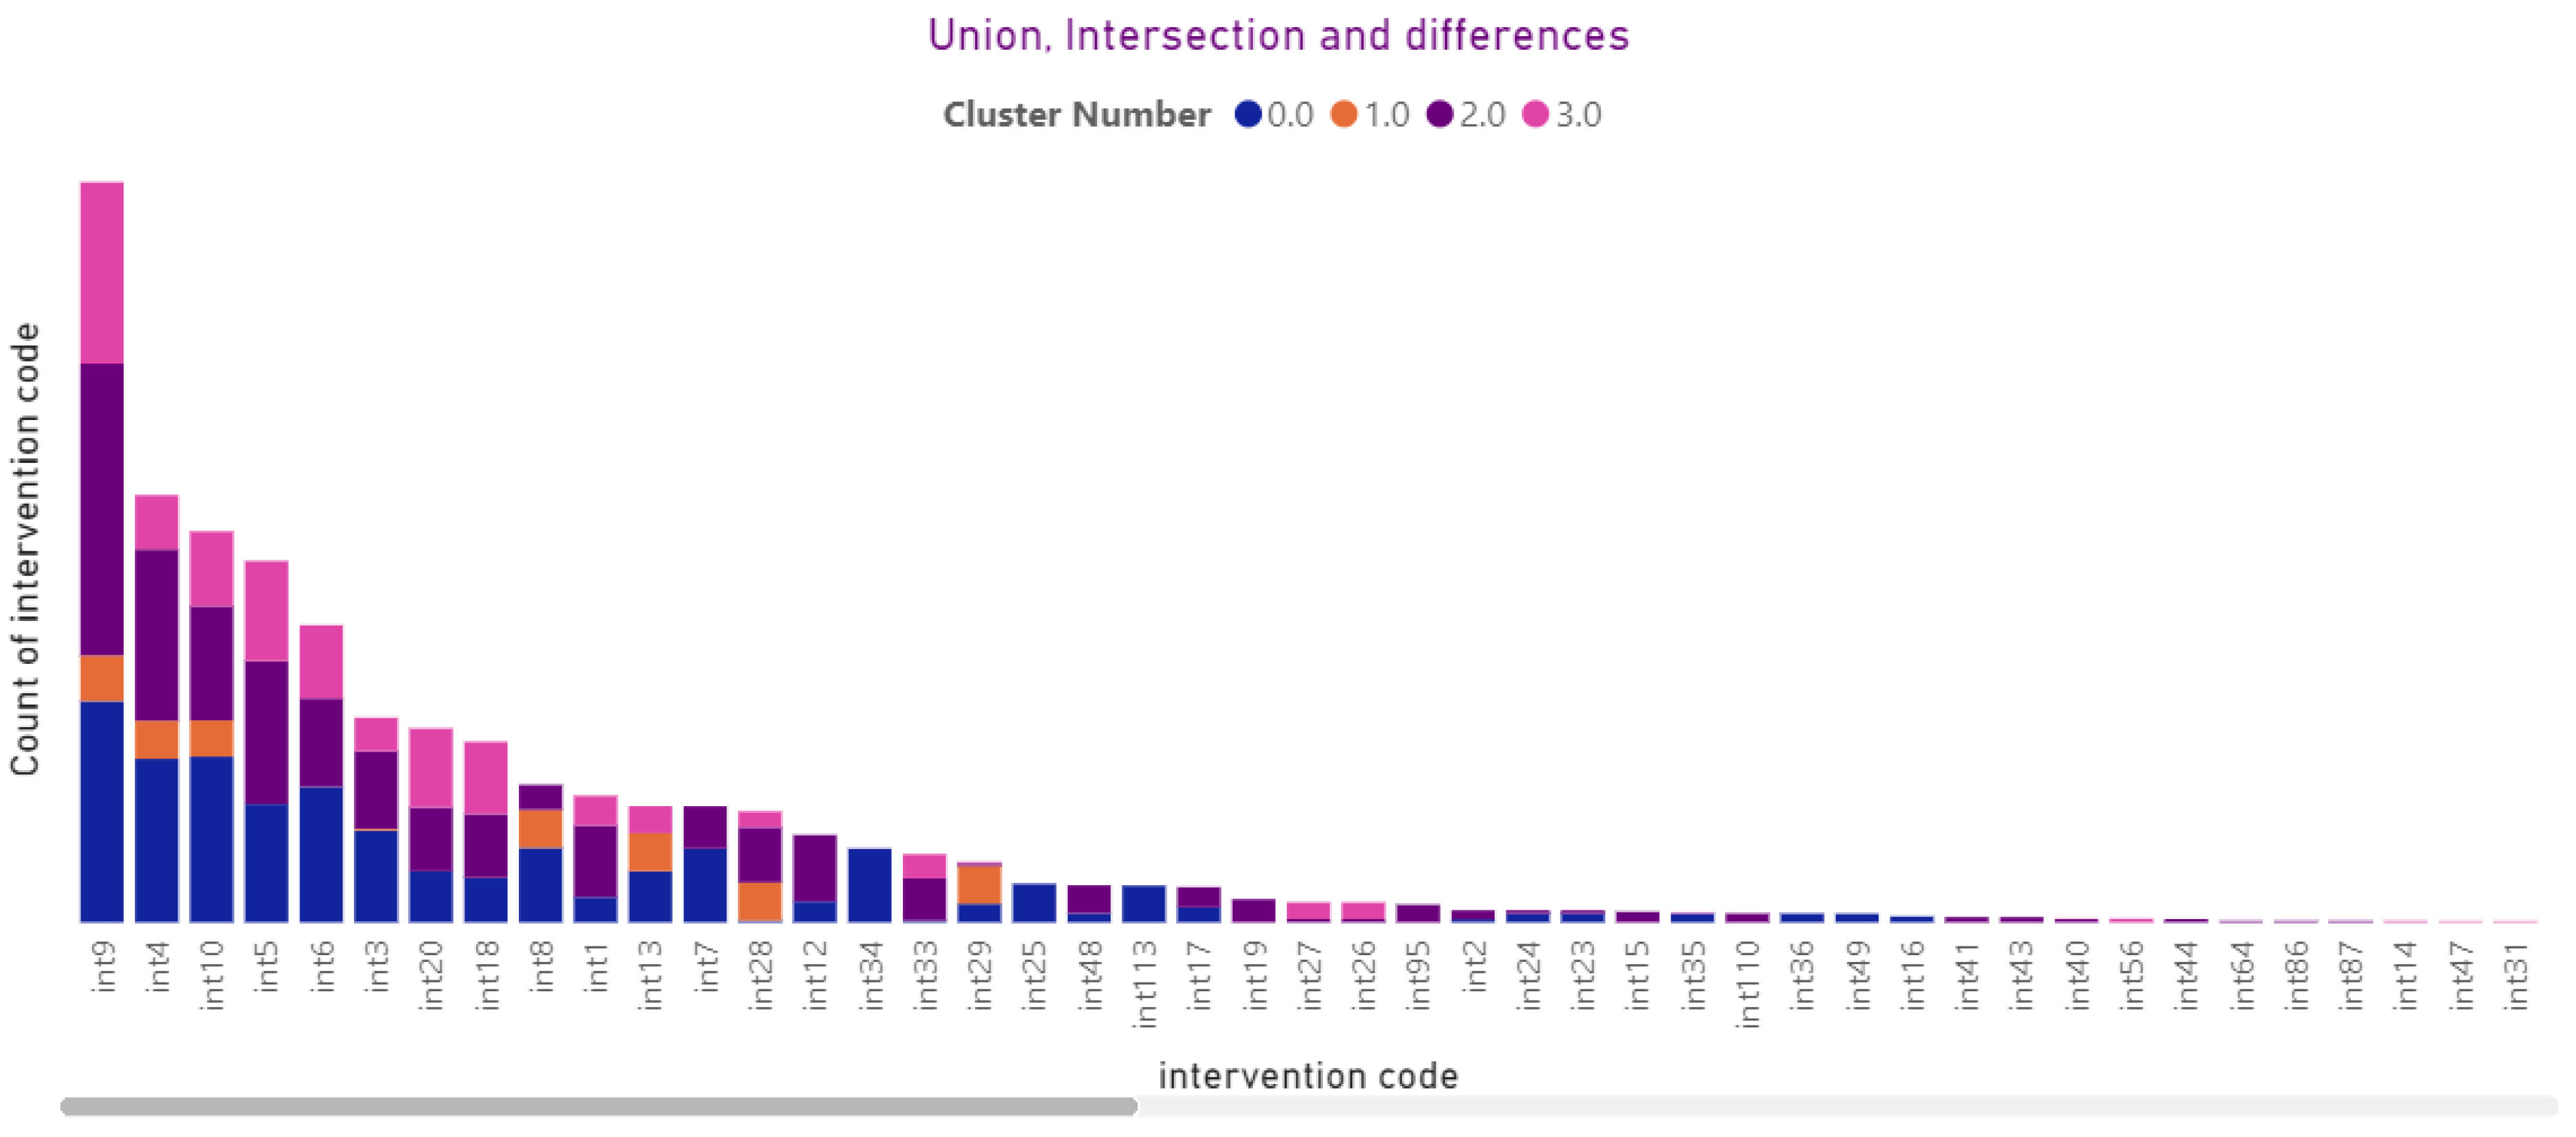
Figure 28 provides a visual representation of the exploration into the union, intersection, and distinctions of interventions within each cluster. Remarkably, ‘int9’ stands out as the most recurrent intervention observed across all clusters.
In detail, the x-axis corresponds to the intervention codes, the y-axis signifies the number of interventions, and the legend elucidates the cluster types under consideration. This graphical representation enhances our understanding of the intervention landscape, emphasizing the prevalence and distribution of intervention types across various clusters.
For instance, “int9” is observed in all clusters.

3.4.11. Diagnostic

Likewise, the chart depicted in Figure 29 showcases diagnostic codes associated with their respective diagnostic types (x-axis) and their distribution across clusters. Notably, the diagnostic code 8271 is exclusively linked to Cluster 0, indicating a specific association within this cluster.

3.4.12. Medications

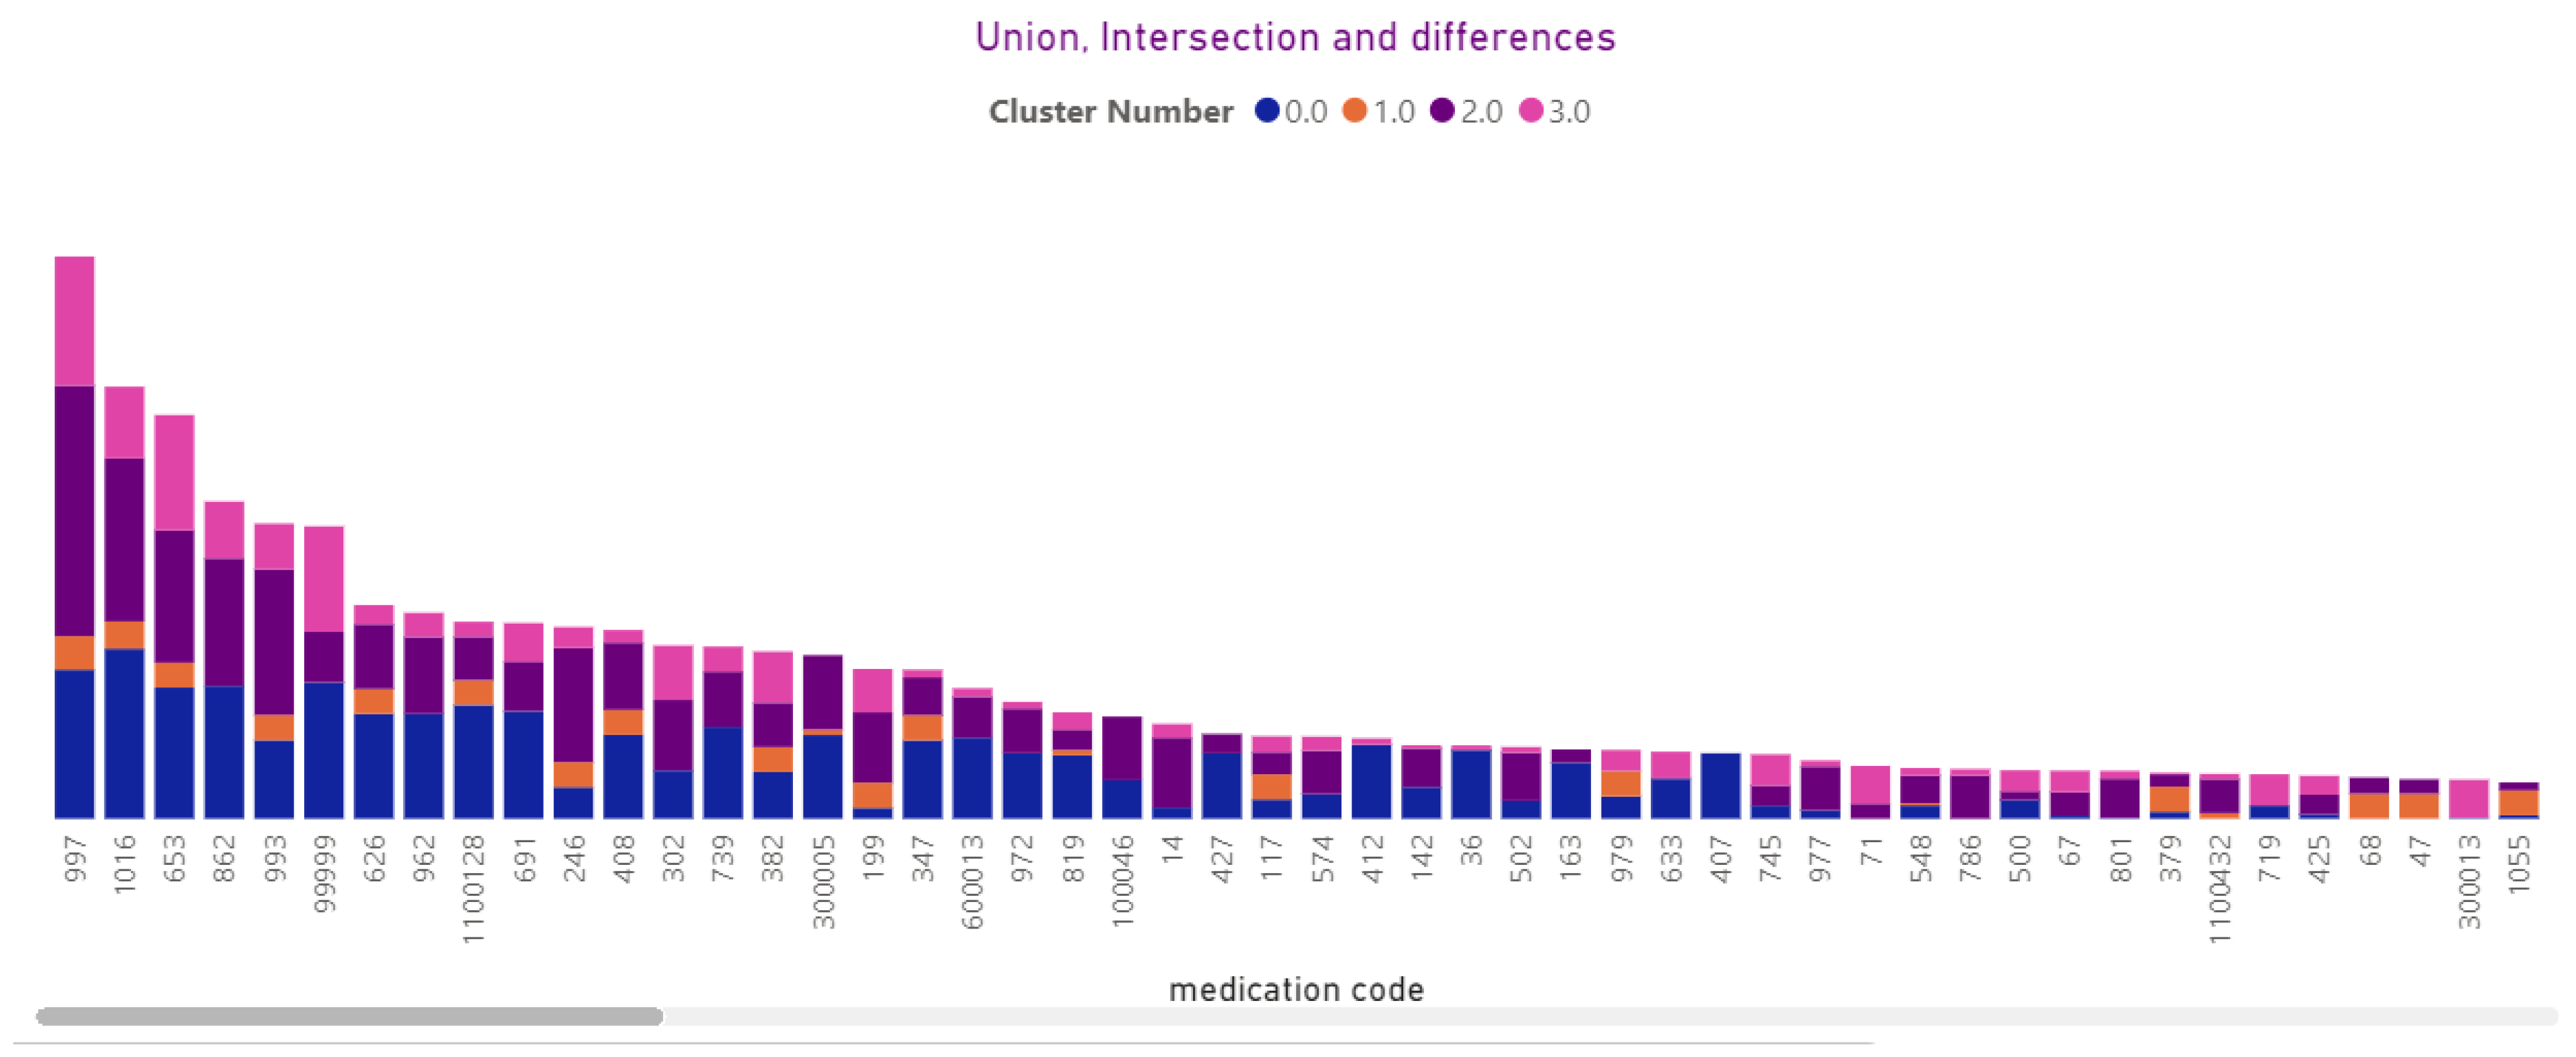
In the concurrent analysis, as portrayed in Figure 30, the visual representation delineates the distribution of medications across each cluster. While the bulk of medications is allocated to all four clusters, discernible differences emerge in the total count of each medication type (on the x-axis) assigned to individual clusters.

3.4.13. Procedures (Local, Zona)

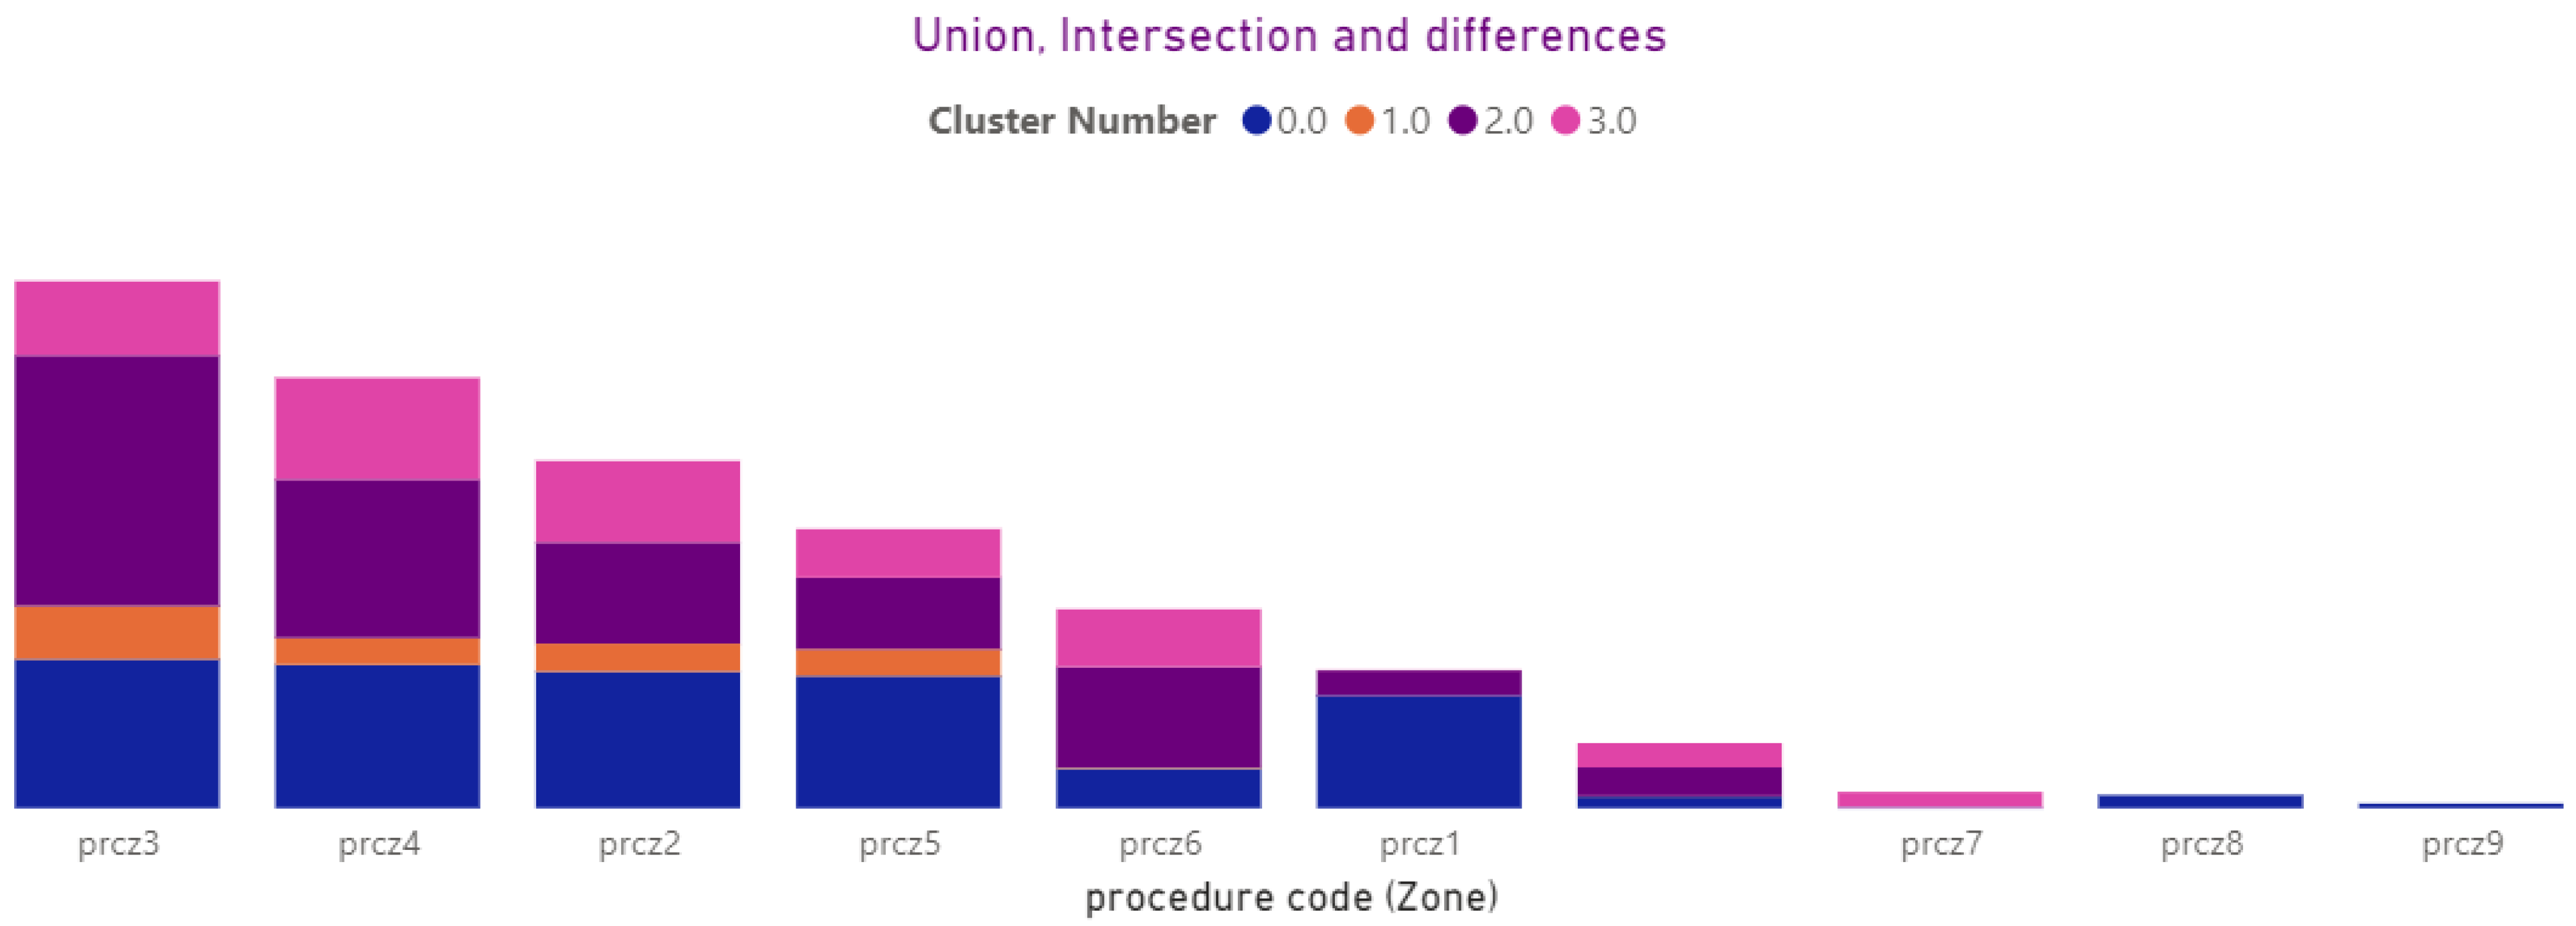
Figure 31 and Figure 32 depict the categorization of procedures into local and Zona types across each cluster. Notably, “prcl1” is exclusively associated with Clusters 0 and 2, while “prcl10” and “112” are present solely in Cluster 0. Likewise, concerning the Zona procedures, “prcz3” is specifically assigned to Cluster 3.

3.5. Predicting BehaviorBased Cluster

3.5.1. Classification

In this phase, we implement predictive health profiling by leveraging behavior-based classification on new data, building upon the insights gained from the clustering performed in the previous phase. The objective is to apply a classification approach to train the model using 258,054 rows (after excluding missing data) and 18 predictors—a mix of categorical and numerical variables.
The predictors encompass a comprehensive range of clinical indicators, providing the capability to forecast the cluster number over a clinical day. By training the classification algorithm on this dataset, we empower it to discern patterns and associations within these data, enabling the prediction of cluster numbers for each day of clinical performance.
This predictive health profiling methodology offers a dynamic and proactive approach to understanding patient trajectories, aiding healthcare professionals in anticipating and responding to potential developments in patient conditions. As new data becomes available, the classification algorithm can be applied to furnish timely predictions of cluster numbers, thereby contributing to a more informed and personalized healthcare decision-making process.
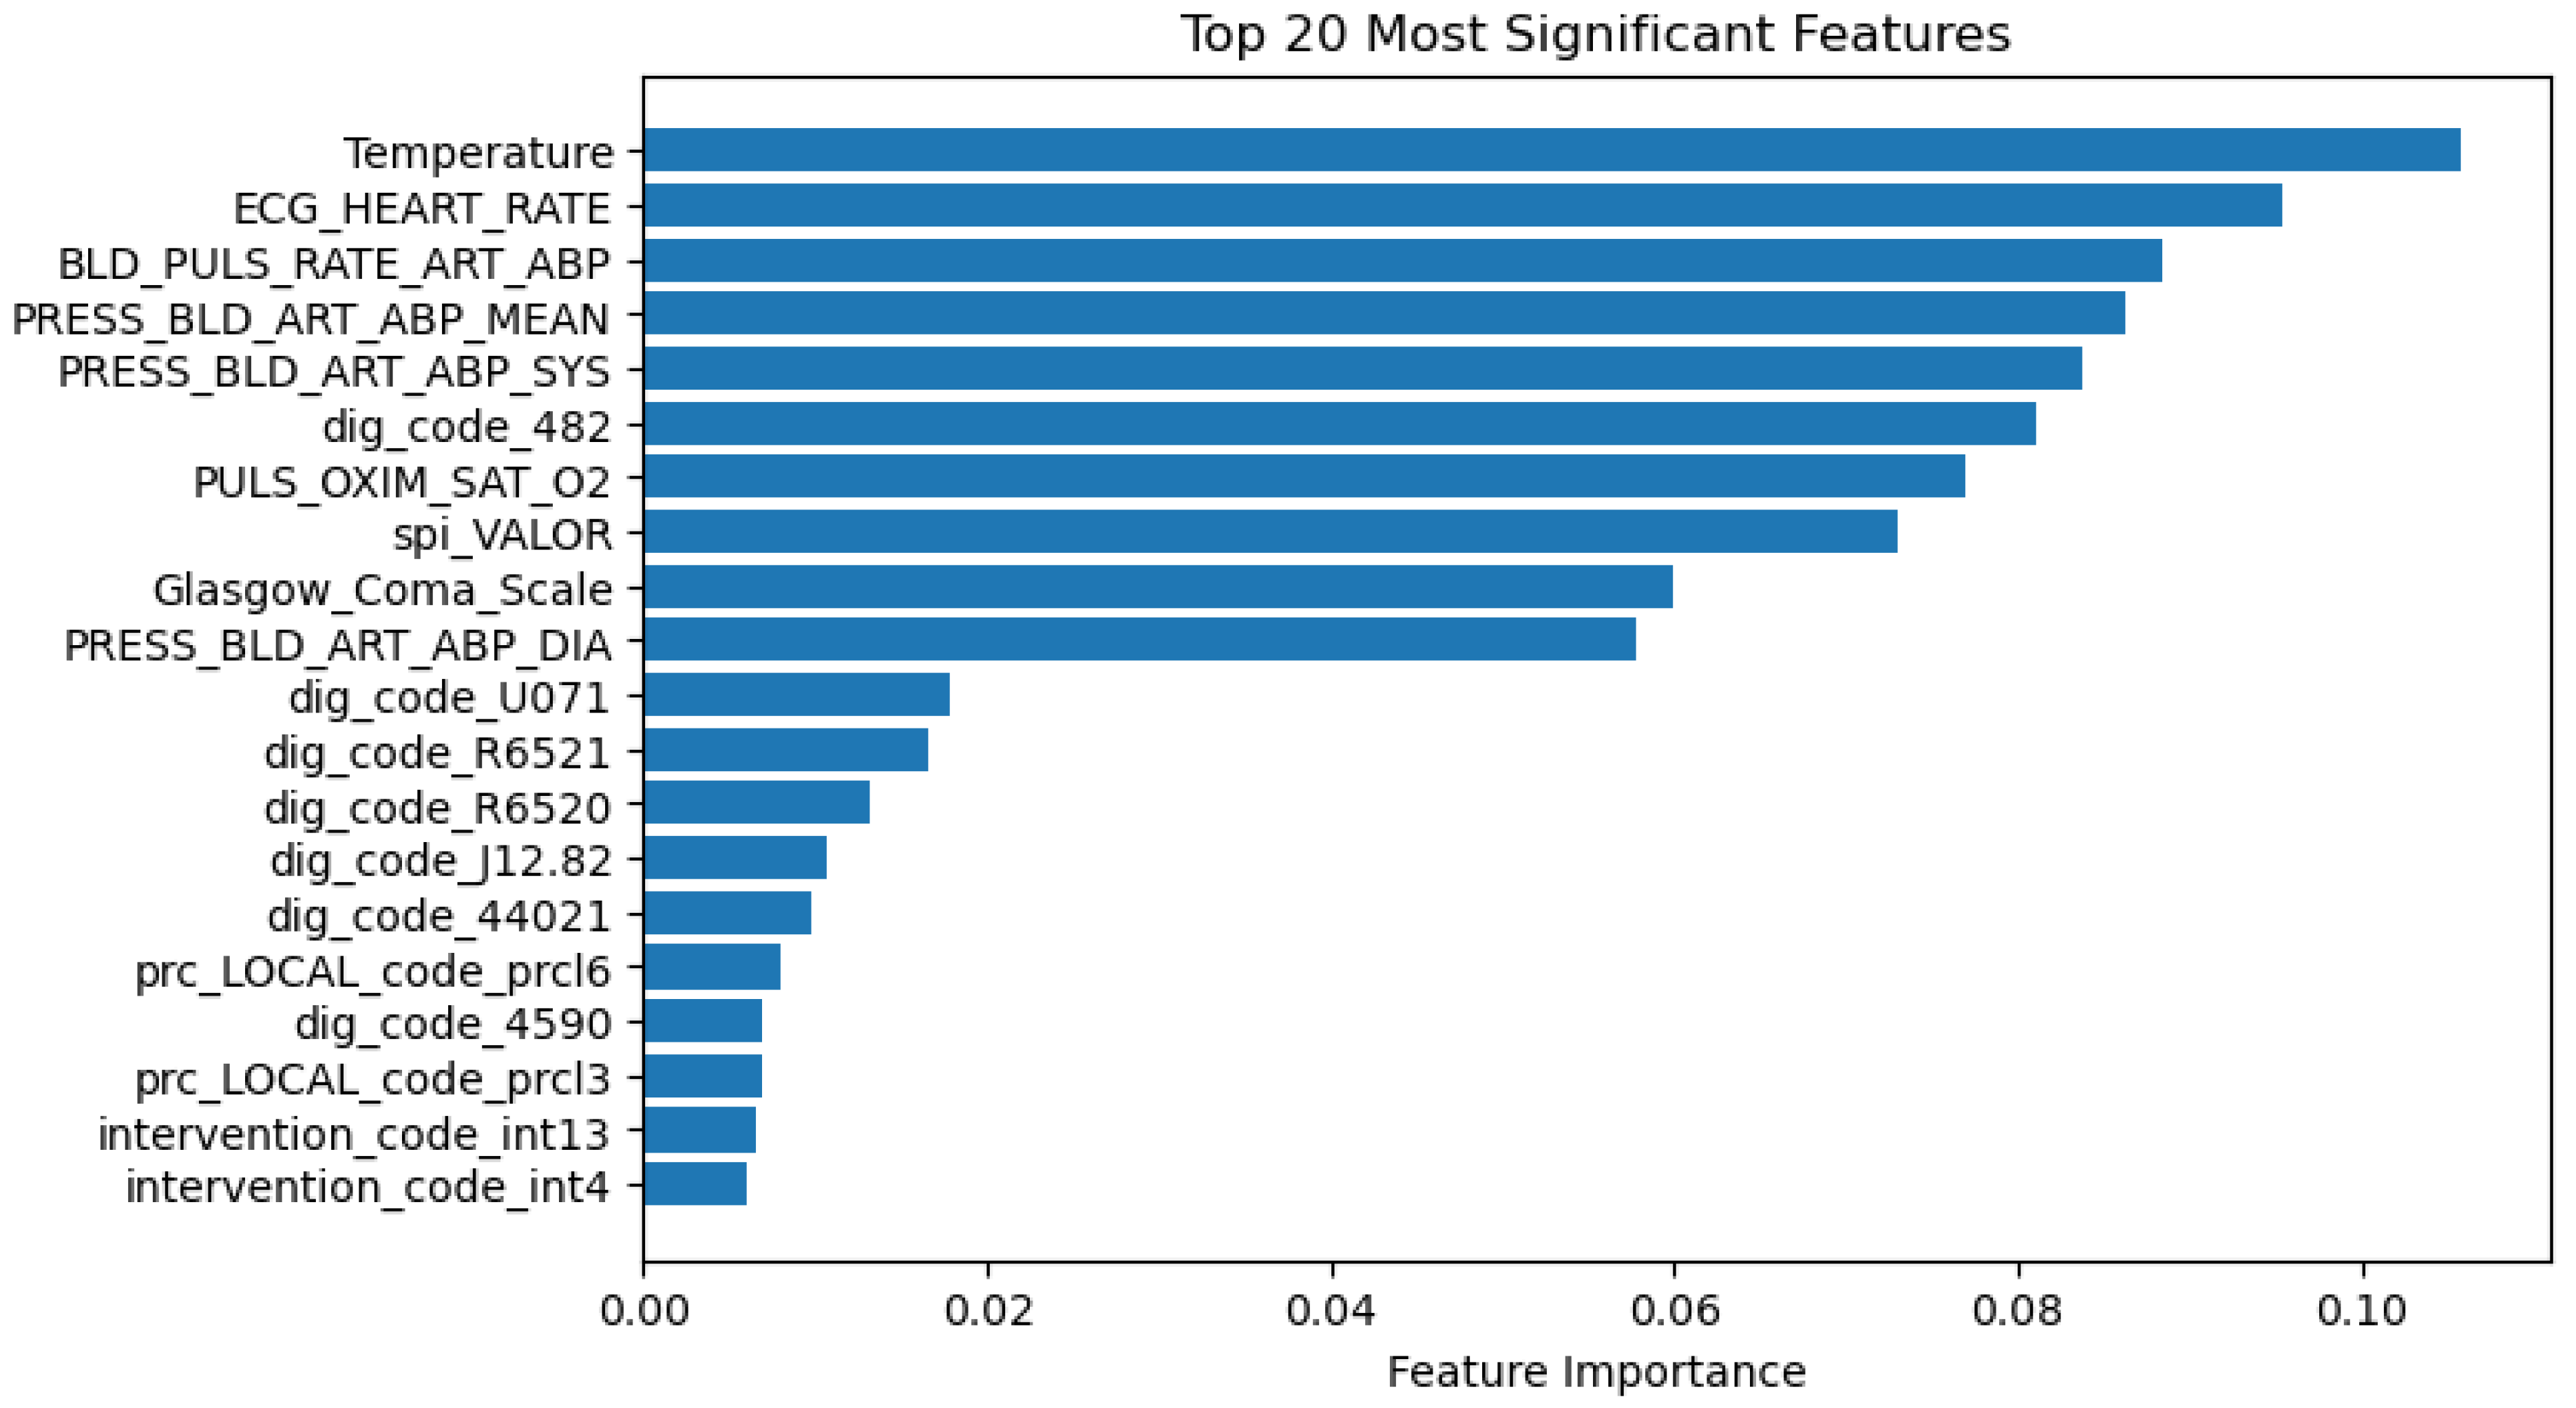
For example, we applied a random forest classifier with cross-validation techniques on a dataset of 258,054 records with 19 features. The goal was to predict the cluster using historical data and to discern the significance of each variable in the prediction process. Following the analysis, with cross-validation k = 5, we obtained a mean accuracy of 0.97, and it was determined that “Temperature” was the most influential factor in predicting the cluster according to the random forest model.
The results obtained indicate the performance of your random forest classifier using cross-validation. Here is a summary:
  • Mean Accuracy: 0.946, with a standard deviation of 0.078. This indicates that, on average, the model correctly predicts the target class around 94.6% of the time.
  • Mean Precision: 0.961, with a standard deviation of 0.052. Precision measures the accuracy of the positive predictions. This result suggests that, on average, around 96.1% of the predicted positive cases are positive.
  • Mean Recall: 0.946, with a standard deviation of 0.078. Recall measures the ability of the model to identify the positive cases correctly. This value indicates that around 94.6% of the actual positive cases are correctly identified by the model.
  • Mean F1 Score: 0.946, with a standard deviation of 0.077. The F1 score is the harmonic mean of precision and recall and provides a balance between them. This value suggests that the model achieves a good balance between precision and recall.
  • Mean Cohen’s Kappa: 0.912, with a standard deviation of 0.126. Cohen’s Kappa measures the agreement between predicted and actual class labels, considering the possibility of the agreement occurring by chance. This value indicates a substantial level of agreement beyond chance.
  • The mean AUC (Area Under the Curve) value of approximately 0.997 indicates that, on average, the classifier has an excellent ability to discriminate between different classes in the dataset. AUC values close to 1 suggest that the classifier can effectively separate positive and negative instances, making it highly reliable in distinguishing between classes.
The standard deviation of AUC, which is approximately 0.0056, represents the variability of AUC values across different folds of cross-validation. A lower standard deviation indicates that the AUC values from different folds are closer to the mean, suggesting consistency in the classifier’s performance across various subsets of these data. Therefore, the high mean AUC value, along with the low standard deviation, indicates that the classifier performs consistently well across different cross-validation folds and demonstrates strong discriminatory power in distinguishing between classes.
These metrics are commonly used to evaluate the performance of classification models, providing insights into different aspects of their predictive capabilities.
According to Table 6, the random forest classifier is performing well in accuracy, precision, recall, F1 score, and Cohen’s Kappa.

3.5.2. Significance of Predictors

Based on the RF performance depicted in Figure 33, the key indicators for predicting the target (cluster number) are illustrated. Among them, “temperature”, “Heart Rate”, and “BLD_PULS_RATE_ART_ABP” emerge as the top predictors.

4. Discussion

In this project, our contribution lies in the creation of a data-driven decision support system tailored for precision medicine. According to Figure 34, our endeavor encompasses various key aspects, including the formulation of a comprehensive CEid framework, the extraction of analytical insights, the development of predictive modeling techniques, and the validation of an optimal decision-making model:

4.1. CEid Formulation and Its Transformative Impacts

In the realm of data-driven aspects, the CEid formula stands out for its multifaceted and impactful advantages. These transformative endeavors resonate across datasets, introducing a variable that amalgamates key information. This identity plays a pivotal role in facilitating data processing and integration, which is essential for predictive modeling.
The sequential arrangement of events within a specific period, as captured by the event sequence, provides a comprehensive view of temporal order. This addresses challenges related to infrequent data generation and proved impactful for information exchange as a standard approach. Additionally, the CEid formula introduces a standardized method for creating keys for clinical events, ensuring uniformity and consistency in data representation. This standardization is crucial for interoperability and compatibility across healthcare systems, supporting the analysis and interpretation of temporal relationships.
Moreover, the crafted key serves as a standardized identifier for clinical events, promoting consistency and ease of information exchange. This common temporal reference facilitates smooth information exchange across different systems and platforms, providing a standardized framework for understanding and interpreting temporal relationships in clinical data.
The event sequence, part of the crafted key, furnishes a chronological order of clinical events, enabling clustering. This sequential information allows for the identification of patterns or clusters of events occurring closely in time, enhancing clustering by encapsulating diverse clinical events within a unified temporal framework. This aids in the recognition of meaningful clusters.
In terms of predictive modeling, the structured key, with detailed components such as the day of the event, data type, process number, episode number, and other clinical indicators, serves as a rich source for features in predictive modeling. This enables the development of predictive models that account for the sequential nature of clinical events, contributing to more accurate predictions based on temporal relationships.
The strength of the formula lies not only in its technical and data-driven aspects but also in its practical application in precision medicine. The CEid offers a dynamic and flexible means to analyze and interpret complex patient data, supporting informed decision-making and significantly enhancing the quality of patient care by providing a nuanced understanding of individual medical journeys.
This approach equips medical professionals with a versatile toolset, complete with filters facilitating a comprehensive review of diverse clinical events and their associated details, all within a unified temporal framework. This innovative approach provides practitioners with a holistic lens through which to navigate and discern intricate patient trajectories, fostering informed decision-making and enhanced patient care.
The meticulous examination of clinical data plays a pivotal role in continuous patient monitoring. By keenly observing data fluctuations over time, healthcare providers can promptly identify deviations from a patient’s baseline health and intervene early to mitigate potential complications. The unification of clinical events further empowers decision-makers, offering a comprehensive understanding of each patient’s unique health journey. Armed with this information, they can tailor interventions to address the individual needs of the patient, thereby making treatment decisions more personalized. Moreover, this holistic approach to decision-making is instrumental in providing a panoramic view of a patient’s health history. It not only facilitates proactive care but also contributes to an overall enhancement of patient well-being. The capability to track and analyze clinical events longitudinally enables decision-makers to pinpoint trends and patterns that may signify the onset of health issues. Early detection through this method leads to proactive interventions, curbing the severity and cost of treatment. In terms of treatment effectiveness, clinical decision-makers leverage their ability to assess the impact of treatment strategies by analyzing patient responses over time. This valuable information guides the adjustment of treatment plans, aiming for improved outcomes and optimized resource allocation. Last, the focus extends beyond mere disease treatment to encompass preventive and proactive health management. The emphasis lies not only in addressing existing conditions but also in identifying risk factors and taking pre-emptive measures to prevent or delay the onset of diseases.

4.2. Analytical Insight

Clinical event identification (CEid) serves as a cornerstone in linking clinical events across a unified platform. By integrating each patient’s clinical background, it enables thorough observation and analysis. This step is pivotal in identifying patterns within an integrated platform, providing decision-makers with comprehensive insights crucial for informed, evidence-based decisions. Ultimately, this approach enhances the likelihood of successful treatment outcomes and ensures patient satisfaction.

4.3. Cluster Analysis

As previously mentioned, the CEid plays a pivotal role in seamlessly integrating diverse data sources and types by extracting the day of the clinical event and the process number. Consequently, employing clustering techniques on the integrated data, independent of the process number, establishes an optimal platform to investigate the homogeneity of physiological data. This process involves creating cluster references to assign a combination of categorical and numerical data to each cluster. Moreover, the standardization applied to generate custom codes for categorical variables enhances the overall performance of this procedure.
In addition, the phase of mapping and cluster assignment, with analyzing the minimum, maximum, and mean variables in each cluster, provides valuable insights and benefits in several ways within the context of this work on health profiling and data-driven aspects. Here are the advantages:
  • Identification of Extreme Values
  • Min and Max Values: Examining the minimum and maximum values within each cluster helps identify extreme values or outliers. These outliers may represent unique cases or anomalies that can provide valuable information about exceptional health conditions or atypical patient responses.
  • Understanding Range and Variability
Mean and Variability: Calculating the mean and understanding the variability (min to max range) of variables within each cluster provides insights into the overall distribution of health parameters. This information is crucial for understanding the typical range of values associated with different health profiles.
  • Differential Health Characteristics
Cluster-Specific Patterns: By comparing the minimum, maximum, and mean values across clusters, we can identify cluster-specific patterns. This helps distinguish the characteristic health parameters that define each cluster and contributes to the creation of more nuanced health profiles.
  • Clinical Relevance
Identification of Clinical Significance: Extreme values or specific patterns in minimum, maximum, or mean values may have clinical significance. For instance, unusually high or low values could signal potential health risks or specific medical conditions that warrant closer attention.
  • Feature Importance in Predictive Modelling
Variable Importance: Understanding the importance of variables based on their range and variability in different clusters can aid in feature selection for predictive modeling. Variables with substantial variations across clusters may play a crucial role in predicting health outcomes.
  • Quality Control and Data Integrity
Detecting Data Anomalies: Discrepancies or unexpected patterns in minimum, maximum, or mean values may indicate data anomalies or errors. Regularly monitoring these statistics helps ensure the quality and integrity of the dataset.
At the end of each phase, clinical decision-makers will be supported in tailoring interventions. Insights derived from the analysis of variable ranges can contribute to the development of more precise medical strategies. Tailoring interventions based on the specific health characteristics within each cluster allows for more targeted and effective healthcare practices.

4.4. Classification

Predictive health profiling through behavior-based classification, coupled with the utilization of clustering, holds significant potential to propel the field of precision medicine forward. Here are key aspects that underscore its potential impact:
From a data-driven decision-making perspective, the incorporation of 18 predictors, encompassing a mix of categorical and numerical variables, reflects a comprehensive approach to capturing diverse facets of patient health. This rich dataset empowers healthcare professionals with the tools for more informed and data-driven decision-making, thereby elevating the precision and accuracy of medical interventions and treatment.

4.5. Application

In Application-Level Insights: Leveraging behavior-based classification and clustering enhances the model’s capability to discern individual variations in patient health trajectories. This nuanced profiling contributes to a more personalized understanding of patient conditions, facilitating tailored medical interventions for better outcomes (Individualized Patient Profiling). Moreover, resulted in early detection and intervention. The model’s capacity to predict cluster numbers throughout the clinical day signifies an augmented ability to detect subtle changes in a patient’s health status early on. This early detection lays the groundwork for timely interventions, potentially averting adverse health events and improving overall patient outcomes.
In addition, demonstrating real-time adaptability, the model’s capacity to work with new data and provide daily predictions is crucial in a clinical setting where patient conditions may evolve rapidly. This feature enables continuous monitoring and the adaptation of treatment plans as needed.
In conclusion, the synergy between behavior-based classification, clustering, and advanced data analytics holds transformative potential for precision medicine, promising more personalized, timely, and effective healthcare interventions.

4.6. Challenges

We encountered significant limitations and challenges in advancing our analytical insights, including issues with data quality, diverse datasets, and infrequent data collection from sensors. Leveraging the CEid, we were able to address some of these challenges partially.
To create the artifact, we faced limitations in accessing specific types of data. For instance, datasets such as SOAP contained predominantly unstructured text data, lacking the structured format required for predictive modeling. Additionally, ethical concerns regarding the accessibility of genetic profiles posed constraints on sample availability, further limiting our ability to gather diverse and comprehensive data for analysis.

4.7. Theoretical Reference—Suboptimal Decision-Making

Figure 35 illustrates the pivotal role of analytics and applied techniques on clinical data to achieve suboptimal outcomes. As discussed earlier, the complexity of individual patient data arises from diverse sources and formats, leading to dynamic, semi/unstructured, multi-dimensional, and fragmented data [3]. In the context of healthcare, suboptimal decision-making refers to instances where the chosen course of action does not yield the best possible outcome for the patient. This can occur because of various factors, including incomplete information, cognitive biases, or limitations in analytical tools. Therefore, advanced analytics, particularly predictive and prescriptive analytics, become essential for optimizing treatment performance [4]. By leveraging past patient data and sophisticated machine learning algorithms, predictive analytics can anticipate treatment features and potential outcomes. However, despite the predictive capabilities of these techniques, decision-makers may still encounter challenges in identifying the most appropriate course of action.
Prescriptive analytics, on the other hand, offers a decision-focused approach to healthcare decision-making. By simulating various treatment scenarios and optimizing for the desired outcome, prescriptive analytics can guide clinicians toward more effective interventions. Nonetheless, the application of prescriptive analytics in real-world settings may be constrained by factors such as resource limitations or organizational constraints.
Overall, the integration of advanced analytics into clinical decision-making processes holds significant promise for improving patient outcomes and enhancing healthcare delivery. However, it is essential to recognize the inherent challenges and limitations associated with suboptimal decision-making in healthcare settings and to continue refining analytical approaches to address these complexities.
To advance the sub-optimal model of clinical decision-making and develop the IDSS4PM artifact, we introduced the CEid and analytical insights to grasp the underlying problem. This involved employing descriptive analytics to glean valuable knowledge, thus representing the intelligent phase. Furthermore, predictive modeling contributed to both the intelligence and design phases. In Simon’s model, decision-makers design alternative courses of action based on predictions—a process mirrored in predictive analytics, which assists in devising treatment plans by suggesting strategies informed by projected outcomes. This iterative approach aligns with the iterative process of generating and evaluating multiple treatment scenarios based on predictive models.
Finally, Choice Phase: Prescriptive analytics corresponds to the choice phase of Simon’s model, where decision-makers select the most optimal course of action among the alternatives generated in the design phase. Prescriptive analytics guides decision-makers by recommending specific treatment options or interventions that are expected to yield the best outcomes based on simulation and optimization techniques.
Furthermore, prescriptive analytics supports intelligent adaptation by continuously refining treatment recommendations based on new data or changing patient conditions. This reflects Simon’s notion of intelligent adaptation, where decision-makers adjust their strategies in response to feedback and environmental changes to achieve better outcomes over time.
While our study primarily focuses on descriptive and predictive analytics, it lays the groundwork for future research exploring optimization. As discussed, further studies are needed to incorporate simulation techniques and prescriptive analytics, which would enable the identification of “satisficing” solutions that align with the rationality constraints of decision-making. This framework, therefore, sets the stage for developing decision-making strategies that balance the trade-offs between optimal solutions and those that are practically achievable under bounded rationality.

4.8. Application in PM

In addition to our contribution to data-driven aspects, including the development of an intelligent decision support system for precision medicine with implications on the application level, the outcomes indirectly lead to:
Patients witnessing their healthcare providers making data-informed decisions based on a unified view of their clinical events are more likely to engage in their care actively. This increased engagement often results in better adherence to treatment plans and subsequently leads to improved health outcomes (Improved Patient Engagement).
Moreover, decision-makers gain the ability to allocate healthcare resources more efficiently by prioritizing patients who require immediate attention; this strategic allocation enhances resource utilization, ultimately leading to improved patient outcomes. Optimized resource allocation and understanding the progression of a patient’s health condition and the impact of various clinical events empower decision-makers to avoid unnecessary and costly diagnostic tests and treatments that may not be effective. This not only leads to cost savings but also promotes a more streamlined and effective healthcare approach.
In summary, our scientific endeavors not only contribute to advancing data-driven aspects but also bring about positive changes in patient engagement, resource allocation efficiency, and cost-effectiveness within the realm of precision medicine.
This project was a collaborative interdisciplinary effort with the hospital’s ICU, enriching our ability to showcase the value of our contribution to creating the artifact.

5. Conclusions

In this project, we made significant contributions to developing a data-driven decision support system tailored for precision medicine, focusing on creating a comprehensive Clinical event identification (CEid) framework, generating analytical insights, and enhancing predictive modeling techniques. Our efforts culminated in the validation of an optimal decision-making model that stands to improve clinical outcomes.
The CEid formulation proved transformative, offering a standardized method for integrating and analyzing clinical data across diverse systems. This framework enabled the seamless processing and interpretation of temporal relationships within patient data, facilitating more accurate predictive modeling and enhanced clustering. These advancements empower healthcare professionals to gain a deep understanding of patient trajectories, leading to more personalized and effective interventions.
Our analytical insights, supported by cluster analysis, have provided a deeper understanding of patient health profiles, enabling the identification of key patterns and extreme values within clinical data. This level of detail is crucial for tailoring treatment strategies to individual patients, ultimately enhancing the quality of care.
Furthermore, the classification techniques developed in this study, particularly behavior-based classification, have demonstrated significant potential for advancing precision medicine. These methods contribute to early detection and intervention, real-time adaptability, and personalized patient profiling, which are critical for improving patient outcomes in clinical settings.
Despite facing challenges related to data quality, diverse datasets, and ethical concerns, our project successfully addressed many of these issues through innovative approaches such as the CEid framework. The integration of advanced analytics into clinical decision-making processes has proven essential for optimizing treatment performance and resource allocation, highlighting the project’s practical impact on healthcare delivery.
In conclusion, this interdisciplinary collaboration with the ICU has not only advanced the field of precision medicine but also demonstrated the value of data-driven approaches in enhancing patient engagement, optimizing resource allocation, and reducing healthcare costs. Our work underscores the transformative potential of combining advanced analytics with clinical expertise to drive more informed, effective, and personalized healthcare decisions.

Author Contributions

Concepts and State of the Art, N.S.M.; Methodologies, N.S.M. and M.F.S.; Problem Understanding, N.S.M. and M.F.S.; Data Understanding, N.S.M. and M.F.S.; Data Preparation, N.S.M.; Modeling, N.S.M. and M.F.S.; Evaluation, N.S.M. and M.F.S.; Writing and Editing, N.S.M.; Reviewing, M.F.S. All authors have read and agreed to the published version of the manuscript.

Funding

This work has been supported by FCT—Fundação para Ciência e Tecnologia within the R&D Units (Algoritmi Centre University of Minho, Portugal). Project Scope: UIDB/00319/2020.

Institutional Review Board Statement

Not applicable.

Informed Consent Statement

Not applicable.

Data Availability Statement

The original contributions presented in the study are included in the article.

Conflicts of Interest

The authors declare no conflict of interest.

References

  1. Kosorok, M.R.; Laber, E.B. Precision Medicine. Annu. Rev. Stat. Its Appl. 2019, 6, 263–286. [Google Scholar] [CrossRef] [PubMed]
  2. Liu, S.; Duffy, A.H.B.; Whitfield, R.I.; Boyle, I.M. Integration of decision support systems to improve decision support performance. Knowl. Inf. Syst. 2010, 22, 261–286. [Google Scholar] [CrossRef]
  3. Banappagoudar, S.B.; Santhosh, S.U.; Thangam, M.M.N.; David, S.; Shamili, G.S. The Advantages of Precision Medicine over Traditional Medicine in Improving Public Health Outcomes. J. ReAttach Ther. Dev. Divers. 2023, 6, 272–277. [Google Scholar]
  4. Beckmann, J.S.; Lew, D. Reconciling evidence-based medicine and precision medicine in the era of big data: Challenges and opportunities. Genome Med. 2016, 8, 134. [Google Scholar] [CrossRef] [PubMed]
  5. Pencina, M.J.; Peterson, E.D. Moving from clinical trials to precision medicine: The role for predictive modeling. JAMA—J. Am. Med. Assoc. 2016, 315, 1713–1714. [Google Scholar] [CrossRef] [PubMed]
  6. Naithani, N.; Sinha, S.; Misra, P.; Vasudevan, B.; Sahu, R. Precision medicine: Concept and tools. Med. J. Armed Forces India 2021, 77, 249–257. [Google Scholar] [CrossRef] [PubMed]
  7. Gopal, G.; Suter-Crazzolara, C.; Toldo, L.; Eberhardt, W. Digital transformation in healthcare—Architectures of present and future information technologies. Clin. Chem. Lab. Med. 2019, 57, 328–335. [Google Scholar] [CrossRef]
  8. Alqenae, F.A.; Steinke, D.; Keers, R.N. Prevalence and Nature of Medication Errors and Medication-Related Harm Following Discharge from Hospital to Community Settings: A Systematic Review. Drug Saf. 2020, 43, 517–537. [Google Scholar] [CrossRef]
  9. Alzheimer’s Association. 2017 Alzheimer’s disease facts and figures. Alzheimer’s Dement. 2017, 13, 325–373. [Google Scholar] [CrossRef]
  10. Maglaveras, N.; Kilintzis, V.; Koutkias, V.; Chouvarda, I. Integrated Care and Connected Health Approaches Leveraging Personalised Health through Big Data Analytics; Studies in Health Technology and Informatics; IOP Press: Amsterdam, The Netherlands, 2016; Volume 224, pp. 117–122. [Google Scholar] [CrossRef]
  11. Francis, S.; Collins, M.D.; Varmus, M.D. A commentary on ‘A new initiative on precision medicine’. Front. Psychiatry 2015, 6, 88. [Google Scholar] [CrossRef]
  12. Haque, M.; Islam, T.; Sartelli, M.; Abdullah, A.; Dhingra, S. Prospects and challenges of precision medicine in lower-and middle-income countries: A brief overview. Bangladesh J. Med. Sci. 2020, 19, 32–47. [Google Scholar] [CrossRef]
  13. Bonkhoff, A.K.; Grefkes, C. Precision medicine in stroke: Towards personalized outcome predictions using artificial intelligence. Brain 2022, 145, 457–475. [Google Scholar] [CrossRef] [PubMed]
  14. Mosavi, N.S.; Santos, M.F. Unveiling Precision Medicine with Data Mining: Discovering Patient Subgroups and Patterns. In Proceedings of the 2023 IEEE Symposium Series on Computational Intelligence, SSCI 2023, Mexico City, Mexico, 5–8 December 2023. [Google Scholar] [CrossRef]
  15. Boettger, J.; Deussen, O.; Ziezold, H. Apparatus and Methods for Controlling and Applying Flash Lamp Radiation. US10881872B1, 2014. [Google Scholar]
  16. Awwalu, J.; Garba, A.G.; Ghazvini, A.; Atuah, R. Artificial Intelligence in Personalized Medicine Application of AI Algorithms in Solving Personalized Medicine Problems. Int. J. Comput. Theory Eng. 2015, 7, 439–443. [Google Scholar] [CrossRef]
  17. König, I.R.; Fuchs, O.; Hansen, G.; von Mutius, E.; Kopp, M.V. What is precision medicine? Eur. Respir. J. 2017, 50, 1700391. [Google Scholar] [CrossRef]
  18. Jameson, J.L.; Longo, D.L. Precision medicine—Personalized, problematic, and promising. N. Engl. J. Med. 2015, 372, 2229–2234. [Google Scholar] [CrossRef] [PubMed]
  19. LSanchez-Pinto, L.N.; Bhavani, S.V.; Atreya, M.R.; Sinha, P. Leveraging Data Science and Novel Technologies to Develop and Implement Precision Medicine Strategies in Critical Care. Crit. Care Clin. 2023, 39, 627–646. [Google Scholar] [CrossRef]
  20. Pelter, M.N.; Druz, R.S. Precision medicine: Hype or hope? Trends Cardiovasc. Med. 2024, 34, 120–125. [Google Scholar] [CrossRef]
  21. Szelka, J.; Wrona, Z. Knowledge Discovery in Data KDD Meets Big Data. Arch. Civ. Eng. 2016, 62, 217–228. [Google Scholar] [CrossRef]
  22. MBekbolatova, M.; Mayer, J.; Ong, C.W.; Toma, M. Transformative Potential of AI in Healthcare: Definitions, Applications, and Navigating the Ethical Landscape and Public Perspectives. Healthcare 2024, 12, 125. [Google Scholar] [CrossRef]
  23. Lee, D.; Yoon, S.N. Application of artificial intelligence-based technologies in the healthcare industry: Opportunities and challenges. Int. J. Environ. Res. Public Health 2021, 18, 271. [Google Scholar] [CrossRef]
  24. Sutton, R.T.; Pincock, D.; Baumgart, D.C.; Sadowski, D.C.; Fedorak, R.N.; Kroeker, K.I. An overview of clinical decision support systems: Benefits, risks, and strategies for success. NPJ Digit. Med. 2020, 3, 17. [Google Scholar] [CrossRef] [PubMed]
  25. Mosavi, N.S.; Santos, M.F. Adoption of Precision Medicine; Limitations and Considerations. Comput. Sci. Inf. Technol. 2021, 13–24. [Google Scholar] [CrossRef]
  26. Mesko, B. The role of artificial intelligence in precision medicine. Expert Rev. Precis. Med. Drug Dev. 2017, 2, 239–241. [Google Scholar] [CrossRef]
  27. Sriram, R.D.; Subrahmanian, E. Transforming Health Care through Digital Revolutions. J. Indian Inst. Sci. 2020, 100, 753–772. [Google Scholar] [CrossRef] [PubMed]
  28. Watson, H.J. The Cognitive Decision-Support Generation. Bus. Intell. J. 2017, 22, 3–6. [Google Scholar]
  29. Watson, H.J. Preparing for the cognitive generation of decision support. MIS Q. Exec. 2017, 16, 3–6. [Google Scholar]
  30. Johnson, K.B.; Wei, W.; Weeraratne, D.; Frisse, M.E.; Misulis, K.; Rhee, K.; Zhao, J.; Snowdon, J.L. Precision Medicine, AI, and the Future of Personalized Health Care. Clin. Transl. Sci. 2021, 14, 86–93. [Google Scholar] [CrossRef]
  31. Jabbar, M.A.; Samreen, S.; Aluvalu, R. The future of health care: Machine learning. Int. J. Eng. Technol. 2018, 7, 23–25. [Google Scholar] [CrossRef]
  32. Tarassoli, S.P. Artificial intelligence, regenerative surgery, robotics? What is realistic for the future of surgery? Ann. Med. Surg. 2019, 41, 53–55. [Google Scholar] [CrossRef] [PubMed]
  33. Leone, D.; Schiavone, F.; Appio, F.P.; Chiao, B. How does artificial intelligence enable and enhance value co-creation in industrial markets? An exploratory case study in the healthcare ecosystem. J. Bus. Res. 2021, 129, 849–859. [Google Scholar] [CrossRef]
  34. Abbaoui, W.; Retal, S.; El Bhiri, B.; Kharmoum, N.; Ziti, S. Towards revolutionizing precision healthcare: A systematic literature review of artificial intelligence methods in precision medicine. Inform. Med. Unlocked 2024, 46, 101475. [Google Scholar] [CrossRef]
  35. Ahmed, Z.; Mohamed, K.; Zeeshan, S.; Dong, X. Artificial intelligence with multi-functional machine learning platform development for better healthcare and precision medicine. Database 2020, 2020, baaa010. [Google Scholar] [CrossRef]
  36. Chang, D.; Chang, D.; Pourhomayoun, M. Risk Prediction of critical vital signs for ICU patients using recurrent neural network. In Proceedings of the 6th Annual Conference on Computational Science and Computational Intelligence, CSCI, Las Vegas, NV, USA, 5–7 December 2019; pp. 1003–1006. [Google Scholar] [CrossRef]
  37. Fenning, S.J.; Smith, G.; Calderwood, C. Realistic Medicine: Changing culture and practice in the delivery of health and social care. Patient Educ. Couns. 2019, 102, 1751–1755. [Google Scholar] [CrossRef] [PubMed]
  38. Carra, G.; Salluh, J.I.; Ramos, F.J.d.S.; Meyfroidt, G. Data-driven ICU management: Using Big Data and algorithms to improve outcomes. J. Crit. Care 2020, 60, 300–304. [Google Scholar] [CrossRef]
  39. Gupta, N.S.; Kumar, P. Perspective of artificial intelligence in healthcare data management: A journey towards precision medicine. Comput. Biol. Med. 2023, 162, 107051. [Google Scholar] [CrossRef] [PubMed]
  40. Johnson, N.; Parbhoo, S.; Ross, A.S.; Doshi-Velez, F. Learning Predictive and Interpretable Timeseries Summaries from ICU Data. AMIA Annu. Symp. Proc. 2021, 2021, 581–590. Available online: https://arxiv.org/abs/2109.11043v1 (accessed on 10 January 2022).
  41. McPadden, J.; Durant, T.J.; Bunch, D.R.; Coppi, A.; Price, N.; Rodgerson, K.; Torre, C.J., Jr.; Byron, W.; Hsiao, A.L.; Krumholz, H.M.; et al. Health care and precision medicine research: Analysis of a scalable data science platform. J. Med. Internet Res. 2019, 21, e13043. [Google Scholar] [CrossRef]
  42. Gligorijević, V.; Malod-Dognin, N.; Pržulj, N. Integrative methods for analyzing big data in precision medicine. Proteomics 2016, 16, 741–758. [Google Scholar] [CrossRef]
  43. Hulsen, T.; Jamuar, S.S.; Moody, A.R.; Karnes, J.H.; Varga, O.; Hedensted, S.; Spreafico, R.; Hafler, D.A.; McKinney, E.F. From big data to precision medicine. Front. Med. 2019, 6, 34. [Google Scholar] [CrossRef]
  44. Delen, D. Prescriptive Analytics: The Final Frontier for Evidence—Based Management and Optimal Decision; Pearson Education, Inc.: London, UK, 2020. [Google Scholar]
  45. March, J.G. Bounded Rationality, Ambiguity, and the Engineering of Choice. Bell J. Econ. 1978, 9, 587–608. [Google Scholar] [CrossRef]
  46. Simon, H. Theories of Decision-Making and Behavioral Science. Am. Econ. Rev. 1959, 49, 253–283. [Google Scholar]
  47. Sharda, R.; Delen, D.; Turban, E.; Aronson, J.E.; Liang, T.-P.; King, D. Business Intelligence and Analytics: Systems for Decision Support; Pearson: London, UK, 2014. [Google Scholar]
  48. Palanisamy, V.; Thirunavukarasu, R. Implications of big data analytics in developing healthcare frameworks—A review. J. King Saud Univ. -Comput. Inf. Sci. 2019, 31, 415–425. [Google Scholar] [CrossRef]
  49. Mosavi, N.S.; Santos, M.F. How prescriptive analytics influences decision making in precision medicine. Procedia Comput. Sci. 2020, 177, 528–533. [Google Scholar] [CrossRef]
  50. Mosavi, N.S.; Santos, M.F. Data Engineering to Support Intelligence for Precision Medicine in Intensive Care. In Proceedings of the 2022 International Conference on Computational Science and Computational Intelligence (CSCI), Las Vegas, NV, USA, 14–16 December 2022. [Google Scholar] [CrossRef]
  51. Mosavi, N.; Santos, M. Intelligent Decision Support System for Precision Medicine: Time Series Multi-variable Approach for Data Processing. In Proceedings of the International Joint Conference on Knowledge Discovery, Knowledge Engineering and Knowledge Management, IC3K, Valletta, Malta, 24–26 October 2022; Volume 3, pp. 231–238. [Google Scholar] [CrossRef]
Figure 1. Gaps and limitations.
Informatics 11 00068 g001
Figure 2. ICU datasets overview.
Informatics 11 00068 g002
Figure 3. Structure of CEid.
Informatics 11 00068 g003
Figure 4. Length of stay in ICU.
Informatics 11 00068 g004
Figure 5. Analysing Clinical Data for Patient with process number: “1000025.”
Informatics 11 00068 g005
Figure 6. Temporal analysis of diverse clinical transactions.
Informatics 11 00068 g006
Figure 7. Temporal analysis of Diagnostic transactions.
Informatics 11 00068 g007
Figure 8. Temporal analysis of intervention transactions.
Informatics 11 00068 g008
Figure 9. Temporal analysis of oxygen saturation.
Informatics 11 00068 g009
Figure 10. Temporal Analysis of Heart Rate.
Informatics 11 00068 g010
Figure 11. Temporal analysis of laboratory exams.
Informatics 11 00068 g011
Figure 12. Temporal analysis of sepsis.
Informatics 11 00068 g012
Figure 13. Temporal analysis of medications.
Informatics 11 00068 g013
Figure 14. Elbow method for the optimal number of clusters.
Informatics 11 00068 g014
Figure 15. Cluster-based mapping and assignment workflow.
Informatics 11 00068 g015
Figure 16. Behavior of Glasgow coma in each cluster.
Informatics 11 00068 g016
Figure 17. Behavior of systolic arterial blood pressure in each cluster.
Informatics 11 00068 g017
Figure 18. Behavior of arterial (mean) blood pressure in each cluster.
Informatics 11 00068 g018
Figure 19. Behavior of pulse rate of arterial blood pressure in each cluster.
Informatics 11 00068 g019
Figure 20. Behavior of diastolic arterial blood pressure in each cluster.
Informatics 11 00068 g020
Figure 21. Behavior of oxygen saturation level in each cluster.
Informatics 11 00068 g021
Figure 22. Behavior of heart rate in each cluster.
Informatics 11 00068 g022
Figure 23. Behavior of body temperature in each cluster.
Informatics 11 00068 g023
Figure 24. Behavior of sepsis in each cluster.
Informatics 11 00068 g024
Figure 25. Analyzing the total days of clinical transactions in each cluster.
Informatics 11 00068 g025
Figure 26. Temporal distribution of each cluster.
Informatics 11 00068 g026
Figure 27. Behavior of laboratory exams and results in each cluster.
Informatics 11 00068 g027
Figure 28. Distribution of interventions (codes) in each cluster.
Informatics 11 00068 g028
Figure 29. Distribution of diagnostic (codes) in each cluster.
Informatics 11 00068 g029
Figure 30. Distribution of medications (codes) in each cluster.
Informatics 11 00068 g030
Figure 31. Distribution of procedure-local (codes) in each cluster.
Informatics 11 00068 g031
Figure 32. Distribution of procedure-zona (codes) in each cluster.
Informatics 11 00068 g032
Figure 33. Significant features of RF.
Informatics 11 00068 g033
Figure 34. Contribution to the data-driven framework of clinical decision support system for precision medicine.
Informatics 11 00068 g034
Figure 35. Theoretical reference.
Informatics 11 00068 g035
Table 1. Techniques to deal with limitations associated with data processing.
TechniqueFocused AreaLimitations
attention scoresfeature importancefeature selection, time series data, nonlinear features
post-hoc explanation techniquesModeling and features relationsInterpretation-black box
summaries of patient time series dataData extraction-time-series clinical datavital signs and lab data
Filtering outliersData cleaningTime series data-vital signs
ElectronData extractionPhysiologic Signal Monitoring and Analysis
Topological Data Analysis (TDAs)Dimensionality Reduction
anytime algorithmsVelocitylearn from streaming data
GNMTF VarietyComplex when data types increase
Table 4. Cluster references.
Indicator—Numerical
(692 rows, 8 columns)
CLUSTER 0CLUSTER 1CLUSTER 2CLUSTER 3
Silhouette Score:
0.23
Silhouette Score:
0.12
Silhouette Score
0.26
Silhouette Score: 0.36
Data Distribution:
271
Data Distribution:
44
Data Distribution:
285
Data Distribution:
92
MinMaxMinMaxMinMaxMinMax
the pulse rate of the arterial blood pressure70.54144.3270.34123.4642.69101.4355.27124.39
diastolic arterial blood pressure48.80138.3710.8353.5037.01101.6040.5188.03
systolic arterial blood pressure82.88173.6645.1596.0398.27179.9874.60164.71
mean arterial blood pressure51.20143.8631.6561.2267.61165.6658.62108.86
heart rate47.71144.6557.38149.0249.63116.3254.46133.74
pulse oximetry oxygen saturation level49.1899.4671.3198.7577.8599.5465.0099.03
body temperature30.6539.0023.5338.6729.6437.9116.7432.63
day of the clinical event137139129119
Table 5. Analyzing the behavior of data in each cluster.
Numerical Variables C0C1C2C3
the pulse rate of the arterial blood pressureaverage111.0390.4274.8779.01
minimum70.5470.3442.6955.27
maximum136.56109.50101.35121.17
diastolic arterial blood pressureaverage64.5635.6464.9856.27
minimum48.8010.8337.0143.49
maximum104.7553.5098.2784.61
systolic arterial blood pressureaverage108.6455.57128.06101.38
minimum82.8845.1598.2774.60
maximum172.1388.72178.96158.90
mean arterial blood pressureaverage77.9242.8085.3170.51
minimum51.2031.6567.6158.62
maximum114.9060.12149.11103.85
pulse oximetry oxygen saturation levelaverage96.0473.1495.4093.85
minimum49.1871.3177.8586.71
maximum99.1397.9399.4699.00
Heart rateaverage107.0477.6875.2080.84
minimum47.7157.3849.6354.46
maximum137.93142.82114.80131.86
Body temperatureaverage36.5227.0236.5330.01
minimum31.2723.5331.0316.74
maximum3838.6337.9032.62
Day of clinical eventaverage1.051.091.211.08
minimum1111
maximum37393619
Glasgow Coma Scaleaverage2.65.3314.5114.10
minimum3.005.337.003.00
maximum15.005.3315.0015.00
Table 6. Model Performance.
MetricsValue (Mean)
Accuracy95.36%
Precision0.961
Recall0.946
Kappa0.912
F1 score0.946
AUC0.997
Disclaimer/Publisher’s Note: The statements, opinions and data contained in all publications are solely those of the individual author(s) and contributor(s) and not of MDPI and/or the editor(s). MDPI and/or the editor(s) disclaim responsibility for any injury to people or property resulting from any ideas, methods, instructions or products referred to in the content.