Article

Evaluating and Enhancing Artificial Intelligence Models for Predicting Student Learning Outcomes

1
School of Mathematical and Physical Sciences, Macquarie University, Sydney, NSW 2109, Australia
2
School of Computing, Macquarie University, Sydney, NSW 2109, Australia
*
Author to whom correspondence should be addressed.
Informatics 2024, 11(3), 46; https://doi.org/10.3390/informatics11030046
Submission received: 10 May 2024 / Revised: 10 July 2024 / Accepted: 10 July 2024 / Published: 15 July 2024

Abstract

:
Predicting student outcomes is an essential task and a central challenge among artificial intelligence-based personalised learning applications. Despite several studies exploring student performance prediction, there is a notable lack of comprehensive and comparative research that methodically evaluates and compares multiple machine learning models alongside deep learning architectures. In response, our research provides a comprehensive comparison to evaluate and improve ten different machine learning and deep learning models, either well-established or cutting-edge techniques, namely, random forest, decision tree, support vector machine, K-nearest neighbours classifier, logistic regression, linear regression, and state-of-the-art extreme gradient boosting (XGBoost), as well as a fully connected feed-forward neural network, a convolutional neural network, and a gradient-boosted neural network. We implemented and fine-tuned these models using Python 3.9.5. With a keen emphasis on prediction accuracy and model performance optimisation, we evaluate these methodologies across two benchmark public student datasets. We employ a dual evaluation approach, utilising both k-fold cross-validation and holdout methods, to comprehensively assess the models’ performance. Our research focuses primarily on predicting student outcomes in final examinations by determining their success or failure. Moreover, we explore the importance of feature selection using the ubiquitous Lasso for dimensionality reduction to improve model efficiency, prevent overfitting, and examine its impact on prediction accuracy for each model, both with and without Lasso. This study provides valuable guidance for selecting and deploying predictive models for tabular data classification like student outcome prediction, which seeks to utilise data-driven insights for personalised education.

1. Introduction

Artificial intelligence (AI) has transformed numerous industries, and its influence on education, particularly in personalised learning, is becoming more substantial [1]. Using data-driven techniques to identify patterns, predict student performance, and subsequently modify instructional strategies is vital to this paradigm. Moreover, one of the most important aspects of resolving real-world data science challenges is selecting the appropriate model types [2]. Then, this paper explores the field of AI-based personalised learning assessment, with particular emphasis on predicting student outcomes by comparing various machine and deep learning models on tabular data.
AI can offer the utilisation of high-quality learning in the field of education, and personalization can provide different advantages [3]. AI-based personalised learning has applications in diverse educational scenarios, from K-12 to higher education and professional training [4]. Student engagement and learning gains can be increased by providing feedback, especially in complex subjects like high school algebra [5]. The prediction of student performance is a crucial application in which machine learning and deep learning techniques play a critical part. One of the cutting-edge applications of artificial intelligence in education is AI-enabled academic performance prediction, which helps recognise students who are likely to fail, establish student-centred learning pathways to improve learning efficacy and optimise pedagogical development and planning [6]. Then, the usage of machine learning and deep learning techniques plays a vital role in this field. Several studies have investigated the field of predicting student performance using machine learning algorithms [6,7,8]. However, despite these efforts, there is a significant absence of comprehensive and comparative research that practically evaluates multiple machine learning and deep learning models.
In this study, we intend to undertake a comprehensive analysis that includes not only a comparison of primary and widely used machine learning models but also the implementation of cutting-edge, state-of-the-art techniques in both machine learning and deep learning approaches. Our research goes beyond the commonly used repertoire of machine learning models, which consists of k-nearest neighbours (kNNs) [9], support vector machines (SVMs) [10], decision trees (DT) [11], linear regression [12], logistic regression [13], and random forest [14]. In addition to these well-established models, we implement state-of-the-art techniques such as extreme gradient boosting (XGBoost) [15]. Our research is expanded to include deep learning techniques, such as a fully connected feed-forward neural network (FFNN) [16], a convolutional neural network (CNN) [17], and the cutting-edge gradient-boosted neural network (GBNN) [18,19], while analysing the impact of varied hyperparameters, including the number of nodes in each layer, the number of training epochs, and the batch size. The number of epochs is defined as a hyperparameter in gradient descent that determines the number of entire iterations over the training dataset [20]. As hyperparameter tuning methods, Bayesian optimisation [21,22] was used to fine-tune the hyperparameters of the deep learning models, and cross-validation [23] was employed to determine the most suitable Lasso regularisation threshold. These methods are intended to raise the limits of predictive accuracy and highlight the importance of adopting innovative approaches in AI-based student outcome prediction.
Moreover, the significance of dimensionality reduction in enhancing model performance and preventing overfitting is elaborated upon as we extend our investigation to the domain of regularisation-based feature selection. By employing Lasso as a mechanism for model selection, we evaluate the performance of each model with and without such features, providing insights into the effects of dimensionality reduction on the accuracy of predictions. While these models have been individually applied in various contexts, our comparison addresses their effectiveness in predicting student outcomes within an educational framework. Moreover, our study emphasises practical applicability by evaluating these models using both k-fold cross-validation [24] and holdout [25] on two public real-world student datasets as more comprehensively introduced in the methods section below. The first dataset is from [26,27,28] and the second is from [29,30,31]. Specifically, we aim to predict the outcome of students’ final exams by assessing whether they will pass or fail.
By incorporating these evaluation techniques, we ensure a comprehensive assessment of the model’s predictive capabilities within the context of AI-based student performance prediction. The entire investigation is conducted using the Python programming language, taking advantage of its extensive infrastructure of data science libraries and frameworks to implement, train, and evaluate the various machine learning and deep learning models under consideration. The three guiding research questions (RQs) that emphasise our investigation’s depth and relevance, encompassing established and cutting-edge models to predict student outcomes, are as follows:
  • RQ1: How do machine learning and deep learning models compare in predicting student outcomes to improve AI’s use in education?
  • RQ2: How does the Lasso feature selection affect the accuracy and performance of AI models in predicting student outcomes?
  • RQ3: How do hyperparameter tuning techniques like Bayesian optimisation and cross-validation enhance the adaptability of AI-based educational prediction models?
Our main contributions are:
  • First, we comprehensively assess ten different predictive models. These contain seven machine learning architectures and three deep learning architectures covering fundamental and cutting-edge approaches. All models are implemented using Python on two public benchmark student datasets.
  • Second, we examine the influence of Lasso-based regularisation on model performance improvement. In this investigation, the accuracy and efficiency of the models across all ten models are evaluated in terms of feature selection through Lasso regularisation.
  • Third, we use hyperparameter tuning techniques to optimise model configurations. Bayesian hyperparameter optimisation is employed to fine-tune the deep learning models, while cross-validation is utilised to determine the optimal threshold for Lasso regularisation.
  • Fourth, our evaluation methodology includes a dual approach, using both k-fold cross-validation and holdout validation methods. This robust assessment strategy ensures that the performance of our models is evaluated thoroughly.
  • Finally, the insights obtained from our research provide educators, researchers, and policymakers with essential information. This knowledge allows them to make informed decisions regarding personalised educational plans based on the capabilities of predictive models.
Furthermore, we provide access to our source code [32] to facilitate the replication of our findings.

2. Related Works

Upon a review of prior research in the field of AI-driven personalised learning assessment, we have organised the related work into three primary categories.

2.1. Prediction of Student Performance

This category includes research focused on predicting student outcomes using AI-driven methodologies. Scholars have studied predictive modelling, employing a variety of machine learning and deep learning techniques to predict student performance. These efforts aim to provide educators with early insights into prospective challenges and opportunities, thereby assisting them well in advance of students’ final exams and ultimate outcomes. González et al. [33] analysed the Learning Management Systems (LMS) log files generated up until the moment of prediction. They utilised machine learning to construct models for the early prediction of students’ performance in completing LMS tasks. When data mining is employed within the field of education, it involves adapting data mining methods to suit the educational context and could be utilised to categorise or forecast student performance [8]. Several research studies have been conducted on adaptive technologies for education, including educational data mining and learning analytics [34,35].

2.2. Evaluating Student Progression

Research in this domain concentrates on evaluating the progress and growth of students using AI-powered methods. Utilising AI algorithms, academics analyse student learning pathways and milestones in order to provide timely and informative evaluations of progress. The purpose of these investigations is to improve comprehension of student development. As for the importance of evaluating student progress, Arroway et al. [36] claimed that institutions utilise learning analytics data more frequently for tracking or evaluating student progress than to predict success or recommend intervention methods. Casey et al. [7] discarded assumptions regarding how students absorb and utilise course material, for predicting student performance using educational analytics. They investigated the rate at which students apply the concepts they are taught during a semester. In addition, they presented a primitive classification system for early identification of poor performance and demonstrated how it can be enhanced by incorporating data on when students first use a concept.

2.3. Developing a Model of Adaptive Feedback

This category includes the development and evaluation of AI-guided adaptive feedback systems. Researchers have attempted to develop dynamic feedback systems that provide students with tailored instruction based on their progress and learning approaches. Adaptive learning is an instructional methodology that leverages technology to deliver individualised educational experiences customised to each student’s specific requirements, inclinations, and advancements [37]. These mechanisms utilise AI algorithms to deliver timely and pertinent feedback. Generative AI systems, on the other hand, may be able to resolve issues related to resources and specificity by providing customised experiences that replicate the flexibility and responsiveness of an actual tutor [38]. Mitri et al. [39] presented a multimodal, real-time feedback mechanism for cardiopulmonary resuscitation (CPR) training. They focused on a particular aspect of the CPR training procedure to create the CPR Tutor and proved the idea of a new CPR technology that allows real-time feedback provision via multimodal data and techniques of machine learning. Modern statistical machine learning techniques were utilised by Lutz et al. [40] to generate personalised recommendations and feedback. They presented a feedback system titled Trier Treatment Navigator (TTN), which offers personalised pre-treatment and customised recommendations during treatment.

3. Methods

Our methodology is designed to align with our primary goal of conducting a thorough comparative analysis of models within the student performance prediction domain. The development of this workflow draws upon insights gleaned from prior research [41,42,43] while allowing for modification and expansion to better suit our objectives and an in-depth evaluation of commonly used practices. This methodology is structured to comprehensively and practically assess the effectiveness of various machine learning and deep learning models by integrating elements with a track record of producing reliable results. Figure 1 presents a visual overview of the workflow in our research work. The framework is guided by the following critical stages, strategically organised to ensure a thorough and reliable comparative analysis:

3.1. Data Acquisition and Preparation

We utilise two public real-world datasets in our research. The first dataset was created by Paulo Cortez [26,27,28] and includes data on students from two Portuguese schools; we specifically utilise their database that focuses on mathematics education. This dataset, which is referred to as the “Math dataset” throughout our paper, features a set of variables crucial for predicting student performance, containing 395 rows and 33 columns that represent a wide range of attributes relevant to student outcomes. The data collected through school reports and student questionnaires contain various variables to explore the factors influencing educational outcomes. These variables include not only grades (G1, G2, and G3) but also demographic details such as age and sex, as well as social aspects such as family educational support and student lifestyle preferences, for example, habits of weekend alcohol consumption. In this study, we focus on predicting the student learning outcomes, which are defined based on final grades (G3), with ’Pass’ given to grades over 10 and ‘Fail’ for 10 or below. Multiple research studies have utilised this database, as evidenced by the references [44,45,46]. To ensure a diverse range of data not only from different countries but also from various educational levels, we select a second public dataset, xAPI-Edu-Data [29,30,31]. This dataset contains information from 480 students across primary, secondary, and high school levels and includes 16 attributes from students in 14 different countries such as Kuwait, Egypt, Saudi Arabia, USA, Jordan, etc. It covers a variety of course topics, including English, Spanish, French, Arabic, IT, maths, chemistry, science, etc. This dataset is derived from the Kalboard 360 learning management system, and the data were collected through an experienced API (xAPI), part of a training and learning architecture that tracks learner activities across diverse educational resources [29]. This approach ensures that a dataset provides insight into demographic and academic backgrounds and behavioural patterns, such as engagement in class activities, resource utilisation, and parental involvement in the educational process. The ‘Class’ column from this dataset categorises the students’ overall performance into low, middle, and high levels based on their total grades. In our study, we predicted student outcomes by converting this column to numerical values (low as 1, middle as 2, high as 3). Subsequently, we classified these scores as ’Pass’ for middle and high scores and ‘Fail’ for low scores, which served as our target variable for the predictions. Other published papers have also utilised these two public datasets for their performance verification, such as [47,48].

3.2. Data Preprocessing

In order to prepare the data for analysis, we apply one-hot encoding (dummy coding), which is a common and straightforward encoding technique [49,50,51] to nominal categorical variables. This preprocessing technique transformed the variable count from 33 to 41 in the Math dataset, as well as from 16 to 38 in the xAPI dataset. Notably, ordinal categorical variables are already label-encoded within the datasets. We refrain from applying one-hot encoding to ordinal categorical variables to control an unwarranted surge in the variable count and keep a balanced feature-to-sample ratio. Moreover, the xAPI dataset contains three variables—nationalities, birthplace, and topics—spanning numerous categories, some with limited observations. To address this, we keep the top four most frequent categories within each variable and group the rest under “Other”.

3.3. Model Selection and Implementation

Our approach involves selecting and implementing ten distinct models, comprising seven machine learning models and three deep learning models. For implementing machine learning models, we used the scikit-learn library [52], a free software machine learning library in Python. This ensemble consists of a variety of models, namely k-nearest neighbours (kNNs) [9], support vector machines (SVMs) [10], decision trees (DTs) [11], linear regression [12], logistic regression [13], random forest [14], and state-of-the-art techniques such as the extreme gradient boosting (XGBoost) model [15,53]. XGBoost stands out as an innovative machine learning algorithm, and it is recognised as a highly efficient implementation of gradient-boosted decision trees designed to enhance the performance of machine learning models [15,54,55]. In addition, we explore the domain of deep learning by examining three different neural network architectures, namely the feed-forward fully connected neural network (FFNN) [16], convolutional neural networks (CNNs) [17], and cutting-edge gradient-boosted neural networks (GBNNs) [18,19]. The FFNN architecture consists of three layers, including an input layer, followed by two hidden layers, each incorporating rectified linear unit (ReLU) activation functions. A single node with a sigmoid activation function serves as the network’s output layer. A binary cross-entropy loss function was used to train the FFNN. The three layers are used to keep the model straightforward and standardised, allowing us to establish a baseline for performance while ensuring sufficient depth for learning relevant features [56,57,58]. CNN contains a convolutional layer, a max-pooling layer, a flattening layer, hidden dense layers with ReLU activation, and an output layer with sigmoid activation. Following [18], we used GBNN as a gradient-boosted ensemble of neural networks in which logistic activation is used as an activation function.
We use Python, a flexible and extensively used programming language within the data science community, to operationalise these models. Using prominent data science libraries such as scikit-learn [52] and TensorFlow [16], the implementation process allows us to construct and evaluate these models effectively while ensuring reproducibility through the use of a random seed. This selection of tools guarantees not only the accuracy of our analysis but also the seamless incorporation of cutting-edge methodologies. In addition, we have made our source code available from GitHub [32] to enable the reproducibility of the results.
For clarity, in this study, student learning outcomes refer to measurable academic performance indicators, especially final grades (G3) in the first dataset and categorised performance levels (low, middle, high) in the second, illustrated by the ‘Class’ column. For the first dataset, ‘student learning outcomes’ are defined based on final grades, with ‘Pass’ given to grades over 10 and ‘Fail’ for 10 or below. In the second dataset, performance levels are numerically converted and then categorised into ‘Pass’ for middle (2) and high (3) scores and ‘Fail’ for low (1) scores.

3.4. Hyperparameter Tuning

In this research work, we employ automatic hyperparameter tuning approaches to discover the most effective model configurations. To optimise the performance of both FNN and CNN models, we use Bayesian hyperparameter optimisation [21,22] to adjust their hyperparameters. This process is essential in model development, as it helps us identify the best settings for neural networks, assuring they learn effectively from the data and yield optimal results. We experiment with a range of hyperparameter values for deep learning models, including the number of nodes in each layer, training epochs, batch size and learning rate. Bayesian optimisation, a powerful hyperparameter tuning technique, efficiently examines this high-dimensional space, leading to models that can adapt and generalise effectively to new data, improving their robustness and adjustability in real-world scenarios. For Lasso regularisation, we employ cross-validation [23] to determine the ideal threshold, which helps prevent overfitting and enhances generalisation when dealing with unobserved data. In the case of machine learning models, default parameter settings are maintained to keep uniformity and consistency across all models. We do not explore how to repeatedly use cross-validation [59] and other strategies for the tuning of hyperparameters, as this is beyond the scope of this paper.

3.5. Model Evaluation and Comparison

Our evaluation method consists of two distinct approaches: k-fold cross-validation and holdout validation, including both training and testing phases. The k-fold cross-validation assesses model performance across diverse data subsets, whereas holdout validation divides the data into two portions, training on one and testing with the trained model on the other [25]. Our cross-validation implementation demonstrates the essence of robustness and generalizability. By subjecting our models to cross-validation during training and testing, we improve their ability to consistently perform across diverse subsets of data. This technique not only contributes to the dependability of our results but also the practical applicability of our models in real-world situations. It ensures that the performance of our models is not dependent on a single data division, thereby making them adaptable and trustworthy in a variety of contexts.

3.6. Feature Selection and Dimensionality Reduction

We use the least absolute shrinkage and selection operator (Lasso) [60] for feature selection, thereby enhancing model performance and reducing overfitting. This technique facilitates the extraction of essential features while eliminating irrelevant features, thereby enhancing the predictive ability and transparency of the model [61]. Our analysis evaluates the efficacy of each of the ten selected machine learning and deep learning models with and without Lasso-regularised features. We determine the contributions of Lasso regularisation in the context of AI-based student outcome prediction, examining the influence of dimensionality reduction on prediction accuracy. Predicting student data can present a distinctive difficulty, primarily characterised by a large number of features relative to the number of samples, particularly when using one-hot encoding to manage categorical data. In our analysis of student data, for example, we have 41 features and 395 data points in our sample. The abundance of irrelevant features can lead to overfitting, which can compromise the performance of machine learning and deep learning models. In order to resolve this issue, model selection is frequently used to reduce dimensionality, thereby mitigating overfitting and enhancing the model’s overall performance. So, Lasso is used as a preliminary phase for dimensionality reduction prior to the implementation of the ten models, which is determined by a hyperparameter that controls the degree of regularisation and resulting model sparsity. Cross-validation [23] is used to optimise this hyperparameter, providing a good estimate of prediction error [23,62] and developing enhanced generalisation capabilities when presented with new, unobserved data.

3.7. Visualisation of Results

We utilise boxplots (e.g., as in Figure 2) to report model performance, where red lines represent the median values, and we augment the boxplots with mean values as shown by green triangles.

4. Results

In this section, we present the results of the model implementations and evaluations, with a primary focus on the field of student performance prediction. Recently, students are not only prompted by recent developments in information technology to investigate novel aspects of learning but also encouraged to incorporate these technologies into their pedagogical approaches [63]. Our goal is to determine whether students will pass their exams, using and comparing a blend of both foundational and cutting-edge approaches in both machine learning and deep learning. Before diving into the detailed results of the models, it is necessary to outline our evaluation methodologies. Our evaluation techniques primarily consist of two approaches: holdout evaluation and k-fold cross-validation. Holdout evaluation enables us to evaluate model performance by creating a single train–test split, whereas k-fold cross-validation provides a more robust assessment of model generalisation by partitioning the dataset into multiple subsets and training and testing the models repeatedly. Moreover, we performed an analysis of variance (ANOVA) to test for equality of the examined methods, which yielded a p-value for the corresponding F-statistic, providing evidence for concluding that the observed differences between the models are significant. In the following subsections, we will compare the efficacy of machine learning and deep learning models with and without Lasso regularisation and present the results in each case.

4.1. Machine Learning Models with Holdout Evaluation

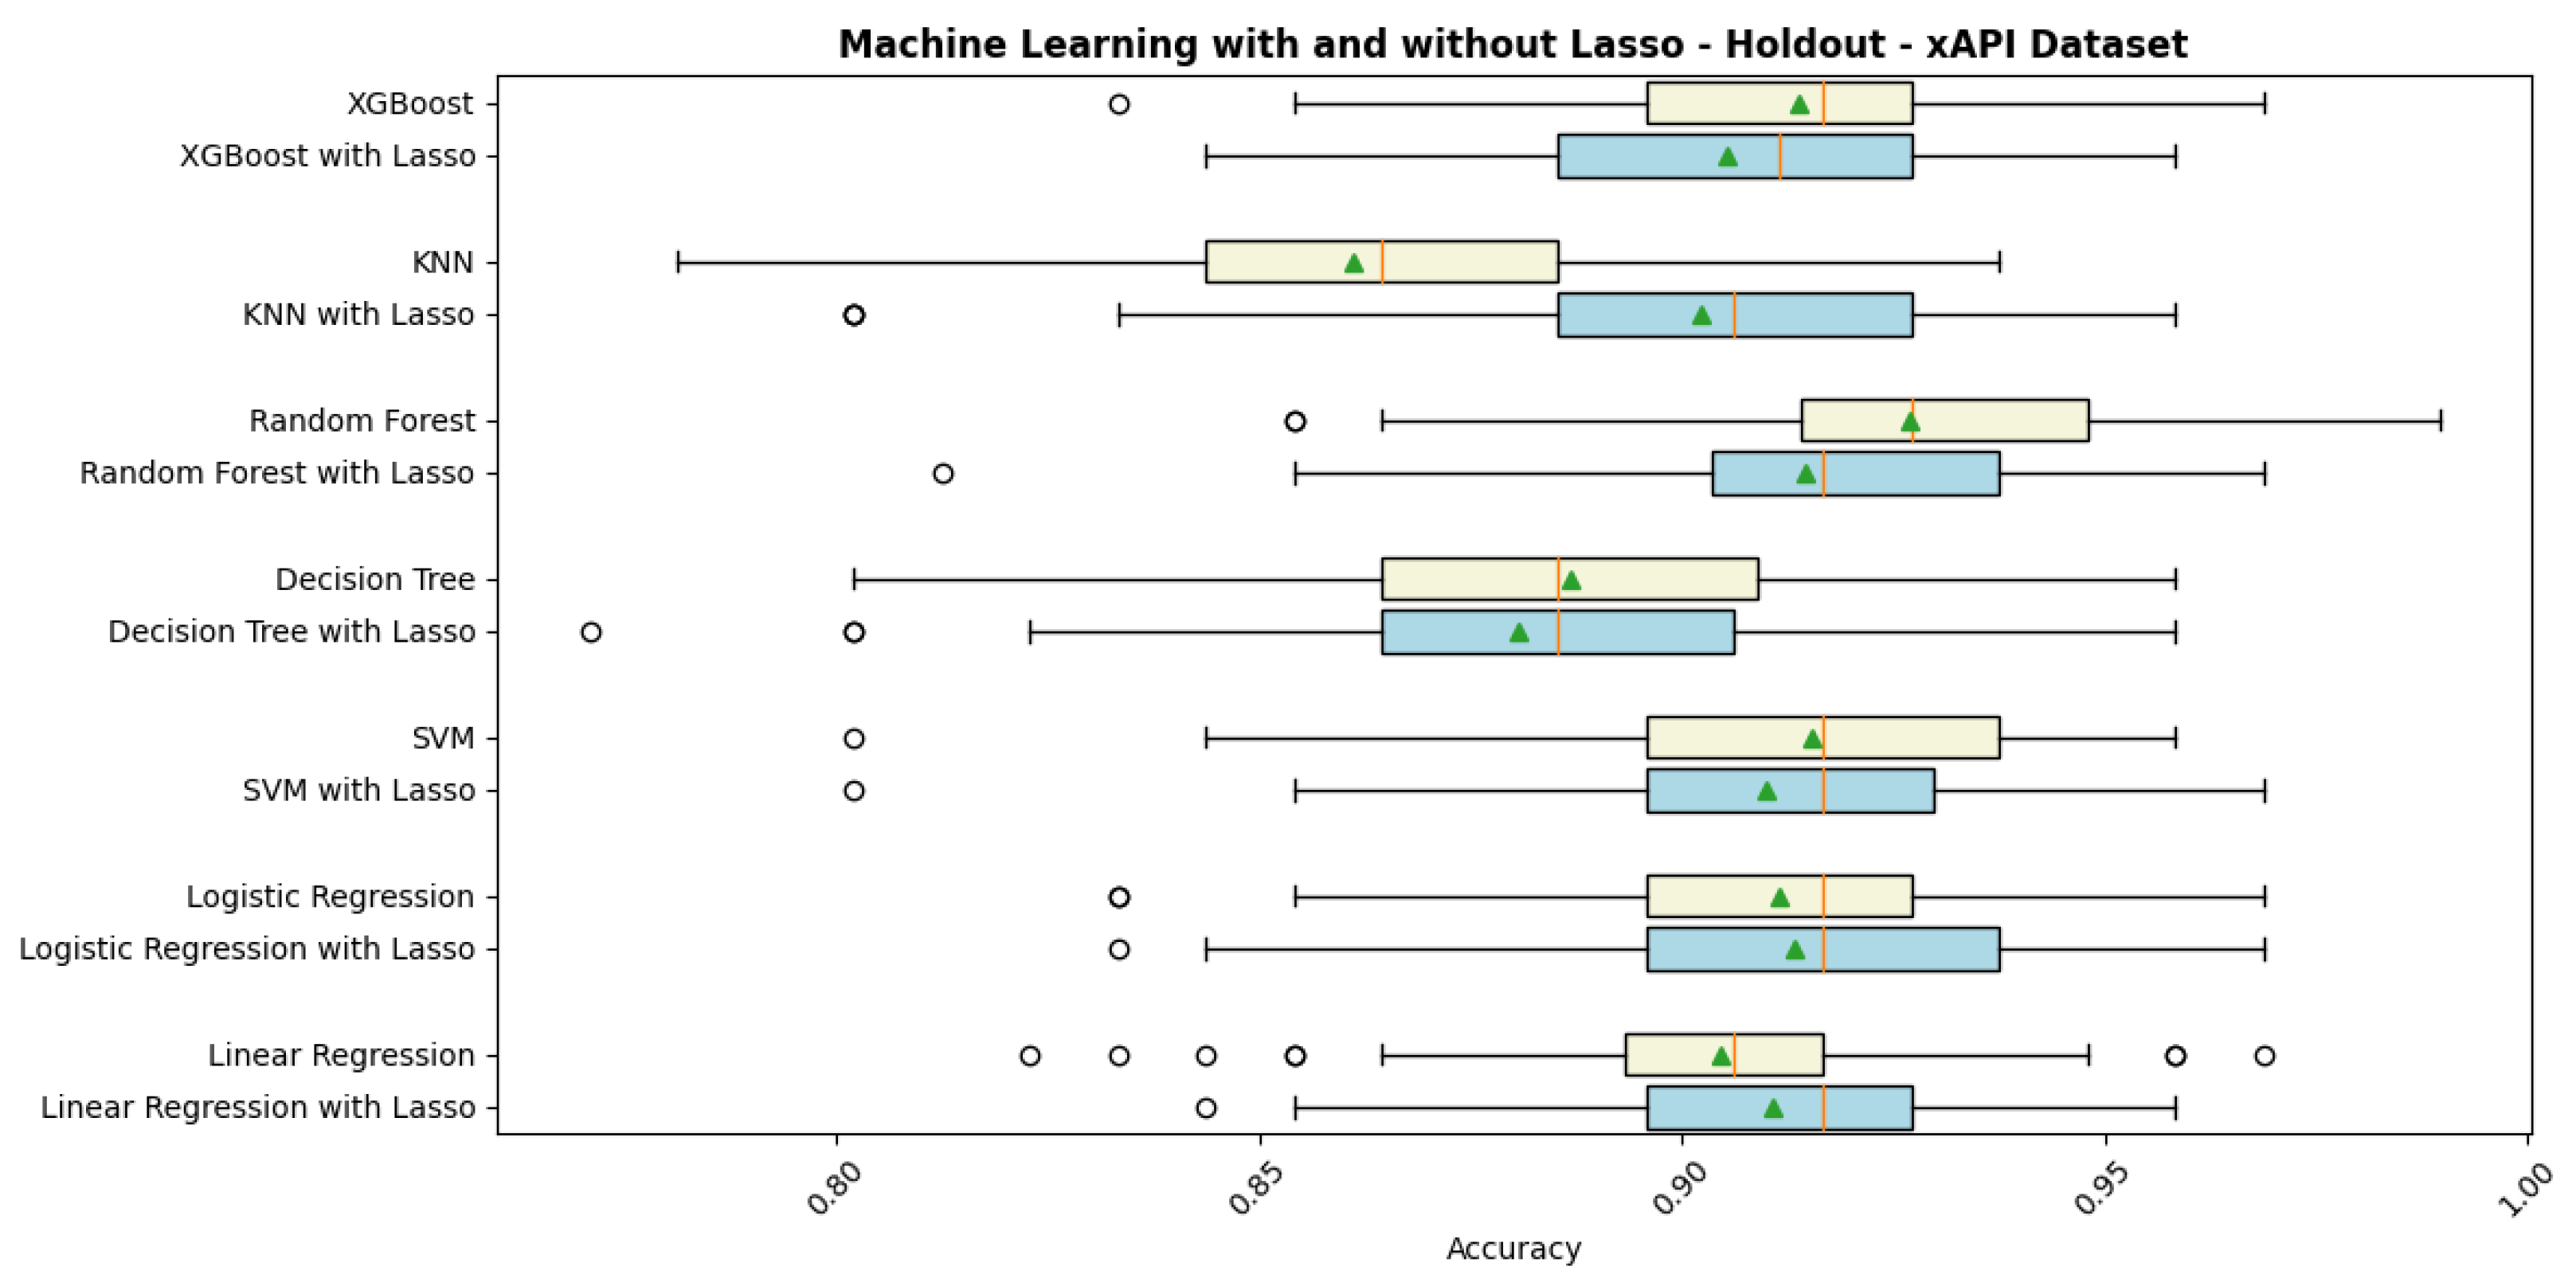
We present the results obtained by applying a holdout evaluation method to the machine learning models. Here, the datasets are split in two; eighty per cent of the data are used to train the model, and the other twenty per cent are utilised to assess its performance. We compare the predictive accuracy of machine learning models with and without Lasso regularisation, as well as the effect of Lasso on model stability, in order to evaluate the effectiveness of these models. Each model undergoes 100 iterations, allowing us to analyse the distribution of accuracy scores and gain insights into model behaviour. The mean accuracy ratings for each machine learning model for both datasets are displayed in Table 1. This evaluation allows us to calculate the efficacy of both fundamental and cutting-edge techniques across various machine learning models. From the ANOVA test, we determined that the differences in predictive performance among the machine learning holdout configurations are statistically significant for both the Math dataset (F-statistic = 93.91 and p-value < 1 × 10 12 ) and the xAPI dataset (F-statistic = 35.73 and p-value < × 10 12 ). In addition, we provide a visual summary of the results through boxplots in Figure 2 for the Math dataset and Figure 3 for the xAPI dataset. Therefore, comparing machine learning models, using the holdout validation, we noted that random forest achieved the highest mean accuracy among all machine learning models, both with and without the use of Lasso, across both datasets. Following random forest, the models XGBoost, logistic regression, and SVM showed better performance compared to others. Additionally, it seems that the application of Lasso positively impacted the performance of kNN, logistic regression, and linear regression for both datasets. For instance, the mean accuracy of kNN for the xAPI dataset increased from 86.10% to 90.23% with the use of Lasso.
In our analysis, the random forest model gives the most accurate prediction of student outcomes for the Math and xAPI datasets. Moreover, we use the feature importance analysis conducted through the random forest model to determine the top five significant features for each dataset. For the Math dataset, the features are ranked as follows: G2 (second-period grade, reflecting mid-year academic performance), G1 (first-period grade, demonstrating initial academic performance), failures (number of previous academic failures), absences (total number of classroom absences), and age. Therefore, the most significant impact on final academic outcomes is demonstrated by G2. For the xAPI dataset, the features that greatly impact model accuracy include StudentAbsenceDays_Under-7 (the total number of days that each student has been absent ), VisitedResources (frequency of resource access), raisedhands (the total number of raising hands in class), AnnouncementsView (frequency of announcement checks), and Discussion (frequency of student discussion group participation), with StudentAbsenceDays_Under-7 as the top feature. This was achieved by extracting the feature importances from the model, associating them with their corresponding feature names from the dataset, and then ranking these features to determine the top five most influential for each dataset.

4.2. Machine Learning Models with k-Fold Cross-Validation

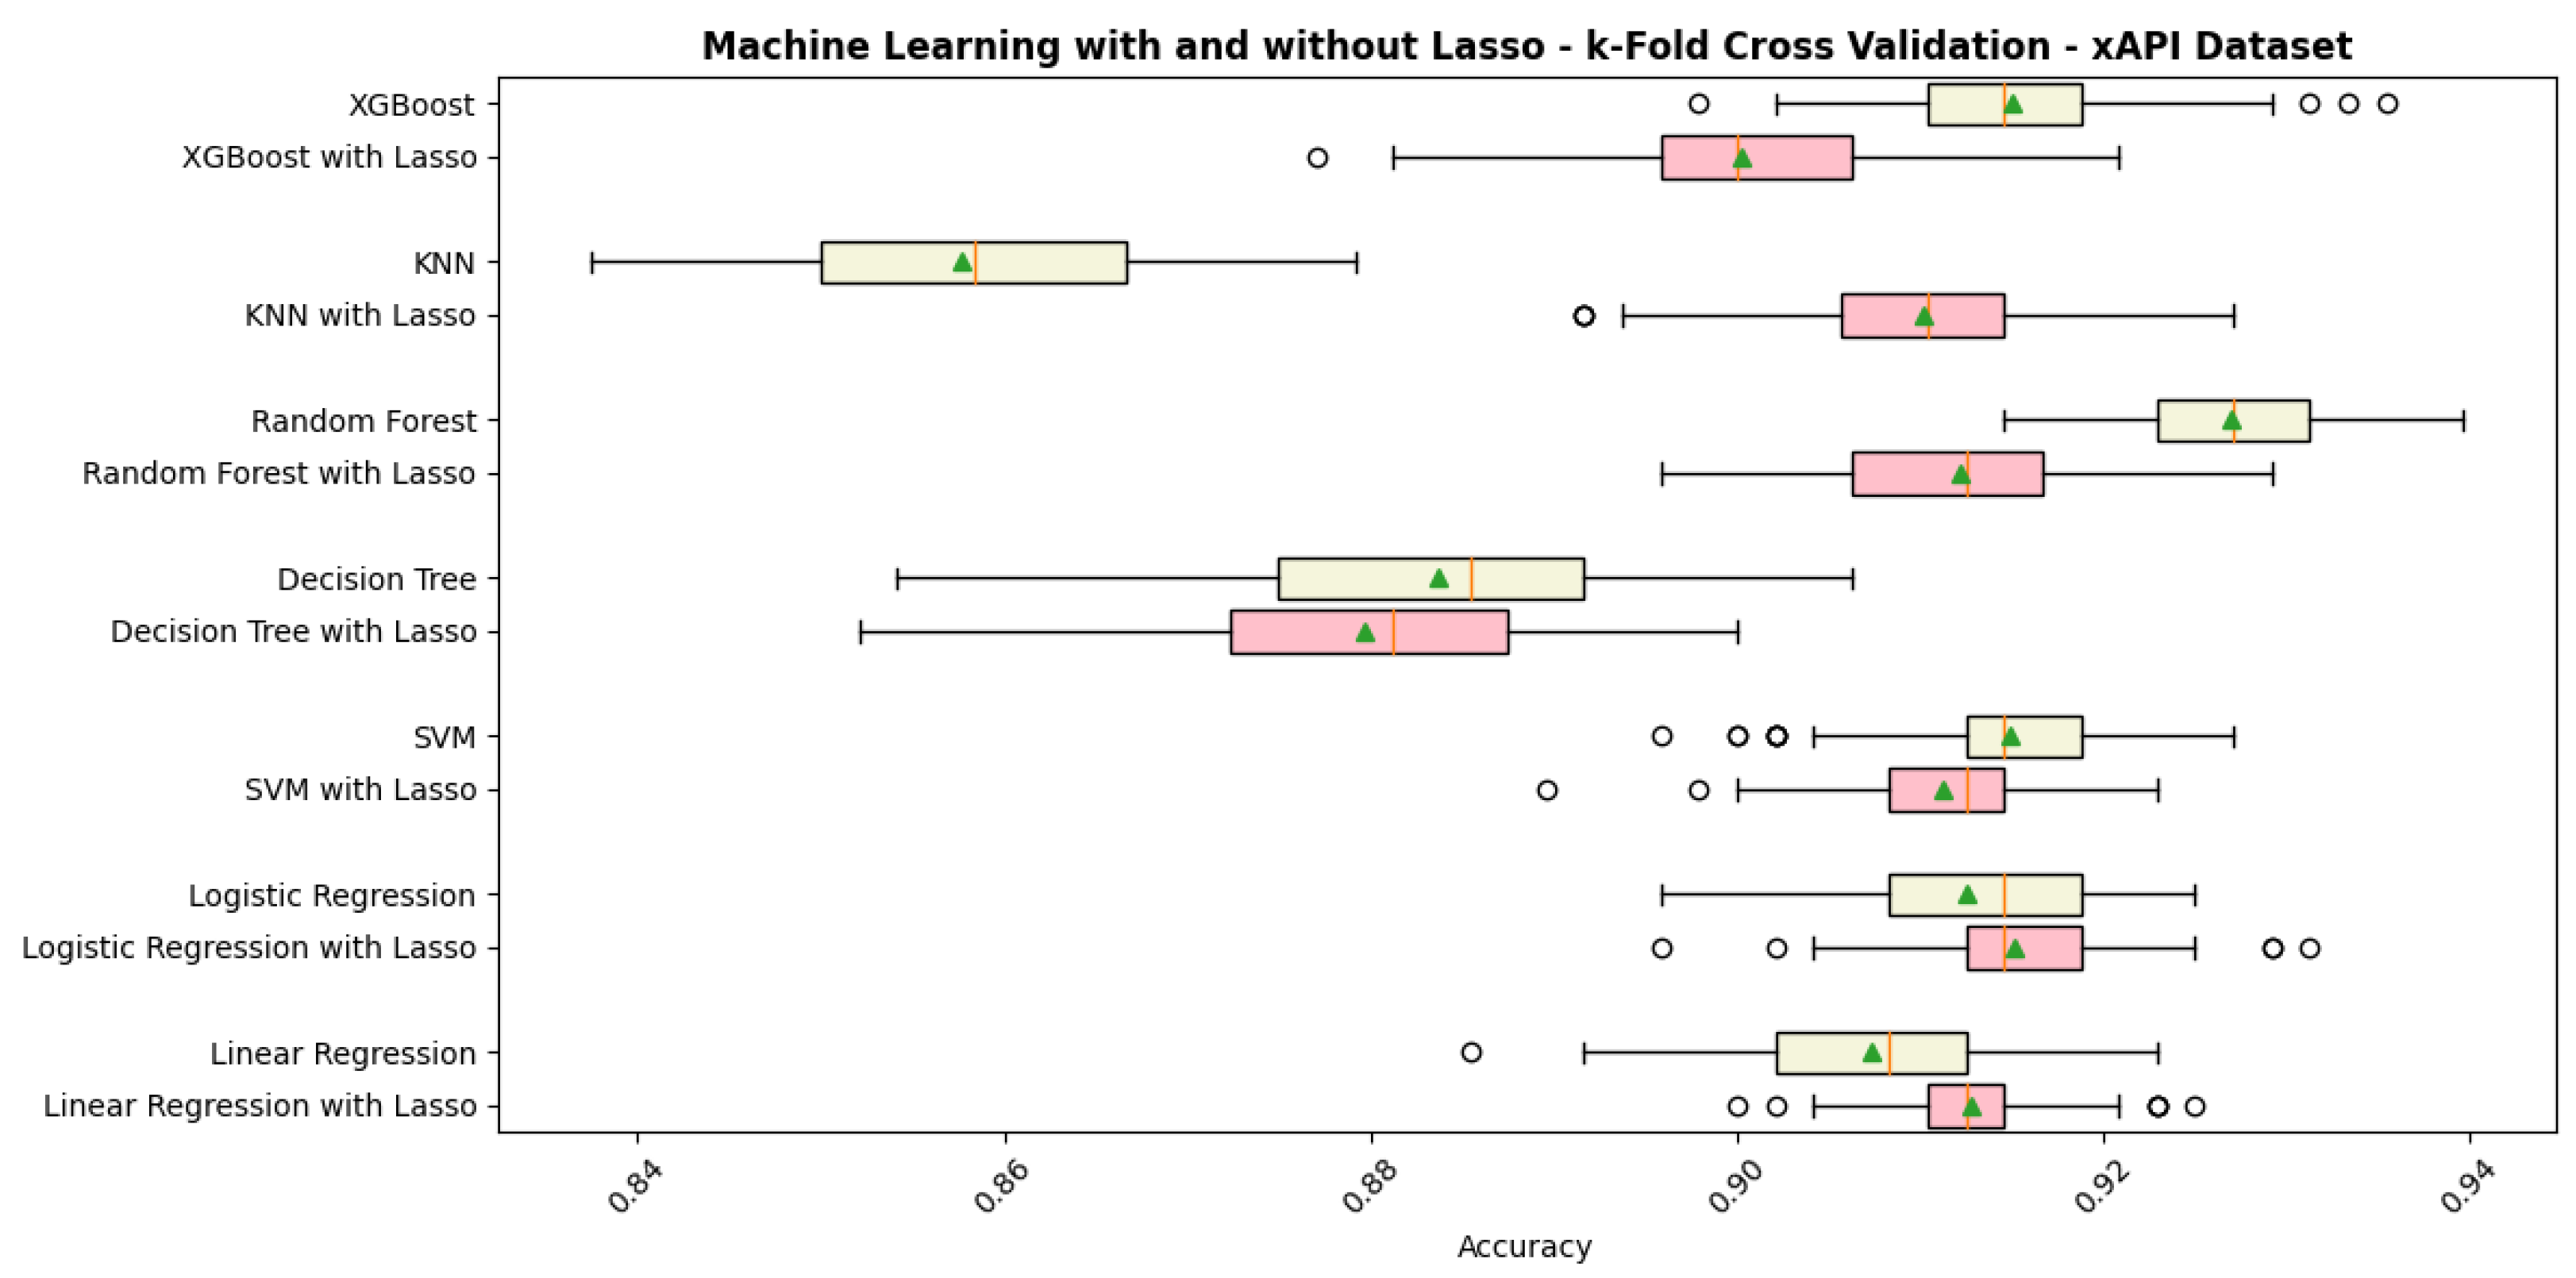
We provide the results of k-fold cross-validation applied to the machine learning models. Unlike holdout validation, which involves a single dataset split, k-fold cross-validation divides the data into K subsets, and each subset is used for testing while the model is trained on the remaining K 1 subsets. In our analysis, we choose K = 5 . Each machine learning model is subjected to 100 iterations with k-fold cross-validation in each iteration for a thorough examination. This method not only enables the computation of mean accuracy scores but also provides insight into the distribution of accuracy values, thereby enhancing our knowledge of how well the models perform. Following k-fold cross-validation, Table 2 displays the mean accuracy scores for each machine learning model with and without Lasso for both datasets. The results from the ANOVA test clearly indicate substantial differences in the effectiveness of various machine learning models with k-fold configurations, evidenced by an F-statistic of 2551.08 and a p-value < 1 × 10 12 for the Math dataset and an F-statistic of 557.19 and a p-value < 1 × 10 12 for the xAPI dataset. Figure 4 presents boxplots to graphically illustrate our findings for the Math dataset and Figure 5 for the xAPI dataset. These boxplots depict the distribution of accuracy values across the evaluated models and highlight the effect of Lasso on performance during k-fold cross-validation with and without Lasso for both datasets. Therefore, in our analysis using k-fold, the machine learning models displayed nearly similar patterns to those observed with holdout validation. For the Math dataset, random forest achieved the highest mean accuracy both with and without Lasso, while for the xAPI dataset, the highest accuracy without Lasso was also from random forest, and logistic regression performed best with Lasso. Models like XGBoost, logistic regression, and SVM continued to show better performance compared to other models. The effect of Lasso is particularly noticeable in models like kNN, linear regression, and logistic regression across both datasets. For instance, in the Math dataset, the accuracy of logistic regression increased from 89.94% to 91.39% by using Lasso. Furthermore, our findings also emphasise the differences in model performance between the two validation methods, with k-fold cross-validation typically reaching higher accuracy on average for most models.

4.3. Deep Learning Models with Holdout Evaluation

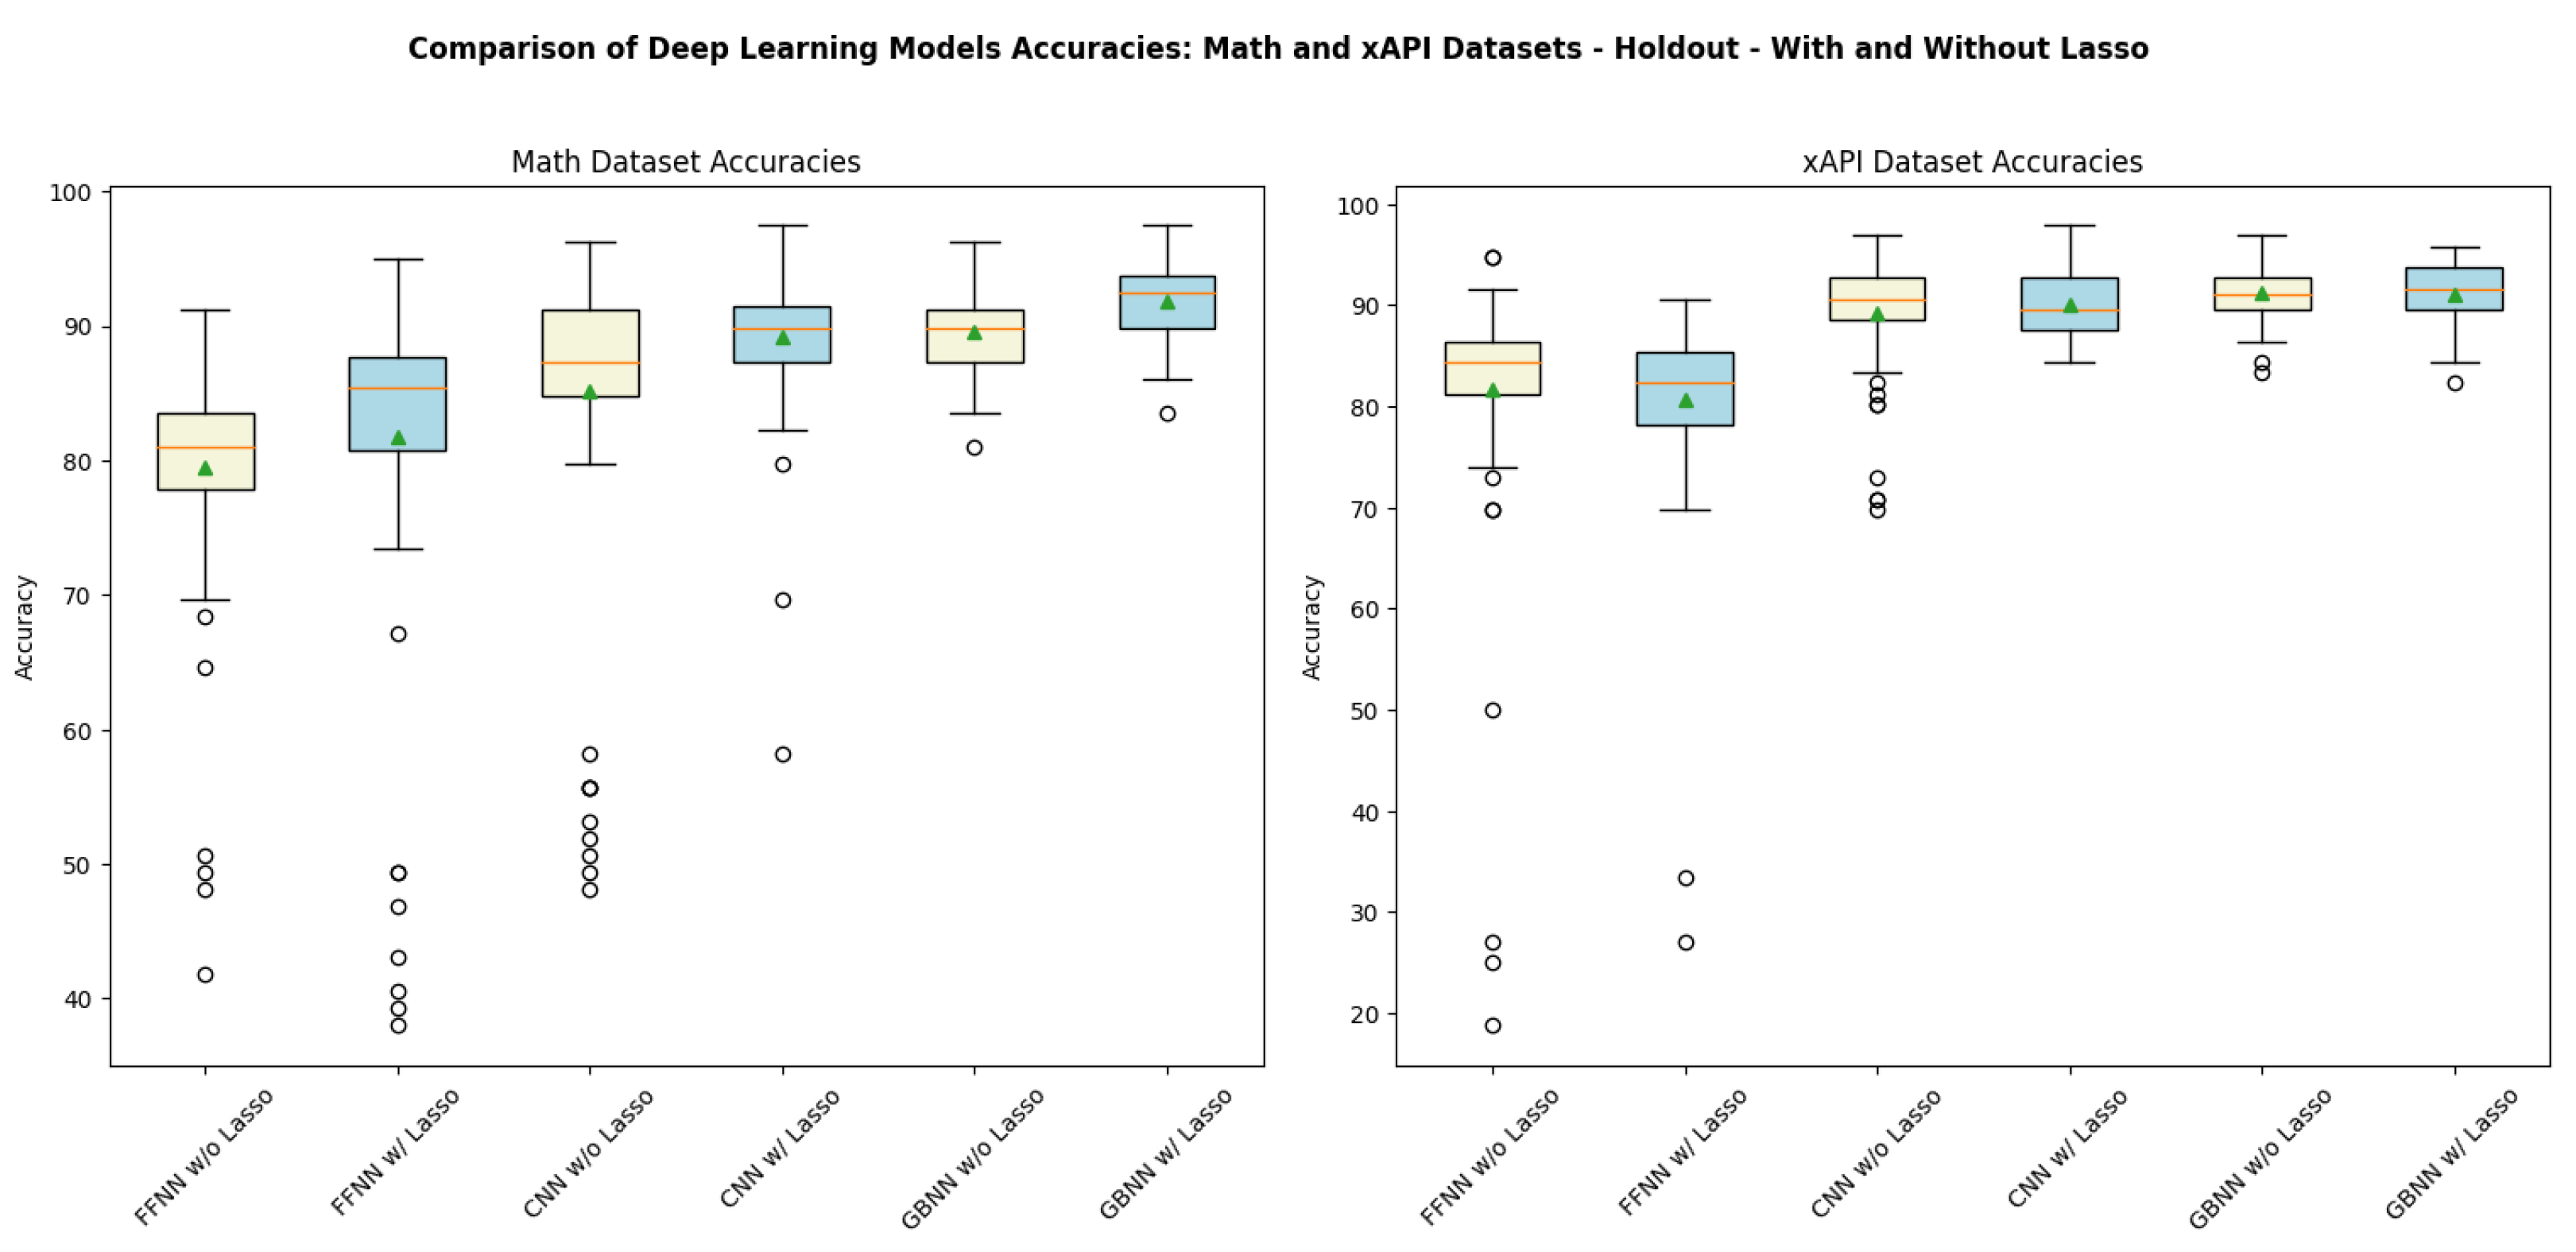
Using a holdout evaluation method, we examine the efficacy of various deep learning models in this section. Holdout evaluation entails separating the dataset into two subsets: one for training the model and the other for testing its performance. In this section, three deep learning models are examined: the feed-forward neural network (FFNN) [16], convolutional neural network (CNN) [17], and gradient-boosted neural network (GBNN) [18,19]. The procedure is repeated one hundred times for each deep learning model, enabling us to calculate the mean accuracy values for each model and comprehend their distribution for both datasets. Figure 6 displays boxplots that illustrate the performance of these deep learning models, with and without Lasso, across both datasets. Following holdout evaluation, Table 3 displays the mean accuracy scores for each deep learning model, with and without the use of Lasso regularisation, across both datasets.
This analysis enables us to evaluate the efficacy of different deep learning models, from fundamental feed-forward neural networks to convolutional neural networks and cutting-edge gradient-boosted neural networks. By utilising holdout evaluation and evaluating these neural networks, we gain a deeper comprehension of their performance and can make informed decisions regarding their suitability for particular deep-learning tasks. Therefore, for deep learning models using holdout validation, GBNN consistently stands out as the best performer, achieving remarkable mean accuracy rates for both datasets, both with and without Lasso regularisation. Following GBNN, CNN and then FFNN demonstrate better accuracy results. Lasso regularisation also demonstrates positive effects in certain instances. For example, CNN’s performance improves with Lasso in both datasets. Another example, for the Math dataset, GBNN’s accuracy increased from 89.52% to 91.87% with Lasso. Thus, it seems that GBNN is a reliable choice for enhancing the prediction of student outcomes using deep learning models across both datasets. From the ANOVA test, we found that the predictive performance of the methods differs for deep learning models using holdout for both the Math dataset (F-statistic of 38.49 and p-value < 1 × 10 12 ) and xAPI dataset (F-statistic of 53.03 and p-value < 1 × 10 12 ).

4.4. Deep Learning Models with k-Fold Cross-Validation

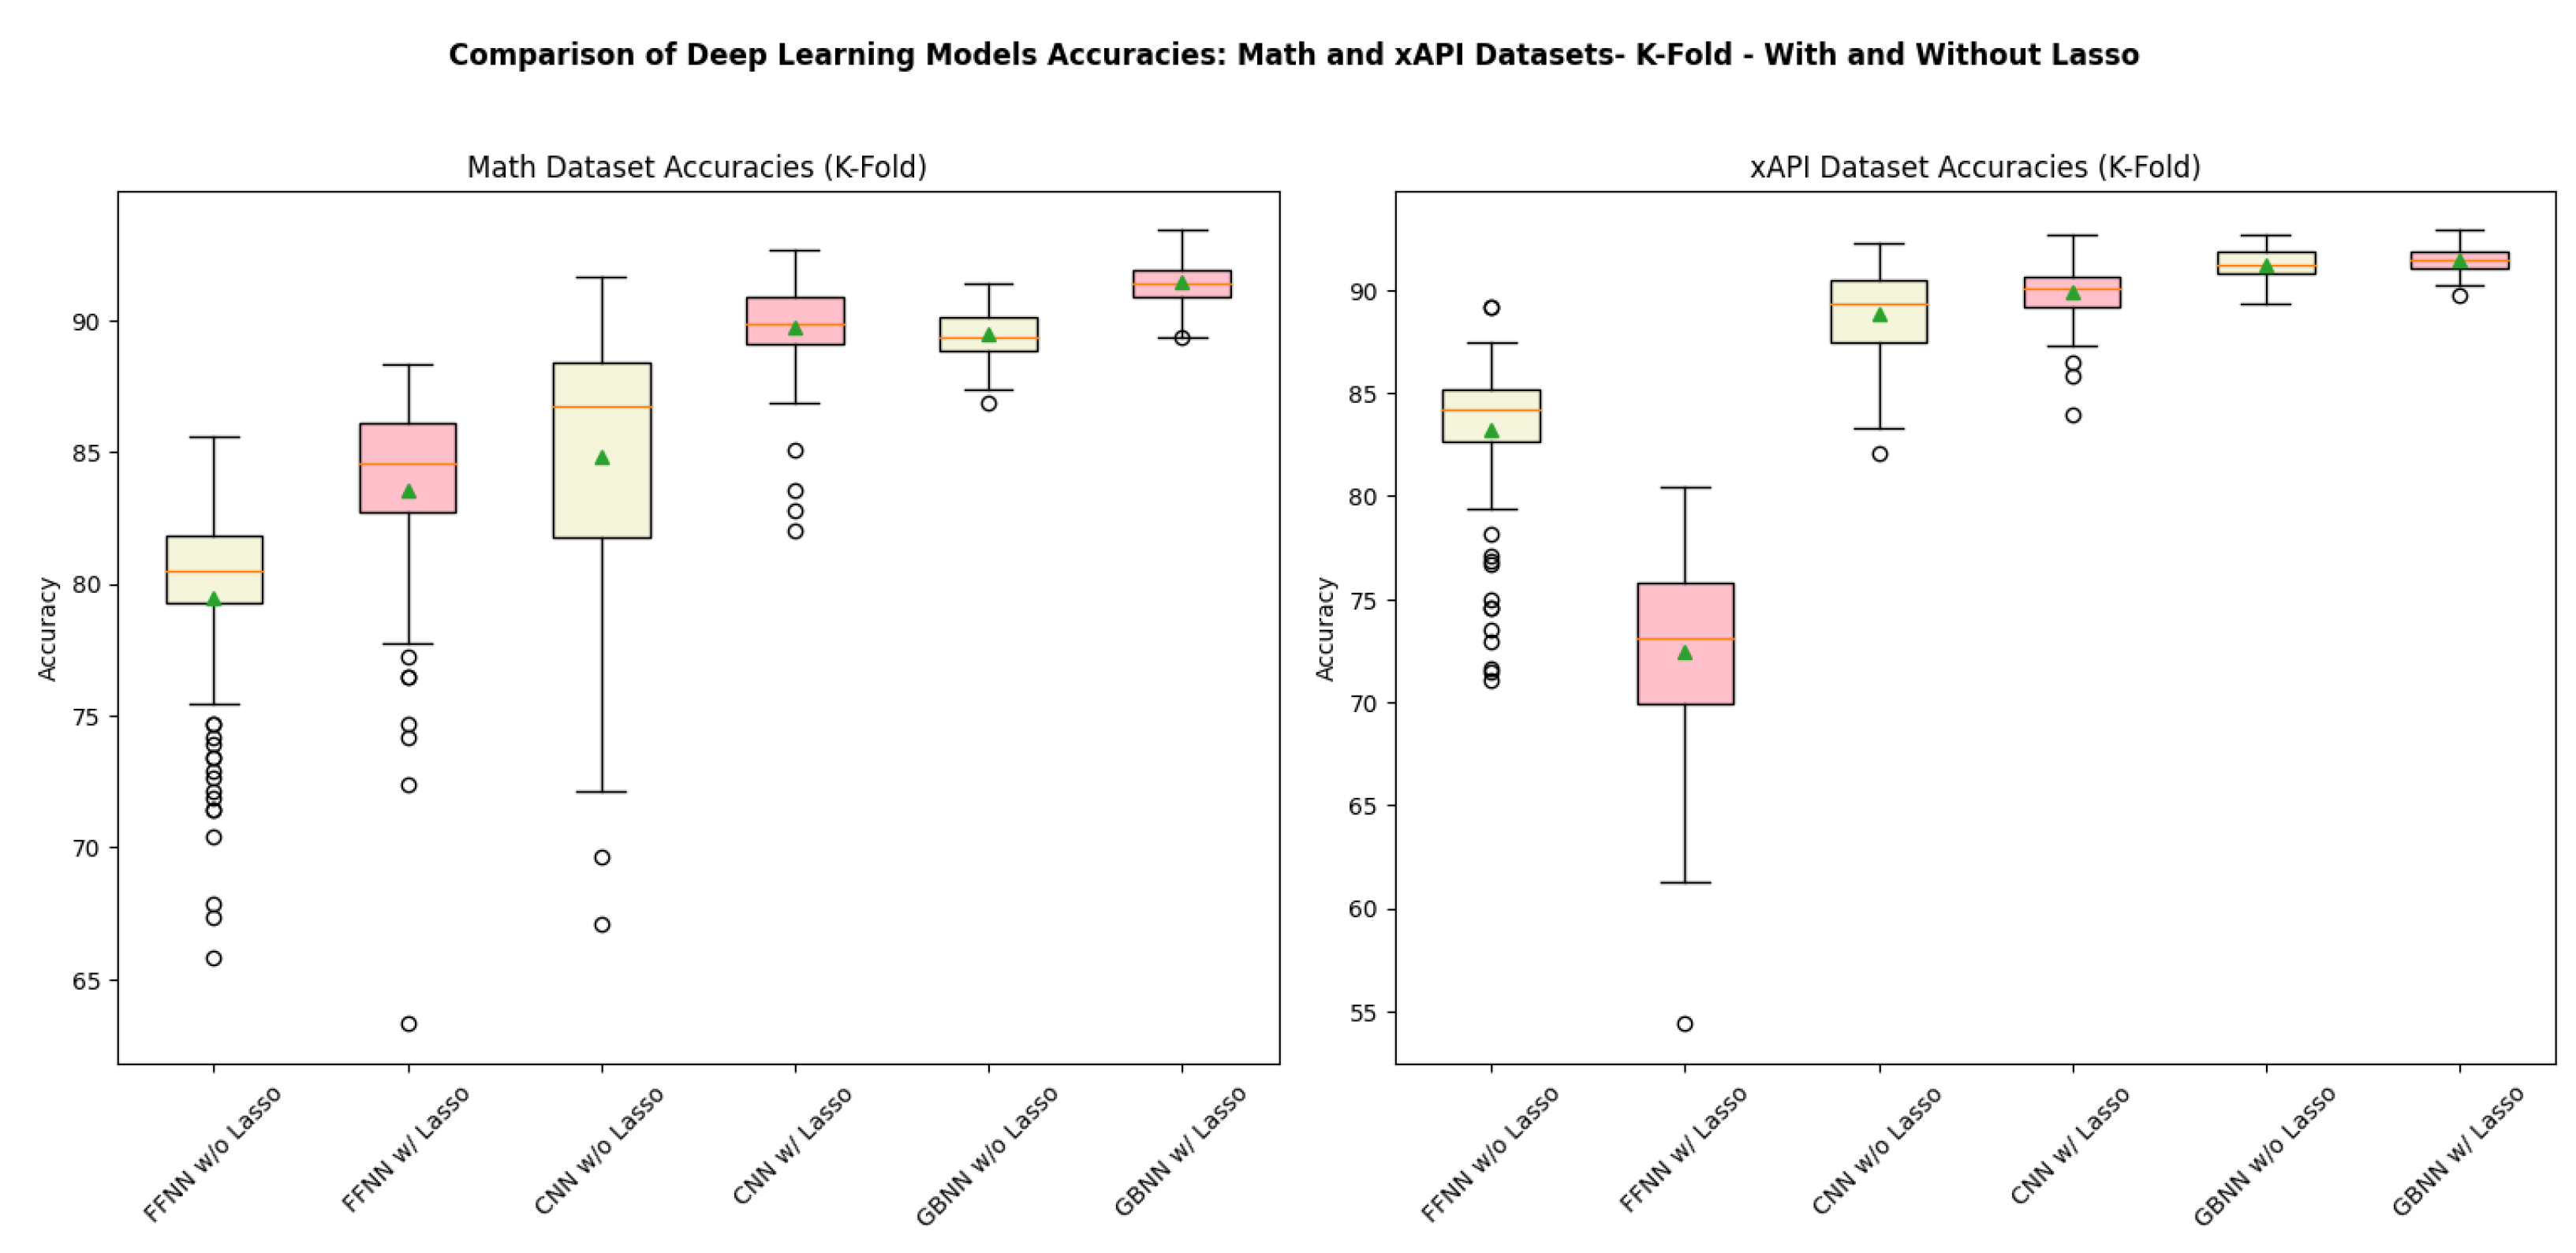
In this part, we present the outcomes of k-fold cross-validation applied to the deep learning models. In k-fold cross-validation, the dataset is split into K folds of equal size, with each fold functioning as a testing and validation set while training the model on the remaining K 1 folds. Following [25], this procedure is repeated multiple times, enabling a thorough evaluation of the performance of models across various subsets of data. We carried out 100 iterations of k-fold cross-validation with K set to 5. We employed Lasso feature selection for each iteration to enhance the model’s performance by identifying and selecting the most appropriate features. This process of feature selection was intended to reduce dimensionality and improve predictive accuracy. The deep learning models consist of an FFNN architecture with two hidden layers, CNN models with a convolutional layer, and the implementation of gradient-boosted neural networks with the “gbnn” Python package [19]. The boxplots in Figure 7 illustrate the distribution of model accuracy values, comparing both holdout and K-fold cross-validation evaluation methods for both datasets. Table 4 displays the mean accuracy values determined by k-fold cross-validation for each deep learning model configuration with and without Lasso feature selection, across both datasets. In the context of k-fold cross-validation for deep learning models, GBNN continues to demonstrate outstanding performance, much like in the holdout validation results. It is followed in effectiveness by CNN and then FFNN. The application of Lasso has again shown beneficial effects, particularly for CNN and GBNN across both Math and xAPI datasets. Additionally, there is some improvements were observed in some other cases, such as the increase in accuracy for FFNN from 79.48% to 83.56% due to Lasso. Moreover, the variation in performance of CNN is reduced by Lasso, indicating that CNN with Lasso is more stable than without. The ANOVA test shows significant variations in the predictive performances of deep learning models, which were analysed using k-fold cross-validation across both datasets. For the Math dataset—the F-statistic = 209.71 and a p-value < 1 × 10 12 , and for xAPI dataset—the F-statistic = 768.70 and a p-value < 1 × 10 12 .

5. Discussion

Our examination of the comparative effectiveness of deep learning and machine learning models in predicting student outcomes has provided significant insights based on our core research questions.
Response to research question 1: A comparison of deep learning and machine learning models. The results of our experiments indicate that both machine and deep learning methods have significant potential for predicting student outcomes through their accuracy. Random forest, XGBoost, and logistic regression were the most effective machine learning models, indicating their potential as the primary choices for modelling in educational environments. This aligns with the findings by Couronné et al. [64], who determined that random forest shows robust performance across various parameter settings, providing classification tasks with high accuracy and simplicity of use, frequently surpassing logistic regression. Conversely, the gradient-boosted neural network (GBNN) exhibits optimistic results among deep learning models, underscoring the advanced capabilities of deep learning in managing intricate educational data.
Response to research question 2: The impact of lasso feature selection. The effect of the Lasso feature selection was inconsistent across the models. It significantly enhanced the accuracy of models such as logistic regression, linear regression, and kNN under specific circumstances. Nevertheless, its efficacy was contingent upon the model’s performance requirements and the dataset’s characteristics. For example, Lasso consistently improved the performance and stability of the CNN in both datasets, demonstrating the technique’s potential to refine model efficacy. The role of Lasso in machine learning and its importance in feature selection is also discussed in the study by Muthukrishnan et al. [65].
Response to research question 3: The influence of hyperparameter tuning techniques. Our utilisation of cross-validation for Lasso regularisation and Bayesian optimisation for hyperparameter tuning in deep learning models has been crucial in optimising our model configurations. This strategic tuning has substantially contributed to the adaptability of AI-based prediction models in education, improving their precision and general applicability. General insights and prospective research. In general, our examination, which employs benchmark datasets representing a wide range of student levels, subjects, and countries, offers a comprehensive understanding of the adaptability of various predictive models. Although our results verify the generalizability of these models, we recognise the necessity of additional research. In the future, we will investigate the potential of generative AI within the educational sector and evaluate the precision of alternative deep learning models.

6. Conclusions

Summary: Our study evaluated and compared seven machine learning models and three deep learning architectures using two real-world public student datasets. We implemented these models in Python and applied dual evaluation strategies: k-fold cross-validation and holdout methods. Our findings highlight that random forest, XGBoost, and logistic regression, among machine learning models, and GBNN, among deep learning models, provided the highest accuracy levels. Furthermore, we investigated the influence of hyperparameter tuning, which substantially enhanced the models’ accuracy and performance, thereby underscoring the importance of optimal parameter settings in achieving better predictive outcomes.
Implications: The results from our study provide valuable insights for educators, researchers, and policymakers, suggesting that leveraging these specific models can enhance personalised educational approaches. The successful application of Lasso feature selection has been shown to refine the accuracy of models like logistic regression and CNN, confirming its utility in various educational settings. The results of our experiments illustrated the efficacy of these models. Furthermore, we have provided access to our source code [32] to facilitate the replication of our findings.
Limitations: While our study provides valuable contributions, it is constrained by its focus on particular datasets and models. The generalizability of our results to other types of data or additional models that were not included in our study is yet to be evaluated.
Future Work: Our research agenda for the future will involve investigating the potential of generative AI in educational contexts and exploring additional predictive models. Our goal is to broaden the scope of our analyses to encompass a more comprehensive range of datasets and model configurations to gain a more comprehensive understanding of the dynamics of AI in education.

Author Contributions

Conceptualisation, H.F.; methodology, H.F.; software, H.F. and I.J.; validation, H.F., I.J., and S.M.; formal analysis, H.F., S.M., and A.B.; writing—original draft preparation, H.F.; writing—review and editing, S.M. and A.B.; visualisation, H.F. and I.J.; supervision, S.M. and A.B. All authors have read and agreed to the published version of the manuscript.

Funding

This research received no external funding.

Institutional Review Board Statement

Not applicable.

Informed Consent Statement

Not applicable.

Data Availability Statement

We have provided access to our source code available at: https://github.com/aideveloper63/Comparative-Study-DL-ML, under GNU Lesser General Public License v2.1. The license details are provided within the repository (accessed on 1 July 2024).

Conflicts of Interest

The authors declare no conflicts of interest.

References

  1. Kaswan, K.S.; Dhatterwal, J.S.; Ojha, R.P. AI in personalized learning. In Advances in Technological Innovations in Higher Education; CRC Press: Boca Raton, FL, USA, 2024; pp. 103–117. [Google Scholar]
  2. Shwartz-Ziv, R.; Armon, A. Tabular data: Deep learning is not all you need. Inf. Fusion 2022, 81, 84–90. [Google Scholar] [CrossRef]
  3. Pernaa, J.; Ikävalko, T.; Takala, A.; Vuorio, E.; Pesonen, R.; Haatainen, O. Artificial Intelligence Chatbots in Chemical Information Seeking: Narrative Educational Insights via a SWOT Analysis. Informatics 2024, 11, 20. [Google Scholar] [CrossRef]
  4. Xie, H.; Chu, H.C.; Hwang, G.J.; Wang, C.C. Trends and development in technology-enhanced adaptive/personalized learning: A systematic review of journal publications from 2007 to 2017. Comput. Educ. 2019, 140, 103599. [Google Scholar] [CrossRef]
  5. Fahad Mon, B.; Wasfi, A.; Hayajneh, M.; Slim, A.; Abu Ali, N. Reinforcement Learning in Education: A Literature Review. Informatics 2023, 10, 74. [Google Scholar] [CrossRef]
  6. Ouyang, F.; Wu, M.; Zheng, L.; Zhang, L.; Jiao, P. Integration of artificial intelligence performance prediction and learning analytics to improve student learning in online engineering course. Int. J. Educ. Technol. High. Educ. 2023, 20, 1–23. [Google Scholar] [CrossRef] [PubMed]
  7. Casey, K.; Azcona, D. Utilizing student activity patterns to predict performance. Int. J. Educ. Technol. High. Educ. 2017, 14, 1–15. [Google Scholar] [CrossRef]
  8. Pallathadka, H.; Wenda, A.; Ramirez-Asís, E.; Asís-López, M.; Flores-Albornoz, J.; Phasinam, K. Classification and prediction of student performance data using various machine learning algorithms. Mater. Today Proc. 2023, 80, 3782–3785. [Google Scholar] [CrossRef]
  9. KNN. Sklearn-Neighbors-KNeighborsClassifier-Python-Libraray. 2023. Available online: https://scikit-learn.org/stable/modules/generated/sklearn.neighbors.KNeighborsClassifier.html (accessed on 1 November 2023).
  10. SVM. Sklearn-Svm-SVC-Python-Libraray. 2023. Available online: https://scikit-learn.org/stable/modules/generated/sklearn.svm.SVC.html (accessed on 1 November 2023).
  11. Decision-Tree-Classifier. Scikit-Learn-Python-Libraray. 2023. Available online: https://scikit-learn.org/stable/modules/generated/sklearn.tree.DecisionTreeClassifier.html (accessed on 1 November 2023).
  12. LinearRegression. Sklearn-Linear-Model-LinearRegression-Python-Libraray. 2023. Available online: https://scikit-learn.org/stable/modules/generated/sklearn.linear_model.LinearRegression.html/ (accessed on 1 November 2023).
  13. Logestic-Regression. Sklearn-Linear-Model-LogisticRegression-Python-Libraray. 2023. Available online: https://scikit-learn.org/stable/modules/generated/sklearn.linear_model.LogisticRegression.html (accessed on 1 November 2023).
  14. RandomForest. Sklearn-Ensemble-RandomForestClassifier-Python-Libraray. 2023. Available online: https://scikit-learn.org/stable/modules/generated/sklearn.ensemble.RandomForestClassifier.html (accessed on 1 November 2023).
  15. Chen, T.; Guestrin, C. Xgboost: A scalable tree boosting system. In Proceedings of the 22nd Acm Sigkdd International Conference on Knowledge Discovery and Data Mining, San Francisco, CA, USA, 13–17 August 2016; pp. 785–794. [Google Scholar]
  16. TF.keras.Sequential. TensorFlow-v2.14.0-Python-Libraray. 2023. Available online: https://www.tensorflow.org/api_docs/python/tf/keras/Sequential (accessed on 1 November 2023).
  17. TF.keras.layers.Conv1D. TensorFlow-v2.14.0-Python-Libraray. 2023. Available online: https://www.tensorflow.org/api_docs/python/tf/keras/layers/Conv1D (accessed on 1 November 2023).
  18. Emami, S.; Martínez-Muñoz, G. Sequential Training of Neural Networks with Gradient Boosting. IEEE Access 2023, 11, 42738. [Google Scholar] [CrossRef]
  19. Emami, S.; Martýnez-Muñoz, G. Source-Code-GitHub-Sequential Training of Neural Networks with Gradient Boosting. 2022. Available online: https://github.com/GAA-UAM/GBNN (accessed on 1 November 2023).
  20. Brownlee, J. What is the Difference between a Batch and an Epoch in a Neural Network. Mach. Learn. Mastery 2018, 20, 1–5. [Google Scholar]
  21. Victoria, A.H.; Maragatham, G. Automatic tuning of hyperparameters using Bayesian optimization. Evol. Syst. 2021, 12, 217–223. [Google Scholar] [CrossRef]
  22. Mockus, J.; Mockus, J. The Bayesian Approach to Local Optimization; Springer: Dordrecht, The Netherlands, 1989. [Google Scholar]
  23. Roberts, S.; Nowak, G. Stabilizing the lasso against cross-validation variability. Comput. Stat. Data Anal. 2014, 70, 198–211. [Google Scholar] [CrossRef]
  24. Stone, M. Cross-validatory choice and assessment of statistical predictions. J. R. Stat. Soc. Ser. B 1974, 36, 111–133. [Google Scholar] [CrossRef]
  25. Yadav, S.; Shukla, S. Analysis of k-fold cross-validation over hold-out validation on colossal datasets for quality classification. In Proceedings of the 2016 IEEE 6th International Conference on Advanced Computing (IACC), Bhimavaram, India, 27–28 February 2016; pp. 78–83. [Google Scholar]
  26. Kaggle. Student Grade Prediction-Dataset-from-Paulo Cortez. 2018. Available online: https://www.kaggle.com/datasets/dipam7/student-grade-prediction/ (accessed on 1 November 2023).
  27. Cortez, P. Student Performance. UCI Machine Learning Repository. 2014. [Google Scholar] [CrossRef]
  28. Cortez, P.; Silva, A.M.G. Using data mining to predict secondary school student performance. In Proceedings of the 5th Annual Future Business Technology Conference, Porto, Portugal, 5–12 April 2008. [Google Scholar]
  29. Amrieh-Hamtini-Aljarah. Students’ Academic Performance Dataset (xAPI-Edu-Data). 2016. Available online: https://www.kaggle.com/datasets/aljarah/xAPI-Edu-Data?resource=download (accessed on 3 May 2024).
  30. Amrieh, E.A.; Hamtini, T.; Aljarah, I. Mining educational data to predict student’s academic performance using ensemble methods. Int. J. Database Theory Appl. 2016, 9, 119–136. [Google Scholar] [CrossRef]
  31. Amrieh, E.A.; Hamtini, T.; Aljarah, I. Preprocessing and analyzing educational data set using X-API for improving student’s performance. In Proceedings of the 2015 IEEE Jordan Conference on Applied Electrical Engineering and Computing Technologies (AEECT), Amman, Jordan, 3–5 November 2015; pp. 1–5. [Google Scholar]
  32. Code, C.S. Comparative-Study-Deep-Learning-Machine-Learning. 2023. Available online: https://github.com/aideveloper63/Comparative-Study-DL-ML (accessed on 1 July 2024).
  33. Riestra-González, M.; del Puerto Paule-Ruíz, M.; Ortin, F. Massive LMS log data analysis for the early prediction of course-agnostic student performance. Comput. Educ. 2021, 163, 104108. [Google Scholar] [CrossRef]
  34. Shabani, N.; Beheshti, A.; Farhood, H.; Bower, M.; Garrett, M.; Rokny, H.A. icreate: Mining creative thinking patterns from contextualized educational data. In Proceedings of the International Conference on Artificial Intelligence in Education, Durham, UK, 27–31 July 2022; pp. 352–356. [Google Scholar]
  35. Shabani, N.; Beheshti, A.; Farhood, H.; Bower, M.; Garrett, M.; Alinejad-Rokny, H. A Rule-Based Approach for Mining Creative Thinking Patterns from Big Educational Data. AppliedMath 2023, 3, 243–267. [Google Scholar] [CrossRef]
  36. Arroway, P.; Morgan, G.; O’Keefe, M.; Yanosky, R. Learning Analytics in Higher Education; Technical Report, Research Report; ECAR: Louisville, CO, USA, 2016. [Google Scholar]
  37. Gligorea, I.; Cioca, M.; Oancea, R.; Gorski, A.T.; Gorski, H.; Tudorache, P. Adaptive Learning Using Artificial Intelligence in e-Learning: A Literature Review. Educ. Sci. 2023, 13, 1216. [Google Scholar] [CrossRef]
  38. Hartley, K.; Hayak, M.; Ko, U.H. Artificial Intelligence Supporting Independent Student Learning: An Evaluative Case Study of ChatGPT and Learning to Code. Educ. Sci. 2024, 14, 120. [Google Scholar] [CrossRef]
  39. Di Mitri, D.; Schneider, J.; Drachsler, H. Keep me in the loop: Real-time feedback with multimodal data. Int. J. Artif. Intell. Educ. 2021, 32, 1–26. [Google Scholar] [CrossRef]
  40. Lutz, W.; Rubel, J.A.; Schwartz, B.; Schilling, V.; Deisenhofer, A.K. Towards integrating personalized feedback research into clinical practice: Development of the Trier Treatment Navigator (TTN). Behav. Res. Ther. 2019, 120, 103438. [Google Scholar] [CrossRef]
  41. Tabares-Soto, R.; Orozco-Arias, S.; Romero-Cano, V.; Bucheli, V.S.; Rodríguez-Sotelo, J.L.; Jiménez-Varón, C.F. A comparative study of machine learning and deep learning algorithms to classify cancer types based on microarray gene expression data. PeerJ Comput. Sci. 2020, 6, e270. [Google Scholar] [CrossRef]
  42. Swathy, M.; Saruladha, K. A comparative study of classification and prediction of Cardio-Vascular Diseases (CVD) using Machine Learning and Deep Learning techniques. ICT Express 2022, 8, 109–116. [Google Scholar] [CrossRef]
  43. Theofilatos, A.; Chen, C.; Antoniou, C. Comparing machine learning and deep learning methods for real-time crash prediction. Transp. Res. Rec. 2019, 2673, 169–178. [Google Scholar] [CrossRef]
  44. Singh, M.; Verma, C.; Kumar, R.; Juneja, P. Towards enthusiasm prediction of Portuguese school’s students towards higher education in realtime. In Proceedings of the 2020 International Conference on Computation, Automation and Knowledge Management (ICCAKM), Dubai, United Arab Emirates, 9–10 January 2020; pp. 421–425. [Google Scholar]
  45. Hamoud, A. Selection of best decision tree algorithm for prediction and classification of students’ action. Am. Int. J. Res. Sci. Technol. Eng. Math. 2016, 16, 26–32. [Google Scholar]
  46. Ünal, F. Data mining for student performance prediction in education. Data-Min.-Methods Appl. Syst. 2020, 28, 423–432. [Google Scholar]
  47. Liu, C.; Wang, H.; Du, Y.; Yuan, Z. A predictive model for student achievement using spiking neural networks based on educational data. Appl. Sci. 2022, 12, 3841. [Google Scholar] [CrossRef]
  48. Ünal, F.; Birant, D. Educational data mining using semi-supervised ordinal classification. In Proceedings of the 2021 3rd International Congress on Human-Computer Interaction, Optimization and Robotic Applications (HORA), Ankara, Turkey, 11–13 June 2021; pp. 1–5. [Google Scholar]
  49. Cerda, P.; Varoquaux, G.; Kégl, B. Similarity encoding for learning with dirty categorical variables. Mach. Learn. 2018, 107, 1477–1494. [Google Scholar] [CrossRef]
  50. Rodríguez, P.; Bautista, M.A.; Gonzalez, J.; Escalera, S. Beyond one-hot encoding: Lower dimensional target embedding. Image Vis. Comput. 2018, 75, 21–31. [Google Scholar] [CrossRef]
  51. Okada, S.; Ohzeki, M.; Taguchi, S. Efficient partition of integer optimization problems with one-hot encoding. Sci. Rep. 2019, 9, 13036. [Google Scholar] [CrossRef] [PubMed]
  52. scikit learn. Libraray-Machine-Learning-in-Python. 2023. Available online: https://scikit-learn.org/stable/ (accessed on 1 November 2023).
  53. Dmlc Xgboost. Xgboost-for-a-Binary-Classification-Task. 2022. Available online: https://xgboost.readthedocs.io/en/stable/get_started.html (accessed on 1 November 2023).
  54. Mateo, J.; Rius-Peris, J.; Maraña-Pérez, A.; Valiente-Armero, A.; Torres, A. Extreme gradient boosting machine learning method for predicting medical treatment in patients with acute bronchiolitis. Biocybern. Biomed. Eng. 2021, 41, 792–801. [Google Scholar] [CrossRef]
  55. Dhieb, N.; Ghazzai, H.; Besbes, H.; Massoud, Y. Extreme gradient boosting machine learning algorithm for safe auto insurance operations. In Proceedings of the 2019 IEEE International Conference on Vehicular Electronics and Safety (ICVES), Cairo, Egypt, 4–6 September 2019; pp. 1–5. [Google Scholar]
  56. Warsito, B.; Santoso, R.; Suparti; Yasin, H. Cascade forward neural network for time series prediction. J. Phys. Conf. Ser. 2018, 1025, 012097. [Google Scholar] [CrossRef]
  57. Singh, N.; Singh, A.; Tripathy, M. Selection of hidden layer neurons and best training method for ffnn in application of long term load forecasting. J. Electr. Eng. 2012, 63, 153–161. [Google Scholar] [CrossRef]
  58. Hosseini, H.G.; Luo, D.; Reynolds, K.J. The comparison of different feed forward neural network architectures for ECG signal diagnosis. Med. Eng. Phys. 2006, 28, 372–378. [Google Scholar] [CrossRef]
  59. Martinez, J.; Carroll, R.; Muller, S.; Sampson, J.; Chatterjee, N. Empirical performance of crossvalidation with oracle methods in a genomics context. Am. Stat. 2011, 64, 223–228. [Google Scholar] [CrossRef] [PubMed]
  60. Tibshirani, R. Regression shrinkage and selection via the lasso. J. R. Stat. Soc. Ser. B Stat. Methodol. 1996, 58, 267–288. [Google Scholar] [CrossRef]
  61. Otchere, D.A.; Ganat, T.O.A.; Ojero, J.O.; Tackie-Otoo, B.N.; Taki, M.Y. Application of gradient boosting regression model for the evaluation of feature selection techniques in improving reservoir characterisation predictions. J. Pet. Sci. Eng. 2022, 208, 109244. [Google Scholar] [CrossRef]
  62. Chetverikov, D.; Liao, Z.; Chernozhukov, V. On cross-validated lasso in high dimensions. Ann. Stat. 2021, 49, 1300–1317. [Google Scholar] [CrossRef]
  63. Buragohain, D.; Punpeng, G.; Jaratjarungkiat, S.; Chaudhary, S. Impact of e-learning activities on English as a second language proficiency among engineering cohorts of Malaysian higher education: A 7-month longitudinal study. Informatics 2023, 10, 31. [Google Scholar] [CrossRef]
  64. Couronné, R.; Probst, P.; Boulesteix, A.L. Random forest versus logistic regression: A large-scale benchmark experiment. BMC Bioinform. 2018, 19, 270. [Google Scholar] [CrossRef]
  65. Muthukrishnan, R.; Rohini, R. LASSO: A feature selection technique in predictive modeling for machine learning. In Proceedings of the 2016 IEEE International Conference on Advances in Computer Applications (ICACA), Coimbatore, India, 24 October 2016; pp. 18–20. [Google Scholar]
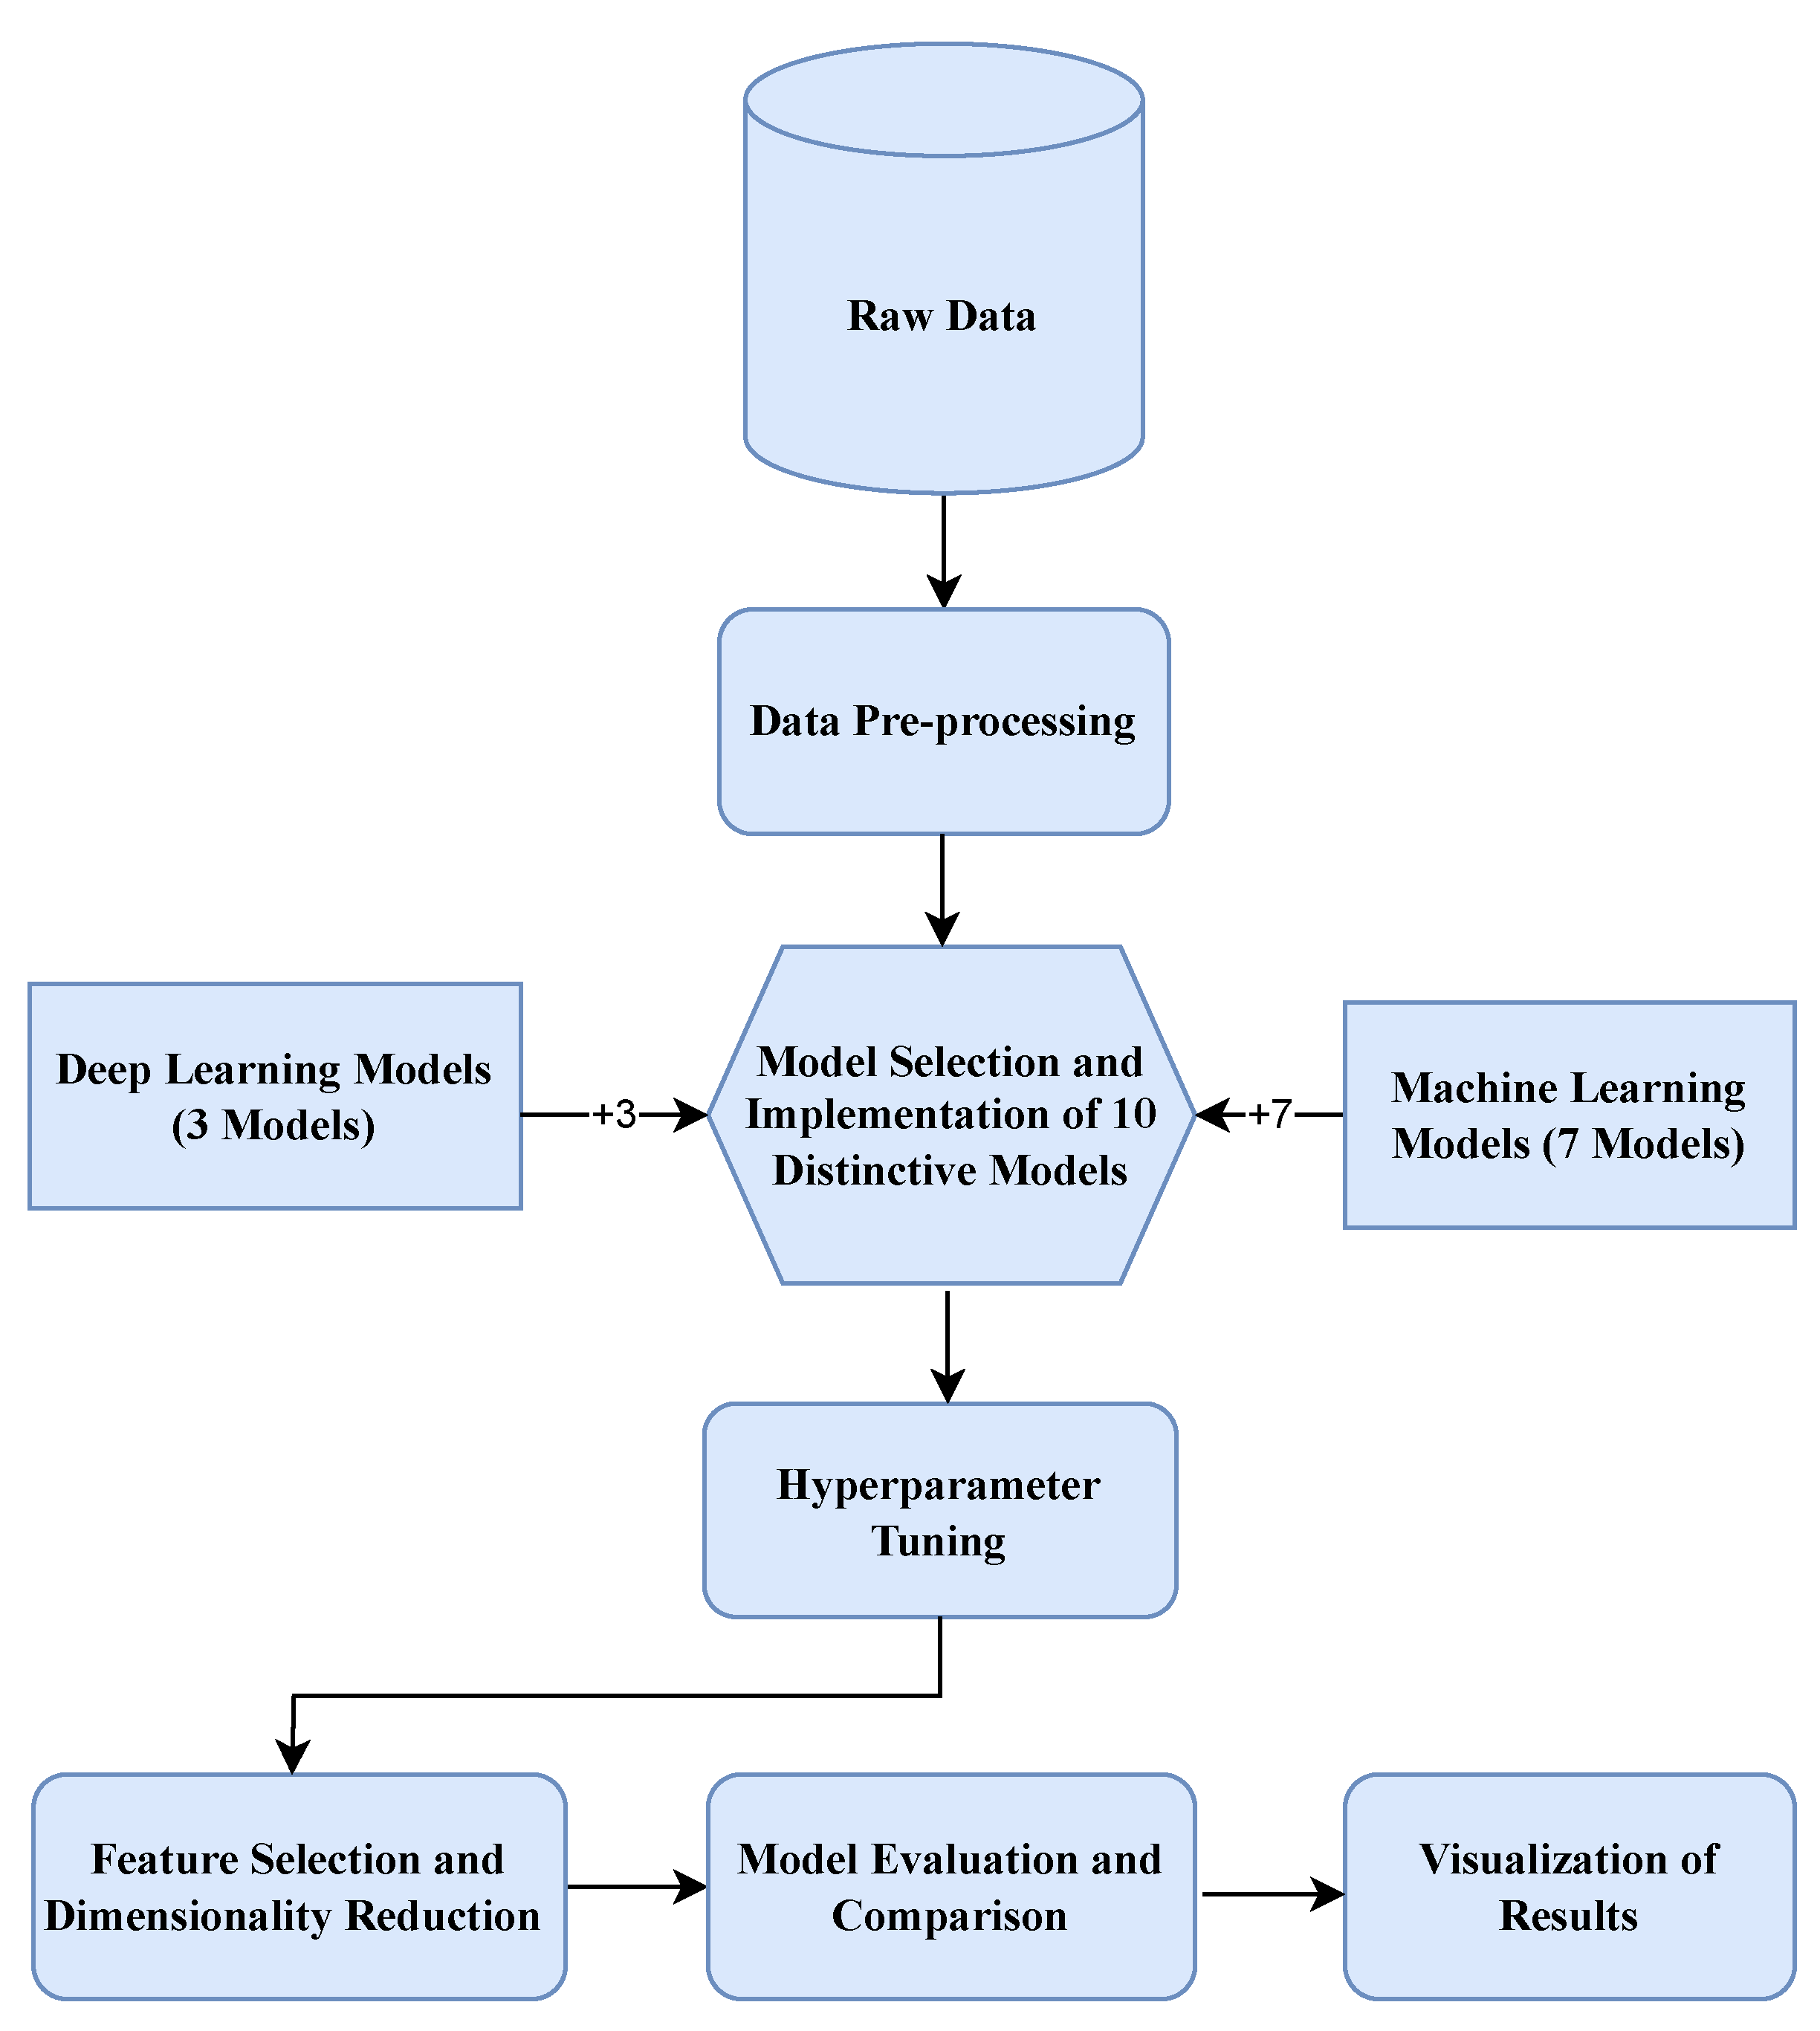
Figure 1. The workflow outlining the key stages of our research framework.
Informatics 11 00046 g001
Figure 2. Distribution of model accuracies with and without Lasso regularisation (holdout evaluation) for machine learning models—the Math dataset, where the green triangles represent mean values, and the circles denote outliers.
Informatics 11 00046 g002
Figure 3. Presentation of model accuracy distributions (holdout evaluation) for machine learning models with and without the Lasso regularisation–xAPI dataset. The green triangles represent mean values, and the circles indicate outliers.
Informatics 11 00046 g003
Figure 4. Distribution of model accuracy for machine learning models with and without Lasso regularisation in k-fold cross-validation for the Math dataset. The green triangles illustrate mean values, and the circles reveal outliers.
Informatics 11 00046 g004
Figure 5. Distribution of model accuracy for machine learning models in k-fold cross-validation with and without Lasso regularisation for the xAPI dataset. The green triangles represent mean values, and the circles denote outliers.
Informatics 11 00046 g005
Figure 6. Boxplot illustrating the comparison of accuracy across neural network models (FFNN, CNN, GBNN) with and without Lasso, evaluated by the holdout validation method for both the Math and xAPI datasets. The green triangles represent mean values, and the circles denote outliers.
Informatics 11 00046 g006
Figure 7. Boxplot displaying accuracy assessment in neural network models (FFNN, CNN, GBNN) with and without Lasso through k-fold cross-validation for both the Math and xAPI datasets. The green triangles represent mean values, and the circles denote outliers.
Informatics 11 00046 g007
Table 1. Mean accuracy values with and without Lasso for machine learning models (holdout validation) across the Math and xAPI datasets.
Machine Learning ModelWithout Lasso (Math)With Lasso (Math)Without Lasso (xAPI)With Lasso (xAPI)
Decision Tree89.62%89.65%88.69%88.07%
kNN73.05%82.41%86.10%90.23%
Linear Regression87.80%89.46%90.47%91.07%
Logistic Regression89.94%91.54%91.15%91.34%
Random Forest93.58% 92.87%92.69%91.46%
SVM87.30%89.85%91.53%91.00%
XGBoost93.49%92.10%91.37%90.54%
Table 2. Mean accuracy values with and without Lasso for machine learning models (k-fold cross-validation) across the Math and xAPI datasets.
Machine Learning ModelMath DatasetxAPI Dataset
Without Lasso With Lasso Without Lasso With Lasso
Decision Tree89.94%89.49%88.36%87.96%
kNN73.44%83.48%85.77%91.01%
Linear Regression87.75%89.27%90.73%91.28%
Logistic Regression89.94%91.39%91.26%91.51%
Random Forest93.82% 92.94%92.70%91.22%
SVM87.59%89.98%91.49%91.12%
XGBoost93.53%91.94%91.51%90.03%
Table 3. Mean accuracy values with and without Lasso for deep learning models (Holdout) across both datasets.
Deep Learning ModelMath DatasetxAPI Dataset
Without Lasso With Lasso Without Lasso With Lasso
CNN85.15%89.13%89.28%90.09%
FFNN79.49%81.76%81.67%80.72%
GBNN89.52% 91.87%91.18%91.08%
Table 4. Mean accuracy scores for deep learning models with and without Lasso (k-fold cross-validation) across the Math and xAPI datasets.
Deep Learning ModelMath DatasetxAPI Dataset
Without Lasso With Lasso Without Lasso With Lasso
CNN84.84%89.71%88.88%89.90%
FFNN79.48%83.56%83.23%72.46%
GBNN89.51% 91.43%91.21%91.44%
Disclaimer/Publisher’s Note: The statements, opinions and data contained in all publications are solely those of the individual author(s) and contributor(s) and not of MDPI and/or the editor(s). MDPI and/or the editor(s) disclaim responsibility for any injury to people or property resulting from any ideas, methods, instructions or products referred to in the content.