Article

Every Thing Can Be a Hero! Narrative Visualization of Person, Object, and Other Biographies

1
Group for Visual Data Science, Department of Mathematics and Computer Science, Faculty of Science, University of Southern Denmark, 5230 Odense, Denmark
2
Center for Cultures and Technologies of Collecting, Department for Arts and Cultural Studies, Faculty of Education, Arts and Architecture, University for Continuing Education, 3500 Krems, Austria
3
Fluxguide, 1070 Wien, Austria
4
Visualization Research Center, Department of Computer Science, Faculty of Computer Science, Electrical Engineering and Information, University of Stuttgart, 70569 Stuttgart, Germany
*
Authors to whom correspondence should be addressed.
Informatics 2024, 11(2), 26; https://doi.org/10.3390/informatics11020026
Submission received: 5 March 2024 / Revised: 7 April 2024 / Accepted: 16 April 2024 / Published: 26 April 2024
(This article belongs to the Special Issue Digital Humanities and Visualization)

Abstract

:
Knowledge communication in cultural heritage and digital humanities currently faces two challenges, which this paper addresses: On the one hand, data-driven storytelling in these fields has mainly focused on human protagonists, while other essential entities (such as artworks and artifacts, institutions, or places) have been neglected. On the other hand, storytelling tools rarely support the larger chains of data practices, which are required to generate and shape the data and visualizations needed for such stories. This paper introduces the InTaVia platform, which has been developed to bridge these gaps. It supports the practices of data retrieval, creation, curation, analysis, and communication with coherent visualization support for multiple types of entities. We illustrate the added value of this open platform for storytelling with four case studies, focusing on (a) the life of Albrecht Dürer (person biography), (b) the Saliera salt cellar by Benvenuto Cellini (object biography), (c) the artist community of Lake Tuusula (group biography), and (d) the history of the Hofburg building complex in Vienna (place biography). Numerous suggestions for future research arise from this undertaking.

1. Introduction

It seems safe to say that biographical research and related communication endeavors have weathered long seasons of critical questioning fairly well. As the smallest possible “micro-analytical” lens of historiography and the humanities, the study of individual biographies comes with the risk of producing rather anecdotal, subjective, and hagiographic (i.e., overly reverential and uncritical) portraits of influential historical elite actors only, while neglecting historical context and the analysis of larger societal (e.g., political, technological, or economic) trends [1,2,3,4]. However, given the wide range of established macro-analytical perspectives in the field of history, biographies keep playing an indispensable role for illustrating their bigger pictures and analyses of broader trends, providing rich and detailed information for historical actors, and, thus, for “humanizing” history and making its abstract concepts accessible and tangible for a wide range of audiences [5,6]. In fact, many observers even diagnose a renaissance of the biographical genre, invoking the notion of a “biographical turn” [2,7]. Among other factors, this development has been driven by the successful (a) generalization of the biography concept, but also (b) by the rise of digital humanities methods and tools, promoting new ways of biographical investigation and representation.
(a) From person to object biographies: Transcending the traditional focus on human actors, the genre of “object biographies” has managed to shift the historical focus from human protagonists to the study of cultural artifacts or things in general, which also fosters the study of human–object interrelations [8,9]. Gosden and Marshall spell out the consequence of such a hybrid (i.e., person-and-object-oriented) approach for the narratological standard lens of anthropocentric “hero journeys” [10]: “At the heart of the notion of biography are questions about the links between people and things; about the ways meanings and values are accumulated and transformed” [8] (p. 172). A first aim of this paper, thus, is the discussion of the consequences for present-day storytelling: How can we facilitate post-anthropocentric storytelling, where all kinds of entities can become the “hero” of a cultural narrative? Related methods will arguably help to not only open up the protagonist position for non-human entities with relevance in the digital history and cultural heritage fields (such as artworks, institutions, or places) [11,12], but also for all sorts of “posthumanist” assemblies in ecology, science, technology, and society contexts [13,14,15,16,17,18,19].
(b) Digital biography methods, tools, and workflows: In addition to conceptual shifts, digital augmentations of humanities research methods have opened up new options and avenues for biographical research and knowledge communication [20,21,22,23]. Digital language and image-processing methods started to work their way into biographical and cultural knowledge collections to extract large amounts of structured data and to semantically annotate depicted or described entities. Linked data initiatives then started to classify and combine related entities to build up bigger knowledge graphs of multiple types of cultural resources. These graphs often connect large numbers of nodes of different entity types, media, and data schemata by multiple kinds of semantic relations and, thus, provide a rich source for the visual analysis and (narrative) communication of biographies and cultural heritage topics in general [24,25,26]. It has been argued that this digital layer could even be analyzed as a historical mirror and continuation of the history of things, creating novel “object biographies” in the digital age [27,28].
Research questions: With this paper, we document a recent effort to build on the outlined developments in biographical research, as well as the digital humanities (DH) and cultural heritage (CH) fields—and to close existing gaps for related data, visualization, and storytelling tools (see Figure 1). A number of questions and objectives guided this work within the H2020-project InTaVia (https://www.intavia.eu (accessed on 15 April 2024)):
(a)
How can we assemble a transnational knowledge graph, which draws together existing biography and object data resources?
(b)
How can we facilitate knowledge communication with data-driven, biographical storytelling? How can we avoid overly human-centered narratives to support storytelling with all sorts of entities relevant in the fields of DH and CH?
(c)
How can various visualization methods support storytelling in an integrated fashion?
(d)
How can further media content enrich these stories?
(e)
How can we support whole workflows of data practices needed for visualization-based storytelling, including data search, creation, curation, and (visual) analysis?
In the following, we reflect on related work on visualizing biographies and telling related stories (Section 2) before we introduce the InTaVia project and the integrated InTaVia knowledge graph. We developed a platform that supports whole workflows with biographical data, including visualization-based storytelling (Section 3). Four case studies illustrate the practical and theoretical potential of such approaches to biographical storytelling (Section 4), while a more general discussion sketches out future challenges for research and professional practice related to DH and CH (Section 5).

2. Related Work

In the CH and DH fields, data visualizations are known for their potential to support the study of both large and small text collections, thus facilitating activities of “close” and “distant reading” [29] or “viewing” [30]. In this section, we summarize related efforts with a specific focus on biography data—both for person and object biographies. While doing so, we will look more closely into methods of narrative visualization design [31]—as biographical writing naturally translates into narratively structured source data—and proceed from visualizations of person biographies and object biographies to aggregated visual storytelling approaches in these fields.

2.1. Person Biography Visualization

As for research into persons’ lives (Figure 2, top left), various visualization approaches have been utilized to enable the visual investigation and representation of biographical data. Concerning specific cross-sectional visualization techniques, we frequently encounter maps [32,33] and graphs (i.e., network visualizations), which lend themselves to the visual representation of networks between persons, things, and any other entity relevant for person biographies (such as institutions, places, sets of things) [34,35,36,37,38,39,40]. But, also, any other visualization type can help to analyze specific (e.g., set-type or statistical) characteristics of biographical data, depending on the analytical focus tasks [41,42,43,44]. These standard views also can be combined as dashboards or multiple coordinated views to represent various facets of biographical data in parallel [45,46,47].
The essential temporal orientation of biography data (see Figure 2, temporal components highlighted in blue) frequently promotes and requires the visual encoding of time—which in its purest form is achieved by biographical time visualizations [44,48,49,50,51] in either an individual, faceted, or aggregated fashion [52]. Time visualizations can be easily combined with cross-sectional standard views (e.g., maps with coordinated timelines) for their spatio-temporal enhancement [53,54,55,56], or it is a range of other encodings, which encode the time-oriented aspects like sequences of events in person biographies. Among them are color scales (mapping time to color) [57,58], animation (mapping time to movement) [59], space–time views (mapping time to a third dimension) [60,61], annotation of dates (mapping time to numerical symbols) [62], or combinations thereof [63,64] to balance the distinct strengths and limitations of specific temporal encodings.

2.2. How Time Orientation Translates into Narrative Designs

Closely related to the visualization of time are narrative designs (Figure 2, right), which are of specific interest to tell the stories of individual lives in a temporally faceted fashion. They can be implemented using a whole toolbox of narrative means, moving visualizations of biography data into the field of “visualization-based storytelling” [65]. Storytelling with data and visualizations is getting more and more popular, and related surveys analyze the manifold approaches for “data-driven storytelling” in specific fields such as data journalism [31,66,67], data videos [68,69], scientific publications [70], and DH [65]. Related surveys on visualization-based storytelling analyze further characteristics such as linearity, user freedom, representation, scale, and layout [31,52,70,71], but also emphasize story tropes, genres, and the interactive implementation methods to define the progression through the story thread (e.g., data comic, slideshow, scrollytelling; see Figure 2, right) [65,72].
To convey biographies as visual and interactive stories (e.g., utilizing visualizations in lieu of rich multimedia content and connecting them with a story thread), visualization-based storytelling tools focus on maps [53,73], timelines [74,75], graphs [76,77,78], or other types of chart visualizations [79,80,81]. These tool sets are then used to tell stories of famous biographies [82,83,84,85,86] or to narrate personal insights related to individual fates [87,88], which again often represent the (hi)stories and fates of larger groups or collectives [80,89,90].
The relevance of such storytelling in CH and DH comes from the natural fit of narrative designs with the omnipresent time orientation of the data and from manifold options to create compelling collages of information, which interweave the bigger pictures of visualizations with contextual story threads, but also with rich media content such as portraits of persons and scenes from their lives. In the particular cases of cultural actors and artists, biographies are inseparably interconnected with their creation of artworks [91,92,93,94,95,96,97], while entrepreneurs [98] or military leaders [81] are connected to objects, buildings, or places throughout their lifetimes.

2.3. Object Biography Visualization

As for object biographies and histories of things, we find a notably smaller but similar pool of work leveraging visualization techniques for exploring, analyzing, and communicating the “lives of things”. Prominent person-centered visualization techniques also dominate this visualization genre: maps [99], graphs [100,101,102], charts [45,95,103], and timelines [104,105] are used to depict various events of object biographies. The matter of time and changing circumstances seem to become more important because of the longer lifetimes of objects throughout centuries, but on the other hand, the dating of events gets more uncertain [43]. Again, color coding [106] or trajectories [55,107] are used to encode time within other visualizations, such as maps. Associated multimedia content is shifting from the depiction of humans to things, using photos, scans [108], (sound) recordings, 3D models [109], or other sorts of “digital twins” of cultural artifacts [110]. Such digital depictions or reproductions of cultural objects—often also addressed as “digital relatives”—can also be analyzed as derivates and cultural artifacts of their own, with specific characteristics and biographies, so that the stories of digital objects (as non-trivial digital extensions of object biographies) become a noteworthy subject matter themselves (see Section 5) [27,111].
Especially the use of 3D modeling to represent physical objects and their evolution and (hi)stories are prominent: Here, the models are explorable in their three-dimensionality to increase tangibility [112], or animated paths through the models guide the story progression [113,114]. A few solutions for such 3D storytelling editors to create tours and enrich the objects using further multimedia exist [114,115,116], especially within the field of museum exhibition design. The potential for interactive and multi-entity storytelling lies in the disentanglement of hidden stories between objects and persons [117,118]. In museums, the concrete objects are sometimes augmented by interactive (e.g., gamified) elements or visualizations [119,120] to add more context. Still, physical objects are also used as tangible interfaces (i.e., controllers) between the real and virtual world [121,122]. Because of the close connection between CH actors and objects, many story examples shed light on a person’s creations tightly knit together with his/her biography [93,96,123,124]. Similar to these person-centered stories, specific, highlighted examples act as representatives for larger groups forming the (hi)story of whole object-centered topics [95,120,125,126,127,128].

2.4. From One to Many Entities

While biographical research necessarily starts from selected singular entities, every contextual reflection equals a zoom-out shot that reveals their embeddings within collections, aggregates, or sets of entities: for persons, families, groups, schools, institutions, etc. (covered by “prosopographical” studies) and, for objects, lifework collections, GLAM collections, art historical formations, and aggregations (covered by collection studies and art history). Visualization can support research in both fields, including prosopography visualization [42,51,129,130] and cultural heritage collection visualization [45,104,131,132,133,134] (see also Section 5). To create overviews of those collections, geo-spatial origins are illuminated using maps [55,128,135] and their development over centuries with timelines [51,136,137]. Glyphs are prominently used to depict the distribution of various entities within a grouping (e.g., to avoid visual overlap) on maps [127] or temporal histograms [138]. The inter-linked entities and their evolution within network graphs for whole collections are naturally analyzed within network graphs [40,42,100,101], where clusters and outliers within a larger group become visible. These representations are sometimes accompanied by supportive visualizations where the focus lies on the statistical analysis with charts [95,100,127], for example via theme rivers and histograms [51,95] to depict specific characteristics of the collection data sets.

2.5. Research and Development Gaps

While the outlined DH and CH visualization fields are emerging and thriving, various gaps require closer attention to fully support the analysis and storytelling of various entities via visualizations in a comprehensive manner. More specifically, a lack of generalized multi-protagonist storytelling tools (e.g., covering persons and things from one to many entities), a lack of multi-visualization tools (e.g., covering maps and graphs and timelines), and a lack of multi-practice tools (supporting visual analysis and storytelling and all sorts of data preprocessing) is asking for more synoptic and functionally integrated solutions.

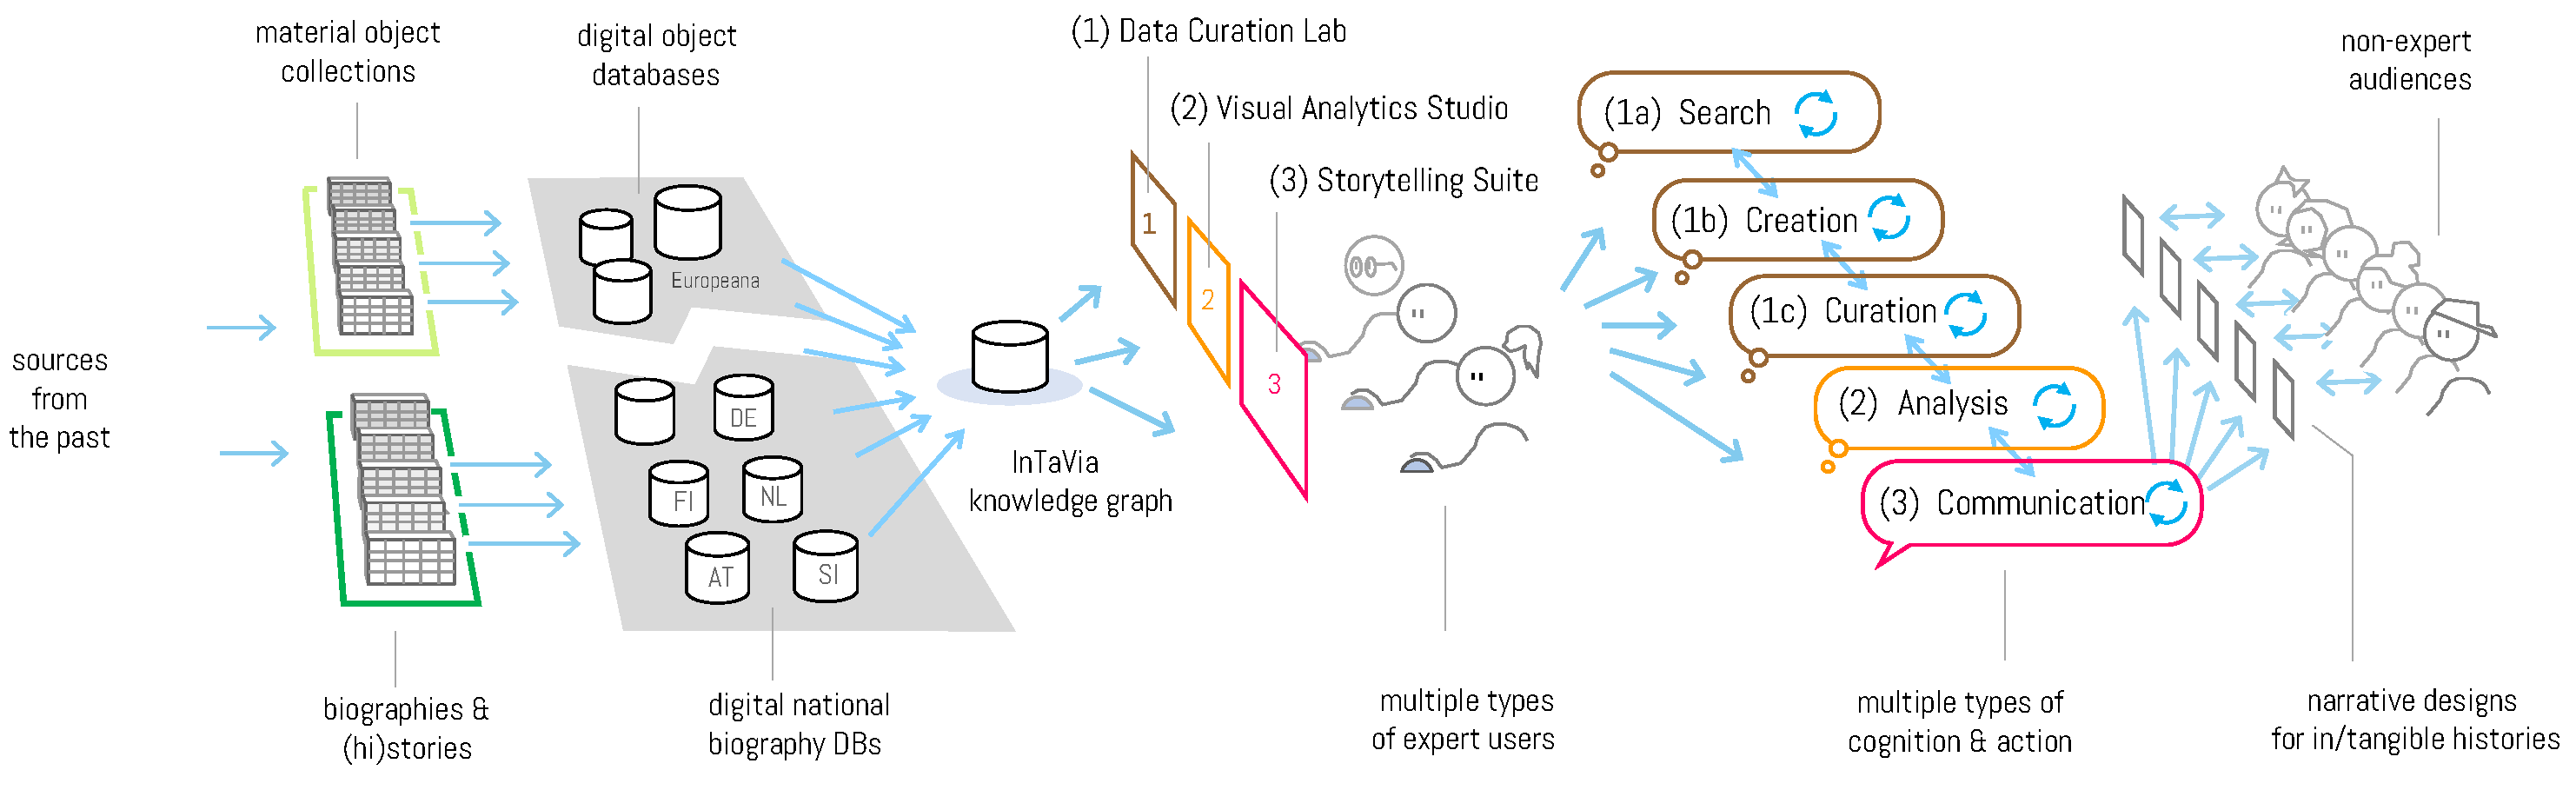
3. The InTaVia Platform

The H2020-project “InTaVia” (In/Tangible European Heritage: Visual Analysis, Curation & Communication) presents a holistic approach to cultural heritage integration and presentation. By constructing a transnational knowledge graph (Section 3.1), InTaVia connects isolated data collections, bridging tangible cultural heritage like paintings and sculptures with intangible cultural heritage, such as biographical information. This integration of data on cultural actors and heritage objects from various European sources, along with information on institutions, historical events, and places, aims to provide a more comprehensive view of cultural heritage and history. The InTaVia platform, whose architecture and data flow are illustrated in Figure 3, consists of three main modules, which support various cultural heritage data practices: The Data Curation Lab (DCL) (Section 3.2) covers searching, creating, and curating data; the Visual Analytics Studio (VA Studio) (Section 3.3) provides solutions for analyzing and interpreting data, mainly for CH and DH experts. Complementing these modules, the Storytelling Suite (ST Suite) (Section 3.4) provides the means to communicate relevant cultural and historical information to non-expert audiences through visual stories. Given the focus of this paper on storytelling, we will give a short introduction to the first two components for orientation (see [58,139] for a more detailed description of these components) and elaborate on the storytelling module thereafter.
The development of the InTaVia platform followed a participatory user-centered design approach. More than 40 cultural heritage experts and GLAM practitioners were involved in three workshops to identify relevant user practices and define user requirements at the outset of the project [139]. In three iterations, users gave feedback on the state of the platform development during workshops or individual test sessions. In Section 3.5, we present some user feedback from the final evaluation.

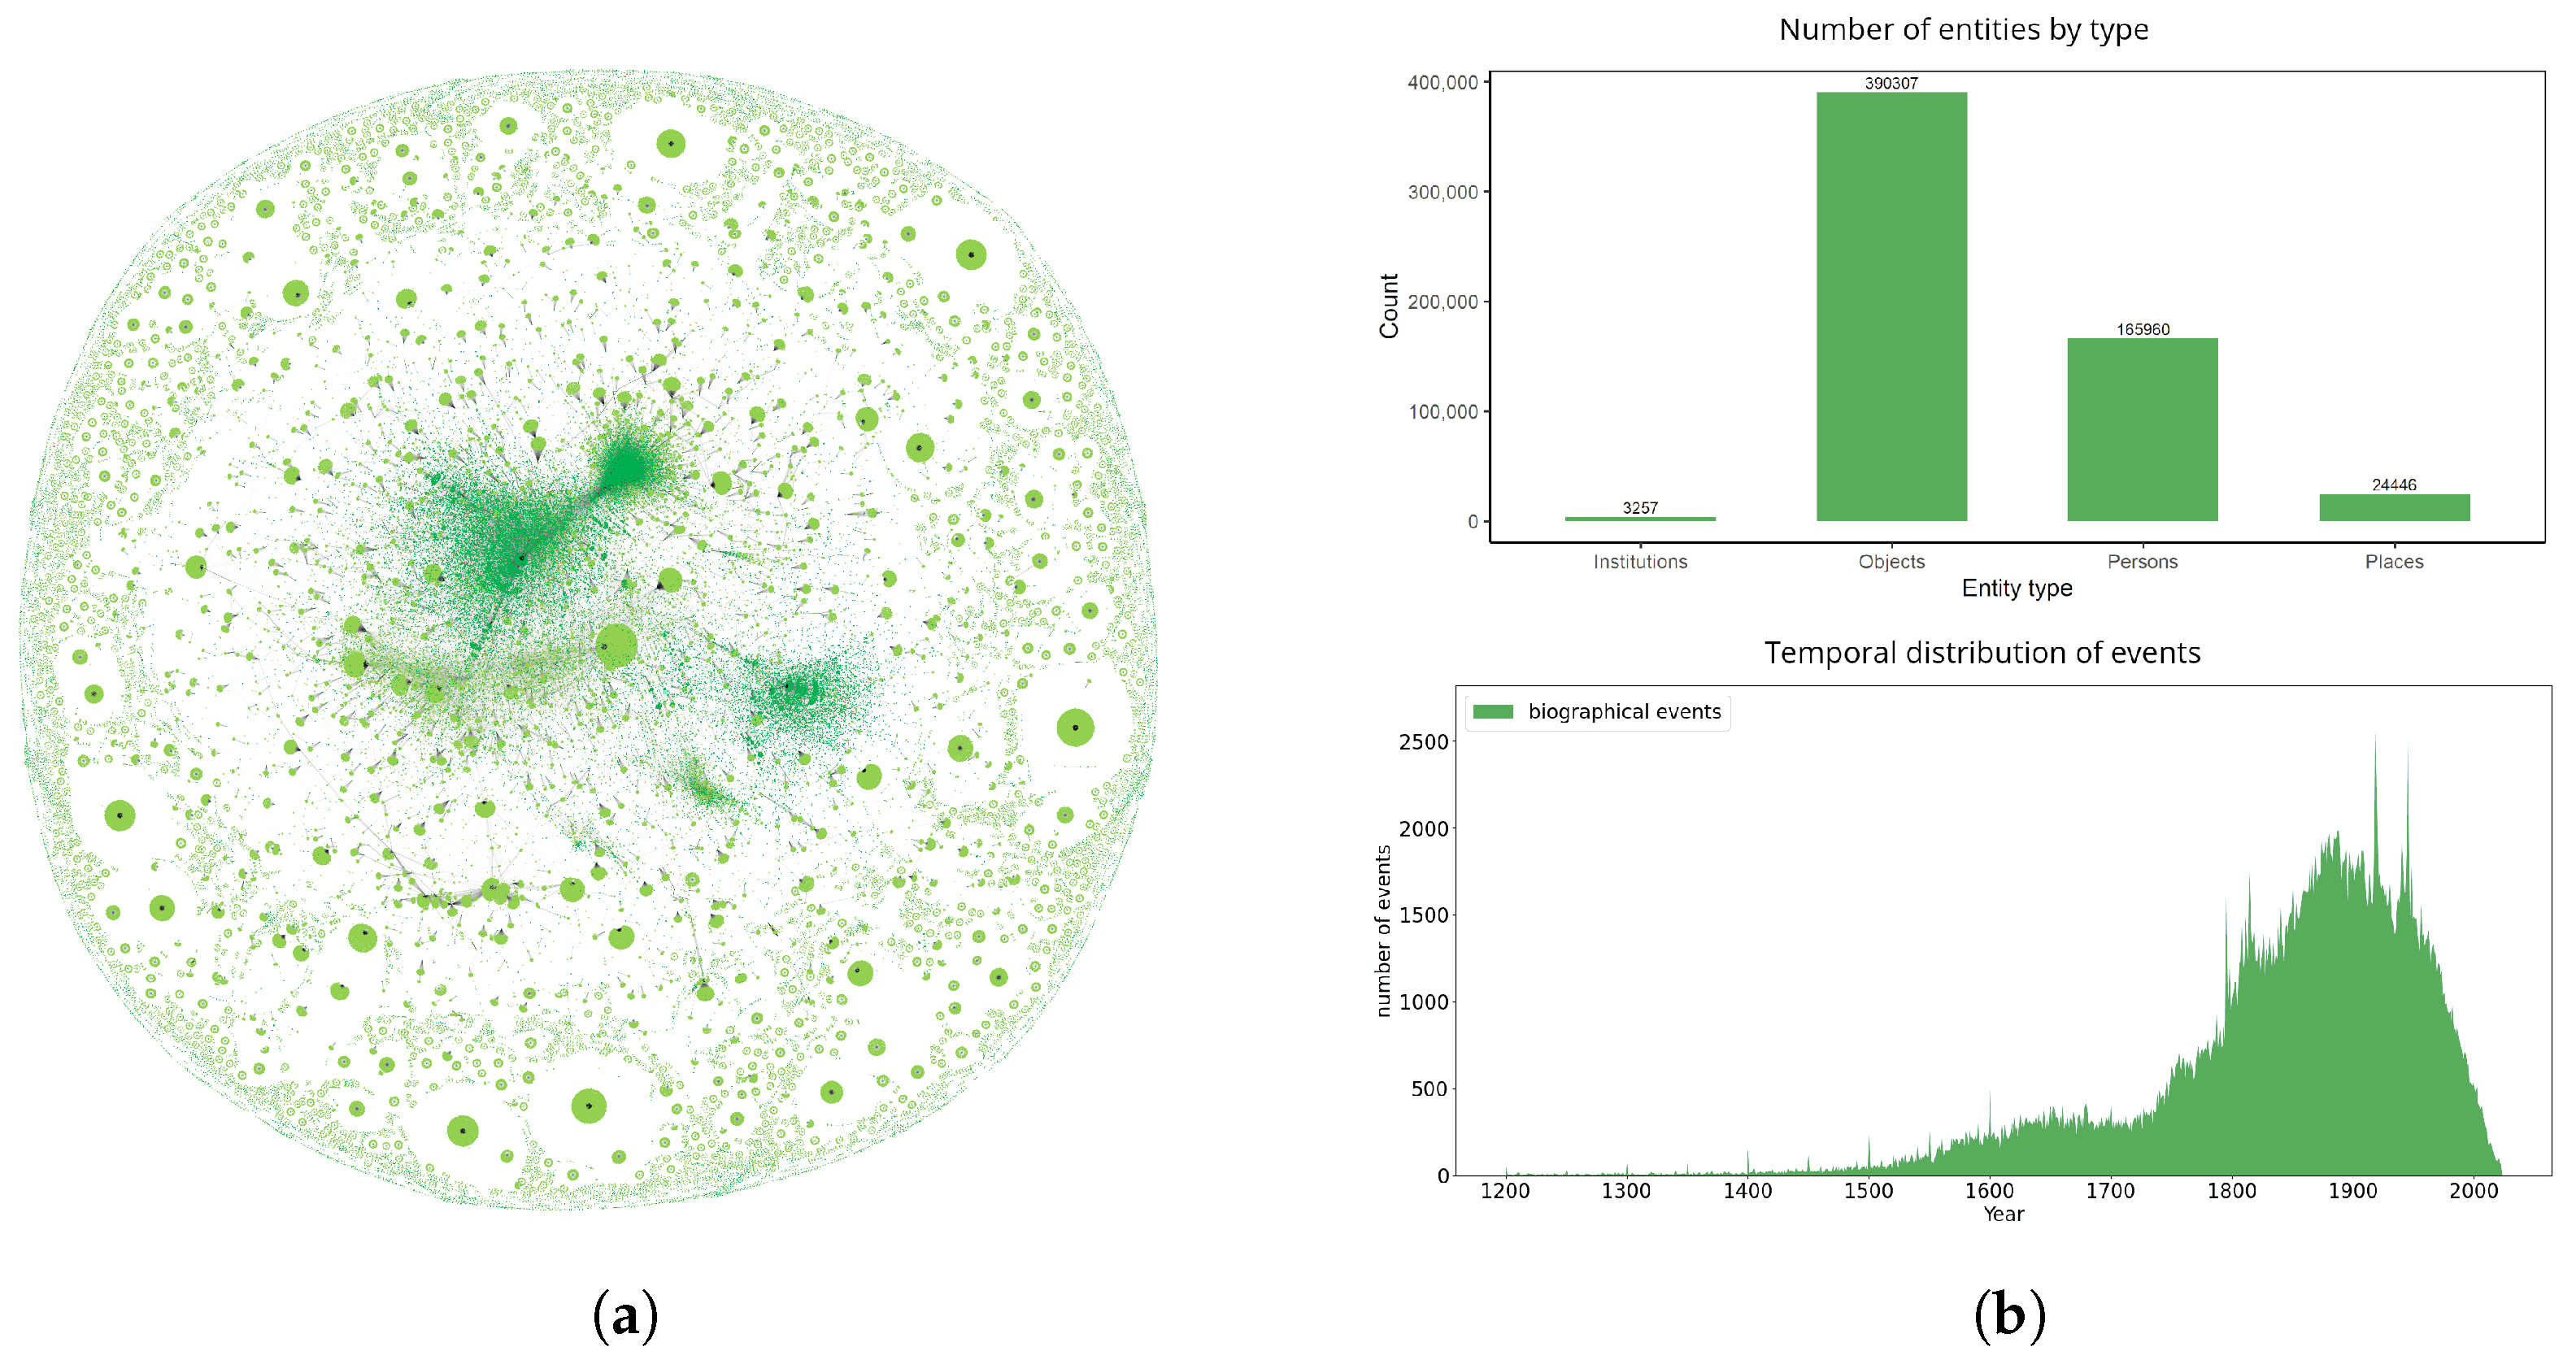
3.1. The InTaVia Knowledge Graph

InTaVia brings together data from four national biographical dictionaries: Austria (APIS), Finland (BiographySampo), Slovenia (SBI), and the Netherlands (BiographyNet). These biographical data have been harmonized to match the InTaVia Data Model IDM-RDF [140], which is based on CIDOC-CRM [141]. After the integration and harmonization of all biographical datasets, related cultural objects were retrieved from Europeana and Wikidata for each actor.
The resulting InTaVia Knowledge Graph currently contains 24,588,310 triples on 165,960 actors from Austria, Finland, the Netherlands, and Slovenia, 230,068 cultural objects from Europeana and 160,239 from Wikidata, as well as 3257 institutions and 24,446 places (see Figure 4). The majority of documented biographical events (including events of object creations) stretch out through the 19th and 20th centuries.

3.2. The InTaVia Data Curation Lab

The DC Lab is the entry point into the InTaVia platform by connecting to the InTaVia Knowledge Graph (IKG) and by providing a means to search, inspect, collect, and curate information on the vast CH data, which include persons, objects, institutions, and places.
Querying data: Users can access the knowledge graph through queries, which can be customized based on specific parameters like text labels, entity types, or relations to specific entities. This allows for targeted searches and retrieval of relevant DH and CH entities. Query results are shown in a list where each entry provides a summary of the respective entity, such as its label, type, and number of related events. Additionally, the result set can be narrowed down further interactively in a visual overview of the returned entities. To manage retrieved entities and reuse them across all platform modules, they can be organized in user-created collections.
Collecting data: Collections are used throughout the DC Lab, VA Studio, and ST Suite as user-defined sets of entities to save and manage the data that users are working with. They can add individual entities or entire query result sets to a collection. Furthermore, the DC Lab allows locally importing data from different sources like Excel sheets or JSON files. It is important to note that these data are not shared with the IKG, nor is the IKG updated when entities are locally edited. All the available information on an entity is presented on a detail page that includes network, map, and timeline views on their related entities and events, in addition to media files and a biographical text.
Creating and curating data: A specific screen enables users to create and curate data in the DC Lab. This functionality allows manually correcting and enriching the data from the knowledge graph, or merging it with locally imported data. In addition to curating basic entity information like labels, linked URLs, and occupations, users can also enrich an entity’s events and relations to other entities. Additionally, they can create new entities not represented in the knowledge graph. These rich curation features give users complete control over their data used for analysis and storytelling in the subsequent steps.

3.3. The InTaVia Visual Analytics Studio

The VA Studio module of the InTaVia platform provides temporal, spatial, and relational perspectives on cultural heritage information. To this end, users can create coordinated visualizations in flexible workspaces with adaptable multi-panel layouts that provide synoptic views with several perspectives on the data simultaneously. These tools help DH and CH experts understand the connections and patterns within their data collections, and develop and consolidate insights.
The three visualization types supported by the VA Studio are maps (including a space–time cube option), network graphs, and timelines. Visualizations can be customized to fit the current information-seeking needs. Multiple options for color encoding (e.g., by entity type or by time) enable different perspectives on the data. Various visual aggregation methods, such as donut charts or bee swarm clusters, prevent occlusion and visual clutter in analysis scenarios with many events in close spatial or temporal proximity. In addition, features like visualizing life paths with trajectories on maps or in space–time cubes support historians’ analysis tasks. Moreover, the visualizations created in the VA Studio can be re-used in the final stage of the workflow by incorporating them into visual stories.

3.4. The InTaVia Storytelling Suite

How can we convey complex cultural data to non-experts? From the outset, the InTaVia platform was designed to support experts with the compilation of data-driven stories, so to present CH and DH information in an engaging and accessible manner. By allowing treating each entity (persons, objects, institutions, places) as protagonists or “heroes” of their own narratives, InTaVia offers a highly flexible tool for conveying a more in-depth and interconnected narrative understanding of cultural history and heritage topics.
The Story Creator, as the first component of the Visual Storytelling Suite, instantiates an innovative concept for crafting multimedia-rich, interactive slideshow-based stories. It integrates several features to enhance the storytelling experience:
Content creation and editing: The central component is a slide editor, which allows users to create and organize their content visually. It allows combining novel or pre-existing visualizations from the VA Studio with other media into unique layouts, with a focus on editorial ease of use and well-structured, appealing results (see Figure 5b).
Slide management and flow control: This feature provides an easy way to manage multiple story slides through a thumbnail-based panel, where users can create, duplicate, delete, or rearrange slides (see Figure 5c). It also allows creating “nested slides” for adding narrative depth with substories, which unfold on users’ demand [31].
Visualizations and interactions: Regarding different types of visualizations, the Story Creator supports a unique mix of methods: While various “single-method” tools exist (such as StoryMapJS [73] or TimeLineJS [75]), the narrative assembly of maps, timelines, and network graphs has not been possible before. InTaVia’s Story Creator allows creating stories with all of these visualization types, and including details on demand and options for further exploration (see Figure 5b, left). To that end, it uses modern, responsive design elements that are compatible with both desktop and mobile browsers.
Multimedia content and combinations: All visualizations can be enriched and combined with various multimedia content, such as images, videos, 3D models, text blocks, and HTML content (see Figure 5b, right, blue elements). Interactive elements such as quiz games or external media and 3D renderings can further raise the factors of user engagement and narrative user experience.
The Story Viewer, as the second major component of the Storytelling Suite, provides the missing link to story audiences and fosters the interactive reception of stories developed with the Story Creator. It brings stories to life through dynamic visual elements, ensures smooth transitions between slides, and delivers high-quality visual renderings in a responsive manner to support mobile devices. Additionally, it incorporates interactive features that aim to enhance user engagement and provide an immersive storytelling experience. Its design focuses on maintaining user interest and involvement, thus setting a new standard for visualization-based storytelling technology.
In its entirety, the Storytelling Suite offers a comprehensive solution for creating engaging, interactive, and visually appealing stories with a first-time combination of multiple visualization types. Its focus on dynamic content creation for multiple types of protagonists makes it a valuable tool for a wide range of applications, from educational storytelling in the arts and humanities fields to cultural tourism, journalism, and presentations in GLAM institutions. For practitioners, we explain the whole process of crafting a story in a walk-through video (https://youtu.be/VafQAFCqduw (accessed on 15 April 2024)).

3.5. User Feedback

The final version of the InTaVia platform was evaluated during a workshop with twelve GLAM practitioners in September 2023. These results were amended by three individual test sessions with an art curator, a museum education specialist, and a history teacher.
Overall, workshop participants liked the Storytelling Suite and expressed their intention to use it in the future, considering it to be “a very efficient pedagogic tool”. Important discussions evolved on questions of the copyrights of images from the web, which are used in the stories. Another open topic turned out to be visual clutter—e.g., of network visualizations—and how visual information density could be reduced to show additional details on demand only.
During the individual test sessions, most experts immediately saw the potential of the Story Creator for their communicative practices: An art curator wanted to create stories on exhibition projects. For art education, it could be used as a tool for collaborative design tasks for students. The history teacher suggested creating interactive learning sessions with quizzes to digitally accompany a history schoolbook. When creating stories, the experts did not find the Story Creator fully intuitive in the first place, but could quickly use it with some help. “The workflow model of InTaVia is a great one—which has the potential to change my practice—and that of colleagues in various domains”.
In conclusion, the holistic workflow of the InTaVia platform (illustrated in Figure 1, right-hand side) supports multiple practices from finding and curating cultural information to analyzing and exploring it to communicating it in engaging visual narratives. While this appears at first like a straightforward step-by-step process, reality often differs. Commonly, many loops and jumps between the steps occur until all details of a biography are explored and understood. While analyzing the data, missing attributes or links might be discovered, and the need for additional visualizations might arise when authoring a visual story. Accordingly, the InTaVia platform facilitates seamless switching between the DC Lab, VA Studio, and ST Suite to foster this iterative process. Users can enter the workflow at any stage and effortlessly jump between the steps, turning the platform into a powerful multi-practice tool.

4. Use Cases

Given the outlined combination of features (Which stories are possible for which types of “heroes”?), this section presents four narrative use cases revolving around different kinds of entities as story protagonists: persons, objects, groups, and places. These stories emerged from associated cultural or historical research projects and from co-design processes involving visualization experts, media designers, and domain experts. All of them are available as editable example story use cases within the InTaVia Story Creator (https://intavia.acdh-dev.oeaw.ac.at/storycreator (accessed on 15 April 2024)).

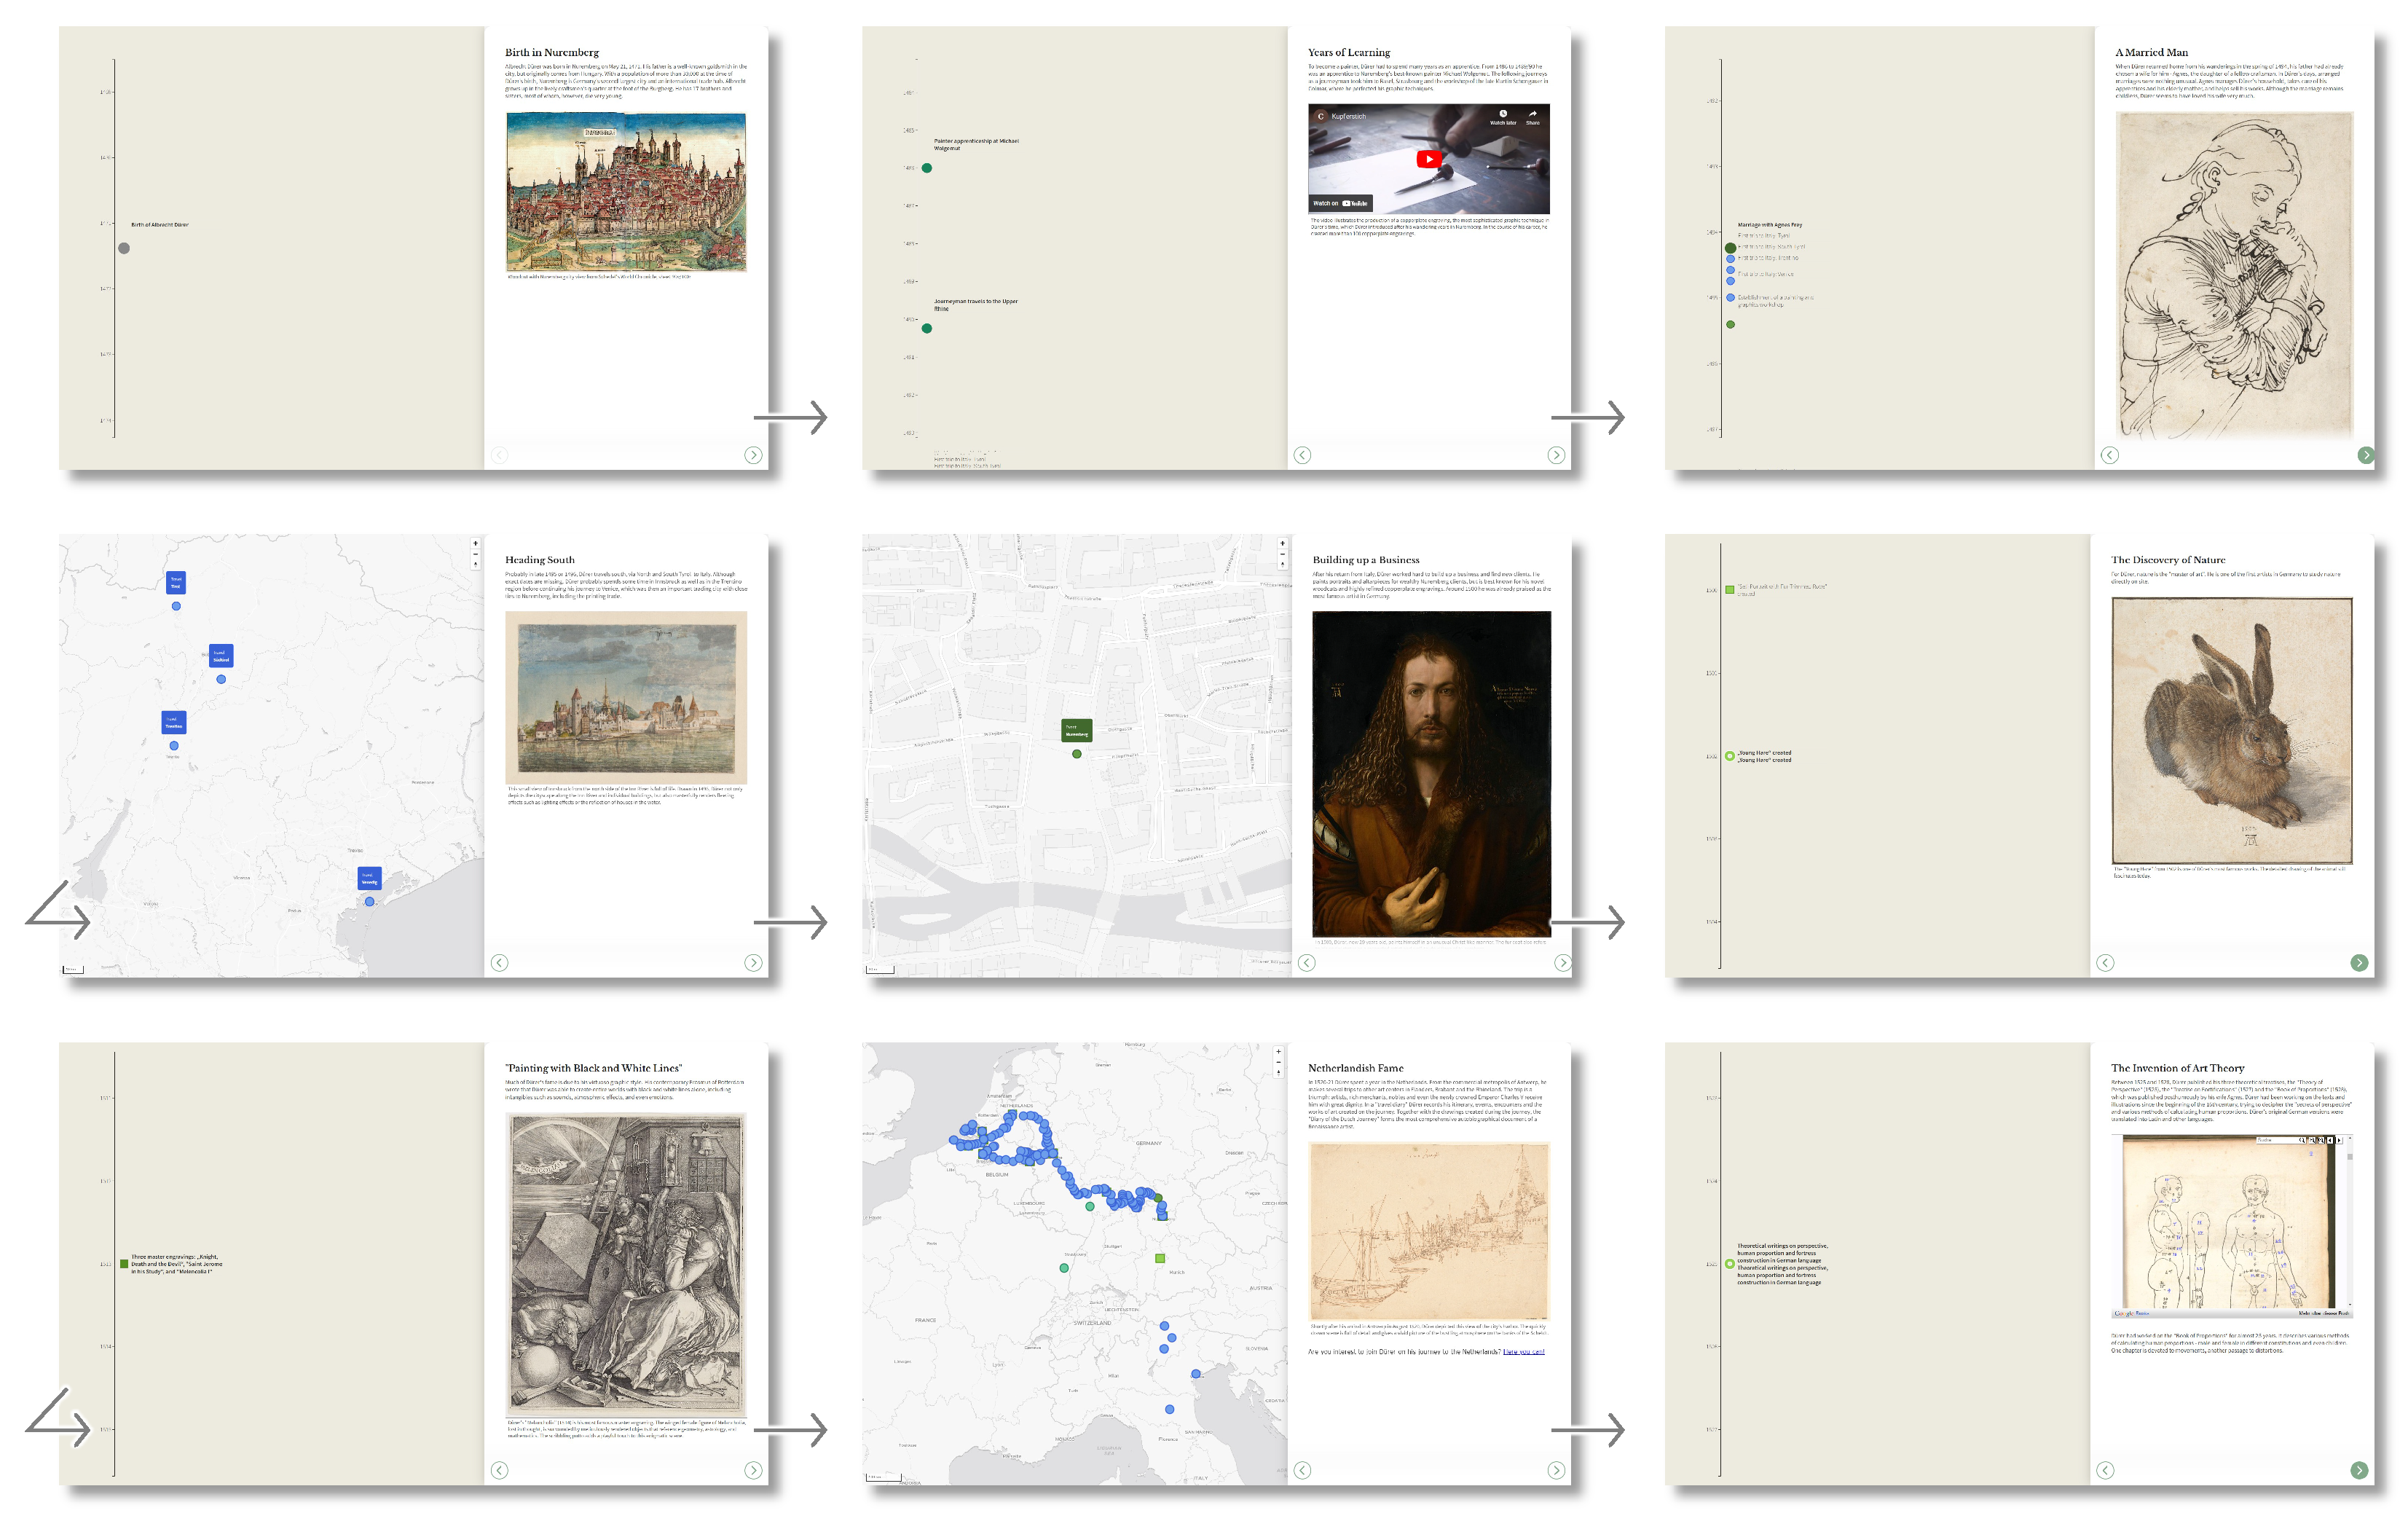
4.1. Person Biography: Albrecht Dürer

A first story provides an introduction to the life of Albrecht Dürer, including visual representations of his biographical data and related cultural objects (https://youtu.be/3MRpasJiLqI (accessed on 15 April 2024)). It is targeted at the general public with an interest in art history. The underlying data have been manually curated by Anja Grebe and draws from her research on Dürer’s life and work [143,144]. A sub-story deals with Dürer’s journey to the Netherlands, for which she studied his diary with highly detailed travel records [145]. The biographical data have been enriched with related media on Dürer’s artworks and uncertainty information [130], to illustrate how biographical events and spatial movements influenced his artistic oeuvre.
Plot: The story recounts the life of the German artist Albrecht Dürer from birth to death (see Figure 6). Recipients, thus, can contemplate important works and turning points of the life of this exceptional artist: his education, the development of his craft, his travels, and his international success. A combination of descriptive and narrative texts, visualizations, and images shows how threads of life, business, and artistic work weave into each other. While the main story conveys a biographical overview, it also offers to branch from the main narrative into a detailed sub-story of Dürer’s journey to the Netherlands in 1520.
Narrative visualization: The story combines interactive map and timeline visualizations to let readers trace and explore significant events and milestones in Dürer’s life, revealing travel patterns and his overall life path. Seamless transitions between selected points in the visualizations on different slides support users in following the course of his life and his travels. While users can consume the story passively and only interact with the slide navigation, they can also freely explore the map and timeline visualizations.

4.2. Object Biography: Cellini’s Saliera

The Saliera story recounts the object biography of a prominent cultural artifact: The golden salt cellar Saliera is a masterpiece of Renaissance art by the Italian goldsmith Benvenuto Cellini, which came to renewed fame due to its theft and rediscovery. The story aims at the general public and interweaves object information with biographical aspects of its artist and information on other related persons. The data have been manually generated by Maximilian Kaiser and enriched by members of the project team for an experimental study on story designs.
Plot: Foreshadowing the recovery of the stolen golden salt cellar in 2006, the history of Cellini’s masterpiece is told chronologically (see Figure 7): From its first conceptualization by Benvenuto Cellini in the 16th century, where it was deemed unfeasible by the original sponsor, to its actual production for the French king Francis I, who gave it to the Austrian archduke as a present. Later on, it became forgotten until J.W. Goethe translated Cellini’s biography into German and interest in the artist’s work arose again due to his wild and turbulent life, mixing high art with murder and other crimes. Eventually, the Saliera became one of the most prominent exhibits at the Museum of Art History in Vienna. In 2003, during restoration work on the museum’s facade, it was stolen from the museum in a spectacular heist, to be recovered again after years of investigations in a forest near Vienna, so that it is now on display again.
Narrative visualization: Visualizations mainly focus on the object data and recount the object’s biography with a timeline and a map, enabling users to trace and interactively explore significant events and transportation patterns, in which the golden artifact was involved.

4.3. Set Biography: Tuusula Lake

This story centers on a prosopographic data set, aggregating the biographies of multiple persons related to the Finnish Lake Tuusula into a collective narrative (https://youtu.be/_9gr62cg85w (accessed 15 April 2024)). The target audience is the general public with an interest in art and cultural history. The biographical information of the artists has been gathered from the InTaVia Knowledge Graph (IKG). New cultural objects for the houses have been created and merged with the data from the IKG [97].
Plot: The story focuses on a group of influential Finnish artists who settled to live around Lake Tuusula in the early 20th century—and on the creative network generated among them (see Figure 8). After an introduction, the recipient is guided to important places around Lake Tuusula and introduced to the actors, important events in their lives, and some of their works.
Narrative visualization: The story starts with two visualizations introducing the Tuusula lake community as a group: (1) A map visualization conveys the cosmopolitan character of the community, which was active all over Europe. (2) A network visualization of all important actors of the community depicts how close knit the artistic collective around the lake was, leading to influences and paintings of each other.
After setting the scene, the story focuses on a map of Lake Tuusula, which guides the user around the artists’ residences along the shore. For each artist, a timeline illustrates the most important life events—with a selection of them highlighted, while the others can be explored by the readers.

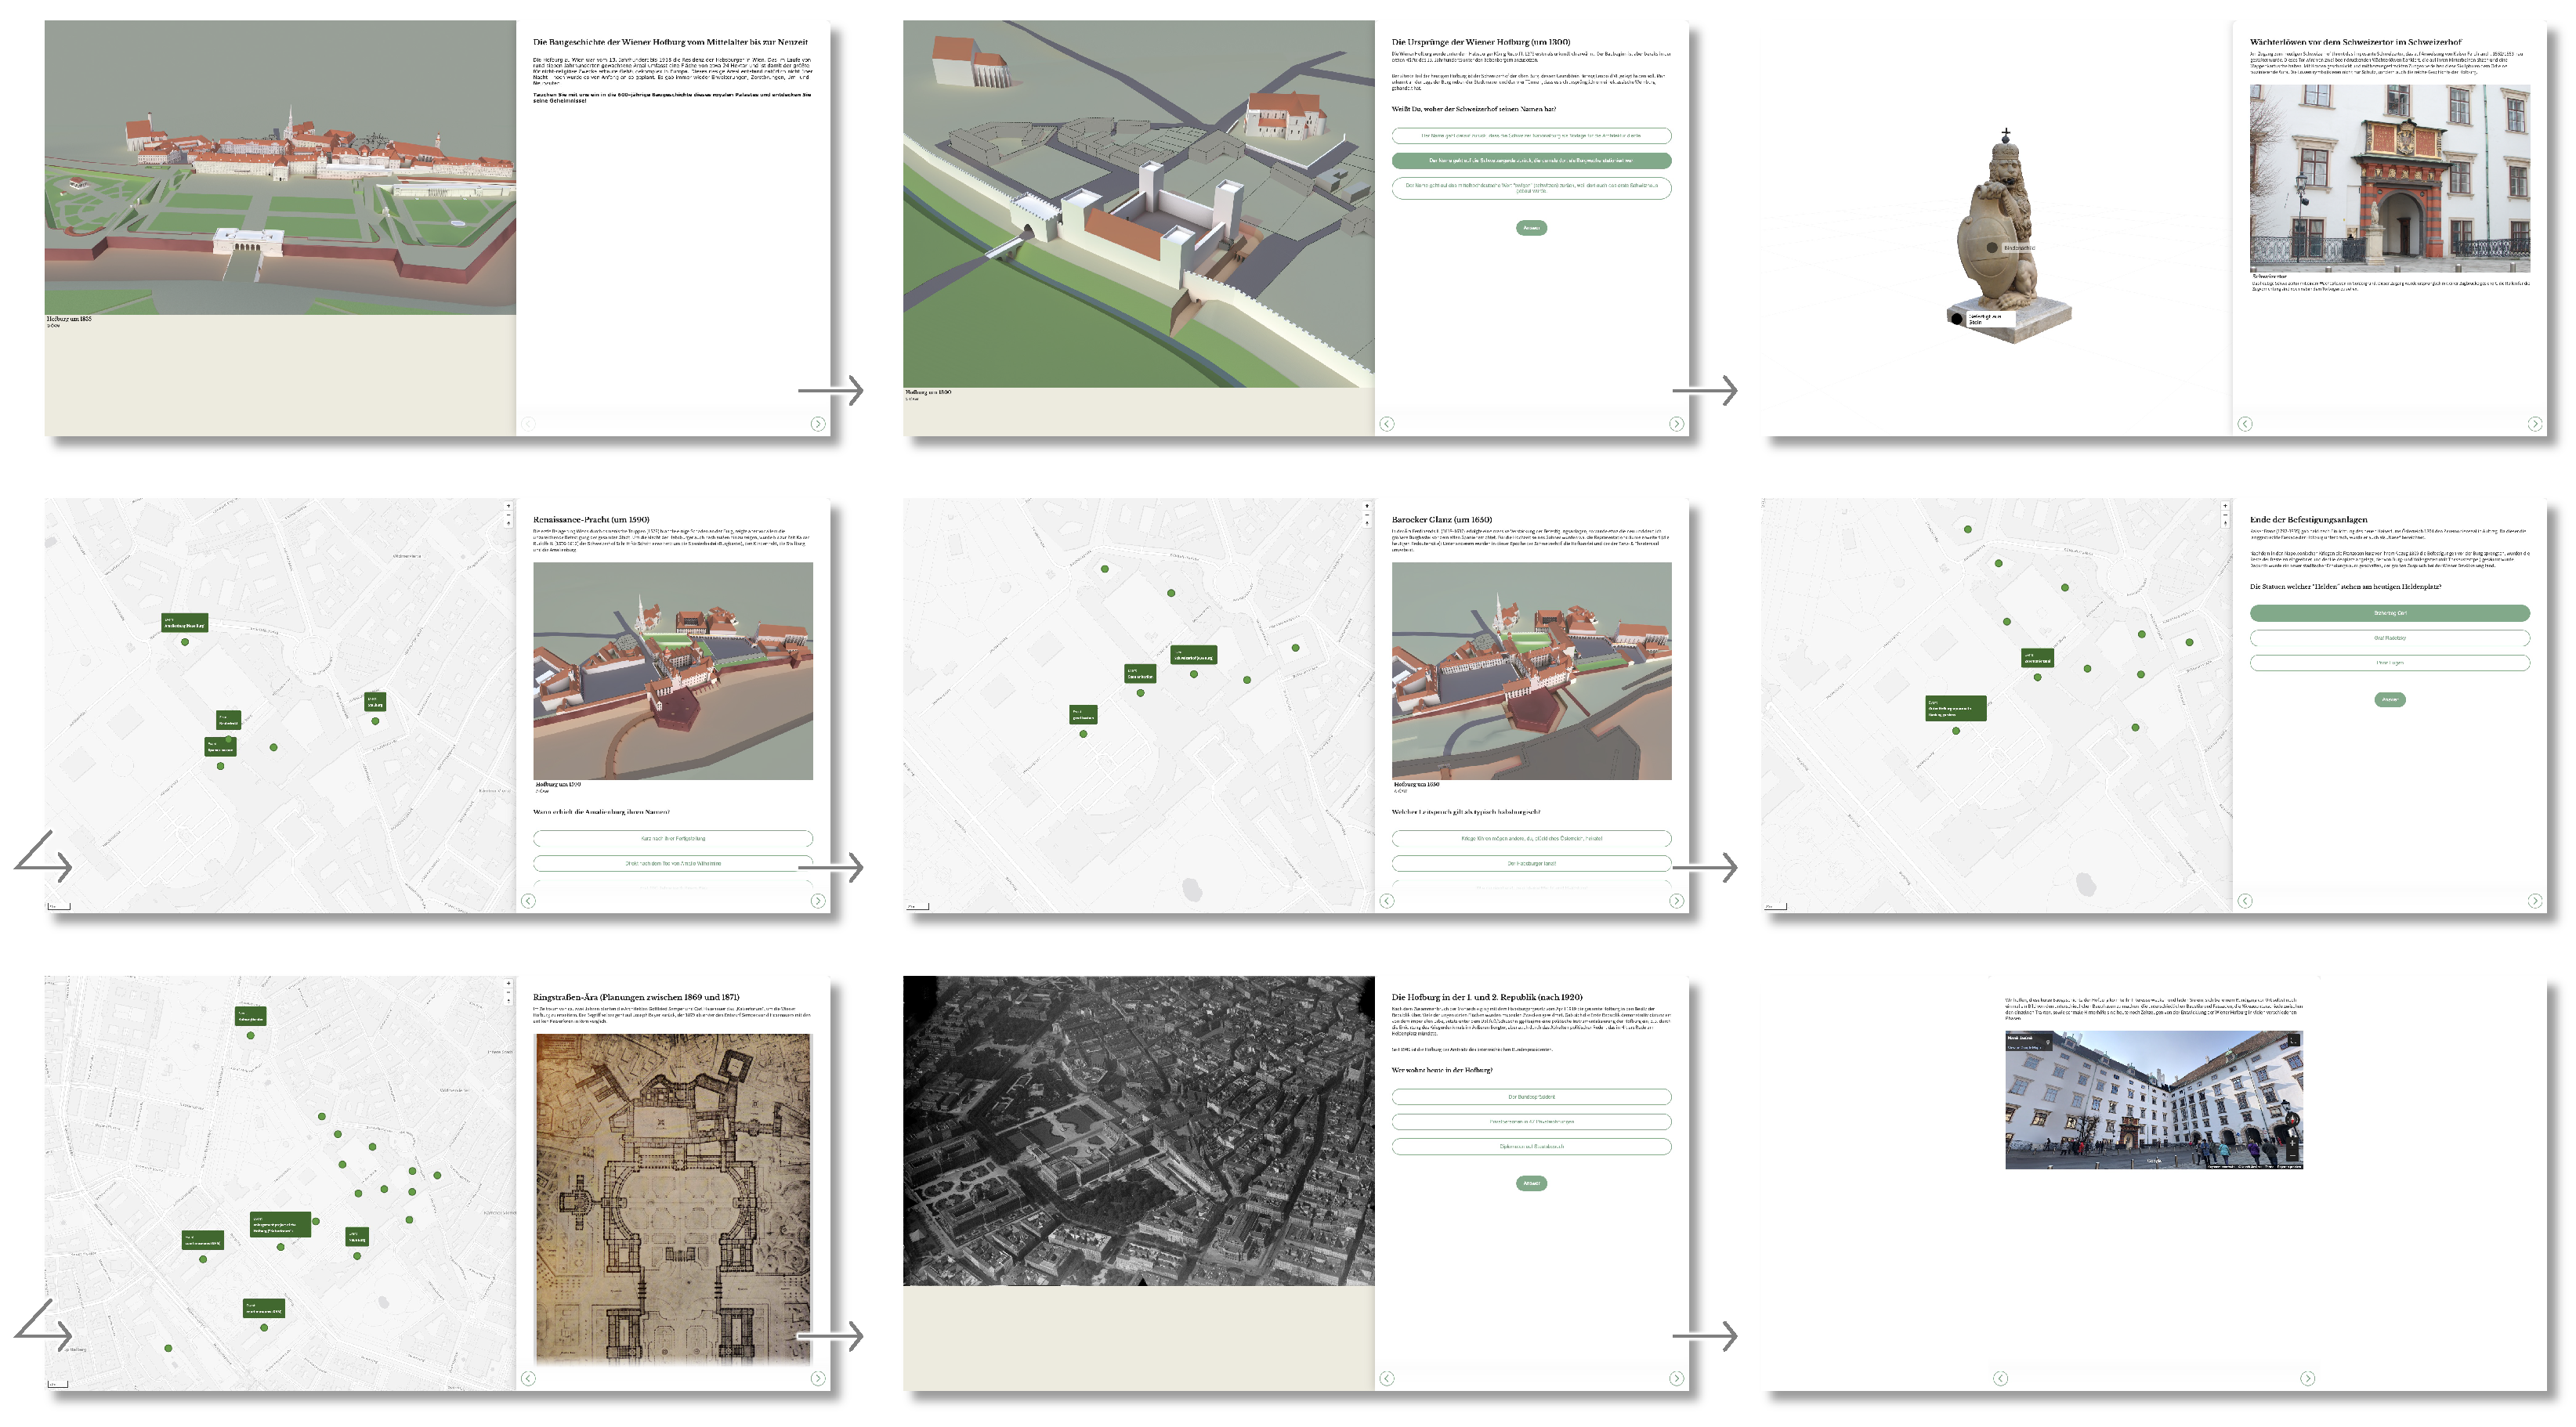
4.4. Place Biography: The Building History of the Vienna Hofburg

The Hofburg story is both a place and a complex architectural object biography in Vienna, targeting the general public with an interest in imperial and cultural history, as well as tourists visiting the building complex of the Vienna Hofburg (https://youtu.be/VfMtttzMtJ4 (accessed 15 April 2024)). Though it appears to be one coherent building complex today, it was built in steps and phases over centuries as a symbol of the Habsburgs’ power. The data have been manually generated by Richard Kurdiovsky and project colleagues and are based on a major research project by the Austrian Academy of Sciences [146,147,148,149,150,151].
Plot: The story tells the construction history of the Hofburg in Vienna from its founding in the 13th century until today (see Figure 9). Over the course of centuries, it developed from a basic fortified castle to a huge palatial building complex as the power and empire of the Habsburg monarchy grew. Visual representations of different construction phases and building objects are shown in historic drawings, plans, prints, and 3D renderings. This story also branches into a detailed description of the Hofburg’s building state around 1590 (which could be added for each of the presented building states in a similar way).
Narrative visualization: As the story focuses on a whole place of imperial living, a map visualization is the central visualization component, around which the story unfolds. It enables viewers to better comprehend the location of different buildings and the growing size of the palatial building complex. The map is complemented by 3D renderings of the Hofburg, which visualize the size of the building complex at each development stage. At the end of the story, users can explore the building complex with the 3D engine of Google Street View.

4.5. Comparative Summary

The outlined stories center on different kinds of heroes: a person (Dürer), an object (Cellini’s Saliera), a place (the Vienna Hofburg), and a group (the Tuusula Lake community). While each story has its unique characteristics, several commonalities become apparent:
(1)
Setting: At the beginning of each story, the focus is put on a unique type of hero, setting the scene and introducing the main actor. Depending on the entity type, different kinds of information are given: For a person, it is the life range and occupation; for an object, it is the creator and its temporal and regional origin; for a place, it is the spatial context; for groups, it is their members. But, independent of the entity type, the initial emphasis of all settings is on the importance and specificity of the protagonists: Why are they of interest? Why are their stories told, and why should the recipient care?
(2)
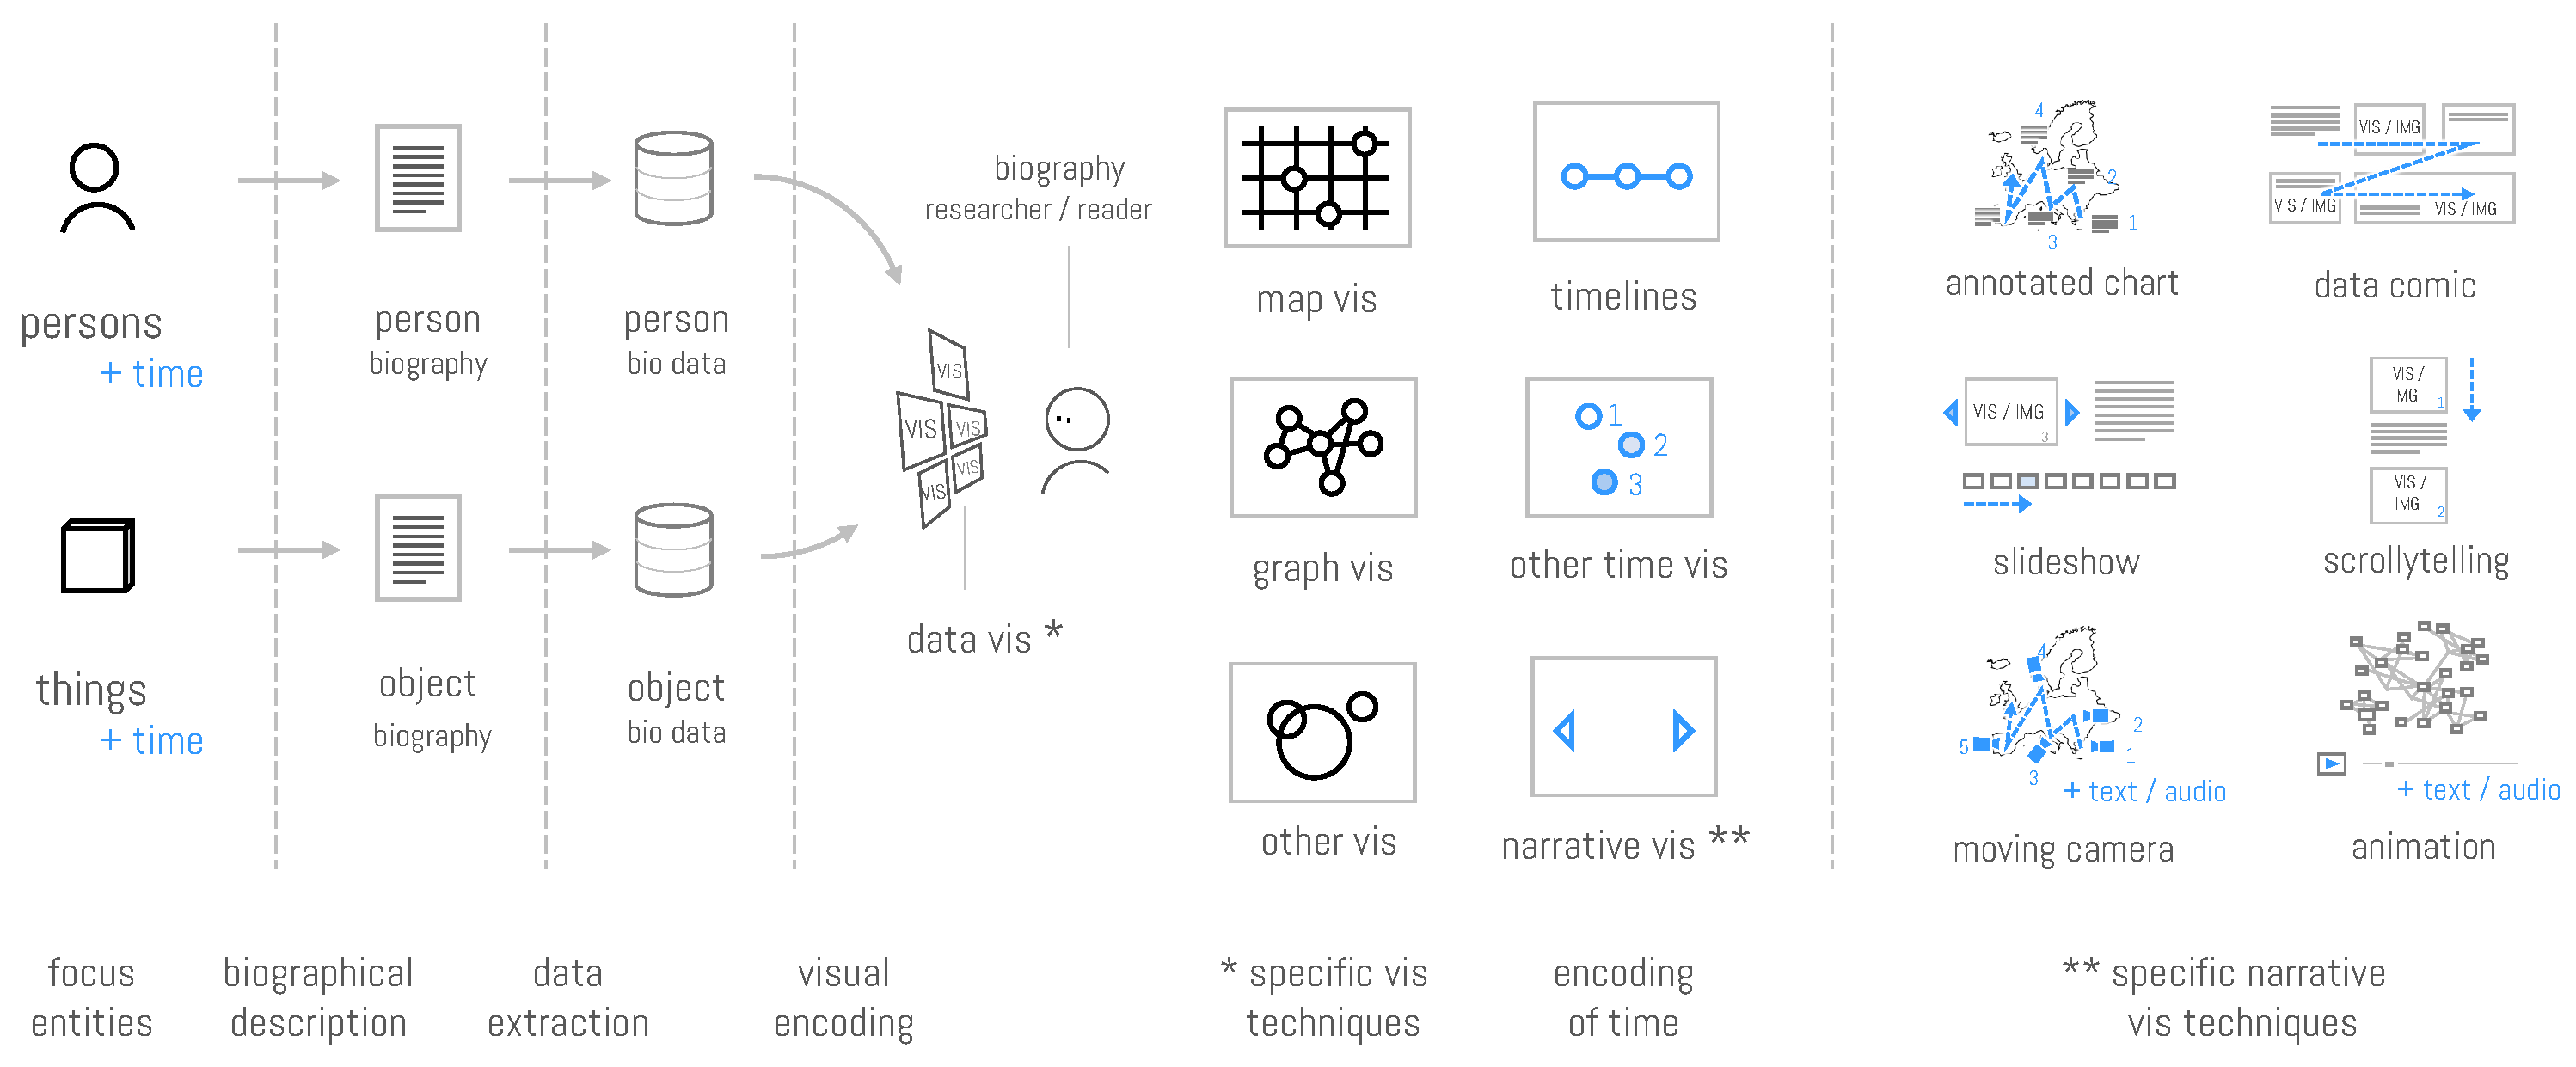
Visualization: Due to the inherent temporal nature of biographies, all stories make use of time visualizations, which greatly helps guide viewers through important events and stages of the heroes’ lives chronologically. Depending on the entity type, other types of visualizations then provide complementary support for the comprehension of a story: for instance, a network visualization emphasizes how a group of actors is related, while maps make movement patterns transparent and help locate places.
(3)
Linking the visualization with the story flow: For visualization-based stories, users should be supported to create links between the textual paragraphs, which mostly carry the narrative and interconnect the visualizations and other media [152,153,154]. In our use cases, this is realized threefold: by placing related text blocks and visualizations side by side, by highlighting relevant data points (places on the map or events on the timeline), and by showing transitions between different places or events.
(4)
User experience and engagement: How engaging a story is does not depend on the kind of entity, but rather on the narrative design patterns: for example, whether story hooks are presented at the outset or in the midst of a setting, whether tension is built up successively and developed by a narrative arc, or whether surprising turns or facts are presented within the story, which (re)kindle the viewer’s attention. Arguably, story recipients can more easily identify with human actors than with a salt cellar or with a building. However, by changing our perspective or by combining multiple types of entities, we can “humanize” and dramatize such stories, as is shown in the Saliera story, where its creator is prominently featured. We will come back to this point in the discussion.

5. Discussion

Various questions, which arise from the outlined endeavor, seem to be of general relevance for storytelling within the DH and CH fields. We start from the assertion raised in the paper title and discuss questions of scalability, conceptual accuracy, and visualization design, but also challenges and opportunities opened up by novel technologies like Large Language Models, Artificial Intelligence, and Mixed Reality. Finally, we elaborate on the implications for DH and CH practice.
Can every thing be a hero? The InTaVia project created a knowledge graph and a platform that allows modeling visualization-based stories on any kind of entity available as a node in its knowledge graph. Obviously, this does not guarantee that each (kind of) hero story will be equally successful in terms of user engagement and learning. User engagement is oftentimes questioned when it comes to non-human entities, such as physical CH objects. To study this effect, we recently conducted a pilot study in which we compared stories on human actors with stories on cultural objects [155]. For object stories, the study participants indeed reported slightly lower levels of engagement. A possible explanation could be that objects are more frequently perceived as passive entities, whose course is only influenced by others’ actions. Still, objects such as artworks, weapons, or tools obviously influence persons and other entities and can be analyzed as protagonists; we just have to shift our perspective [156]. However, the dominant form of metadata for CH objects makes their dynamic and “biographical” representation difficult: objects frequently have only one (or very few) structured events assigned (“has been created by”), whereas person biographies are a much more event-focused genre. Further interesting object events (such as restorations, modifications, sales, theft, destruction, but also, interpretations or inspirations) and related entities are rarely documented in a structured fashion. But, biographical visualizations depend on rich and structured event data—no matter which kind of entity—which makes options for manual data enrichment essential. How much engagement and interest a specific (type of) hero triggers depends also on the recipient of the story. For example, identification with the story protagonist is known to increase engagement. But, also, the right level of story complexity, which matches the recipient’s available cognitive resources for processing and sensemaking and deviations both upward or downward put a positive reception in jeopardy. Finally, identification with a protagonist can also be triggered by tangible cultural objects, which can be exhibited in their “auratic” reality, and augmented by visualization-based stories. Such hybrid or extended realities are known to blur the borderline between digital and real story worlds and allow directly linking physical objects and places of cultural importance to their digital derivates, further digital multimedia content, and visualization-based stories.
Are we looking at the right kinds of heroes? The InTaVia platform has been developed to support a range of more open and less anthropocentric (i.e., “multi-protagonist”) approaches to visual analysis and storytelling in CH and DH. Due to this strategy, it allows complementing the traditional work with human-centered biographies with non-anthropocentric accounts on the histories and biographies of things, institutions, places, or combinations thereof. In combination with the design strategy to utilize multiple types of data visualizations, this generates an impressive modeling spectrum for historiographical topics. Regarding the resulting scale and scalability of InTaVia’s visualizations, Figure 10 shows how the Visual Analytics Studio (see Section 3.3) allows centering the work of digital humanists and historians on individual biographies first (see Figure 10a), and proceeding to the visual analysis and representation of smaller and larger aggregates of entities from there (see Figure 10b,c). In contrast to many existing (mono-method and mono-scale) visualization tools (see Section 2), this is a significant extension of the visual representational range, and a development direction we consider as highly relevant for future research.
However, with the project’s initial design decision to build the InTaVia story viewer as a responsive output device for non-expert audiences (see Section 3.4)—and, thus, to acknowledge their common mobile-first expectations—the representational range of the whole Storytelling Suite was deliberately reduced to the first two columns of Figure 10, and to foreground knowledge communication with individual entities and small aggregates. Future work on narrative visualization for CH and DH, thus, faces a wide field to cover with multi-scale tools, but also the need to discuss the added benefits of seamless upward scalability. It stands to reason that the benefits of covering the full spectrum—from individual biography visualizations to representations of big history [157,158,159]—will be offset by numerous development costs. Aside from substantial design challenges to enable world historical “scalable viewing”, the need to consolidate large-scale databases first is often discussed [28,160], but nowhere near completion. It seems obvious that evolving AI and LLM technologies will help to make steep inroads towards enriching, harmonizing, and upscaling such projects, but only with co-creating a whole range of reliability challenges in history-adjacent fields [161], where rich and uncontested sources are notoriously scarce to begin with. Beyond the challenges of assembling large-scale databases with seamless granularity for rather natural historical entities (such as persons, objects, and all their evolving types of aggregates), an even bigger challenge might be modeling the connections of these entities to the conceptual entities (i.e., the various scholarly concepts, terms, and ideas) that guide and govern historical inquiries [162]. As summarized at the outset (see Section 1), there seems to be a valid and time-tested argument for working with micro-analytical (e.g., person or thing-oriented) lenses in most communities of historiographical practice and discourse. But, whether the lion’s share of DH visualization tools is looking at the “right” kind of heroes and actors with their focus on concrete entities (from “great (wo)men” to “common fellows” and from crowns to artworks and artifacts), which are relatively easy to extract with standard-NLP methods, deserves a more intense debate. As a consequence, the rather simple ontologies of historical entities and agents, which undergird InTaVia and similar projects, could see fascinating extensions, together with the visual grammars of related front ends and their visual displays.
AI and Large Language Models: Applications of advanced Artificial Intelligence (AI) and Large Language Models (LLMs) have already shown their tremendous potential for CH and DH research and practice [163,164,165,166]. As such, possible contributions to biographical research and storytelling have been explored in the InTaVia project [167,168,169], but we expect their relevance to steeply rise, numerous challenges notwithstanding [170,171,172]. In history-related fields, LLMs can introduce advantages in creating and assembling structured data from textual sources [173], but also in detecting and combining the complex connections between cultural objects, actors, and their historical context rendered in large data sets, knowledge graphs, or unstructured sources [168,174]. AI algorithms are proficient in pattern recognition, which allows them to reveal concealed links between entities of a knowledge graph [175]. Using LLMs both in the creative and scientific writing process is currently transforming content creation and storytelling processes everywhere, while numerous issues have to be sorted out in real time [161,176]. However, we see the most disruptive use of LLMs in CH fields arise with the options of dynamic, context-driven, personalized, and real-time adjusted storytelling [164,177]. Such applications can build on obvious advantages—in contrast to applications with fixed and expert-driven story content, such as InTaVia—but until LLM applications can guarantee legitimate standards’ factuality, not only fluency [161], we see a substantial need for both types of systems to evolve.
Complementing the opportunities of AI and LLMs for data mining, knowledge communication, and storytelling in CH and DH, the field of visualization design is expecting to see seismic shifts in the near-term future [178,179]. On the one hand, the number of tools that utilize rule-based AI-approaches to support the effective and efficient mapping of data to diagrams and their design dimensions is constantly growing [180]. On the other hand, it is becoming apparent how LLM technologies will simplify, assist, and (semi-)automate the creation process of narrative visualizations across the whole workflow cycle. This includes practices of data collection, data processing, and insight extraction, the construction and structuring of narratives, the design and authoring of visualizations, together with their presentation and interpretation [181,182]. However, when it comes to the mining and visualization of CH and DH data, it seems particularly relevant to proactively deal with omnipresent uncertainties and a lack of sources on the data side, together with inherent hallucinatory tendencies and missing standards for cultural–historical sensitivity, methodologies, and source critiques on the tool provider side. As such, there is a growing need to ensure that emerging options to (co-)create historiographical data, stories, and visualizations will be accompanied by the development of robust strategies to ensure that the results align with standards of rigor and reliability, while being transparent on their provenance and on their expected limitations [161,183].
Extended Reality (XR), Object Presence, and the Metaverse: The utilization of mobile applications and augmented reality designs in CH settings, such as museums or heritage and archeology sites, holds great potential for more immersive and engaging story experiences [184,185,186]. In analogue exhibition settings, objects can be points of departure for storytelling, when they are augmented with digital information through smartphones and wearable technology. As such, story audiences can directly interact with real objects on site and gain from the “aura” of original artworks, which promises to enable richer, more meaningful experiences and deeper understandings of the object’s significance and history [187]. The rapid growth of XR and the Metaverse generates additional opportunities for storytelling in the CH sector. The availability of not only 3D objects, but also rich, interactive, persistent, and fully immersive environments for object and story interaction opens up deeper possibilities that still need to be researched and developed. Stories about objects or other protagonists, for instance traveling through time and space, while interacting with different people, and being involved in events can be mapped into freely scalable and explorable space–time cubes [159]. Thereby, new options for hybrid knowledge exploration and navigation and new forms of collaborative access emerge [188].
Implications for CH practice: The current state of the CH industry indicates that GLAM institutions have successfully incorporated digital databases and tools for mediation, education, and storytelling [189]. Museums, for example, are increasingly offering on-site mobile apps and interactive media experiences to enrich visitors’ knowledge and experience of their exhibits. As museums are mostly object-focused, they are primary candidates for using multi-entity storytelling methods as discussed in this article. However, a range of practical challenges needs to be addressed in order to fully exploit the existing potential. These include (1) skills, (2) data accessibility, and (3) technology: (1) Concerning skills, cultural educators and other GLAM professionals must broaden and enhance their competencies for different storytelling formats, media types, interaction modes, and data relationships [190]. Analyses of digital storytelling practices highlight the obvious impact of technology on story production, but also the omnipresent need to increase data and tool literacy [191]. (2) Concerning data accessibility, CH practitioners can rarely exploit the opportunities of multi-entity storytelling. To achieve this, increases in the accessibility, connectivity, and interoperability of cultural databases are needed—which are currently highly dispersed, incompatible, and isolated. The importance of interoperable digital platforms for the storage, processing, and visualization of CH data—and improvements to data accessibility—are also crucial for the sustainable and inclusive valorization of CH [192]. (3) Concerning available technologies, more powerful and accessible digital solutions are required for the creation of engaging DH and CH stories that accommodate various content types and user interactions [193]. Thus, the editing of dynamic stories linked to various CH and DH entities requires novel editing tools to handle whole workflows together with their conceptual and informational complexity. In this context, it will be key to refine and adapt multi-level tools such as InTaVia and to ensure their functionality beyond the maturity level of research prototypes.

6. Conclusions

Storytelling has been said to drive the development and reproduction of human cultures and knowledge since prehistoric times [194]. Spectacular changes in media and information technology—evolving at an ever-accelerating pace—have not diminished the relevance and dominance of stories as a communication form a bit, but have multiplied the ways in which cultural narratives can unfold and be reproduced, including spectacular options for their multimodal and immersive expression.
With this paper, we started from work in the field of visualization-based storytelling for biography research—and made the case for orchestrated integration efforts—to create more synoptic and integrated storytelling technologies for the DH and CH data domains. The InTaVia project realized such a platform by following five development strategies, which allowed integrating multiple data and tool dimensions, which have been separated before:
(a)
Multi-database: The platform draws together multiple types of databases (i.e., on cultural persons and objects) into a coherent knowledge graph.
(b)
Multi-protagonist: InTaVia generalizes the protagonist role to cover multiple types of entities in the CH and DH domains.
(c)
Multi-visualization: The platform covers and combines multiple visualization types, which have not been integrated by storytelling tools before.
(d)
Multi-media: The platform leverages the power of multiple kinds of media (in lieu of visualizations, also text, images, audio, video, 3D models, HTML content, etc.).
(e)
Multi-practice: Finally, the platform follows a holistic, workflow-oriented design, supporting multiple types of cultural data practices from information creation to analysis and communication.
We consider such synoptic and integrative design approaches and resulting tools to be of high relevance for the CH and DH domains, but also for adjacent data and application fields, including education, journalism, and (inter-)cultural knowledge communication. They provide scholars and practitioners of these professions with powerful all-round tools, connect them to open data collections, and cover all relevant processing practices, while being engineered for the efficient creation of highly context-specific results.
With current AI developments shifting the ground under most DH, CH, and visualization technologies in real time, projections for the relevance of all sorts of methods are well advised to proceed cautiously and remain deliberately open for disruptive story turns. However, given the known limitations of generative AI, it stands to reason that expert-driven storytelling technologies such as InTaVia will play an important and indispensable role for trustworthy cultural knowledge communication until further notice.

Author Contributions

Conceptualization: E.M., K.S. and F.W.; data curation: J.K., S.B. and J.L.; formal analysis: E.M.; funding acquisition: E.M. and F.W.; investigation: J.K., E.M., S.B., J.L. and F.W.; methodology: J.K., E.M., K.S., S.B., J.L. and F.W.; project administration: E.M. and F.W.; resources: K.S.; software: J.K., S.B. and J.L.; supervision: E.M., K.S. and F.W.; validation: E.M. and F.W.; visualization: J.K., E.M., S.B., J.L. and F.W.; writing—original draft: J.K., E.M., K.S., S.B., J.L. and F.W.; writing—review and editing: J.K., E.M., S.B. and F.W. All authors have read and agreed to the published version of the manuscript.

Funding

This work was funded by the H2020 research and innovation action InTaVia, project No. 101004825.

Institutional Review Board Statement

Not applicable.

Informed Consent Statement

Not applicable.

Data Availability Statement

The data and program code are available on InTaVia’s GitHub account (https://github.com/InTaVia (accessed on 15 April 2024)). The InTaVia prototype is available via https://intavia.acdh-dev.oeaw.ac.at (accessed on 15 April 2024). There, the Storytelling Suite is available under https://intavia.acdh-dev.oeaw.ac.at/storycreator (accessed on 15 April 2024). The stories can be consumed responsively via https://intavia.fluxguide.com/fluxguide/public/content/fluxguide/exhibitions/1/system/app/dist/index.html (accessed on 15 April 2024).

Acknowledgments

The authors want to thank the whole InTaVia consortium https://intavia.eu/about/team/ (accessed on 15 April 2024) for the ongoing splendid collaboration.

Conflicts of Interest

Author Kasra Seirafi was employed by the company Fluxguide. The remaining authors declare that the research was conducted in the absence of any commercial or financial relationships that could be construed as a potential conflict of interest. Other than that, the authors declare no conflicts of interest.

References

  1. Loriga, S. The plurality of the past: Historical time and the rediscovery of biography. In The Biographical Turn; Routledge: London, UK, 2016; pp. 47–57. [Google Scholar]
  2. Meister, D.R. The biographical turn and the case for historical biography. Hist. Compass 2018, 16, e12436. [Google Scholar] [CrossRef]
  3. Nasaw, D. Historians and Biography Introduction; Oxford Academic: Oxford, UK, 2009. [Google Scholar]
  4. Oakley, A. The social science of biographical life-writing: Some methodological and ethical issues. Int. J. Soc. Res. Methodol. 2010, 13, 425–439. [Google Scholar] [CrossRef]
  5. Waite, P.B. Invading privacies: Biography as history. Dalhous. Rev. 1990, 69, 479–495. [Google Scholar]
  6. Renders, H. Biography as a Correction to History. Gd. Fig. Hist. Lett. Arts 2017, 2017, 31–37. [Google Scholar] [CrossRef]
  7. Renders, H.; De Haan, B.; Harmsma, J. The Biographical Turn: Lives in History; Taylor & Francis: Abingdon, UK, 2016. [Google Scholar]
  8. Gosden, C.; Marshall, Y. The cultural biography of objects. World Archaeol. 1999, 31, 169–178. [Google Scholar] [CrossRef]
  9. Kopytoff, I. The cultural biography of things: Commoditization as process. Soc. Life Things Commod. Cult. Perspect. 1986, 68, 70–73. [Google Scholar]
  10. Hanney, R. One myth to rule them all and in the darkness bind them: A critical examination of Joseph Campbell’s The Hero’s Journey. Media Pract. Educ. 2024, 1–10. [Google Scholar] [CrossRef]
  11. Dal Falco, F.; Vassos, S. Museum experience design: A modern storytelling methodology. Des. J. 2017, 20, S3975–S3983. [Google Scholar] [CrossRef]
  12. Hoskins, J. Biographical Objects: How Things Tell the Stories of Peoples’ Lives; Routledge: London, UK, 2013. [Google Scholar]
  13. van der Zwaan, J.M.; van Meersbergen, M.; Fokkens, A.; Ter Braake, S.; Leemans, I.; Kuijpers, E.; Vossen, P.; Maks, I. Storyteller: Visualizing perspectives in digital humanities projects. In Proceedings of the International Workshop on Computational History and Data-Driven Humanities, Dublin, Ireland, 25 May 2016; pp. 78–90. [Google Scholar] [CrossRef]
  14. Baelo-Allué, S.; Calvo-Pascual, M. Transhumanism and Posthumanism in Twenty-First Century Narrative; Routledge: Oxfordshire, UK, 2021. [Google Scholar]
  15. Bounegru, L.; Venturini, T.; Gray, J.; Jacomy, M. Narrating networks: Exploring the affordances of networks as storytelling devices in journalism. Digit. J. 2017, 5, 699–730. [Google Scholar] [CrossRef]
  16. Boje, D.; Tourani, N. The agential materiality of storytelling. In Qualitative Methodologies in Organization Studies: Volume I: Theories and New Approaches; Palgrave Macmillan: Cham, Switzerland, 2018; pp. 113–135. [Google Scholar]
  17. Legg, E.; Sullivan, P. Storytelling as a balancing practice in the study of posthuman praxis. In Posthuman Praxis in Technical Communication; Routledge: Oxfordshire, UK, 2018; pp. 23–45. [Google Scholar]
  18. Humphries, C.; Smith, A.C. Talking objects: Towards a post-social research framework for exploring object narratives. Organization 2014, 21, 477–494. [Google Scholar] [CrossRef]
  19. Jørgensen, K.M.; Fatien, P. Gaia storytelling: Management learning as terrestrial politics. Organization, 2024; online first. [Google Scholar]
  20. ter Braake, S.; Fokkens, A.; Sluijter, R.; Declerck, T.; Wandl-Vogt, E. Biographical Data in a Digital World 2015. In Proceedings of the First Conference on Biographical Data in a Digital World 2015 (BD 2015), Amsterdam, The Netherlands, 9 April 2015; Volume 1399. [Google Scholar]
  21. ter Braake, S.; Fokkens, A.; Sluijter, R.; Arthur, P.; Wandl-Vogt, E. Biographical Data in a Digital World 2017. In Proceedings of the Second Conference on Biographical Data in a Digital World 2017 (BD 2017), Linz, Austria, 6–7 November 2017; Volume 2119. [Google Scholar]
  22. Daza, A.; Fokkens, A.; Osenova, P.; Simov, K.; Popov, A.; Arthur, P.; Declerck, T.; Sluijter, R.; ter Braake, S.; Wandl-Vogt, E. In Proceedings of the Editorial Introduction to Biographical Data in a Digital World 2019 (BD 2019), Wokshop Proceedings, Varna, Bulgaria, 5–6 September 2019.
  23. Daza, A.; Fokkens, A.; Hadden, R.; Hyvönen, E.; Koho, M.; Wandl-Vogt, E. Biographical Data in a Digital World 2022 (BD 2022) Workshop. In Proceedings of the Digital Humanities 2022, The Alliance of Digital Humanities Organizations (ADHO), Tokyo, Japan, 25 July 2022. [Google Scholar]
  24. Bruseker, G.; Carboni, N.; Guillem, A. Cultural heritage data management: The role of formal ontology and CIDOC CRM. In Heritage and Archaeology in the Digital Age: Acquisition, Curation, and Dissemination of Spatial Cultural Heritage Data; Springer: Berlin/Heidelberg, Germany, 2017; pp. 93–131. [Google Scholar]
  25. De Boer, V.; Wielemaker, J.; Van Gent, J.; Hildebrand, M.; Isaac, A.; Van Ossenbruggen, J.; Schreiber, G. Supporting linked data production for cultural heritage institutes: The amsterdam museum case study. In Proceedings of the Semantic Web: Research and Applications: 9th Extended Semantic Web Conference, ESWC 2012, Heraklion, Greece, 27–31 May 2012; Proceedings 9. pp. 733–747. [Google Scholar]
  26. Davis, E.; Heravi, B. Linked data and cultural heritage: A systematic review of participation, collaboration, and motivation. J. Comput. Cult. Herit. (JOCCH) 2021, 14, 21. [Google Scholar] [CrossRef]
  27. Zuanni, C. Object biographies in the digital age: Documentation, life-histories, and data. Int. J. Herit. Stud. 2023, 29, 695–710. [Google Scholar] [CrossRef]
  28. Kaplan, F.; Di Lenardo, I. The advent of the 4D mirror world. Urban Plan. 2020, 5, 307. [Google Scholar] [CrossRef]
  29. Jänicke, S.; Franzini, G.; Cheema, M.F.; Scheuermann, G. Visual text analysis in digital humanities. Comput. Graph. Forum 2017, 36, 226–250. [Google Scholar] [CrossRef]
  30. Arnold, T.; Tilton, L. Distant Viewing: Computational Exploration of Digital Images; MIT Press: Cambridge, MA, USA, 2023. [Google Scholar]
  31. Segel, E.; Heer, J. Narrative visualization: Telling stories with data. IEEE Trans. Vis. Comput. Graph. 2010, 16, 1139–1148. [Google Scholar] [CrossRef]
  32. Raffensperger, C. Visualizing Prosopography through Digital Humanities. Mediev. Prosopography 2019, 34, 207–220. [Google Scholar]
  33. DARIAH-DE. DARIAH-DE Geo-Browser. Available online: https://geobrowser.de.dariah.eu (accessed on 27 February 2024).
  34. Wang, K.; Li, C.; Zhou, X. Complex Network Analysis Based on Politics of Northern Song Dynasty. In Proceedings of the 2019 6th International Conference on Dependable Systems and Their Applications (DSA), Harbin, China, 3–6 January 2020; pp. 475–479. [Google Scholar]
  35. Urbinati, A.; Burdisso, E.; Mattutino, C.; Vilella, S.; Semeraro, A.; Ruffo, G.; Corti, C.; De Martino, S.; Devecchi, E.; Scarpa, E.; et al. Bridging Representation and Visualization in Prosopographic Research: A Case Study. In Proceedings of the 1st Italian Workshop on Artificial Intelligence for Cultural Heritage (AI4CH22), Co-Located with the 21st International Conference of the Italian Association for Artificial Intelligence (AIxIA 2022), Udine, Italy, 28 November 2022; pp. 80–92. [Google Scholar]
  36. Heer, J.; Boyd, D. Vizster: Visualizing online social networks. In Proceedings of the IEEE Symposium on Information Visualization, Minneapolis, MN, USA, 23–25 October 2005; pp. 32–39. [Google Scholar]
  37. Weaver, C. Multidimensional data dissection using attribute relationship graphs. In Proceedings of the 2010 IEEE Symposium on Visual Analytics Science and Technology, Salt Lake City, UT, USA, 24–29 October 2010; pp. 75–82. [Google Scholar]
  38. Novak, J.; Micheel, I.; Melenhorst, M.; Wieneke, L.; Düring, M.; Morón, J.G.; Pasini, C.; Tagliasacchi, M.; Fraternali, P. HistoGraph—A visualization tool for collaborative analysis of networks from historical social multimedia collections. In Proceedings of the 2014 18th International Conference on Information Visualisation, Paris, France, 16–18 July 2014; pp. 241–250. [Google Scholar]
  39. Klein, L.F. The image of absence: Archival silence, data visualization, and James Hemings. Am. Lit. 2013, 85, 661–688. [Google Scholar] [CrossRef]
  40. Jänicke, S.; Focht, J. Untangling the Social Network of Musicians. In Proceedings of the Book of Abstracts of DH2017; Alliance of Digital Humanities Organizations, Montreal, Canada, 8–11 August 2017. [Google Scholar]
  41. Gergaud, O.; Laouenan, M.; Wasmer, E. A Brief History of Human Time. Exploring a Database of “Notable People”; LIEPP Working Paper; Sciences Po: Paris, France, 2016; Volume 46. [Google Scholar]
  42. Leskinen, P.; Hyvönen, E.; Tuominen, J. Analyzing and Visualizing Prosopographical Linked Data Based on Biographies. In Proceedings of the Second Conference on Biographical Data in a Digital World 2017 (BD2017), CEUR Workshop Proceedings, Linz, Austria, 6–7 November 2017. [Google Scholar]
  43. Khulusi, R.; Kusnick, J.; Meinecke, C.; Gillmann, C.; Focht, J.; Jänicke, S. A Survey on Visualizations for Musical Data. Comput. Graph. Forum 2020, 39, 82–110. [Google Scholar] [CrossRef]
  44. Khulusi, R.; Billib, S.; Jänicke, S. Exploring Life in Concentration Camps through a Visual Analysis of Prisoners’ Diaries. Information 2022, 13, 54. [Google Scholar] [CrossRef]
  45. Khulusi, R.; Kusnick, J.; Focht, J.; Jänicke, S. musixplora: Visual analysis of a musicological encyclopedia. In Proceedings of the 15th International Joint Conference on Computer Vision, Imaging and Computer Graphics Theory and Applications, VISIGRAPP 2020; SCITEPRESS Digital Library: Setúbal, Portugal, 2020; pp. 76–87. [Google Scholar]
  46. Jänicke, S.; Focht, J.; Scheuermann, G. Interactive Visual Profiling of Musicians. IEEE Trans. Vis. Comput. Graph. 2016, 22, 200–209. [Google Scholar] [CrossRef]
  47. Schich, M.; Song, C.; Ahn, Y.Y.; Mirsky, A.; Martino, M.; Barabási, A.L.; Helbing, D. A network framework of cultural history. Science 2014, 345, 558–562. [Google Scholar] [CrossRef]
  48. Krstajic, M.; Bertini, E.; Keim, D. Cloudlines: Compact display of event episodes in multiple time-series. IEEE Trans. Vis. Comput. Graph. 2011, 17, 2432–2439. [Google Scholar] [CrossRef]
  49. André, P.; Wilson, M.L.; Russell, A.; Smith, D.A.; Owens, A.; Schraefel, M. Continuum: Designing timelines for hierarchies, relationships and scale. In Proceedings of the 20th Annual ACM Symposium on User Interface Software and Technology, Newport, RI, USA, 7–10 October 2007; pp. 101–110. [Google Scholar]
  50. Chen, A.T.; Martell, J.; Lach, P. Supporting discovery through contextual representation: Developing a tool for visually exploring slave narratives. In Proceedings of the 2016 Workshop on Visualization for the Digital Humanities, Co-Located with IEEE VIS 2016, San Jose, CA, USA, 7–12 May 2016. [Google Scholar]
  51. Khulusi, R.; Kusnick, J.; Focht, J.; Jänicke, S. An interactive chart of biography. In Proceedings of the 2019 IEEE Pacific Visualization Symposium (PacificVis), Bangkok, Thailand, 23–26 April 2019; pp. 257–266. [Google Scholar]
  52. Brehmer, M.; Lee, B.; Bach, B.; Riche, N.H.; Munzner, T. Timelines revisited: A design space and considerations for expressive storytelling. IEEE Trans. Vis. Comput. Graph. 2016, 23, 2151–2164. [Google Scholar] [CrossRef]
  53. Scholars’ Lab. Neatline—Plot Your Course in Space and Time. Available online: https://neatline.org/ (accessed on 17 August 2023).
  54. Jänicke, S.; Heine, C.; Scheuermann, G. Geotemco: Comparative visualization of geospatial-temporal data with clutter removal based on dynamic delaunay triangulations. In Proceedings of the Computer Vision, Imaging and Computer Graphics. Theory and Application: 7th International Joint Conference, VISIGRAPP 2012, Rome, Italy, 24–26 February 2012; pp. 160–175. [Google Scholar]
  55. Palladio. Visualize Complex Historical Data with Ease. Available online: http://hdlab.stanford.edu/palladio/ (accessed on 4 September 2021).
  56. J&J Crump. The Itinerary of King John & the Rotuli Litterarum Patentium. Available online: https://neolography.com/timelines/JohnItinerary.html (accessed on 27 February 2024).
  57. Bach, B.; Shi, C.; Heulot, N.; Madhyastha, T.; Grabowski, T.; Dragicevic, P. Time curves: Folding time to visualize patterns of temporal evolution in data. IEEE Trans. Vis. Comput. Graph. 2015, 22, 559–568. [Google Scholar] [CrossRef]
  58. Liem, J.; Kusnick, J.; Beck, S.; Windhager, F.; Mayr, E. A Workflow Approach to Visualization-Based Storytelling with Cultural Heritage Data. In Proceedings of the 2023 IEEE 7th Workshop on Visualization for the Digital Humanities (VIS4DH), Melbourne, Australia, 22 October 2023. [Google Scholar]
  59. Gershon, N.; Page, W. What Storytelling Can Do for Information Visualization. Commun. ACM 2001, 44, 31–37. [Google Scholar] [CrossRef]
  60. Bach, B.; Dragicevic, P.; Archambault, D.; Hurter, C.; Carpendale, S. A descriptive framework for temporal data visualizations based on generalized space-time cubes. In Proceedings of the Computer Graphics Forum; Wiley Online Library: Hoboken, NJ, USA, 2017; Volume 36, pp. 36–61. [Google Scholar]
  61. Windhager, F.; Mayr, E.; Schreder, G.; Smuc, M.; Federico, P.; Miksch, S. Reframing Cultural Heritage Collections in a Visualization Framework of Space-Time Cubes. In Proceedings of the HistoInformatics@DH; The Alliance of Digital Humanities Organization (ADHO): Kraków, Poland, 2016; pp. 20–24. [Google Scholar]
  62. Sun, G.; Liang, R.; Qu, H.; Wu, Y. Embedding spatio-temporal information into maps by route-zooming. IEEE Trans. Vis. Comput. Graph. 2016, 23, 1506–1519. [Google Scholar] [CrossRef]
  63. Windhager, F.; Federico, P.; Salisu, S.; Schlögl, M.; Mayr, E. A synoptic visualization framework for the multi-perspective study of biography and prosopography data. In Proceedings of the 2nd IEEE VIS Workshop on Visualization for the Digital Humanities (VIS4DH’17), Phoenix, AZ, USA, 17 October 2017; Volume 2, p. 2017. [Google Scholar]
  64. Gonçalves, T.; Afonso, A.P.; Martins, B. Cartographic visualization of human trajectory data: Overview and analysis. J. Locat. Based Serv. 2015, 9, 138–166. [Google Scholar] [CrossRef]
  65. Kusnick, J.; Jänicke, S.; Doppler, C.; Seirafi, K.; Liem, J.; Windhager, F.; Mayr, E. Report on Narrative Visualization Techniques for OPDB Data. Deliverable within the H2020 Project InTaVia. 2021. Available online: https://ec.europa.eu/research/participants/documents/downloadPublic?documentIds=080166e5e47d9524&appId=PPGMS (accessed on 15 April 2024).
  66. Riche, N.H.; Hurter, C.; Diakopoulos, N.; Carpendale, S. Data-Driven Storytelling; CRC Press: Boca Raton, FL, USA, 2018. [Google Scholar]
  67. McKenna, S.; Henry Riche, N.; Lee, B.; Boy, J.; Meyer, M. Visual Narrative Flow: Exploring Factors Shaping Data Visualization Story Reading Experiences. Comput. Graph. Forum 2017, 36, 377–387. [Google Scholar] [CrossRef]
  68. Yang, L.; Xu, X.; Lan, X.; Liu, Z.; Guo, S.; Shi, Y.; Qu, H.; Cao, N. A Design Space for Applying the Freytag’s Pyramid Structure to Data Stories. IEEE Trans. Vis. Comput. Graph. 2022, 28, 922–932. [Google Scholar] [CrossRef]
  69. Amini, F.; Henry Riche, N.; Lee, B.; Hurter, C.; Irani, P. Understanding Data Videos: Looking at Narrative Visualization through the Cinematography Lens. In Proceedings of the 33rd Annual ACM Conference on Human Factors in Computing Systems, CHI ’15; Association for Computing Machinery, Seoul, Republic of Korea, 18–23 April 2015; pp. 1459–1468. [Google Scholar] [CrossRef]
  70. Tong, C.; Roberts, R.; Borgo, R.; Walton, S.; Laramee, R.S.; Wegba, K.; Lu, A.; Wang, Y.; Qu, H.; Luo, Q.; et al. Storytelling and visualization: An extended survey. Information 2018, 9, 65. [Google Scholar] [CrossRef]
  71. Bach, B.; Kerracher, N.; Hall, K.W.; Carpendale, S.; Kennedy, J.; Henry Riche, N. Telling Stories about Dynamic Networks with Graph Comics. In Proceedings of the 2016 CHI Conference on Human Factors in Computing Systems, CHI ’16, San Jose, CA, USA, 7–12 May 2016; pp. 3670–3682. [Google Scholar] [CrossRef]
  72. Roth, R.E. Cartographic Design as Visual Storytelling: Synthesis and Review of Map-Based Narratives, Genres, and Tropes. Cartogr. J. 2021, 58, 83–114. [Google Scholar] [CrossRef]
  73. Knight Lab. StoryMap—Maps that Tell Stories. Available online: https://storymap.knightlab.com (accessed on 17 August 2023).
  74. Knight Lab. TimeMapper—Elegant Timelines and Maps Created in Seconds. Available online: http://timemapper.okfnlabs.org (accessed on 4 September 2021).
  75. Knight Lab. Timeline—Easy-to-Make, Beautiful Timelines. Available online: https://timeline.knightlab.com (accessed on 17 August 2023).
  76. Kim, N.W.; Henry Riche, N.; Bach, B.; Xu, G.A.; Brehmer, M.; Hinckley, K.; Pahud, M.; Xia, H.; McGuffin, M.; Pfister, H. DataToon: Drawing Dynamic Network Comics With Pen + Touch Interaction. In Proceedings of the CHI 2019, Association for Computing Machinery, Glasgow, UK, 4–9 May 2019; pp. 1–12. [Google Scholar]
  77. Bach, B.; Wang, Z.; Farinella, M.; Murray-Rust, D.; Henry Riche, N. Design Patterns for Data Comics. In Proceedings of the 2018 CHI Conference on Human Factors in Computing Systems, CHI ’18, Association for Computing Machinery, Montreal, QC, Canada, 21–26 April 2018; pp. 1–12. [Google Scholar] [CrossRef]
  78. Flourish. Flourish—Beautiful and Easy Data Visualization and Storytelling. Available online: https://flourish.studio/ (accessed on 4 January 2023).
  79. Knight Lab. StoryLine—Tell the Story Behind the Numbers. Available online: https://storyline.knightlab.com/ (accessed on 2 June 2023).
  80. Halloran, N. The Fallen of World War II. Available online: http://www.fallen.io/ww2/ (accessed on 7 October 2022).
  81. Nedkova, K.; Vakhitova, S.; Mizinov, L.; Zotova, A.; Trzhemetsky, G.; Mizinov, A.; Novichkov, A. (TASS). When Napoleon Ventured East. Available online: https://1812.tass.ru/en (accessed on 25 June 2023).
  82. Dance, G.; Goodridge, E. The Family Tree of Michelle Obama, the First Lady. Available online: https://archive.nytimes.com/www.nytimes.com/interactive/2009/10/08/us/politics/20091008-obama-family-tree.html (accessed on 27 February 2024).
  83. Beytía, P.; Schobin, J. Networked Pantheon: A Relational Database of Globally Famous People. Res. Data J. Humanit. Soc. Sci. 2018, 5, 50–65. [Google Scholar] [CrossRef]
  84. Hische, J.; Maschmeyer, R. Diary of a Food Tracker. Available online: http://jessandruss.us (accessed on 27 February 2024).
  85. Anne Frank House. Anne Frank: The Timeline. Available online: https://www.annefrank.org/en/anne-frank/the-timeline/ (accessed on 27 February 2024).
  86. Kumar, V. The Travels of Marco Polo|Narrative Cartography. Available online: https://www.behance.net/gallery/64983491/The-Travels-of-Marco-Polo-Narrative-Cartography (accessed on 25 June 2023).
  87. Spencer, R. Fleeing Syria for Europe: Safaa’s Fatal Journey. Available online: https://s.telegraph.co.uk/graphics/projects/safaas-journey/index.html#:~:text=Eight%2Dyear%2Dold%20Safaa%20and,to%20make%20the%20same%20journey%3F&text=The%20journey%20that%20brought%20eight,died%20was%20strange%20and%20terrible (accessed on 27 February 2024).
  88. Sun, A. Diary of a Food Tracker. Available online: https://www.nytimes.com/interactive/2015/11/17/health/wiredwell-food-diary-super-tracker.html (accessed on 27 February 2024).
  89. Klein, M.C. How Americans Die. Available online: https://www.bloomberg.com/graphics/dataview/how-americans-die/ (accessed on 27 February 2024).
  90. Insider Science. Map Shows How Humans Migrated across the Globe. Available online: https://www.youtube.com/watch?v=CJdT6QcSbQ0 (accessed on 25 June 2023).
  91. Kearn, M. The Life of Mary Kearn. Available online: https://www.tiki-toki.com/timeline/entry/67/The-Life-of-Mary-Kearns/ (accessed on 25 June 2023).
  92. Knight Lab. Whitney Houston. Available online: https://timeline.knightlab.com/examples/houston/index.html (accessed on 4 September 2021).
  93. Stefan Pullen. Patterns in the Life of Vincent van Gogh. Available online: https://vangogh.stefanpullen.com (accessed on 25 June 2023).
  94. Lupi, G. Visualizing Painters’ Lives. Available online: http://giorgialupi.com/visualizing-painters-lives (accessed on 27 February 2024).
  95. Daniels, M. Are Men Singing Higher in Pop Songs Today? Available online: https://pudding.cool/2019/08/register/ (accessed on 25 June 2023).
  96. Georgia Humanities. Southern Literary Trail. Available online: https://www.georgiahumanities.org/southern-literary-trail-story-map/ (accessed on 4 September 2021).
  97. Peura, L. Case Lake Tuusula—A Prosopographical Demo Using the Storytelling Suite. Available online: https://youtu.be/l-S7t1tlIQ0?si=-wWYjxHiuth802AO (accessed on 16 April 2024).
  98. Fluxguide. Around the Globe with Reinhold Würth—Würth Collection App. 2020. Available online: https://youtu.be/jrleGuGus5I (accessed on 15 April 2024).
  99. Mckee, G. The Map as a Search Box: Using Linked Data to Create a Geographic Discovery System. Inf. Technol. Libr. 2019, 38, 40–52. [Google Scholar] [CrossRef]
  100. Lu, S.; Akred, J. The History of Rock in 100 Sings. Available online: https://svds.com/rockandroll (accessed on 27 February 2024).
  101. Perez-Messina, I.; Gutierrez, C.; Graells-Garrido, E. Organic Visualization of Document Evolution. In Proceedings of the 23rd International Conference on Intelligent User Interfaces, IUI ’18, Tokyo, Japan, 7–11 March 2018; pp. 497–501. [Google Scholar] [CrossRef]
  102. de Prisco, R.; Lettieri, N.; Malandrino, D.; Pirozzi, D.; Zaccagnino, G.; Zaccagnino, R. Visualization of Music Plagiarism: Analysis and Evaluation. In Proceedings of the 2016 20th International Conference Information Visualisation (IV), Lisbon, Portugal, 19–22 July 2016; pp. 177–182. [Google Scholar] [CrossRef]
  103. McGhee, M. Wonky. Available online: https://pudding.cool/2023/06/groove/ (accessed on 25 June 2023).
  104. Kusnick, J.; Khulusi, R.; Focht, J.; Jänicke, S. A Timeline Metaphor for Analyzing the Relationships between Musical Instruments and Musical Pieces. In Proceedings of the VISIGRAPP (3: IVAPP), Valletta, Malta, 27–29 February 2020; pp. 240–251. [Google Scholar]
  105. Jänicke, S. Timages: Enhancing time graphs with iconographic information. In Proceedings of the Leipzig Symposium on Visualization in Applications 2018 (LEVIA’18), Leipzig, Germany, 18 October 2018. [Google Scholar]
  106. Esri. Rotterdam Buildings Built before/after the War. Available online: https://www.arcgis.com/home/webmap/viewer.html?webmap=246f13706e39405bbc4317246aed43e7&extent=4.47,51.9162,4.5206,51.9327 (accessed on 27 February 2024).
  107. Cranston, J. Mapping Paintings. Available online: https://www.mappingpaintings.org/maps (accessed on 27 February 2024).
  108. Kirsch, S. Computed Tomography as a Tool for Archiving Ethnomusicological Objects. In Computational Phonogram Archiving; Bader, R., Ed.; Springer International Publishing: Cham, Switzerland, 2019; pp. 305–319. [Google Scholar] [CrossRef]
  109. Shemek, D.; Guidazzoli, A.; Liguori, M.C.; Bellavia, G.; De Luca, D.; Verri, L.; Imboden, S. Renaissance Remix. Isabella d’Este: Virtual Studiolo. DHQ Digit. Humanit. Q. 2018, 12, 400. [Google Scholar]
  110. Zhang, X.; Blaas, J.; Botha, C.; Reischig, P.; Bravin, A.; Dik, J. Process for the 3D virtual reconstruction of a microcultural heritage artifact obtained by synchrotron radiation CT technology using open source and free software. J. Cult. Herit. 2012, 13, 221–225. [Google Scholar] [CrossRef]
  111. Arnold, D. Computer graphics and cultural heritage: From one-way inspiration to symbiosis, part 1. IEEE Comput. Graph. Appl. 2014, 34, 76–86. [Google Scholar] [CrossRef]
  112. Baracchini, C.; Callieri, M.; Corsini, M.; Dellepiane, M.; Dercks, U.; Keultjes, D.; Montani, C.; Scognamiglio, M.; Scopigno, R.; Sigismondi, R.; et al. Starting the cenobium project: The cloister of monreale (sicily) revealed. In Proceedings of the VAST 2006, Baltimore, MD, USA, 31 October–2 November 2006; pp. 100–110. [Google Scholar]
  113. Buchanan, L.; Cai, W.; Glanz, J.; Gröndahl, M.; Grothjan, E.; McCann, A.; Parshina-Kottas, Y.; Patanjali, K.; Patel, J.K.; Reinhard, S.; et al. Notre-Dame Came Far Closer to Collapsing than People Knew. This Is How It Was Saved. Available online: https://www.nytimes.com/interactive/2019/07/16/world/europe/notre-dame.html (accessed on 27 January 2023).
  114. Mused Inc. Mused. Available online: http://mused.org (accessed on 27 February 2024).
  115. Emotive. Emotive—Storytelling for Cultural Ceritage. Available online: https://emotiveproject.eu (accessed on 17 August 2023).
  116. Sketchfab. Sketchfab. Available online: http://sketchfab.com (accessed on 27 February 2024).
  117. Wong, A. The whole story, and then some: ‘digital storytelling’in evolving museum practice. In Proceedings of the MW2015: Museums and the Web, Museums and the Web LLC, Chicago, IL, USA, 8–11 April 2015. [Google Scholar]
  118. Bedford, L. Storytelling: The real work of museums. Curator Mus. J. 2001, 44, 27–34. [Google Scholar] [CrossRef]
  119. Kusnick, J. Design und Implementierung einer Anwendung zur Interaktiven Visualisierung von CT-Daten im Museumsumfeld. Master’s Thesis, Leipzig University, Leipzig, Germany, 2018. [Google Scholar]
  120. Fluxguide. Kosmos Kaffee. Available online: https://www.youtube.com/watch?v=I1_wsFFy_3U (accessed on 25 June 2023).
  121. Ciotoli, L.; Alinam, M.; Torre, I. Sail with Columbus: Navigation through Tangible and Interactive Storytelling. In Proceedings of the CHItaly 2021: 14th Biannual Conference of the Italian SIGCHI Chapter, Bolzano, Italy, 11–13 July 2021; pp. 1–6. [Google Scholar]
  122. Fluxguide Ausstellungssysteme GmbH. Virtulleum. Available online: www.virtulleum.at (accessed on 25 June 2023).
  123. Kim, N.W.; Riche, N.H.; Bach, B.; Xu, G.; Brehmer, M.; Hinckley, K.; Pahud, M.; Xia, H.; McGuffin, M.; Pfister, H. DataToon—A Flexible Data Comic Storyboarding Tool That Blends Analysis and Presentation with Pen and Touch Interactions. Available online: https://datatoon.github.io/ (accessed on 17 August 2023).
  124. Donina, D.; Fekhretdinov, T.; Vakhitova, S.; Nedkova, K.; Starkov, A.; Aghion, P.; Zotova, A.; Mizinov, A. (TASS). Mercator: It’s a Flat, Flat World! Available online: https://mercator.tass.com/ (accessed on 25 June 2023).
  125. VinePair Inc. How Wine Colonized The World. Available online: https://vinepair.com/wine-colonized-world-wine-history/#1 (accessed on 25 June 2023).
  126. Germanisches National Museum. Daily Life in the Middle Ages. Available online: https://alltagimmittelalter.gnm.de/ (accessed on 25 June 2023).
  127. Kusnick, J.; Lichtenberg, S.; Jänicke, S. Visualization-based Scrollytelling of Coupled Threats for Biodiversity, Species and Music Cultures. In Proceedings of the Workshop on Visualisation in Environmental Sciences (EnvirVis), Leipzig, Germany, 12 June 2023. [Google Scholar] [CrossRef]
  128. Smithsonian National Museum of Natural History. Objects of Wonder. Available online: https://storymaps.arcgis.com/stories/e0651067fae54280b7de1b3e919381e9 (accessed on 25 June 2023).
  129. Hiller, P.T. Visualizing the Intersection of the Personal and the Social Context–The Use of Multi-Layered Chronological Charts in Biographical Studies. Qual. Rep. 2011, 16, 1018–1033. [Google Scholar] [CrossRef]
  130. Windhager, F.; Mayr, E.; Liem, J.; Kusnick, J.; Jänicke, S.; Grebe, A. Traveling with Albrecht Dürer—A Case Study for Uncertainty-Aware Biography Visualization. In Proceedings of the Biographical Data in a Digital World 2022, Tokyo, Japan, 25 July 2022. [Google Scholar] [CrossRef]
  131. Windhager, F.; Federico, P.; Schreder, G.; Glinka, K.; Dörk, M.; Miksch, S.; Mayr, E. Visualization of Cultural Heritage Collection Data: State of the Art and Future Challenges. IEEE Trans. Vis. Comput. Graph. 2018, 25, 2311–2330. [Google Scholar] [CrossRef]
  132. Vagavolu, D.; Venigalla, A.S.M.; Chimalakonda, S. MuseumViz–Towards Visualizing Online Museum Collections. arXiv 2021, arXiv:2106.11897. [Google Scholar]
  133. Tamper, M.; Leskinen, P.; Hyvönen, E. Visualizing and analyzing networks of named entities in biographical dictionaries for digital humanities research. In Proceedings of the International Conference on Computational Linguistics and Intelligent Text Processing, La Rochelle, France, 7–13 April 2019; pp. 199–214. [Google Scholar]
  134. Betti, A.; Castermans, T.; Speckmann, B.; Van Den Berg, H.; Verbeek, K. GlamMapping trove. In Proceedings of the VALA 2016, Melbourne, Australia, 9–11 February 2016. [Google Scholar]
  135. The Museum of Modern Art. Object: Photo. Available online: https://www.moma.org/interactives/objectphoto/#map (accessed on 27 February 2024).
  136. Hemma, E.; Andrea, D.; Eva, M. “Wer Heilt hat Recht”: Ein Ausflug in die Salzburger Regionalmuseen auf den Spuren der Medizingeschichte. Available online: https://www.salzburgerregionalmuseen.at (accessed on 6 June 2023).
  137. Schwandt, S. Geschichte visualisieren: Digitale Praktiken in der Geschichtswissenschaft als Praktiken der Wissenschaftsreflexion. In Digital History. Konzepte, Methoden und Kritiken Digitaler Geschichtswissenschaft; De Gruyter Oldenbourg: Berlin, Germany, 2022. [Google Scholar]
  138. Glinka, K.; Pietsch, C.; Dörk, M. Past Visions and Reconciling Views: Visualizing Time, Texture and Themes in Cultural Collections. DHQ Digit. Humanit. Q. 2017, 11, 290. [Google Scholar]
  139. Mayr, E.; Windhager, F.; Liem, J.; Beck, S.; Koch, S.; Kusnick, J.; Jänicke, S. The multiple faces of cultural heritage: Towards an integrated visualization platform for tangible and intangible cultural assets. In Proceedings of the 2022 IEEE 7th Workshop on Visualization for the Digital Humanities (VIS4DH), Oklahoma City, OK, USA, 16 October 2022; pp. 13–18. [Google Scholar]
  140. Ebel, C.; Tuominen, J.; Schlögl, M.; Joonas, K.; Windhager, F. InTaVia Data Model (IDM-RDF). Deliverable within the H2020 Project InTaVia. 2021. Available online: https://ec.europa.eu/research/participants/documents/downloadPublic?documentIds=080166e5e67fcfb6&appId=PPGMS (accessed on 15 April 2024).
  141. CIDOC CRM Special Interest Group. Definition of the CIDOC Conceptual Reference Model; Technical Report; ICOM: Paris, France, 2021. [Google Scholar]
  142. Rokotyan, N.; Stukova, O. (Cosmograph) Cosmograph: GPU-Accelerated Force Graph Layout and Rendering. 2022. Available online: https://cosmograph.app/ (accessed on 15 April 2024).
  143. Grebe, A. Dürer. Die Geschichte Seines Ruhms; Imhof Verlag: Petersberg, Germany, 2013. [Google Scholar]
  144. Grebe, A. Dürer. Künstler, Werk und Zeit; WBG Academic: Darmstadt, Germany, 2013. [Google Scholar]
  145. Grebe, A.; Großmann, G.U. Albrecht Dürer. Niederländische Reise. “Tagebuch” und Kommentar; Imhof Verlag: Petersberg, Germany, 2021. [Google Scholar]
  146. Karner, H. Die Wiener Hofburg 1521—1705. Baugeschichte, Funktion und Etablierung als Kaiserresidenz; Verlag der ÖAW: Wien, Austria, 2014. [Google Scholar]
  147. Lorenz, H.; Mader-Kratky, A. Die Wiener Hofburg 1705—1835. Die Kaiserliche Residenz vom Barock bis zum Klassizismus; Verlag der ÖAW: Wien, Austria, 2016. [Google Scholar]
  148. Schwarz, M. Die Wiener Hofburg im Mittelalter. Von der Kastellburg bis zu den Anfängen der Kaiserresidenz; Verlag der ÖAW: Wien, Austria, 2015. [Google Scholar]
  149. Telesko, W. Die Wiener Hofburg 1835—1918. Der Ausbau der Residenz vom Vormärz bis zum Ende des, Kaiserforums; Verlag der ÖAW: Wien, Austria, 2012. [Google Scholar]
  150. Welzig, M. Die Wiener Hofburg seit 1918. Von der Residenz zum Museumsquartier; Verlag der ÖAW: Wien, Austria, 2018. [Google Scholar]
  151. Kurdiovsky, R.; Buchinger, G.; Holzschuh-Hofer, R.; Jeitler, M.; Karner, H.; Mader-Kratky, A.; Telesko, W. Legitimacy through History and Architecture. The Vienna Hofburg as Dynastic Hub and Seat of Government between Tradition and Innovation. Court. Hist. 2015, 20, 109–136. [Google Scholar] [CrossRef]
  152. Zhi, Q.; Ottley, A.; Metoyer, R. Linking and layout: Exploring the integration of text and visualization in storytelling. Comput. Graph. Forum 2019, 38, 675–685. [Google Scholar] [CrossRef]
  153. Latif, S.; Chen, S.; Beck, F. A Deeper Understanding of Visualization-Text Interplay in Geographic Data-driven Stories. Comput. Graph. Forum 2021, 40, 311–322. [Google Scholar] [CrossRef]
  154. Windhager, F.; Mayr, E. Mental Models and Visualization. In Visualization Psychology; Springer: Berlin/Heidelberg, Germany, 2023; pp. 65–83. [Google Scholar]
  155. Mayr, E.; Kusnick, J.; Liem, J.; Passecker, M.; Kaiser, M. Report on Usability of Narrative Visualizations; Technical Report; H2020 Project InTaVia; The European Commission: Brussels, Belgium, 2023. [Google Scholar]
  156. Latour, B. The Berlin Key or How to do Words with Things 1. In Matter, Materiality and Modern Culture; Routledge: London, UK, 2012; pp. 10–21. [Google Scholar]
  157. Walter, R.L.; Berezin, S.; Teredesai, A. Chronozoom: Travel through time for education, exploration, and information technology research. In Proceedings of the 2nd Annual Conference on Research in Information Technology, Orlando, FL, USA, 10–12 October 2013; pp. 31–36. [Google Scholar]
  158. Stauber, M. Histography.io. Available online: http://histography.io (accessed on 27 February 2024).
  159. Windhager, F.; Salisu, S.; Liem, J.; Mayr, E. The Knowledge Graph as a Data Sculpture: Visualising Arts and Humanities Data with Maps, Graphs, and Sets over Time. In Geographical Research in the Digital Humanities; Bielefeld University Press: Bielefeld, Germany, 2024; pp. 113–134. [Google Scholar] [CrossRef]
  160. Francois, P.; Manning, J.; Whitehouse, H.; Brennan, R.; Currie, T.; Feeney, K.; Turchin, P. A macroscope for global history-Seshat global history databank: A methodological overview. Digit. Humanit. Q. 2016, 10.4, 272. [Google Scholar]
  161. Lozić, E.; Štular, B. Fluent but not factual: A comparative analysis of chatgpt and other ai chatbots’ proficiency and originality in scientific writing for humanities. Future Internet 2023, 15, 336. [Google Scholar] [CrossRef]
  162. Betti, A.; Van den Berg, H. Modelling the history of ideas. Br. J. Hist. Philos. 2014, 22, 812–835. [Google Scholar] [CrossRef]
  163. Fontanella, F.; Colace, F.; Molinara, M.; Di Freca, A.S.; Stanco, F. Pattern recognition and artificial intelligence techniques for cultural heritage. Pattern Recognit. Lett. 2020, 138, 23–29. [Google Scholar] [CrossRef]
  164. Trichopoulos, G. Large language models for cultural heritage. In Proceedings of the 2nd International Conference of the ACM Greek SIGCHI Chapter, Athens, Greece, 27–28 September 2023; pp. 1–5. [Google Scholar]
  165. Liu, Y.; Lin, H.W. Construction of interpretation and presentation system of cultural heritage site: An analysis of the old city, zuoying. Heritage 2021, 4, 316–332. [Google Scholar] [CrossRef]
  166. Colavizza, G.; Blanke, T.; Jeurgens, C.; Noordegraaf, J. Archives and AI: An overview of current debates and future perspectives. ACM J. Comput. Cult. Herit. (JOCCH) 2021, 15, 4. [Google Scholar] [CrossRef]
  167. Schlögl, M.; Kesäniemi, J.; Tuominen, J.; Boer, V.; Sugimoto, G.; Ebel, C. Dos and Don’ts of Building a Pan-European Biographical Knowledge Graph: Statistical Analysis of the InTaVia-Platform. In Proceedings of the Digital Humanities in the Nordic and Baltic Countries, DHNB 2023, Online, 8–10 March 2023; p. 106. [Google Scholar] [CrossRef]
  168. Rantala, H.; Hyvönen, E.; Tuominen, J. Finding and explaining relations in a biographical knowledge graph based on life events: Case BiographySampo. In Proceedings of the CEUR Workshop Proceedings; RWTH Aachen University: Aachen, Germany, 2023; Volume 3443. [Google Scholar]
  169. Daza Arévalo, J.A. Generating Structured Data from Wikipedia Biographies: There’s History in All Men’s Lives, ZRC SAZU, Ljubljana, Slovenia, 26 September 2023. [CrossRef]
  170. Kansteiner, W. Digital doping for historians: Can history, memory, and historical theory be rendered artificially intelligent? Hist. Theory 2022, 61, 119–133. [Google Scholar] [CrossRef]
  171. Leme Lopes, A. Artificial history? Inquiring ChatGPT on historiography. Rethink. Hist. 2023, 27, 709–749. [Google Scholar] [CrossRef]
  172. Schetinger, V.; Di Bartolomeo, S.; de Lima, E.S.; Meinecke, C.; Rosa, R. n Walks in the Fictional Woods. arXiv 2023, arXiv:2308.06266. [Google Scholar]
  173. Baptiste, B.; Armand, C.; Henriot, C. HistText: An Application for leveraging large-scale historical textbases. J. Data Min. Digit. Humanit. 2023, 2023, 11756. [Google Scholar] [CrossRef]
  174. Garcia, G.G.; Weilbach, C. If the Sources Could Talk: Evaluating Large Language Models for Research Assistance in History. arXiv 2023, arXiv:2310.10808. [Google Scholar]
  175. Hyvönen, E. Using the Semantic Web in digital humanities: Shift from data publishing to data-analysis and serendipitous knowledge discovery. Semant. Web 2020, 11, 187–193. [Google Scholar] [CrossRef]
  176. Yuan, A.; Coenen, A.; Reif, E.; Ippolito, D. Wordcraft: Story writing with large language models. In Proceedings of the 27th International Conference on Intelligent User Interfaces, Helsinki, Finland, 21–25 March 2022; pp. 841–852. [Google Scholar]
  177. Trichopoulos, G.; Konstantakis, M.; Caridakis, G.; Katifori, A.; Koukouli, M. Crafting a Museum Guide Using ChatGPT4. Big Data Cogn. Comput. 2023, 7, 148. [Google Scholar] [CrossRef]
  178. Tian, Y.; Cui, W.; Deng, D.; Yi, X.; Yang, Y.; Zhang, H.; Wu, Y. Chartgpt: Leveraging llms to generate charts from abstract natural language. IEEE Trans. Vis. Comput. Graph. 2024. [Google Scholar] [CrossRef]
  179. Shen, L.; Shen, E.; Luo, Y.; Yang, X.; Hu, X.; Zhang, X.; Tai, Z.; Wang, J. Towards natural language interfaces for data visualization: A survey. IEEE Trans. Vis. Comput. Graph. 2022, 29, 3121–3144. [Google Scholar] [CrossRef]
  180. Wu, A.; Wang, Y.; Shu, X.; Moritz, D.; Cui, W.; Zhang, H.; Zhang, D.; Qu, H. Ai4vis: Survey on artificial intelligence approaches for data visualization. IEEE Trans. Vis. Comput. Graph. 2021, 28, 5049–5070. [Google Scholar] [CrossRef]
  181. Bartalesi, V.; Coro, G.; Lenzi, E.; Pagano, P.; Pratelli, N. From unstructured texts to semantic story maps. Int. J. Digit. Earth 2023, 16, 234–250. [Google Scholar] [CrossRef]
  182. He, Y.; Cao, S.; Shi, Y.; Chen, Q.; Xu, K.; Cao, N. Leveraging Large Models for Crafting Narrative Visualization: A Survey. arXiv 2024, arXiv:2401.14010. [Google Scholar]
  183. Spennemann, D.H. ChatGPT and the generation of digitally born “knowledge”: How does a generative AI language model interpret cultural heritage values? Knowledge 2023, 3, 480–512. [Google Scholar] [CrossRef]
  184. Ossmann, J.; Seirafi, K.; Doppler, C. Four Ways to Experience Augmented Reality at Museums. Methis Stud. Hum. Est. 2021, 22, 244–259. [Google Scholar] [CrossRef]
  185. Clarizia, F.; Colace, F.; De Santo, M.; Lorusso, A.; Marongiu, F.; Santaniello, D. Augmented Reality and Gamification technics for visit enhancement in archaeological parks. In Proceedings of the 2022 IEEE 2nd IoT Vertical and Topical Summit for Tourism (IoTT), Catania, Italy, 20–23 September 2022; pp. 1–4. [Google Scholar]
  186. Okanovic, V.; Ivkovic-Kihic, I.; Boskovic, D.; Mijatovic, B.; Prazina, I.; Skaljo, E.; Rizvic, S. Interaction in extended reality applications for cultural heritage. Appl. Sci. 2022, 12, 1241. [Google Scholar] [CrossRef]
  187. Rogers, K.; Hinrichs, U.; Quigley, A. It doesn’t compare to being there: In-situ vs. remote exploration of museum collections. In Proceedings of the The Search Is Over! Exploring Cultural Collections with Visualization, London, UK, 11–12 September 2014. [Google Scholar]
  188. Lee, J.K. Digital history in the history/social studies classroom. Hist. Teach. 2002, 35, 503–517. [Google Scholar] [CrossRef]
  189. Lewi, H.; Smith, W.; Vom Lehn, D.; Cooke, S. The Routledge International Handbook of New Digital Practices in Galleries, Libraries, Archives, Museums and Heritage Sites; Routledge Milton: Abingdon, UK, 2020. [Google Scholar]
  190. Sani, N.b.A.; Abet, M.; Khalid, N.K.B. Enhancing Undergraduate Student’s Understanding of Cultural Heritage Studies Through Digital Storytelling Software. Malays. J. Soc. Sci. Humanit. (MJSSH) 2022, 7, e001362. [Google Scholar]
  191. De Fina, A. Storytelling and audience reactions in social media. Lang. Soc. 2016, 45, 473–498. [Google Scholar] [CrossRef]
  192. Longo, D.; Boeri, A.; Turillazzi, B.; Orlandi, S. Cultural heritage and interoperable open platforms: Strategies for knowledge, accessibility, enhancement and networking. WIT Trans. Ecol. Environ. 2020, 241, 371–382. [Google Scholar]
  193. Rizvic, S.; Djapo, N.; Alispahic, F.; Hadzihalilovic, B.; Cengic, F.F.; Imamovic, A.; Okanovic, V.; Boskovic, D. Guidelines for interactive digital storytelling presentations of cultural heritage. In Proceedings of the 2017 9th International Conference on Virtual Worlds and Games for Serious Applications (VS-Games), Athens, Greece, 6–8 September 2017; pp. 253–259. [Google Scholar]
  194. Abbott, H.P. The evolutionary origins of the storied mind: Modeling the prehistory of narrative consciousness and its discontents. Narrative 2000, 8, 247–256. [Google Scholar]
Figure 1. Guiding research questions (ae) for visualization-based storytelling in CH and DH, with a focus on integrating multiple data, media, and practices, which have been mostly separated so far.
Informatics 11 00026 g001
Figure 2. Overview of visualization techniques, including narrative visualization designs (center and right), supporting the analysis and communication of biographical data, whether from persons or things (left).
Informatics 11 00026 g002
Figure 3. Architecture of the InTaVia platform, supporting a variety of cultural heritage data practices with visualization-based interfaces, including the activities of searching, creating, curating, analyzing, and communicating for a variety of user groups.
Informatics 11 00026 g003
Figure 4. The InTaVia Knowledge Graph contains nodes for historical actors, cultural objects, institutions, and places—with a focus on the modern era from 1800 onward. (a) The InTaVia Knowledge Graph with actors in dark and objects in light green, generated with Cosmograph [142]. (b) The number of entities by type (top) and the temporal distribution of biographical events (bottom) in the InTaVia Knowledge Graph.
Informatics 11 00026 g004
Figure 5. Main parts of the Story Creator interface, zoomed in on the biography of Albrecht Dürer: (a) The data panel on the left lists the entities in the collection; (b) the editor in the center allows creating slides with a combination of visualization and multimedia content; (c) the story flow component on the right allows managing the sequence of slides.
Informatics 11 00026 g005
Figure 6. Overview of the story of Albrecht Dürer’s life.
Informatics 11 00026 g006
Figure 7. Overview of the story of Cellini’s Salt Cellar reporting on its trajectory and theft, but also offering insights into its creator’s life.
Informatics 11 00026 g007
Figure 8. Overview of the story of the Tuusula lake community, shedding light on the historical development of a close knit artist community settling around a Finish lake.
Informatics 11 00026 g008
Figure 9. Overview of the story of the Hofburg castle in Vienna, Austria, utilizing 3D renderings of historical stages of the castle and a further interactive 3D model plus augmented reality experiment.
Informatics 11 00026 g009
Figure 10. Possible scales for multiple types of visualizations in the Visual Analytics Studio: (a) Albrecht Dürer with only donut charts in the timeline as a form of visual aggregation; (b) artists from the network around Lake Tuusula in Finland with a bee swarm depiction in the timeline and map to minimize overlap; (c) larger group of 200 cultural heritage actors with a relation to Berlin, Germany, with a distant view of the lifetimes in the timeline and donut charts on the map.
Informatics 11 00026 g010
Disclaimer/Publisher’s Note: The statements, opinions and data contained in all publications are solely those of the individual author(s) and contributor(s) and not of MDPI and/or the editor(s). MDPI and/or the editor(s) disclaim responsibility for any injury to people or property resulting from any ideas, methods, instructions or products referred to in the content.

