Abstract
The purpose is to study the new survival trends for states in a multipolar world, determine the successfulness of adaptation to the digitalization of different growth poles, and develop the applied recommendations to improve the practice of adaptation to the risks of digitalization of these growth poles. Design/methodology/approach. The authors use the methods of economic statistics: variation analysis, trend analysis, correlation analysis, and regression analysis. Findings. The commonness of strategies of adaptation to the risks of digitalization for different poles of the world economy is substantiated, and two universal mechanisms—talent management and development of science—are found. The originality of this research is due to the consideration of digitalization from a new view—from the positions of setting states at the brink of survival due to the aggressive digital competition and high complexity of ensuring global competition in a quickly changing digital landscape. The uniqueness of this research is due to taking into account the specific features in a multipolar world. The practical implementation of the offered recommendations opens future perspectives for more successful survival trends in a multipolar world and the improvement of their adaptation to risks digitalization by 69.91% in G7 countries (on average) and by 88.40% in BRICS countries (on average).
1. Introduction
At the modern stage, the world development of economic relations is characterized by two key features. The first one is connected to digitalization. The digital technological mode determines the essence of most economic processes, due to which it is possible to speak of the formation of the global digital economy (Pinheiro et al. 2019).
The second one is multipolarity. It is worth noting that growth poles could be not only developed countries but also developing countries (Roy 2019). Due to the emergence of a new growth pole in developing countries in the conditions of the digital economy, for the first time in the modern history of the world economy, we could state that its multipolarity stimulates not the increase but the reduction of countries’ inequalities (Quaye and Mensah 2019) and thus contributes to the implementation of the Sustainable Development Goals (in particular SDG 10, UN 2021).
These features determine the important scientific and practical problem—the digital economy is constantly developing under the influence of technological progress, due to which states are at the brink of survival, leading a tough global competition (Townsend et al. 2019). On the one hand, it is for the first time in the history of world development that digitalization has created an opportunity to provide global competition between states regardless of their natural production factors and geographical location. At the same time, new (digital) markets are not yet occupied by developed countries and are not monopolized. This allows developing countries to reach a high level of global competition (Garzoni et al. 2020).
However, on the other hand, to implement this new opportunity, developing countries have to refuse the traditional conventional development according to the experience of developed countries and come up with their strategy of ensuring digital competitiveness (Liu et al. 2020). The hypothesis that is offered by the authors of this paper is as follows: despite the multipolarity of the modern world economy, the commonness of strategies of adaptation of developed (one pole) and developing (another pole) counties to digitalization remains, which hinders the reduction of countries’ inequalities and overcoming the disproportions in the world economic system (in particular, implementing SDG 10, UN 2021).
The goal of this research consists in studying the new survival trends for states in a multipolar world, finding the successfulness level of adaptation to the digitalization of different growth poles of the modern world economy on the example of G7 (developed countries) and BRICS (developing countries), showing future perspectives, and developing the applied recommendations to improve the practice of adaptation to the risks of digitalization these growth poles of the world economy given their specifics.
The originality of this paper is as follows: studying digitalization from a new perspective—not from the positions of creating the leading opportunities for the world development but from the positions of putting states on the edge of survival due to the aggressive digital competition and increased complexity of provision of the global competition in a digital landscape, which is changing very quickly. The new perspective allows studying the essence and specific features of adaptation to the risks of digitalization as a survival strategy for modern states.
The uniqueness of this research is due to considering the specific features of a multipolar world. This research is performed by the example of two completely different poles of the modern world economy: developed countries (by the example of G7) and developing countries (by the example of BRICS). This allows comparing their experience of adaptation to the risks of digitalization and developing different recommendations for improving the survival practices in a digital multipolar world.
This goal defines the logic and structure of the research, which is as follows: introduction; literature review with the content analysis of the existing publications on the issues of current tendencies and basic survival rules for states in a multipolar world, the issues of digitalization as a new environment for survival of states, gap analysis, and determination of the research field; description of research design and method; results, which firstly include determination of the survival trends of states in a multipolar world under the influence of digitalization and secondly include identification of the mechanisms of states’ adaptation к digitalization в multipolar world; discussion, which contains the conclusion as to which level the survival trends for states allow greatest use of the perspective mechanism of states’ adaptation to the risks of digitalization in a multipolar world, and substantiation of the future prospects and development of the applied recommendations to improve the practice of adaptation to the risks of digitalization of growth poles of the world economy (G7 and BRICS) in view of their specifics; and finally, conclusions.
2. Literature Review
The theoretical basis of this study are current tendencies and the basic survival rules for states in a multipolar world. The specifics and foundations of the modern stage of survival of states, connected to the multipolar character of the world, are given in the works of Apurv and Uzma (2020), Banday and Aneja (2019), Erro-Garcés and Aranaz-Núñez (2020), Raghutla and Chittedi (2020), Sreesing (2018) and Tripathi and Kaur (2020).
Thus, the multipolarity of the world is a generally recognized phenomenon of the modern global economic system. Two poles of the world economy are stated in the existing scientific literature. The first pole is the leading developed countries (G7—the Group of Seven, Major Advanced Economies). The second pole is intensely developing countries—BRICS.
The specific features of the modern stage of state survival—which are related to the world’s multipolarity—are, first, globalization, which is subject to constant changes (tendencies for a transition from open trade in the stable conditions to protectionism during a crisis; from the world sectorial integration to the regional integration and disintegration).
Second is competition, which is set on globalization and integration, and takes various forms. In recent years (starting 2010–2012), a popular tendency has been a digital competition—the race of leading technologies and the competition between countries in high-tech markets. The survival of states depends on their digital competitiveness.
This research also draws on the scientific concept of digitalization as a new environment for survival of states. Digital economy—as a new environment for survival of states—is considered and studied in detail in the works of Abramova et al. (2019), Chaldaeva (2019), Guseva et al. (2019), Inshakova and Litvinov (2020), Karanina (2020), Popkova et al. (2021), Popkova and Sergi (2020) and Smetanina (2020).
Thus, the digital economy is a new environment for the survival of states. Its specifics consist of dynamism (it is subject to constant changes). Digitalization is a modern trend, which is oriented at the strategic (long-term) perspective. This complicates the survival of states, which have to adapt not to a stable environment but a dynamic one, thus looking at the future, not at the present. This implies rapid development and constant implementation of digital innovations as well as the adoption of a high level of risk and effective risk management.
As is seen from the performed literature review, multipolarity is a generally acknowledged and scientifically proven characteristic of the modern world economy. Digitalization—as a new environment for the survival of states—is elaborated in the existing literature. Researchers note a high complexity of adaptation to the risks of digitalization for the survival of states in a multipolar world. However, there is uncertainty (the first gap) as to the essence of the process of adaptation to the risks of digitalization, due to which the basic features of the survival of states in a modern (digital) multipolar world are unclear.
In addition to this (the second gap), the specifics of adaptation to the digitalization of different poles of the world economy have been poorly studied. Similarly, the new survival trends for states in a digital multipolar world have not been sufficiently elaborated (the third gap), which does not allow determining the mechanisms that ensure the adaptation to the risks of digitalization and the level of the use of these mechanisms in different growth poles of the world economy in recent years.
Another gap is the lack of knowledge of the risks of digitalization. Certain aspects related to the risks of digitalization or indirectly affecting them are highlighted in the works of such authors as Balzli (2021), Foglia et al. (2021) and Iten et al. (2021).
This paper aims to fill these gaps. The research field of this paper covers the practical experience of adaptation to the risks of digitalization in different poles of the modern world economy (by the example of G7 and BRICS countries), identification of the new survival trends for states in a multipolar world in recent years (2017–2020), evaluation of the current tendencies’ correspondence to the basic features of states’ survival in a digital multipolar world and successfulness of using the most effective mechanisms of provision of digital competitiveness in different growth poles of the world economy, an overview of the perspectives of future adaptation to the risks of digitalization, and development of recommendations to improve the practice of managing the states’ survival in a multipolar world.
3. Research Design and Method
To obtain the most solid and correct proofs, the offered hypothesis was tested with the help of a complex of reliable methods of economic statistics. The survival trends for states in a multipolar world under the influence of digitalization were determined with the help of trend analysis, which allows finding the change of the factors and results of digital competitiveness of G7 and BRICS countries, and with the help of variation analysis, which allows finding the homogeneity of the samples of G7 and BRICS countries and, based on this, forming an idea on the scale of the tendencies’ coverage of the growth poles of the modern world economy.
We evaluated the change of the indicators of digital competitiveness in 2020 (the latest report from IMD) as compared to 2017, when IMD issued the first World Digital Ranking. Additionally, arithmetic means and variations coefficients were calculated in 2015–2020, which makes possible an in-depth study of the differences between time periods. The research was performed based on aggregate indicators, which include the following:
- −
- Risks of the “knowledge economy” (knowledge): talent management (creation, attraction, and development), personnel training (training and education), and development of science (scientific concentration);
- −
- Infrastructural risks (technology): institutional infrastructure (regulatory framework), financial infrastructure (capital), and ICT infrastructure (technological framework).
The results of adaptation to the risks of digitalization (future readiness), that is, risk management: adaptation of society (adaptive attitudes), an adaptation of business (business agility), and adaptation of state (IT integration).
The dynamics of changes in the arithmetic mean of the given indicators was studied using the trend analysis method, which allows determining the percentage change in the values of indicators in 2020 compared to 2017. In addition, using the method of correlation analysis, the relationship of indicators was studied.
The variables in the models were chosen in this way: firstly, in order to systematically consider all the risks of digitalization and secondly, in order to clarify the causal relationship—to highlight both the risks themselves and the results of the impact of risks on the digital economy. Thirdly, to ensure comparability of data, they were taken from a common source (IMD 2021) report in order to avoid both false-positive/false-negative regression and correlation of indicators and distorted interpretation of their results. The rationale for including the selected variables in the model of this study is the basic theory, which is the System Approach. In accordance with it, it is necessary to comprehensively consider socio-economic processes. Similar specifications in the literature are given in highly cited works, such as Ivanov et al. (2019) and Timmis et al. (2016).
The statistical basis of the research is shown in Table 1, Table 2, Table 3, Table 4, Table 5 and Table 6. Since all indicators are measured in positions 1–63 (the position is a place in ranking), the higher the position, the better. Thus, the negative trend is a sign of the improvement of the indicators’ values, and the positive trend is a sign of the aggravation of their values. The values of the indicators in Table 1, Table 2, Table 3, Table 4, Table 5 and Table 6 were determined by IMD experts based on an in-depth analysis of available international statistics on 63 digital economies. Collecting data in this way guarantees its reliability.

Table 1.
Statistics of digital competitiveness of G7 and BRICS countries in 2015, position 1–63.
Table 2.
Statistics of digital competitiveness of G7 and BRICS countries in 2016, position 1–63.
Table 3.
Statistics of digital competitiveness of G7 and BRICS countries in 2017, position 1–63.
Table 4.
Statistics of digital competitiveness of G7 and BRICS countries in 2018, position 1–63.
Table 5.
Statistics of digital competitiveness of G7 and BRICS countries in 2019, position 1–63.
Table 6.
Statistics of digital competitiveness of G7 and BRICS countries in 2020, position 1–63.
The mechanisms of states’ adaptation to the risks of digitalization in a multipolar world were identified with the help of regression and correlation analysis based on the 2020 data, for which the symbols for the indicators are given in Table 2. Regression dependence of each result of adaptation to the risks of digitalization on the whole totality of risks of the “knowledge economy” and infrastructural risks was determined based on the full sample of twelve countries. This allows achieving a high precision of the evaluation. The formal research model is as follows:
A = a + b1 × TM + b2 × TE + b3 × SC + b4 × RF + b5 × CP + b6 × TF
To determine the specifics of using the determined mechanisms in each pole of the world economy, we found the correlation between results (risk management) and factors (risks) separately for G7 and BRICS countries. We determined low (0–0.1) and negative (below 0) values of correlation coefficients, which show that the specific mechanisms are not effective in this pole of the world economy. The interpretation of the results of the correlation analysis were carried out in accordance with the materials of Kantelhardt et al. (2001).The future perspectives and applied recommendations for improving the practice of adaptation to the digitalization of the growth poles of the world economy (G7 and BRICS countries) were developed by setting the best values of the most effective mechanisms of adaptation to the risks of digitalization in the regression equations (formal model of the research) given the correlation coefficients, which allow excluding the ineffective mechanisms in a certain pole of the world economy. In this case, the least squares method was used—a mathematical method based on minimizing the sum of the squares of the deviations of some functions from the desired variables.
4. Findings
4.1. Survival Trends for States in a Multipolar World under the Influence of Digitalization
To determine survival trends for states in a multipolar world under the influence of digitalization, let us analyze the change in digital competitiveness of countries of the G7 and BRICS in 2015–2020. For this (based on data from Table 1, Table 2, Table 3, Table 4, Table 5 and Table 6), in Table 7, the arithmetic means and coefficients of variation are calculated for each pole of the world economy and for each considered time period.
Table 7.
Change in digital competitiveness of G7 and BRICS countries in 2015–2020.
Data from Table 7 indicate dynamic changes in the values of indicators and their variations at the growth poles of the world economy throughout the entire period under consideration. To clarify the results obtained, we conducted an in-depth analysis in the dynamics of 2017–2020. Survival trends for G7 states under the influence of digitalization are determined in Figure 1 with the help of the trend analysis of the change of the digital competitiveness indicators for 2020 (from Table 2) as compared to their values in 2017 (from Table 1).
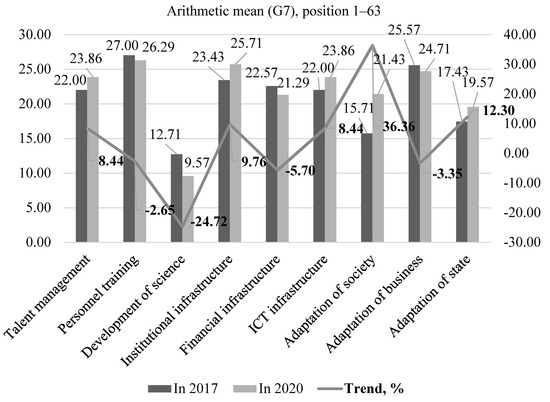
Figure 1.
Survival trends for G7 states under the influence of digitalization. Source: Calculated and created by the authors.
As shown in Figure 1, the level of adaptation of business in G7 countries grew by 3.35% (by the average value of this indicator, the states went up from 25.57th position to 24.71st position). An improvement was observed among the following factors of adaptation to the risks of digitalization:
- −
- Personnel training by 2.65% (by the average value of this indicator, the states went up from 27th position to 26.29th position);
- −
- Development of science by 24.72% (by the average value of this indicator, the states went up from 12.71st position to 9.57th position);
- −
- Financial infrastructure by 5.70% (by the average value of this indicator, the states went up from 22.57th position to 21.29th position).
To determine the level of coverage of G7 countries by these tendencies, let us use the results of variation analysis, which reflects the homogeneity of the sample of these countries in 2017 and 2020 (Figure 2).
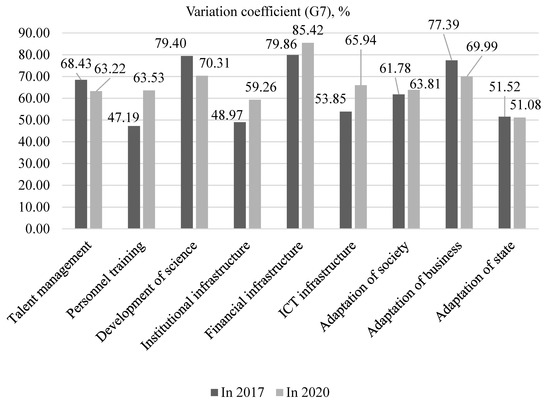
Figure 2.
Analysis of variation of digital competitiveness of G7 countries. Source: Calculated and created by the authors.
As shown in Figure 2, G7 countries have a high variation (69.99%) of adaptation of business to digitalization, which is reduced compared to 2017 (77.39%). Variation of the following factors of adaptation to the risks of digitalization is also high:
- −
- Variation of personnel training in 2020 equaled 63.53%, having grown significantly as compared to 2017 (47.19%);
- −
- Variation of development of science in 2020 equaled 70.31%, having decreased significantly as compared to 2017 (79.40%);
- −
- Variation of financial infrastructure in 2020 equaled 85.42%, having decreased significantly as compared to 2017 (79.86%).
Survival trends for BRICS countries under the influence of digitalization are determined in Figure 3 with the help of the trend analysis of the change of the digital competitiveness indicators for 2020 (from Table 2) as compared to their values in 2017 (from Table 3).
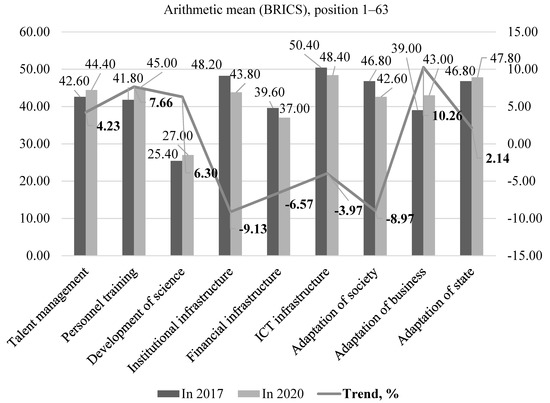
Figure 3.
Survival trends for BRICS countries under the influence of digitalization. Source: Calculated and created by the authors.
As shown in Figure 3, the level of society’s adaptation to the risks of digitalization in BRICS countries grew by 8.97% (by the average value of this indicator, the states went up from 46.80th position to 42.60th position). Among the factors of adaptation to the risks of digitalization, the following improvement of primarily infrastructural factors took place:
- −
- Institutional infrastructure by 9.13% (by the average value of this indicator, the states went up from 48.20th position to 43.80th position);
- −
- Financial infrastructure by 6.57% (by the average value of this indicator, the states went up from 39.60th position to 37th position);
- −
- ICT infrastructure by 3.97% (by the average value of this indicator, the states went up from 50.40th position to 48.40th position).
To determine the level of coverage of BRICS countries by the determining tendencies, let us use the results of the variation analysis, which reflects the homogeneity of the sample of countries in 2017 and 2020 (Figure 4).
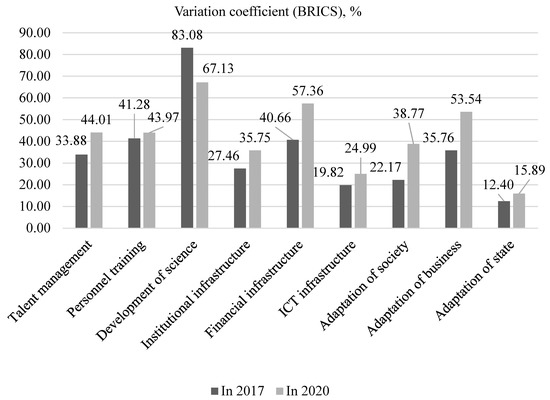
Figure 4.
Variation analysis of digital competitiveness of BRICS countries. Source: calculated and created by the authors.
As shown in Figure 4, there is moderate variation (38.77%) of society’s adaptation to the risks of digitalization in BRICS countries; it grew substantially as compared to 2017 (22.17%). The variation of factors of adaptation to the risks of digitalization is also moderate:
- −
- Variation of institutional infrastructure equaled 35.75% in 2020, having grown substantially as compared to 2017 (27.46%);
- −
- Variation of financial infrastructure equaled 57.36% in 2020, having grown substantially as compared to 2017 (40.66%);
- −
- Variation of ICT infrastructure equaled 24.99%, having grown as compared to 2017 (19.82%).
Thus, survival trends for states in a multipolar world under the influence of digitalization differ a great deal between G7 and BRICS countries. G7 countries are peculiar for a weak tendency for successful adaptation of business to digitalization primarily using managing the factors of the “knowledge economy”, but the practices of managing these factors and the achieved managerial results are distributed unequally between countries if G7.
In BRICS countries, there is a more vivid tendency for society’s successful adaptation to the risks of digitalization primarily using managing the infrastructural factors; the practices of managing these factors and the achieved managerial results are distributed relatively equally between BRICS countries, which makes this tendency very clear.
4.2. Mechanisms of States’ Adaptation to the Risks of Digitalization in a Multipolar World
To identify the universal mechanisms of states’ adaptation to the risks of digitalization in the modern multipolar world, we perform a regression analysis. To get more observations for statistical analysis (since for one time period, for example, 2020) there are currently too few observations for regression, we combined the data from Table 1, Table 2, Table 3, Table 4, Table 5 and Table 6 to perform a certain panel data estimation.
This allows clarifying the formal model of this research with the help of the following three equations of multiple linear regression.
Asoc = −3.20 + 0.01 × TM − 0.03 × TE + 0.13 × SC + 0.20 × RF + 0.05 × CP + 0.64 × TF + 7.54
Model (1) includes fixed effects (standard error), indicating that the interfering parameters (errors) are small and the model is reliable. Equation (1) (model 1) shows the following tendencies of society’s adaptation to the risks of digitalization:
- −
- An increase of talent management by 1 position leads to an increase of society’s adaptation to the risks of digitalization by 0.01 positions;
- −
- An increase of personnel training by 1 position leads to decrease of society’s adaptation to the risks of digitalization by 0.03 positions;
- −
- An increase of development of science by 1 position leads to an increase of society’s adaptation to the risks of digitalization by 0.13 positions;
- −
- An increase of talent management by 1 position leads to an increase of society’s adaptation to the risks of digitalization by 0.20 positions;
- −
- An increase of personnel training by 1 position leads to an increase of society’s adaptation to the risks of digitalization by 0.05 positions;
- −
- An increase of development of science by 1 position leads to an increase of society’s adaptation to the risks of digitalization by 0.64 positions.
The positions are places (from 1st to 63rd) in ranking. The following mechanisms do not contribute to society’s adaptation to the risks of digitalization: personnel training (which is proven by the negative signs of the regression coefficients). Detailed results of the automated regression analysis for model 1 are shown in Table 8.
Table 8.
Detailed results of the automated regression analysis for model 1.
According to the Table 8, multiple correlation equals 91.03%, demonstrating the high level of connection between the studied indicators. Listed in Table 8, the standard errors and t-statistics indicate the significance of the variables at α = 0.05. Among the diagnostic tests performed is the F-test. Observed value Fobs = 52.3605. Where k1 = m = 6, k2 = n − m − 1 = 72 − 6 − 1 = 65, the tabular value Ftabl = 1.87. Since Fobs > Ftabl (52.3605 > 1.87), the F-test is passed.
Abus = 8.08 + 0.08 × TM − 0.13 × TE + 0.22 × SC + 0.42 × RF + 0.41 × CP − 0.19 × TF + 12.45
Model (1) includes fixed effects (standard error), indicating that the interfering parameters (errors) are small, and the model is reliable. Equation (2) (model 2) shows the following tendencies of adaptation of business to digitalization:
- −
- An increase of talent management by 1 position leads to an increase of society’s adaptation to the risks of digitalization by 0.08 positions;
- −
- An increase of personnel training by 1 position leads to decrease of society’s adaptation to the risks of digitalization by 0.13 positions;
- −
- An increase of development of science by 1 position leads to an increase of society’s adaptation to the risks of digitalization by 0.22 positions;
- −
- An increase of talent management by 1 position leads to an increase of society’s adaptation to the risks of digitalization by 0.42 positions;
- −
- An increase of personnel training by 1 position leads to an increase of society’s adaptation to the risks of digitalization by 0.41 positions;
- −
- An increase of development of science by 1 position leads to decrease of society’s adaptation to the risks of digitalization by 0.19 positions.
The positions are places (from 1st to 63rd) in ranking. Personnel training and development of science do not contribute to the adaptation of business to digitalization (which is proven by the negative values of the regression coefficients). Detailed results of the automated regression analysis for model 2 are shown in Table 9.
Table 9.
Detailed results of the automated regression analysis for model 2.
According to the Table 9, multiple correlation equals 76.21%, demonstrating the high level of connection between the studied indicators. Listed in Table 8, the standard errors and t-statistics indicate the significance of the variables at α = 0.05. Among the diagnostic tests performed is the F-test. The observed value Fobs = 15.0081. Where k1 = m = 6, k2 = n − m − 1 = 72 − 6 − 1 = 65, the tabular value Ftabl = 1.87. Since Fobs > Ftabl (15.0081 > 1.87), the F-test is passed.
Agov = −6.61 − 0.005 × TM + 0.11 × TE − 0.20 × SC + 0.35 × RF + 0.33 × CP + 0.55 × TF
Equation (3) (model 3) shows the following tendencies of the state’s adaptation to the risks of digitalization:
- −
- An increase of talent management by 1 position leads to decrease of society’s adaptation to the risks of digitalization by 0.005 positions;
- −
- An increase of personnel training by 1 position leads to an increase of society’s adaptation to the risks of digitalization by 0.11 positions;
- −
- An increase of development of science by 1 position leads to decrease of society’s adaptation to the risks of digitalization by 0.20 positions;
- −
- An increase of talent management by 1 position leads to an increase of society’s adaptation to the risks of digitalization by 0.34 positions;
- −
- An increase of personnel training by 1 position leads to an increase of society’s adaptation to the risks of digitalization by 0.22 positions;
- −
- An increase of development of science by 1 position leads to an increase of society’s adaptation to the risks of digitalization by 0.55 positions.
The positions are places (from 1st to 63rd) in ranking. Talent management and development of science does not contribute to the state’s adaptation to the risks of digitalization (which is proven by the negative value of the regression coefficient). Detailed results of the automated regression analysis for model 3 are shown in Table 10.
Table 10.
Detailed results of the automated regression analysis for model 3.
According to the Table 10, multiple correlation equals 93.47%, demonstrating the high level of connection between the studied indicators. Listed in Table 8, the standard errors and t-statistics indicate the significance of the variables at α = 0.05. Among the diagnostic tests performed is the F-test. Observed value Fobs = 74.9297. Where k1 = m = 6, k2 = n − m − 1 = 72 − 6 − 1 = 65, the tabular value Ftabl = 1.87. Since Fobs > Ftabl (74.9297 > 1.87), the F-test is passed.
To determine the specifics of using the determined mechanisms in each pole of the world economy, we additionally (based on the data from Table 1, Table 2, Table 3, Table 4, Table 5 and Table 6) found the correlation between the results and factors separately in G7 and BRICS countries (Table 11).
Table 11.
Correlation between the results and factors adaptation to the risks of digitalization, %.
As shown in Table 11, the following mechanisms of adaptation of business to digitalization do not work in G7 countries: personnel training (low correlation: 0.7) and ICT infrastructure (negative correlation −0.32%). In BRICS countries, the following mechanism of adaptation to the risks of digitalization do not work: financial infrastructure (negative correlation with society’s adaptation: −0.26%, low correlation with the adaptation of business: 0.10, and negative correlation with an adaptation of state: −0.13) and personnel training (negative correlation with an adaptation of business: −0.06 and low correlation with an adaptation of state: 0.07). The interpretation of the results of the correlation analysis was carried out in accordance with the materials of Kantelhardt et al. (2001).
Thus, despite certain differences in the applicability of the mechanisms of adaptation to the risks of digitalization, there are two highly effective and universal mechanisms in G7 and BRICS countries: talent management and development of science. It is worth noting that both these mechanisms envisage the management of the “knowledge economy” risks.
5. Discussion
The obtained results lead to the conclusion that survival trends for states allow only for limited use of the most perspective mechanisms of states’ adaptation to the risks of digitalization in a multipolar world. Thus, the activity of the use of the most effective mechanisms—talent management and development of science—in BRICS countries was reduced in 2020, as compared to 2017, by 4.23% and 6.30%, accordingly. The mechanism of talent management is poorly used, which is proven by the low value of the corresponding indicator (average 44.40th position out of 63). The mechanism of development of science is used to a larger extent, but moderately, which is proven by the low value of the corresponding indicator (average 27th position). Both selected mechanisms are used unequally in BRICS countries, which is demonstrated by large variation—44.01% (it grew substantially as compared to 2017: 33.88%) and 67.13% (it decreased substantially as compared to 2017: 83.08%), accordingly, in 2020.
In G7 countries, the activity of talent management also decreased in 2020 as compared to 2017, by 8.44%; but the activity of development of science grew by 24.72%. The mechanism of talent management is moderately used, which is demonstrated by the medium value of the corresponding indicator (average 23.86th position). The mechanism of development of science is used to a larger extent, which is demonstrated by the high value of the corresponding indicator (average 9.57th position). Both selected mechanisms are used unequally in BRICS countries, which is proven by large variation—(it decreased as compared to 2017: 68.43%) and 70.31% (it decreased as compared to 2017: 79.40%), accordingly, in 2020.
To substantiate the future perspectives of adaptation to the digitalization (risk management) of G7 and BRICS countries, given their specifics, we put the best values of the selected most effective mechanisms in Equations (1)–(3) (Figure 5 and Figure 6).
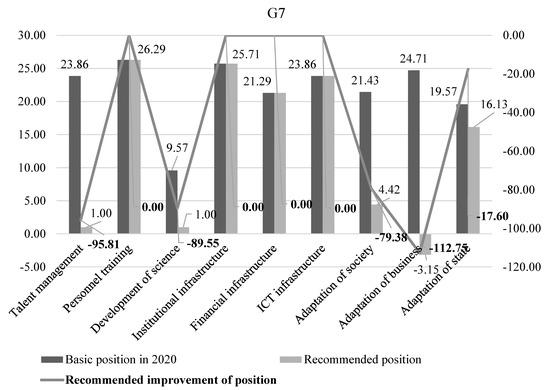
Figure 5.
Future perspectives of adaptation to the digitalization (risk management) of G7 countries. Source: Calculated and created by the authors.
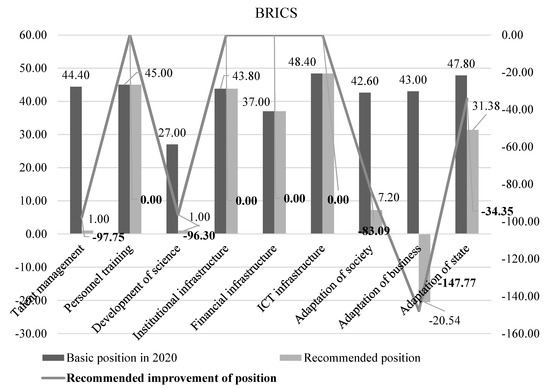
Figure 6.
Future perspectives of adaptation to the digitalization of BRICS countries. Source: Calculated and created by the authors.
As shown in Figure 5, the future perspectives of adaptation to the digitalization of G7 countries are connected to the increase of the level of society’s adaptation by 79.38% (improvement of their average position in the ranking from 21.43rd to 4.42nd position), the increase of the level of adaptation of business by 112.72% (improvement of their average position in the ranking from 24.71st to 1st position), and the increase of the level of states’ adaptation by 17.60% (improvement of their average position in the ranking from 19.57th position to 16.13th position). The positions are places (from 1st to 63rd) in ranking. Indicated in Figure 5, the optimal values of the variables of models 1–3 were obtained using the least squares method. Factors adaptation to the risks of digitalization that are ineffective in the G7 countries (from Table 11) are not involved in optimization—they retain the values of 2020 (zero growth in Figure 5). Figure 5 reflects the Pareto-optimal combination of variables, at which the potential of adaptation of the G7 countries to digitalization is most fully revealed.
As shown in Figure 5, the future perspectives of adaptation to the digitalization (risk management) of BRICS countries are connected to the increase of the level of society’s adaptation by 83.09% (improvement of their average position in the ranking from 42.60th to 7.20th position), the increase of the level of adaptation of business by 147.77% (improvement of their average position in the ranking from 43rd to 1st position), and the increase of the level of states’ adaptation by 34.35% (improvement of their average position in the ranking from 47.80th position to 31.38th position). The positions are places (from 1st to 63rd) in ranking. Indicated in Figure 6, the optimal values of the variables of models 1–3 were obtained using the least squares method. Factors adaptation to the risks of digitalization that are ineffective in the BRICS countries (from Table 11) are not involved in optimization—they retain the values of 2020 (zero growth in Figure 6). Figure 6 reflects the Pareto-optimal combination of variables, at which the potential of adaptation of the BRICS countries to digitalization is most fully revealed.
Thus, the applied recommendations for improving the practice of adaptation to the digitalization of the world economy’s growth poles in view of their specifics include the increase of activity of talent management by 95.81% (from 23.86th to 1st position) in G7 countries and by 97.75% (from 9.57th to 1st position) in BRICS countries and increase of the level of development of science by 89.55% (from 44.40th to 1st position) in G7 countries and by 96.30% (from 27th to 1st position) in BRICS countries.
The practical implementation of the offered recommendations opens future perspectives for more successful survival trends in a multipolar world and the improvement of their adaptation to the risks of digitalization by 69.91% on average ((79.38 + 112.75 + 17.60)/3) in G7 countries and by 88.40% on average ((83.09 + 147.7 + 34.35)/3) in BRICS countries.
6. Conclusions
It is possible to conclude that the offered hypothesis has been proven. We have gathered scientific proofs of the fact that, despite the multipolarity of the modern world economy, there remains the commonness of strategies of adaptation of developed (one pole) and developing (another pole) countries to digitalization. On the one hand, differences in perspective mechanisms of adaptation to the risks of digitalization in G7 and BRICS countries have not been determined; and two universal mechanisms have been revealed: talent management and development of science. This justifies the commonness of the strategies of adaptation to the risks of digitalization (risk management) for all these countries.
On the other hand, these strategies are implemented with different levels of success in the two considered poles of the modern world economy. New survival trends for BRICS states in a multipolar world do not contribute to the implementation of the strategy of their adaptation to the risks of digitalization since they demonstrate the predominant management of the infrastructural factors and mechanisms without the use of the “knowledge economy” mechanisms. Despite this, BRICS countries are peculiar for a vivid tendency of society’s successful adaptation to the risks of digitalization, for which the level has increased by 8.97% in 2020 as compared to 2017. A precondition to the achievement of larger results in BRICS countries is the moderate variation of the activity of the use of the perspective mechanisms of adaptation to the risks of digitalization: 44.01% for talent management and 67.13% for development of science.
In G7 countries, a positive tendency is the growth of development of science by 24.72% in 2020 as compared to 2017. This led to an increase in the level of adaptation of business to digitalization by 3.35%. A barrier on the path of achievement of larger results in G7 countries is a high variation of the activity of applying the perspective mechanisms of adaptation to the risks of digitalization: 63.22% for talent management and 70.31% for the development of science.
Research implications consist of the following: the determined survival trends for G7 and BRICS states in a multipolar world hinder the reduction of inequality of countries. To overcome the disproportions in the world economic system (in particular, implementation of SDG 10, UN 2021), we offer applied recommendations for improving the practice of adaptation to the digitalization (risk management) of the growth poles of the world economy: increase of the activity of talent management by 95.81% in G7 countries and by 97.75% in BRICS countries as well as the increase of the level of development of science by 89.55% in G7 countries and by 96.30% in BRICS countries.
Practical and social implications are as follows: the practical implementation of the offered recommendations opens future perspectives of more successful survival trends in a multipolar world and the improvement of their adaptation to the risks of digitalization (risk management) by 69.91% on average in G7 countries and by 88.40% on average in BRICS countries. The future perspectives of adaptation to the digitalization (risk management) of G7 countries are connected to an increase of the level of society’s adaptation by 79.38%, the level of adaptation of business by 112.72%, and the level of states’ adaptation by 17.60%. The future perspectives of adaptation to the digitalization (risk management) of BRICS countries are connected to an increase of society’s adaptation by 83.09%, increase of the level of adaptation of business by 147.77%, and increase of the level of states’ adaptation by 34.35%.
Nevertheless, it should be recognized that the results of this study are limited by two poles of growth of the modern world economy—the G7 and the BRICS. Multipolarity as the basic setting of the modern world economic system means that, in addition to the main ones (discussed in this article), there are additional poles of world economic growth, which have the potential to come to the fore in the coming years. The developing countries of Asia and Eurasia, for example, the EAEU, as well as African countries demonstrating increased integration and confidently defending their positions in the world arena can be considered as such. These countries are becoming more and more involved in the processes of digital transformation of the world economy and demonstrate an ever-growing, high-tech economy and the progressiveness of the information society. It is proposed to devote further research to the study of their experience and prospects of digital risk management for adaptation to digitalization in the continuation of this article.
Author Contributions
Conceptualization, J.V.R., V.F.U. and O.V.S.; methodology, J.V.R., V.F.U. and O.V.S.; software, J.V.R.; validation, J.V.R.; formal analysis, J.V.R., V.F.U. and O.V.S.; investigation, J.V.R.; resources, J.V.R., V.F.U. and O.V.S.; data curation, J.V.R.; writing—original draft preparation, J.V.R., V.F.U. and O.V.S.; writing—review and editing, J.V.R.; visualization, J.V.R.; supervision, J.V.R.; project administration, J.V.R.; funding acquisition, J.V.R., V.F.U. and O.V.S. All authors have read and agreed to the published version of the manuscript.
Funding
This study was supported by the Russian Foundation for Basic Research (RFBR) as part of research project No. 20-010-00137. This paper was supported by the RUDN University Strategic Academic Leadership Program.
Institutional Review Board Statement
Not applicable.
Informed Consent Statement
Not applicable.
Data Availability Statement
Not applicable.
Conflicts of Interest
The authors declare no conflict of interest.
References
- Abramova, Marina, Svetlana Dubova, and Svetlana Krivoruchko. 2019. Marxism and digital money as a new reality of the social and economic system. In Marx and Modernity: A Political and Economic Analysis of Social Systems Management. Edited by Marina Alpidovskaya and Elena Popkova. A Volume in the Series Advances in Research on Russian Business and Management. Charlotte: Information Age Publishing, pp. 411–22. Available online: https://www.infoagepub.com/products/Marx-and-Modernity (accessed on 22 July 2021).
- Apurv, Rohit, and Shigufta Hena Uzma. 2020. The impact of infrastructure investment and development on economic growth on BRICS. Indian Growth and Development Review 14: 122–47. [Google Scholar] [CrossRef]
- Balzli, Catherine Equey. 2021. A digital individual benefit statement to mitigate the risk of poverty in retirement: The case of Switzerland. Risks 9: 101. [Google Scholar] [CrossRef]
- Banday, Umer Jeelanie, and Ranjan Aneja. 2019. Energy consumption, economic growth, and CO2 emissions: Evidence from G7 countries. World Journal of Science, Technology and Sustainable Development 16: 22–39. [Google Scholar] [CrossRef]
- Chaldaeva, Larisa. 2019. Digital economy: A Marxist view of the present and future. In Marx and Modernity: A Political and Economic Analysis of Social Systems Management. Edited by Marina Alpidovskaya and Elena Popkova. A Volume in the Series Advances in Research on Russian Business and Management. Charlotte: Information Age Publishing, pp. 395–400. Available online: https://www.infoagepub.com/products/Marx-and-Modernity (accessed on 22 July 2021).
- Erro-Garcés, Amaya, and Irene Aranaz-Núñez. 2020. Catching the wave: Industry 4.0 in BRICS. Journal of Manufacturing Technology Management 31: 1169–84. [Google Scholar] [CrossRef]
- Foglia, Matteo, Maria Cristina Recchioni, and Gloria Polinesi. 2021. Smart beta allocation and macroeconomic variables: The impact of COVID-19. Risks 9: 34. [Google Scholar] [CrossRef]
- Garzoni, Antonello, Ivano De Turi, Giustina Secundo, and Pasquale Del Vecchio. 2020. Fostering digital transformation of SMEs: A four levels approach. Management Decision 58: 1543–62. [Google Scholar] [CrossRef]
- Guseva, Irina, Elena Kulikova, and Boris Rubtsov. 2019. Dialectics of the financial market category in the Russian economic science: From the Marx era to the digital economy. In Marx and Modernity: A Political and Economic Analysis of Social Systems Management. Edited by Marina Alpidovskaya and Elena Popkova. A Volume in the Series Advances in Research on Russian Business and Management. Charlotte: Information Age Publishing, pp. 401–10. Available online: https://www.infoagepub.com/products/Marx-and-Modernity (accessed on 22 July 2021).
- IMD. 2021. World Digital Competitiveness Ranking 2020. Available online: https://www.imd.org/wcc/world-competitiveness-center-rankings/world-digital-competitiveness-rankings-2020/ (accessed on 22 July 2021).
- Inshakova, Agnessa, and Nikolai Litvinov. 2020. Digital Institutions in the Fight against the Shadow Economy in Russia. Scientific Narratives of Russia. Available online: https://iscconf.ru/циφpовыe-инcтитyты-в-боpьбe-c-тeнeвой/ (accessed on 22 July 2021).
- Iten, Raphael, Joel Wagner, and Angela Zeier Röschmann. 2021. On the identification, evaluation and treatment of risks in smart homes: A systematic literature review. Risks 9: 113. [Google Scholar] [CrossRef]
- Ivanov, Dmitry, Alexandre Dolgui, and Boris Sokolov. 2019. The impact of digital technology and Industry 4.0 on the ripple effect and supply chain risk analytics. International Journal of Production Research 57: 829–46. [Google Scholar] [CrossRef]
- Kantelhardt, Jan W., Eva Koscielny-Bunde, Henio H. A. Rego, Shlomo Havlin, and Armin Bunde. 2001. Detecting long-range correlations with detrended fluctuation analysis. Physica A: Statistical Mechanics and Its Applications 295: 441–54. [Google Scholar] [CrossRef] [Green Version]
- Karanina, Elena. 2020. Digital Approach to the Fight against Shadow Economy in the Region: Advantages for the Economic Security and Investment Attractiveness of the Territory. Web Site “Scientific narratives of Russia”. Available online: https://iscconf.ru/digital-подxод-к-боpьбe-c-тeнeвой-эко/ (accessed on 22 July 2021).
- Liu, Yi, Wei Wang, and Zuopeng Justin Zhang. 2020. The Dual Drivetrain Model of Digital Transformation: Role of Industrial Big-Data-Based Affordance. Management Decision. Available online: https://www.emerald.com/insight/content/doi/10.1108/MD-12-2019-1664/full/html (accessed on 22 July 2021).
- Pinheiro, Marco Antonio Paula, Bruna Michel Roman Pais Seles, Paula De Camargo Fiorini, Daniel Jugend, Ana Beatriz Lopes de Sousa Jabbour, Hermes Moretti Riberto da Silva, and Hengky Latan. 2019. The role of new product development in underpinning the circular economy: A systematic review and integrative framework. Management Decision 57: 840–62. [Google Scholar] [CrossRef]
- Popkova, Elena, and Bruno Sergi. 2020. Human capital and AI in industry 4.0. Convergence and divergence in social entrepreneurship in Russia. Journal of Intellectual Capital 21: 565–81. [Google Scholar] [CrossRef]
- Popkova, Elena, Alexei Bogoviz, and Bruno Sergi. 2021. Towards digital society management and ‘capitalism 4.0′ in contemporary Russia. Humanities and Social Science Communications 8: 1–8. [Google Scholar] [CrossRef]
- Quaye, Daniel, and Isaac Mensah. 2019. Marketing innovation and sustainable competitive advantage of manufacturing SMEs in Ghana. Management Decision 57: 1535–53. [Google Scholar] [CrossRef]
- Raghutla, Chandrashekar, and Krishna Reddy Chittedi. 2020. Financial development, energy consumption, technology, urbanization, economic output and carbon emissions nexus in BRICS countries: An empirical analysis. Management of Environmental Quality 32: 290–307. [Google Scholar] [CrossRef]
- Roy, Vivek. 2019. Decoding the elemental arcs of superior performance in sustainable supply chains: A knowledge-based view. Management Decision 57: 2570–92. [Google Scholar] [CrossRef]
- Smetanina, Anastasia. 2020. Russian Entrepreneurship on the Path of De-Shadowing: New Opportunities in the Digital Economy and Prospects. Scientific Narratives of Russia. Available online: https://iscconf.ru/pоccийcкоe-пpeдпpинимaтeльcтво-нa-п/ (accessed on 22 July 2021).
- Sreesing, Poonyawat. 2018. Taxes and risk-taking behaviour: Evidence from mergers and acquisitions in the G7 nations. Journal of Risk Finance 19: 277–94. [Google Scholar] [CrossRef]
- Timmis, Sue, Patricia Broadfoot, Rosamund Sutherland, and Alison Oldfield. 2016. Rethinking assessment in a digital age: Opportunities, challenges and risks. British Educational Research Journal 42: 454–76. [Google Scholar] [CrossRef] [Green Version]
- Townsend, Katherine, Anthony Kent, and Ania Sadkowska. 2019. Fashioning clothing with and for mature women: A small-scale sustainable design business model. Management Decision 57: 3–20. [Google Scholar] [CrossRef]
- Tripathi, Vanita, and Amanpreet Kaur. 2020. Socially responsible investing: Performance evaluation of BRICS nations. Journal of Advances in Management Research 17: 525–47. [Google Scholar] [CrossRef]
- UN. 2021. The 17 Goals. Available online: https://sdgs.un.org/ru/goals (accessed on 22 July 2021).
Publisher’s Note: MDPI stays neutral with regard to jurisdictional claims in published maps and institutional affiliations. |
© 2021 by the authors. Licensee MDPI, Basel, Switzerland. This article is an open access article distributed under the terms and conditions of the Creative Commons Attribution (CC BY) license (https://creativecommons.org/licenses/by/4.0/).