1. Introduction
The protection of the policyholders and the financial stability of the insurance market industry is a crucial aspect and regulatory authorities intervene to ensure it. Based on Solvency II and IFRS Phase II regulations, each insurance or reinsurance company is obliged to evaluate its insurance liabilities on a risk-adjusted basis to allow for uncertainty in cash flows that arises from the liability of the insurance contracts. Australian Prudential Regulation Authority (APRA) requires estimating a 75th percentile of the distribution of outstanding claims for recording in profit and loss statements and the risk margin should be established on a basis that is intended to secure the insurance liabilities of the insurance company at a given level of sufficiency ).
In recent years, quantile regression has become a very popular methodology that has incorporated several new reforms in insurance and finance. The least squares estimators investigate only changes in the mean when the entire shape of the claims distribution may change dramatically. Quantile regression characterizes any particular point of a distribution and thus provides a more complete description of the distribution in comparison to linear regression. Quantile regression techniques can differentiate risk factors that lead to high level claims from those that lead to low level claims. Quantile regression estimation may be more efficient than the ordinary least squares when the distribution is not normal. Furthermore, quantile regression is more robust against outliers and does not require the specification of any error distribution. Therefore, quantile regression may be more appropriate than least squares estimation in the context of the insurance industry (see
Buchinsky 1998;
Koenker 2005).
In the actuarial literature, few papers deal with quantiles.
Pitt (
2006) used censored regression quantiles to analyze claim termination rates at different quantiles of the distribution of claim duration for income protection insurance.
Chan et al. (
2008) proposed a robust Bayesian analysis of loss reserves data using the generalized
-distribution.
Dong et al. (
2015) presented in detail the use of parametric and nonparametric quantile regression in non-life applications. Nevertheless, the above approaches have been used for univariate quantile regression models and are suitable for a single line of business (single run-off triangle).
In this paper, we consider a quantile regression application in a multivariate context alternative to a multivariate Chain Ladder model for a portfolio of within and between correlated run-off triangles. For a dependent line of business, it is difficult to describe and specify the underlying correlation structure, which may prevent insurance practitioners from using the quantile regression. We propose a reserving problem for a non-life insurance portfolio consisting of several run-off subportfolios corresponding to different lines of business that can be embedded within the quantile regression longitudinal model and can provide solutions to the estimation of more extreme and capital margins.
The remainder of this paper is structured as follows.
Section 2 presents the types of dependence (correlation) modeling in loss reserving triangles. In
Section 3, we present brief introductions of quantile functions and quantile regression.
Section 4 illustrates how correlated run-off triangles can be embedded in a quantile regression longitudinal model. In
Section 5, we present a numerical implementation of the longitudinal quantile regression model with two run-off triangles.
Section 6 provides the calculation of the risk margin (RM) based on the solvency capital requirement (SCR) estimation and according to the cost-of-capital (CoC) methodology. Finally, in
Section 7, some concluding remarks are presented.
4. Correlated Run-Off Triangles in a Quantile Longitudinal Model
The reserving procedure for multiple run-off triangles is an important issue of an insurance company because the connections among the triangles may show correlations which are initially unknown. The correlations of different lines of business may produce more efficient estimations for the total reserve. If for example the two run-off triangles are positively correlated, then the variability of the total reserves exceeds the sum of variabilities of the total reserve from each triangle.
Ajne (
1994) noted the commonly used approach in actuarial practice, which is the division of the portfolio into several subportfolios and then making calculations using each single line of business. However, this method ignores the dependencies among the subportfolios.
When the run-off triangles are linked with a known structure, such as the paid and incurred triangles, then the Munich Chain Ladder (MuCL) model by
Quarg and Mack (
2004) is a good method of estimation. Moreover, instead of studying the structural correlations, the correlations between the triangles is an important issue and several papers have been produced (e.g.,
Braun (
2004);
Kremer (
2005);
Schmidt (
2006);
Merz and Wüthrich (
2008a,
2008b)). According to
Holmberg (
1994), correlations in a run-off triangle may arise among losses as they develop over time or in different accident years. Other authors have studied correlations over calendar year incorporating the trends of inflation which appear.
Harrison and Hulin (
1989) used generalized estimating equations (GEE) as a promised analytic tool that takes into consideration the correlation of responses within a specific subject for response variables. A more interesting characteristic of these equations is the flexibility they have to analyze not normally distributed response variables.
Suppose that run-off triangles are available and refers to the th triangle while refers to the accident year and refers to the development year. Denote the vector with the incremental losses at accident year and development year for all triangles .
Denote as the observed losses, as the losses up to development year (including it), and as the losses for accident year up to development year (including it). According to the data, the sets and are the observed values and should be used to estimate the adequate reserve to fund losses that have been incurred but not yet developed.
Here, we are not going to use a triangulation form to model the data. Let
be the
th measurement for the
th subject (triangle), which describes the total claims amount or the number of claims at the
run-off triangle for
,
where
is the number of the observed data of the triangle
. We consider the case where longitudinal data analyses are based on a linear regression model such as
where
is a p-vector of unknown regression coefficients while
is a random variable with mean zero and represents the deviation of the response from the model prediction
. Usually,
for all
and all
and then the coefficient
is the intercept term of the regression model. For the rest of the explanatory variables,
, for
,
and
, if the observation
corresponds to
triangle, for accident year
or development year
(in
Table 1); otherwise,
. For more details, see
Christofides (
1990).
In the classical linear model, the
would be mutually independent
random variables and represent the error term of the model. Mathematically, the
of two different observations of the same subject, is not equal to zero. In the longitudinal structure the errors
are expected to be correlated within subjects (see
Diggle et al. 2002). The data for the
run off triangles are displayed in
Table 2.
Using matrices, the regression equation for the
th subject has the following form:
where
is a
matrix and
.
Let
be an
matrix of explanatory variables and
be a block-diagonal matrix with non-zero
blocks
, each representing the variance-covariance matrix for the vector of measurements on the
th subject. Then,
is a realization of a multivariate Gaussian random vector
, with
In case we want to analyze data generated by the model in Equation (
11), the block-diagonal structure of
is very important, because we use each subject in order to estimate
without making any parametric assumptions about this form. The replication across the subjects is a very crucial characteristic because it affects the structure of the matrix
(
Diggle et al. 2002).
4.1. Quantile Regression with Longitudinal Data
By considering the linear quantile regression model of
Chen et al. (
2004),
Fu and Wang (
2012) proposed a combination of the between and within subject estimating functions for parameter estimation, which takes into account the correlations and variation of the repeated measurements for subjects. Their model is an extension of the univariate quantile regression proposed by
Wang et al. (
2009) and
Pang et al. (
2012). Let
be the
th measurement for the
th subject, where
and
. We also suppose that
is the corresponding covariate vector and measurements from the same subject are dependent while those from different subjects are independent. We assume that the
th quantile of
is
, where
is a
unknown parameter vector. Using this notation, we consider the following model for the conditional quantile functions
where
is the true value of the vector
. Let the error term
, which satisfies the condition
. What is of interest is finding an efficient estimate for the unknown vector
for a particular value of
. According to
Chen et al. (
2004), under the independence working model assumption, the estimates
are obtained by minimizing the function
We differentiate Equation (
13) with respect to
and take the following estimating functions to make inferences about the unknown vector
:
where
is a discontinuous function which takes the value
when
and the value
otherwise.
4.2. The Uniform Correlation Model
In the uniform correlation model (also known as exchangeable or compound symmetry correlation model), it is assumed that there is correlation,
, between any two measurements on the same subject. In matrix notation, this corresponds to
where
denotes the
identity matrix and
the
matrix all of whose elements are 1 (
Searle et al. 1992). To justify the uniform correlation model we should think that the observed measurements,
, are realizations of random variables,
. However,
where
,
are mutually independent
random variables,
are mutually independent
random variables, and
and
are independent of each other. We should mention that Equation (
15) gives a simple interpretation of the uniform correlation model as one in which a linear regression model for the mean response incorporates a random intercept term which has variance
between the subjects.
Theorem 1. In the case of modeling the correlation between the same subject, we assume that for any and the covariance matrix of is given bywhere is the correlation coefficient of and and equals , is the identity matrix, and is the matrix of 1 s. Proof. The form of the covariance matrix of
is
because there is correlation between
and
with
. We have
Using the fact that
, we have
and
We use the fact that
is a binary variable which takes the value 1 when
and the value 0 otherwise with mean
and variance
. Similarly, the variable
is a binary variable with mean
and variance
. Then, we have that
From Equation (
18), we take that the correlation coefficient is equal to
. Moreover, by Equations (
17) and (
20), the covariance matrix
is
□
Now, let
. To obtain efficient estimators, we should incorporate an appropriate weighted function that takes into account the correlation for each subject. According to
Jung (
1996), based on the exchangeable correlation structure assumption
the generalized least squares estimate of
obtained by minimizing
and differentiating with respect to
, we have the following weighted functions
where
is the inverse matrix of
.
Proposition 1. The inverse matrix of can be written aswhere and are quantities related to information from different subjects and from the same subject, respectively Proof. Suppose
is an invertible square matrix and
are column vectors. Suppose furthermore that
. Then, the Sherman–Morrison formula (
Bartlett 1951) states that
Starting from
and supposing that
where
is a
vector, by Equation (
26), we take
that provides Equation (
24). □
If there is no correlation between the same subject, then the correlation coefficient
is zero and the inverse matrix of
is equal to
and
is equivalent to the estimating functions
. Furthermore, from Equation (
23), using the result of Equation (
24), we take
where
is a
vector of 1s. Then, from Equations (
27) and (
25), we can extract the following two estimating functions:
Remark 1. Note that the estimating functions indicate the differences within a subject while indicate the information which comes from different subjects.
4.3. Parameters Estimation for QR Longitudinal Model
Generally, the most difficult issue when using quantile regression is the estimation of the covariance matrix of the parameter estimators because it involves the unknown density functions of the errors. Resampling methods have been proposed to estimate the covariance matrix (
Parzen et al. 1994). These methods are useful because the parameter estimates can be easily obtained but the variance is difficult to be estimated. Moreover, there is no analytical proof for the validation of the traditional bootstrap technique for the quantile regression model (see
Yin and Cai 2005).
Fu and Wang (
2012) extended the smoothing method of quantile regression with independent data proposed by
Wang et al. (
2009) and proposed a method for longitudinal data.
Suppose that
is the estimator which results from
. Then, under some regularity conditions,
, is a consistent estimator of
and
For the proof of the consistency of
and the asymptotic normality of
, see the work by
Fu and Wang (
2012). For the definition of covariance matrix
, we refer to the works of
Wang et al. (
2009) and
Koenker (
2005).
Thus, the resulting estimator
from Equation (
27) can be approximated by
where
is the standard normal distribution
and
is a disturbance quantity to
. Moreover, according to Equation (
13), the estimating functions
can be defined as
where expectation is over
. Nevertheless, the variance-covariance matrix
is unknown, which means that the expectation cannot be computed. For that reason,
Brown and Wang (
2005) suggested the use of a known matrix
instead of
and using appropriate iterative algorithms in order to estimate the matrix
. Thus, the objective function is
.
Note that
where
and
. Then,
where
with
. Differentiating Equation (
31) with respect to
, we take
where
is a diagonal
matrix with diagonal element
.
To produce the estimators and the corresponding covariance matrix, we need iterative methods. We adopt the algorithm of
Fu and Wang (
2012) who extended the induced smoothing method of
Wang et al. (
2009) and
Pang et al. (
2012). A similar algorithm is applied for the analysis of clustered data: a combined estimating equations approach by
Stoner and Leroux (
2002). The steps of the algorithm are the following:
Step 1. Produce some initial values , which have been obtained by the independence working model and .
Step 2. Given
and
from the
step, update
, using the following equation:
Step 3. Update the estimation parameters
and the matrix
using the equations
Step 4. Repeat Steps 2 and 3 until convergence.
Remark 2. The final values of and (Step 3) are taken as the smoothed estimators of and its covariance matrix, respectively. Under some regularity conditions, Fu and Wang (2012) established the consistency and asymptotic normality, i.e., and the smoothing estimator in probability, and converges in distribution to . 5. Numerical Illustrations
In this section, we present a numerical implementation of longitudinal quantile regression model with two correlated run-off triangles. The codes of this paper were implemented in R, using own routines, the “ChainLadder" (
Gesmann et al. 2018) and the “quantreg" (
Koenker 2018) packages.
5.1. Numerical Example Based on Average Premium Per Exposure
In this section, based on average premium per exposure, the loss reserving model is implemented by using the longitudinal quantile regression model. We suppose that we have two blocks of business for which we are trying to calculate reserve indications. Both companies operate in Greece. Company A mainly focuses on motor business and underwrites all vehicle categories apart from taxis and trucks while Company B underwrites all vehicle categories for motor business.
Table 3 and
Table 4 show the triangles of the incremental incurred claims (paid and outstanding claims) for both companies.
In the sequel, we apply the following regression setting in a quantile longitudinal form,
where, for the
triangle,
is the average premium per exposure of the r
accident year and of the j
development year,
is the overall mean,
is the effect of the r
accident year,
is the effect of the j
development year,
is the error term, and the design matrix is of dimension
.
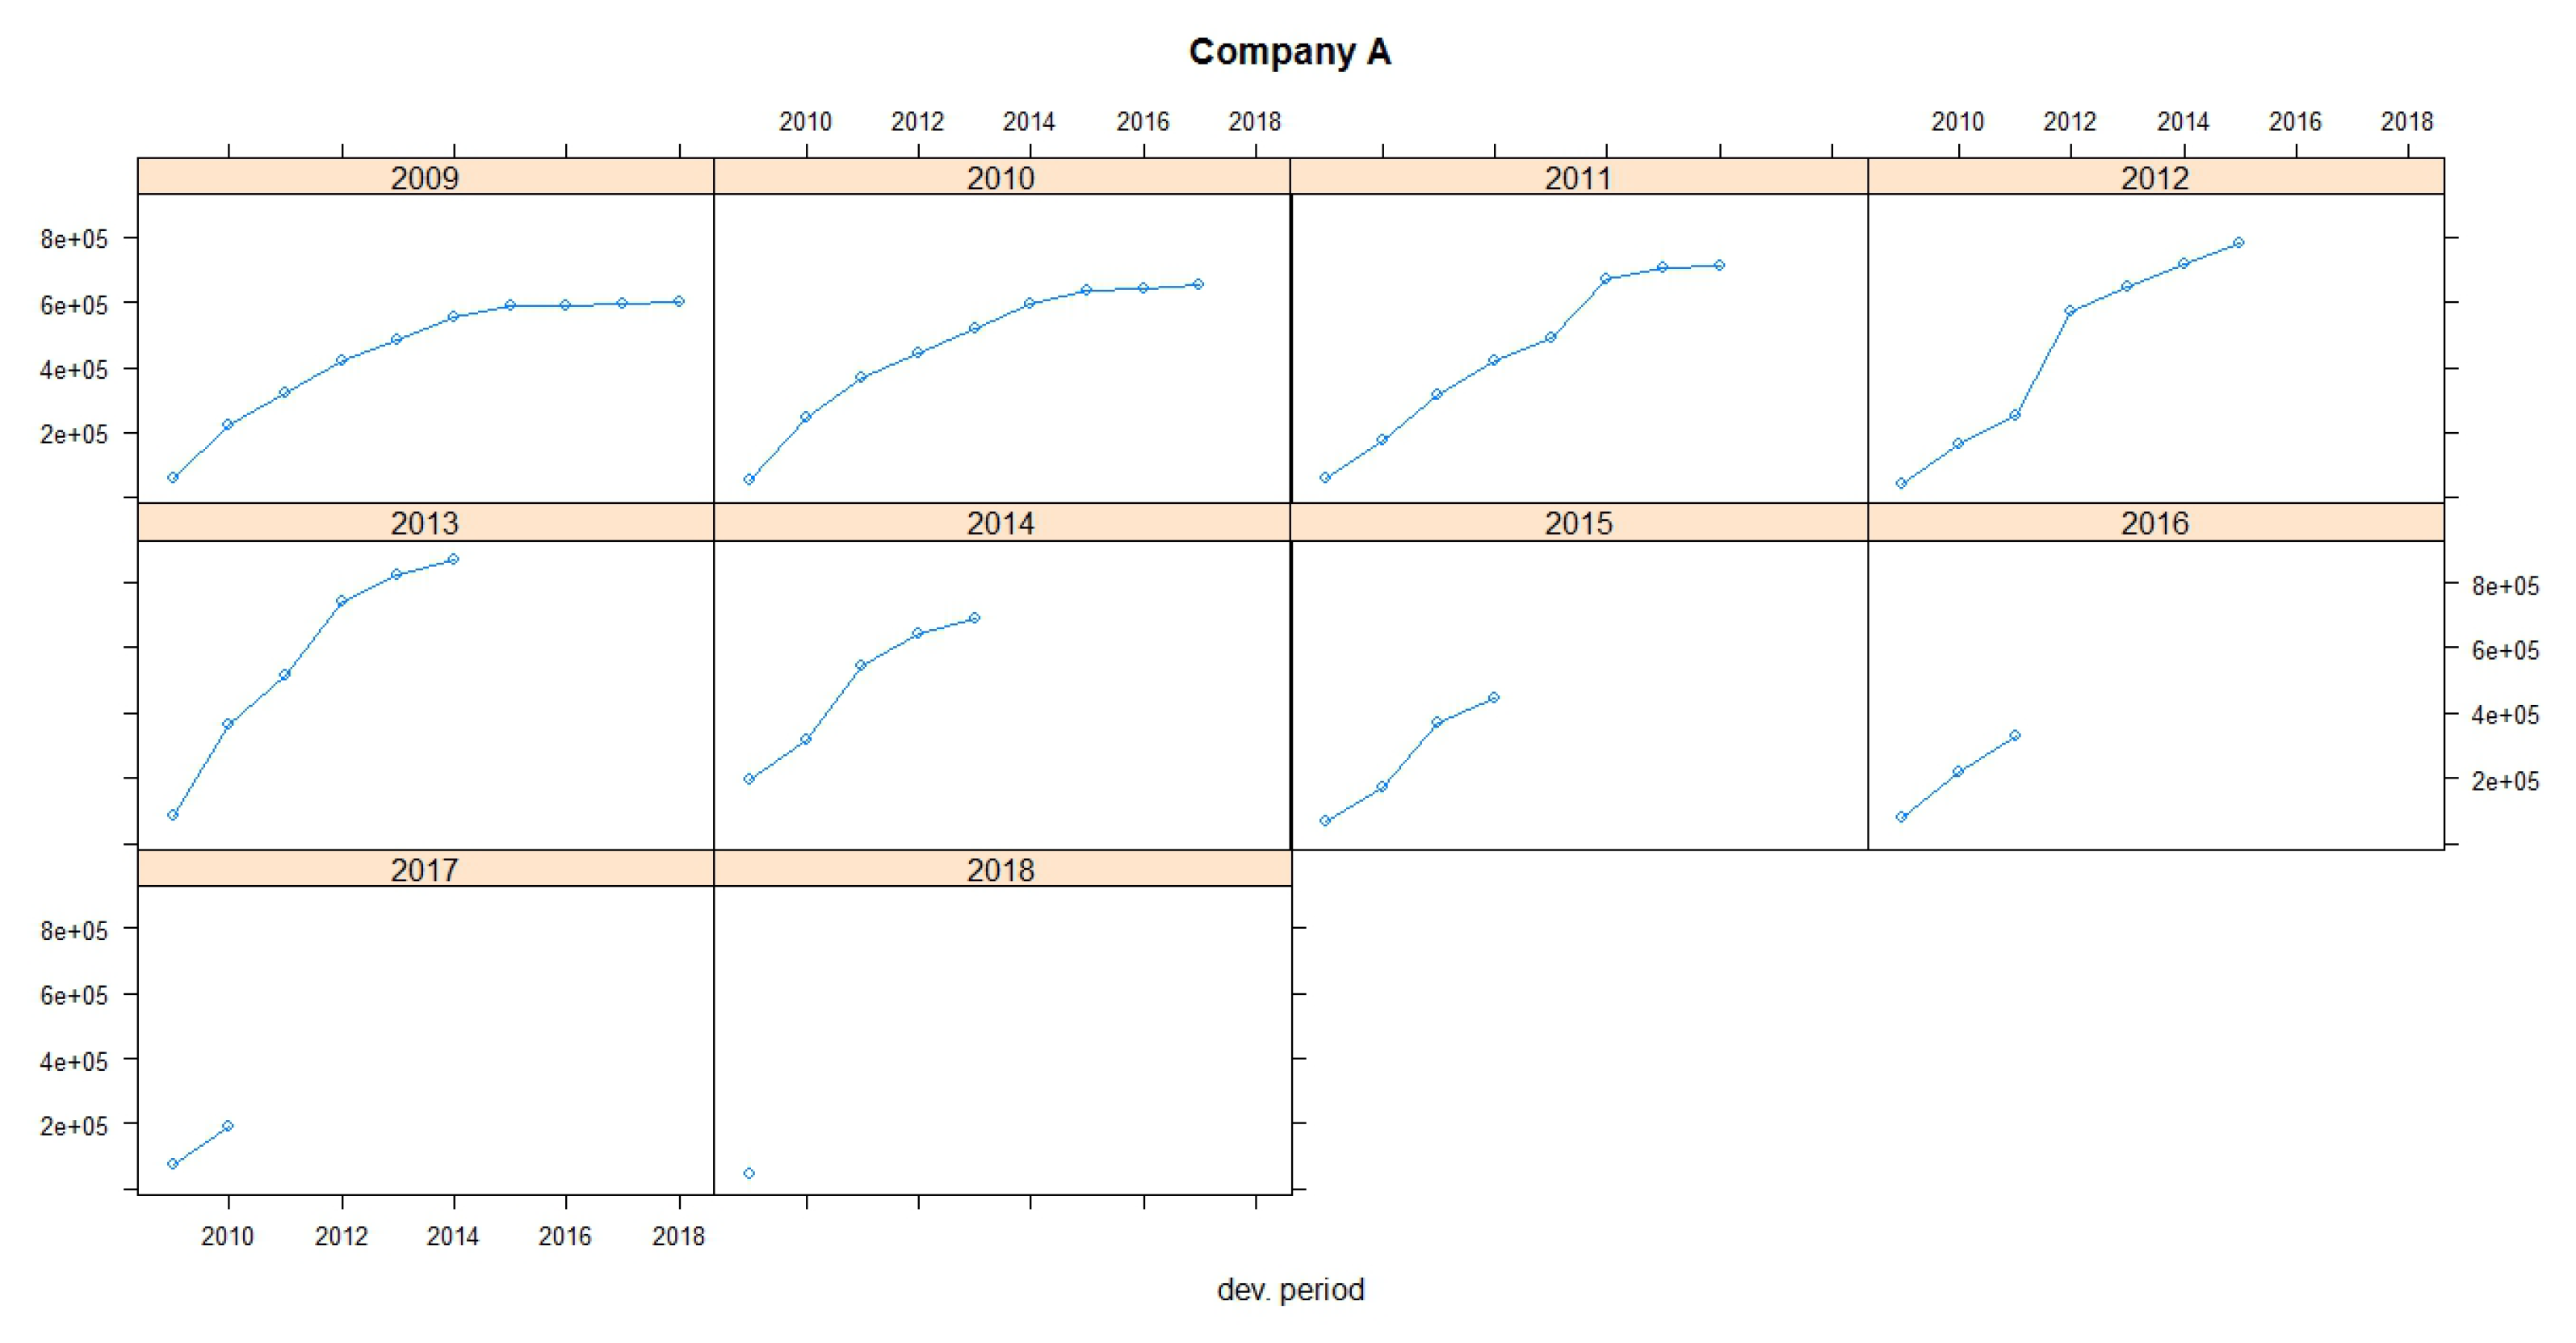
It is obvious that, for Company A, for the accident year 2007, a big claim has been paid 10 years after the accident date (the amount of this claim is embedded at the total incremental amount of 10,190) and could be represented as an outlier claim. This claim will dramatically change the development pattern of the payments in case of using the Chain Ladder method because the loss development factor for this year increases from 1.0117 to 1.0171 (see
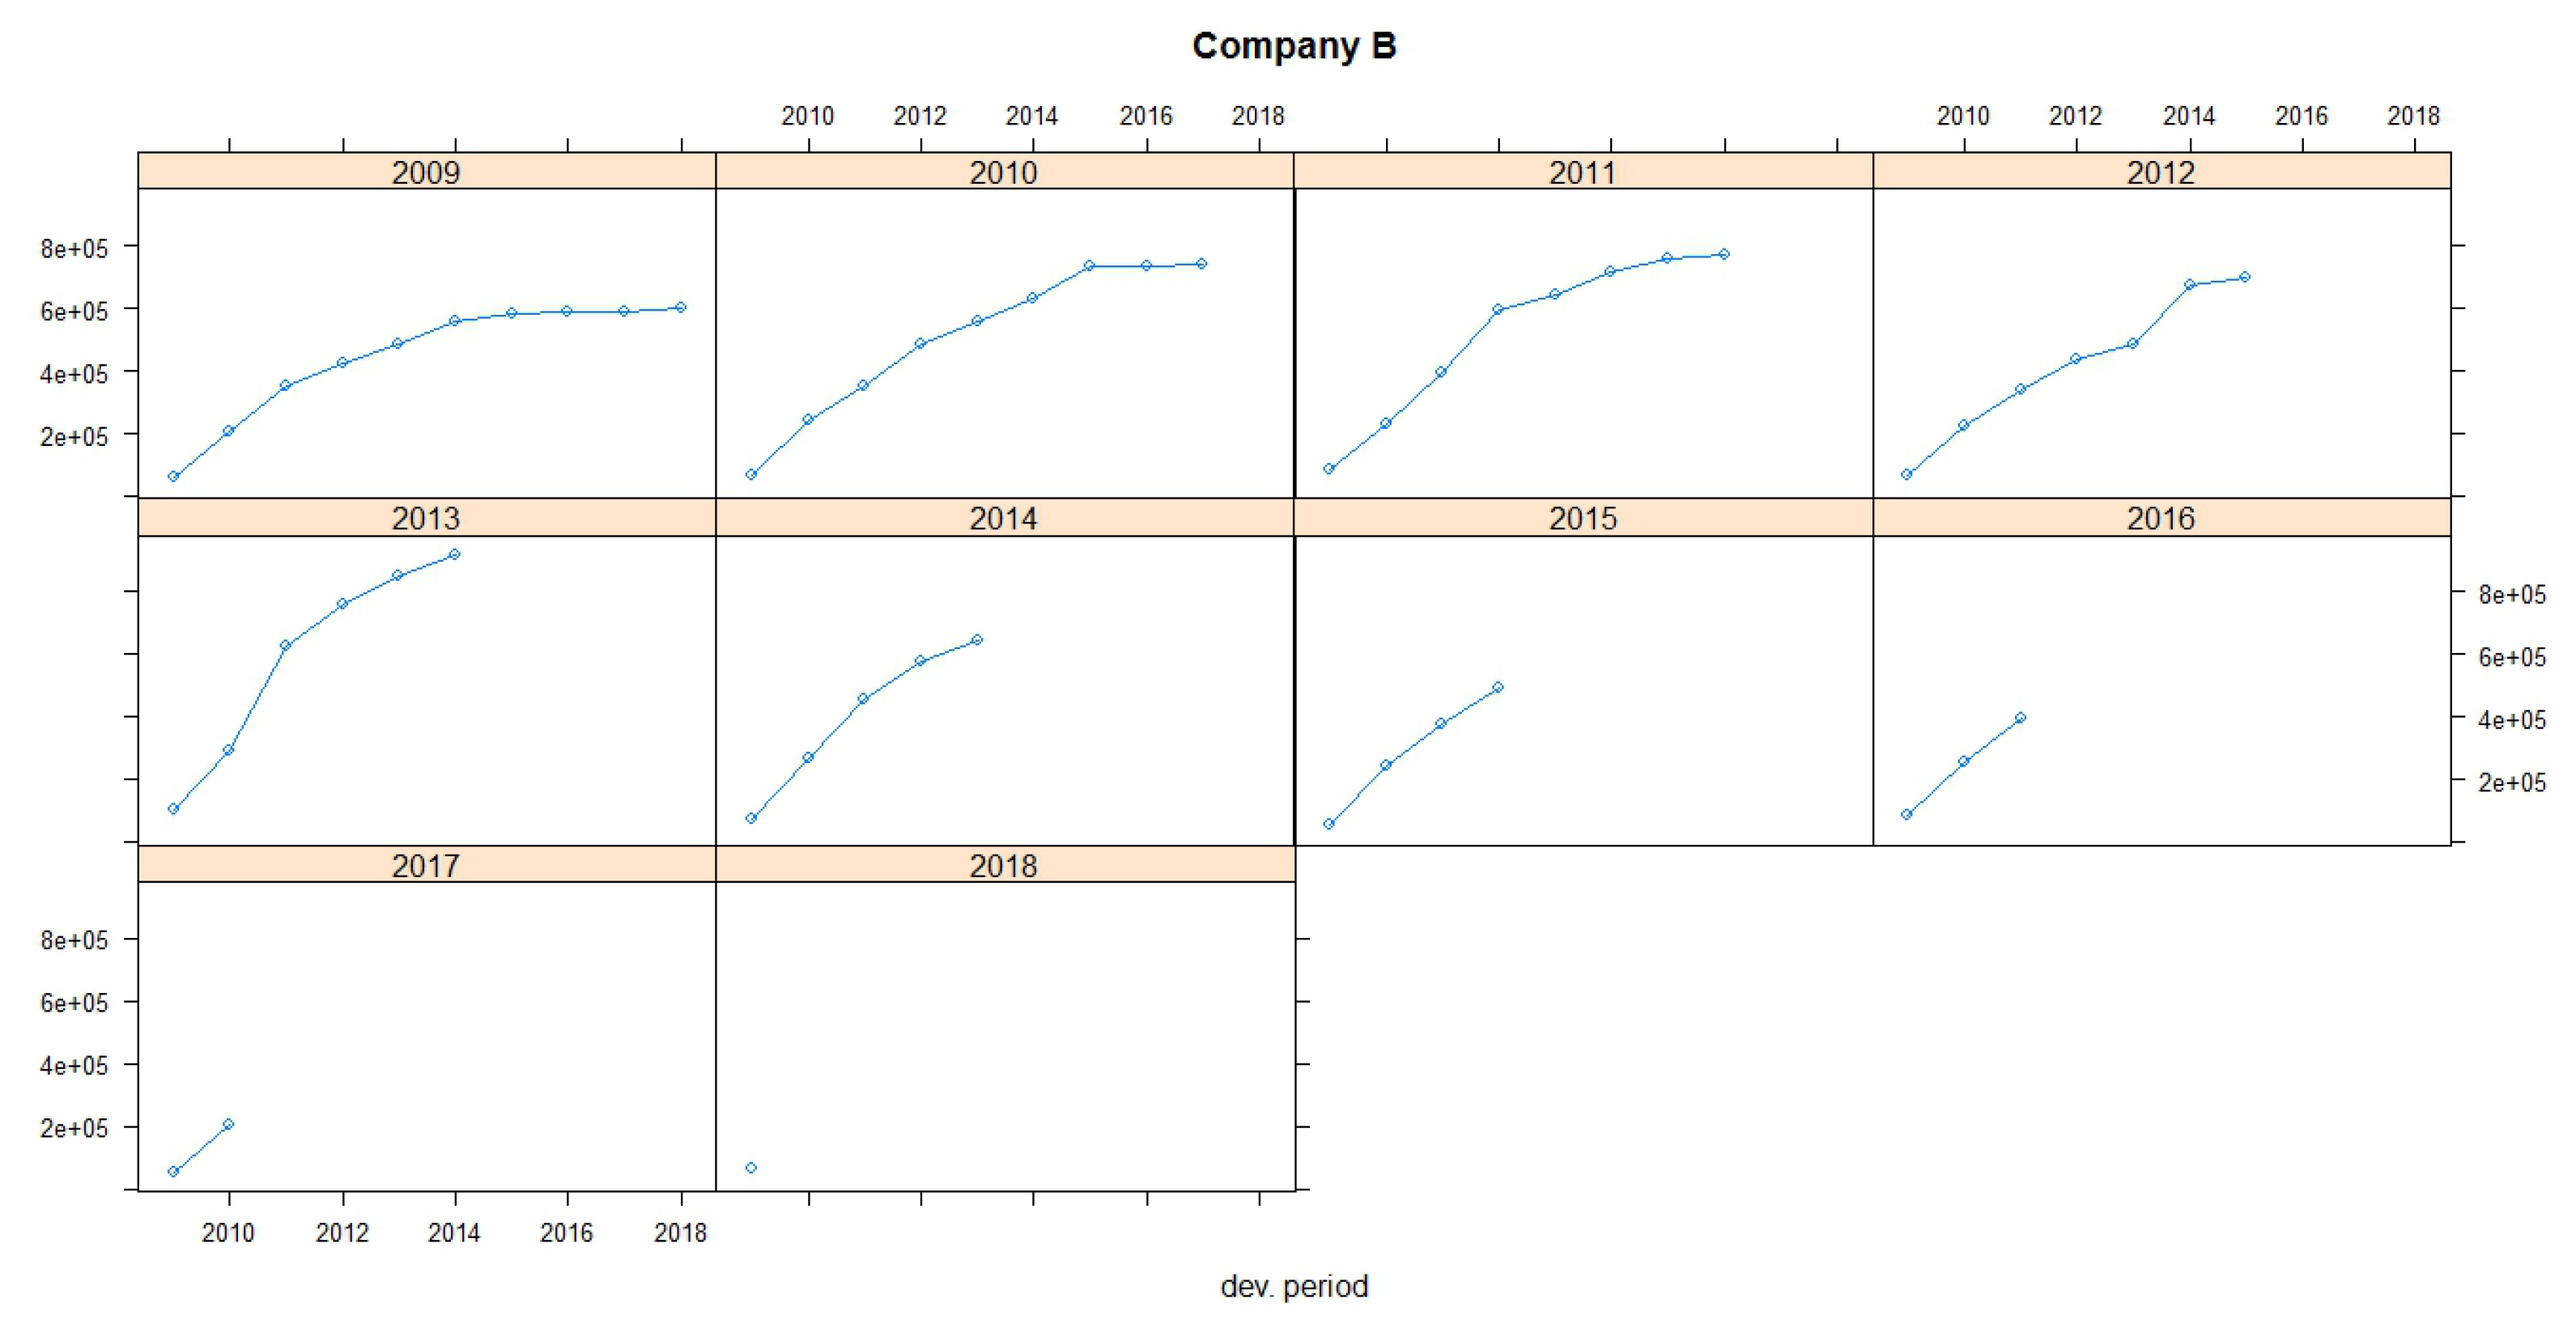
Table 5). This is commonly observed in motor business where claims are settled many years later, especially when accidents with large compensations (such as partial or total disability, deaths, etc.) are observed. This can also be observed in accident year 2008 where a large amount is observed at the last known development year (13,809). We have a similar situation for the run-off triangle for Company B, but not to that extent as for Company A. For Company B, the data of the triangle seem to be more stable. Moreover, the premiums of the companies by accident year are presented at the run-off triangles. For the implementation of the dataset, we divided the payments by exposures for each year of business before the analysis was carried out.
The number of exposures (counts of incurred losses) for each accident year is also provided (see
Table 6 and
Table 7) for each lines of business.
If we were trying to calculate the expected value of the reserve run-off, we could simply calculate the expected value for each line of business separately and add all the expectations together. However, when we quantify a value other than the mean, such as a quantile, we cannot simply sum across the lines of business. In such a case, we would overstate the aggregate reserve need.
Remark 3. The only time the sum of a th quantile would be appropriate for the aggregate reserve indication is when all the lines of business are fully correlated with each other which is of course a highly unlikely situation.
Figure 1 and
Figure 2 show claims development charts of Companies A and B, respectively, with individual panels for each origin period. Chain Ladder loss development factors for each company are also presented in
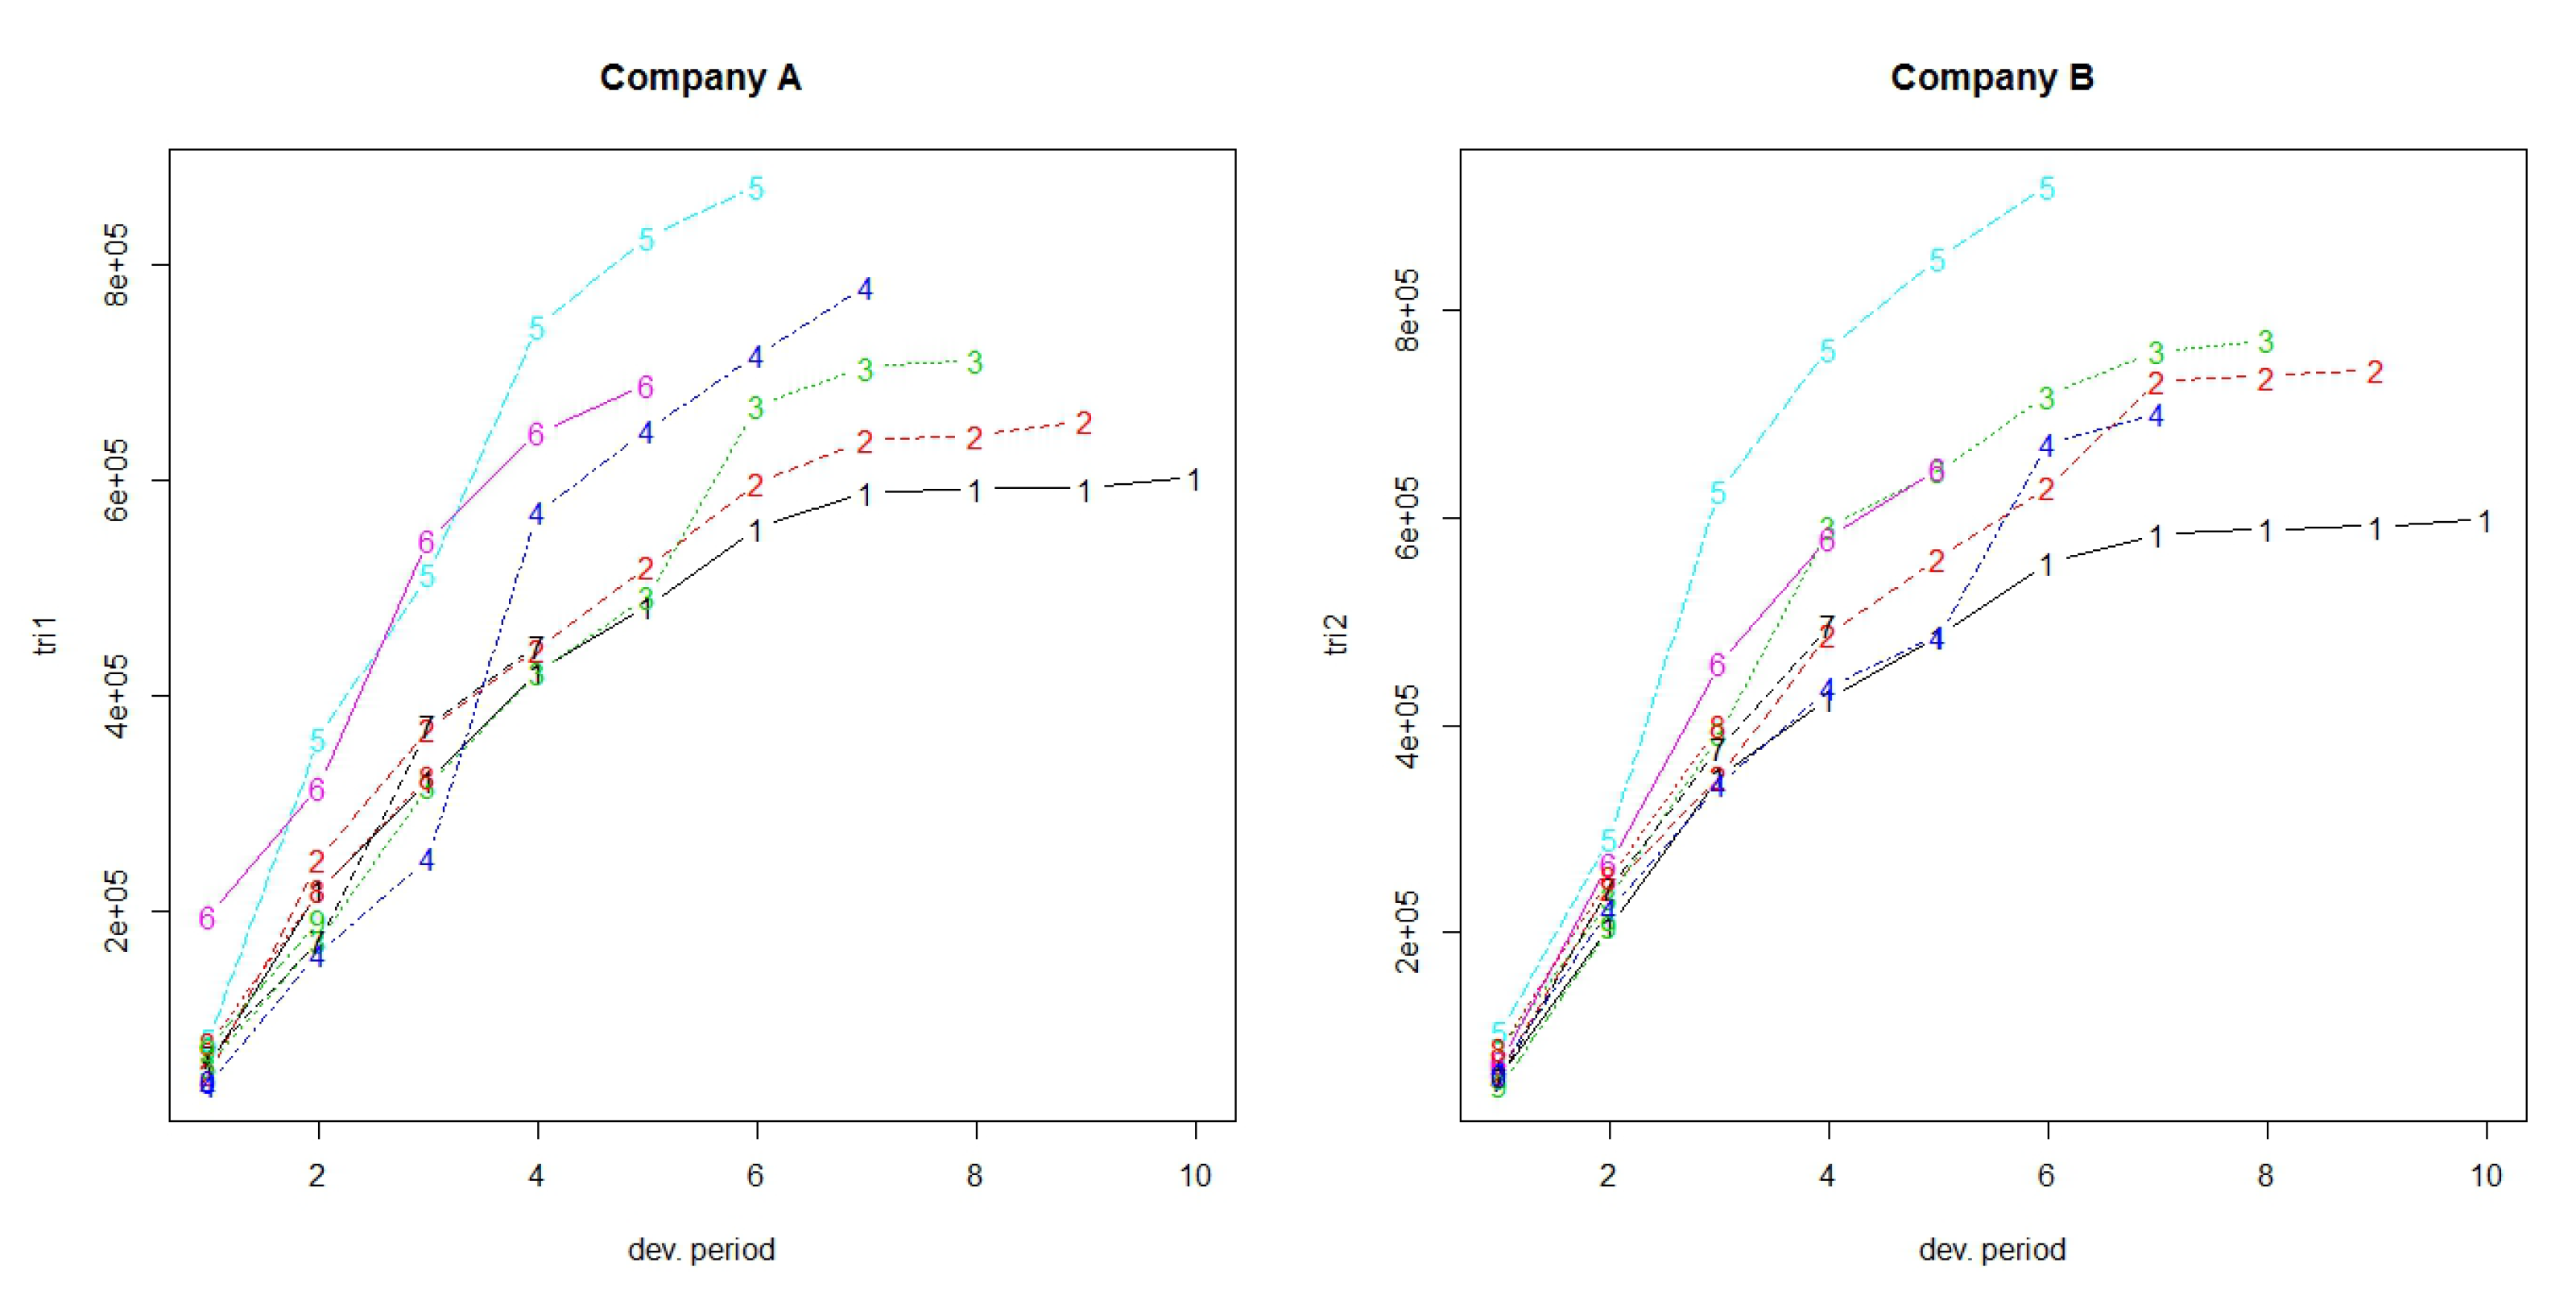
Table 5. According to the claims development chart, we observe that the patterns of Companies A and B appear similar (see
Figure 3).
Table 8 and
Table 9 display the values of reserves and ultimate paid claims based on individual quantile regression method, for Companies A and B, respectively, for different quantiles. Loss ratios for each quantile are also provided at the end of each of the Tables.
Table 10 and
Table 11 display the values of reserves and ultimate paid claims based on longitudinal quantile regression method, for Companies A and B, respectively, for different quantiles.
Loss ratios () for motor car insurance typically range from 40% to 60%. In this case, insurance companies are collecting more premiums than the amount paid in claims. Loss ratio is considered as one of the tools which explains a company’s suitability for coverage. A high loss ratio means is considered bad, which leads to bad financial health because the insurance company may not collect enough premiums to pay claims and expenses while also making a reasonable profit.
Table 12 provides the values of reserves based on the individual quantile regression (IQR) and based on longitudinal quantile regression (LQR). To examine the role of dependence, it is important to calculate the reserves for each IQR, and then use the sum to compare it with the sum of the run-off triangles resulting from the LQR (last line of
Table 12).
Applying individual quantile regression, a higher quantile leads to larger total reserve. Nevertheless, for Company A, quantiles over 95% provide equal values of reserves, while, for Company B, quantiles over 90% provide equal values of reserves. The longitudinal algorithm gives different estimations for each quantile. Applying longitudinal quantile regression, the estimated ultimate reserves for both Companies A and B are smaller than the sum of individual estimated reserves for each of Companies A and B based on individual quantile regression.
5.2. Comparison Criteria
For model comparison, four criteria, namely the root mean squared error (RMSE), the percentage total (PT), the mean absolute error (MAE), and the mean absolute percentage error (MAPE), were used.
RMSE is a measure of accuracy and is useful for comparing different models for a particular dataset (
Hyndman and Koehler 2006). RMSE is the square root of the average of squared errors. The effect of each error on RMSE is proportional to the size of the squared error. Thus, larger errors have a disproportionately large effect on RMSE. Consequently, RMSE is sensitive to outliers (
Pontius et al 2008;
Willmott and Matsuura 2006).
RMSE for one triangle and for many run-off triangles is given, respectively, by
where
represents the total number of the known incremental data (the left upper triangle) and
is the counter for each triangle.
The percentage total (PT) was also a comparison criterion, which is defined for one and for many triangles, respectively, as
RMSE and PT measure the model-fit with respect to observations, where a PT value closer to 100 is accepted, while, for RMSE, we prefer the smallest values.
According to the comparison criteria, the longitudinal algorithm provides the smaller RMSE when using the 75% quantile, resulting to better fit of the data. Thus, a combination of different companies or lines of business provides a better estimation of the total reserve. In case of using the PT criterion, we take exactly the same results and the 75% quantile produces the best fit. If we make estimations separately, the suggested models for both triangles use quantiles below 75% which means weak prudence (
Table 13).
The MAE calculates the average amount of the errors by computing the absolute differences between prediction and actual observation divided by the total number of the observations. The lower the value of MAE is, the better the model fits.
Finally, the MAPE is the average of absolute percentage errors. MAPE has the significant disadvantage of producing infinite or undefined values when the actual values are zero or close to zero (
Kim and Kim 2016). If the actual values are very small, then MAPE yields extremely large percentage errors (outliers).
The MAE criterion for single run-off triangle and the total MAE for
run-off triangles is calculated, respectively, by
The MAPE criterion for single run-off triangle and the total MAPE for
run-off triangles, is given, respectively, by
For the MAPE and MAE criteria, the smallest values indicate the best fit. The computations of the values for each criterion are given in
Table 14. According to the MAE criterion, the 60% quantile is the suggested value to be used, while, based on MAPE, the 50% quantile is the most appropriate. Nevertheless, the difference between the MAE values for 50% and 60% is not so big, which means that 60% could also be a good choice.
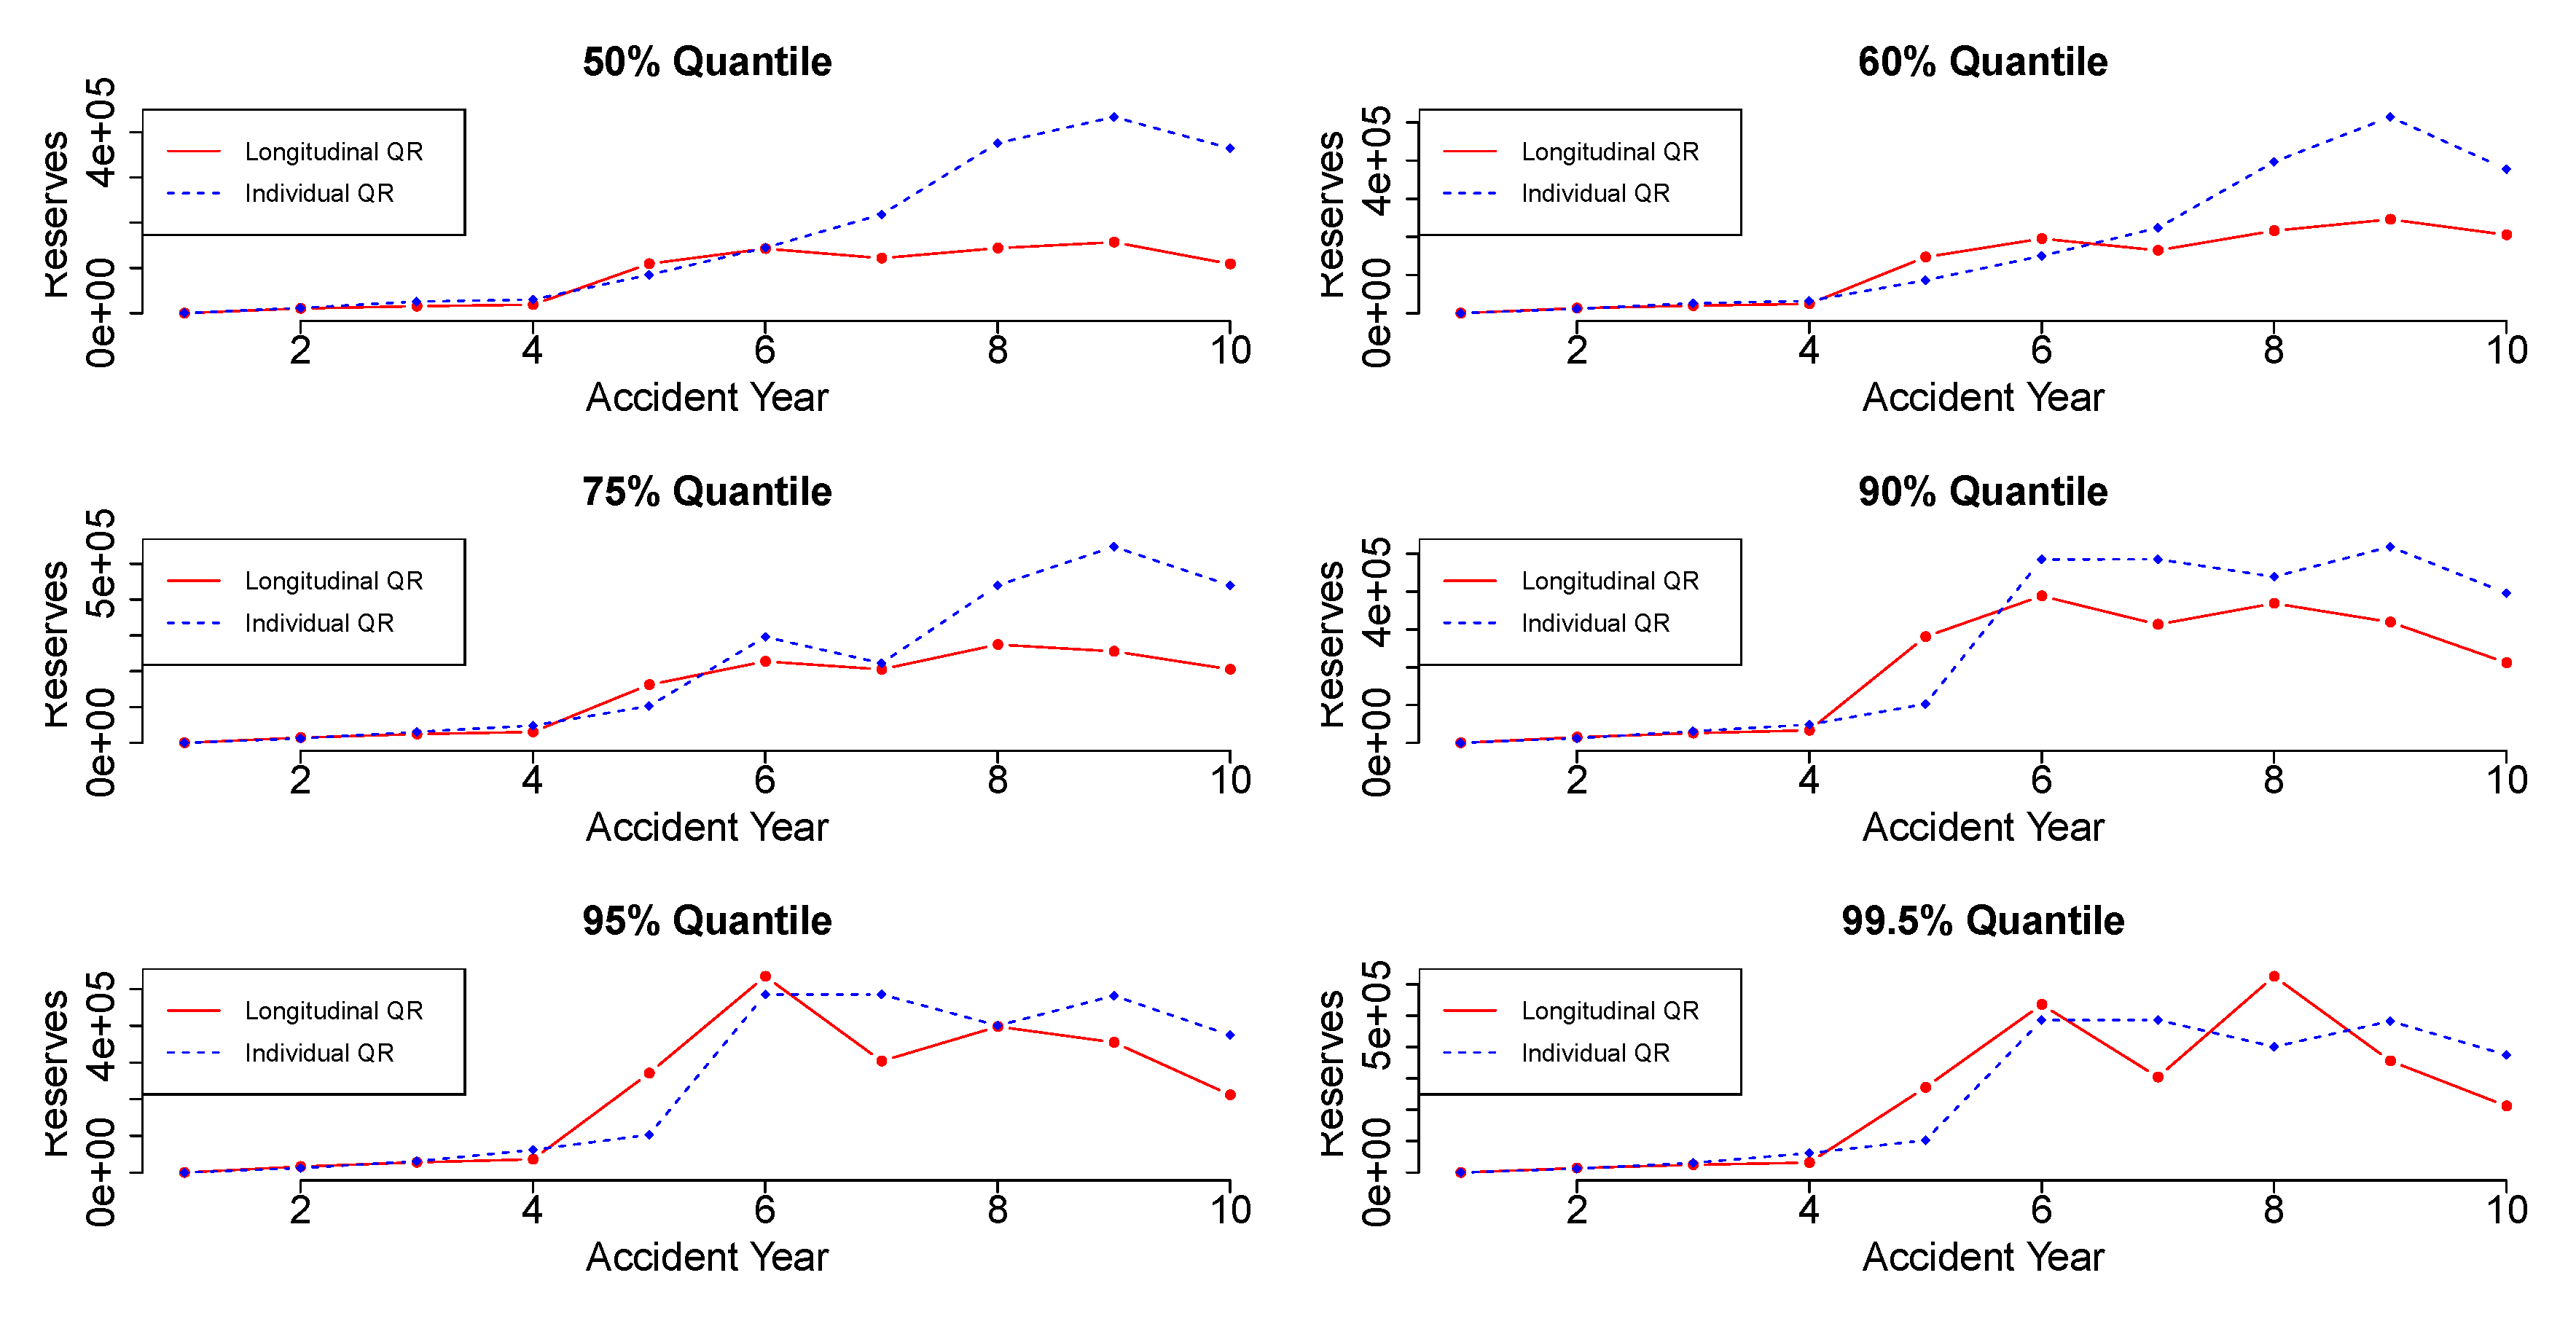
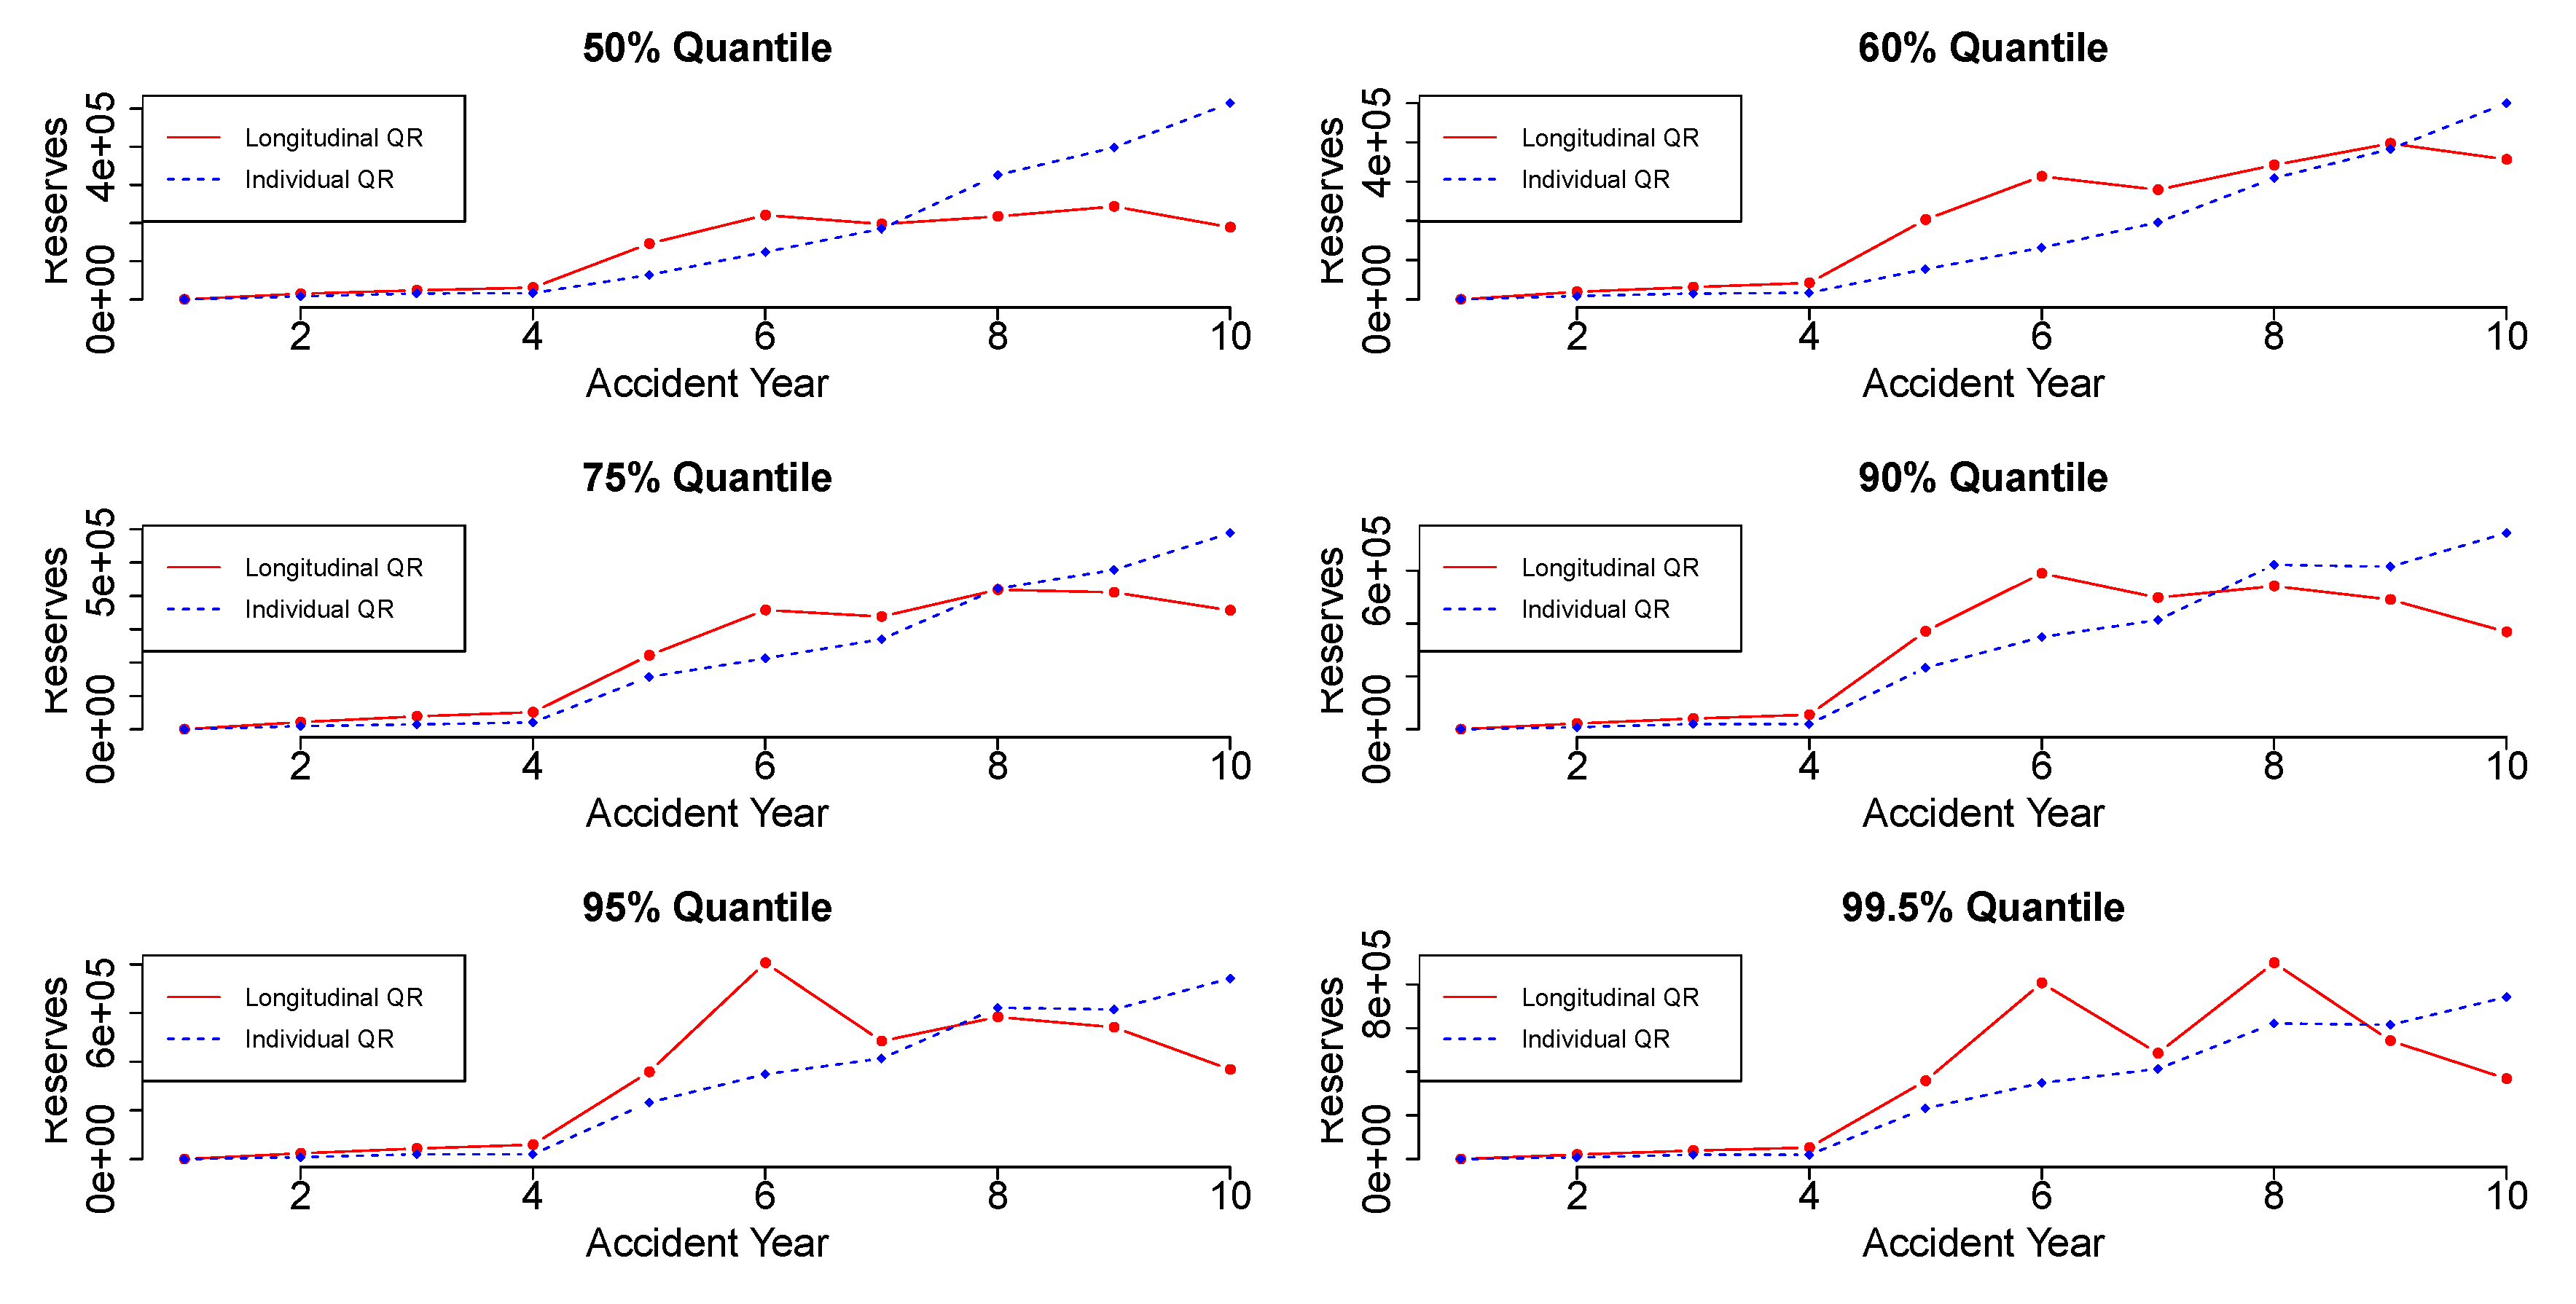
Figure 4 and
Figure 5 display the reserve estimation for each accident year using the individual quantile regression and the longitudinal quantile regression. Each plot provides the reserve values in different quantiles for each accident year.
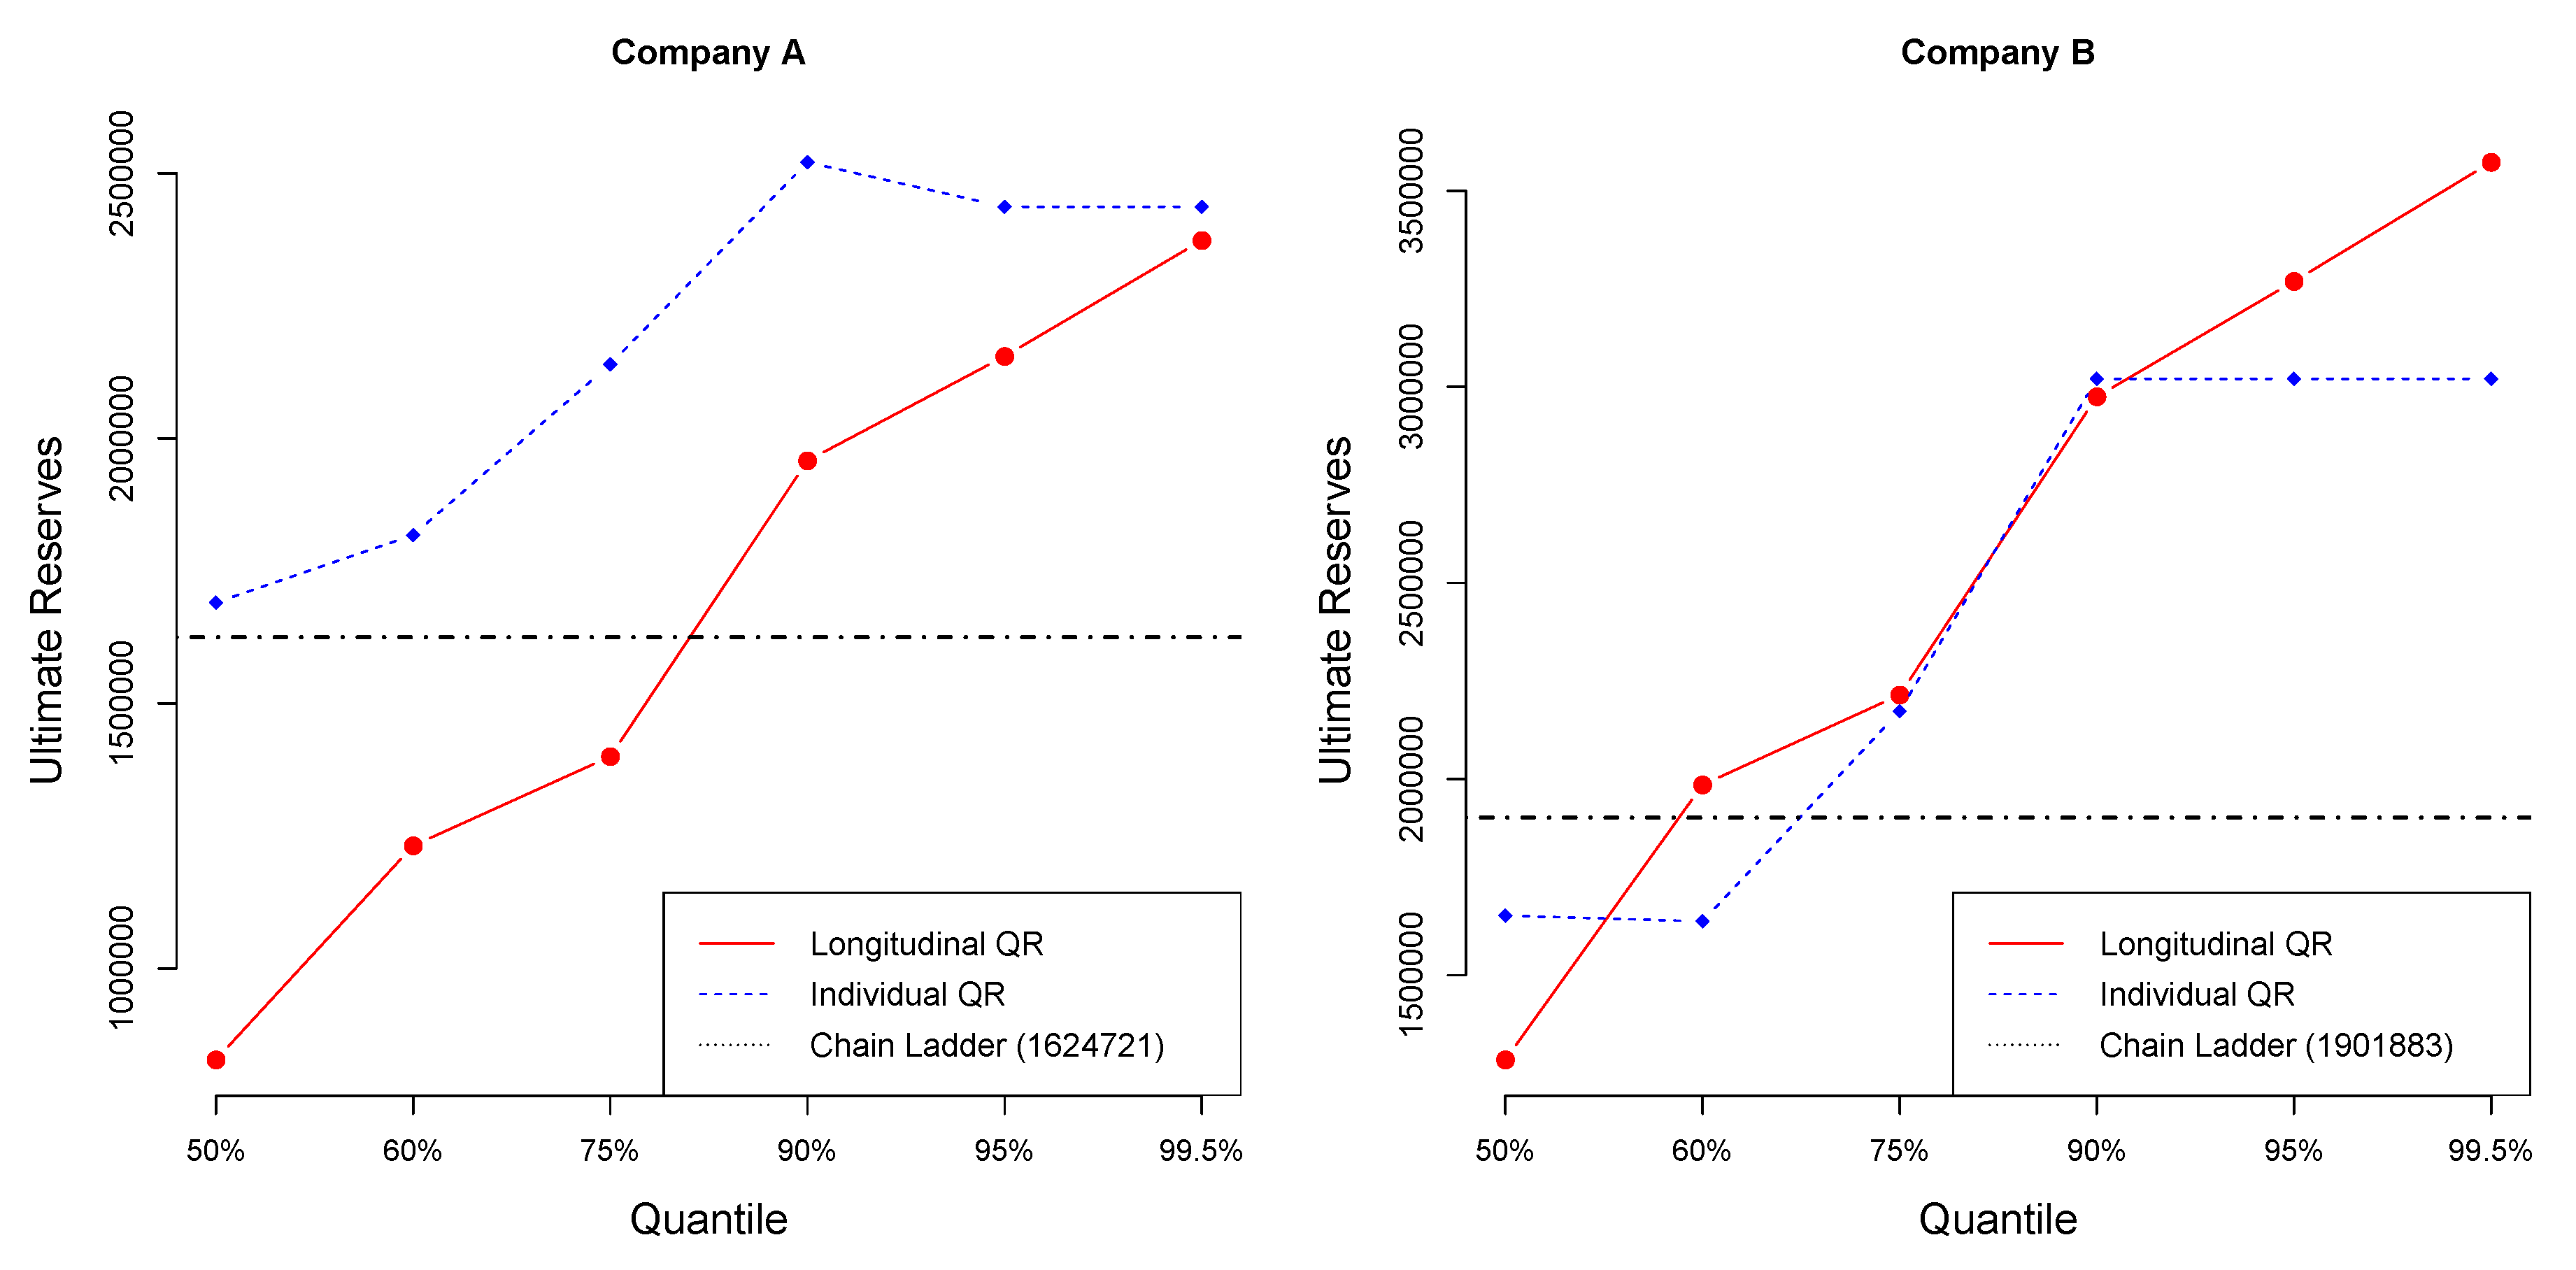
Figure 6 illustrates the values of the ultimate reserves, for different quantiles, based on the individual and the longitudinal quantile regression models, in comparison to the ultimate reserves based on the Chain Ladder method for Companies A and B. The ultimate reserves based on the Chain Ladder estimation for Company A is 1,624,721 and for Company B is 1,901,883. More specifically, for Company A, the Chain Ladder reserve value coincides with the individual quantile regression reserve value at 50-quantile, and with the longitudinal quantile regression reserve value around the 80-quantile. For Company B, the Chain Ladder reserve value coincides with the individual quantile regression reserve value around 50-quantile, and with the longitudinal quantile regression reserve value around the 60-quantile.


