1. Introduction
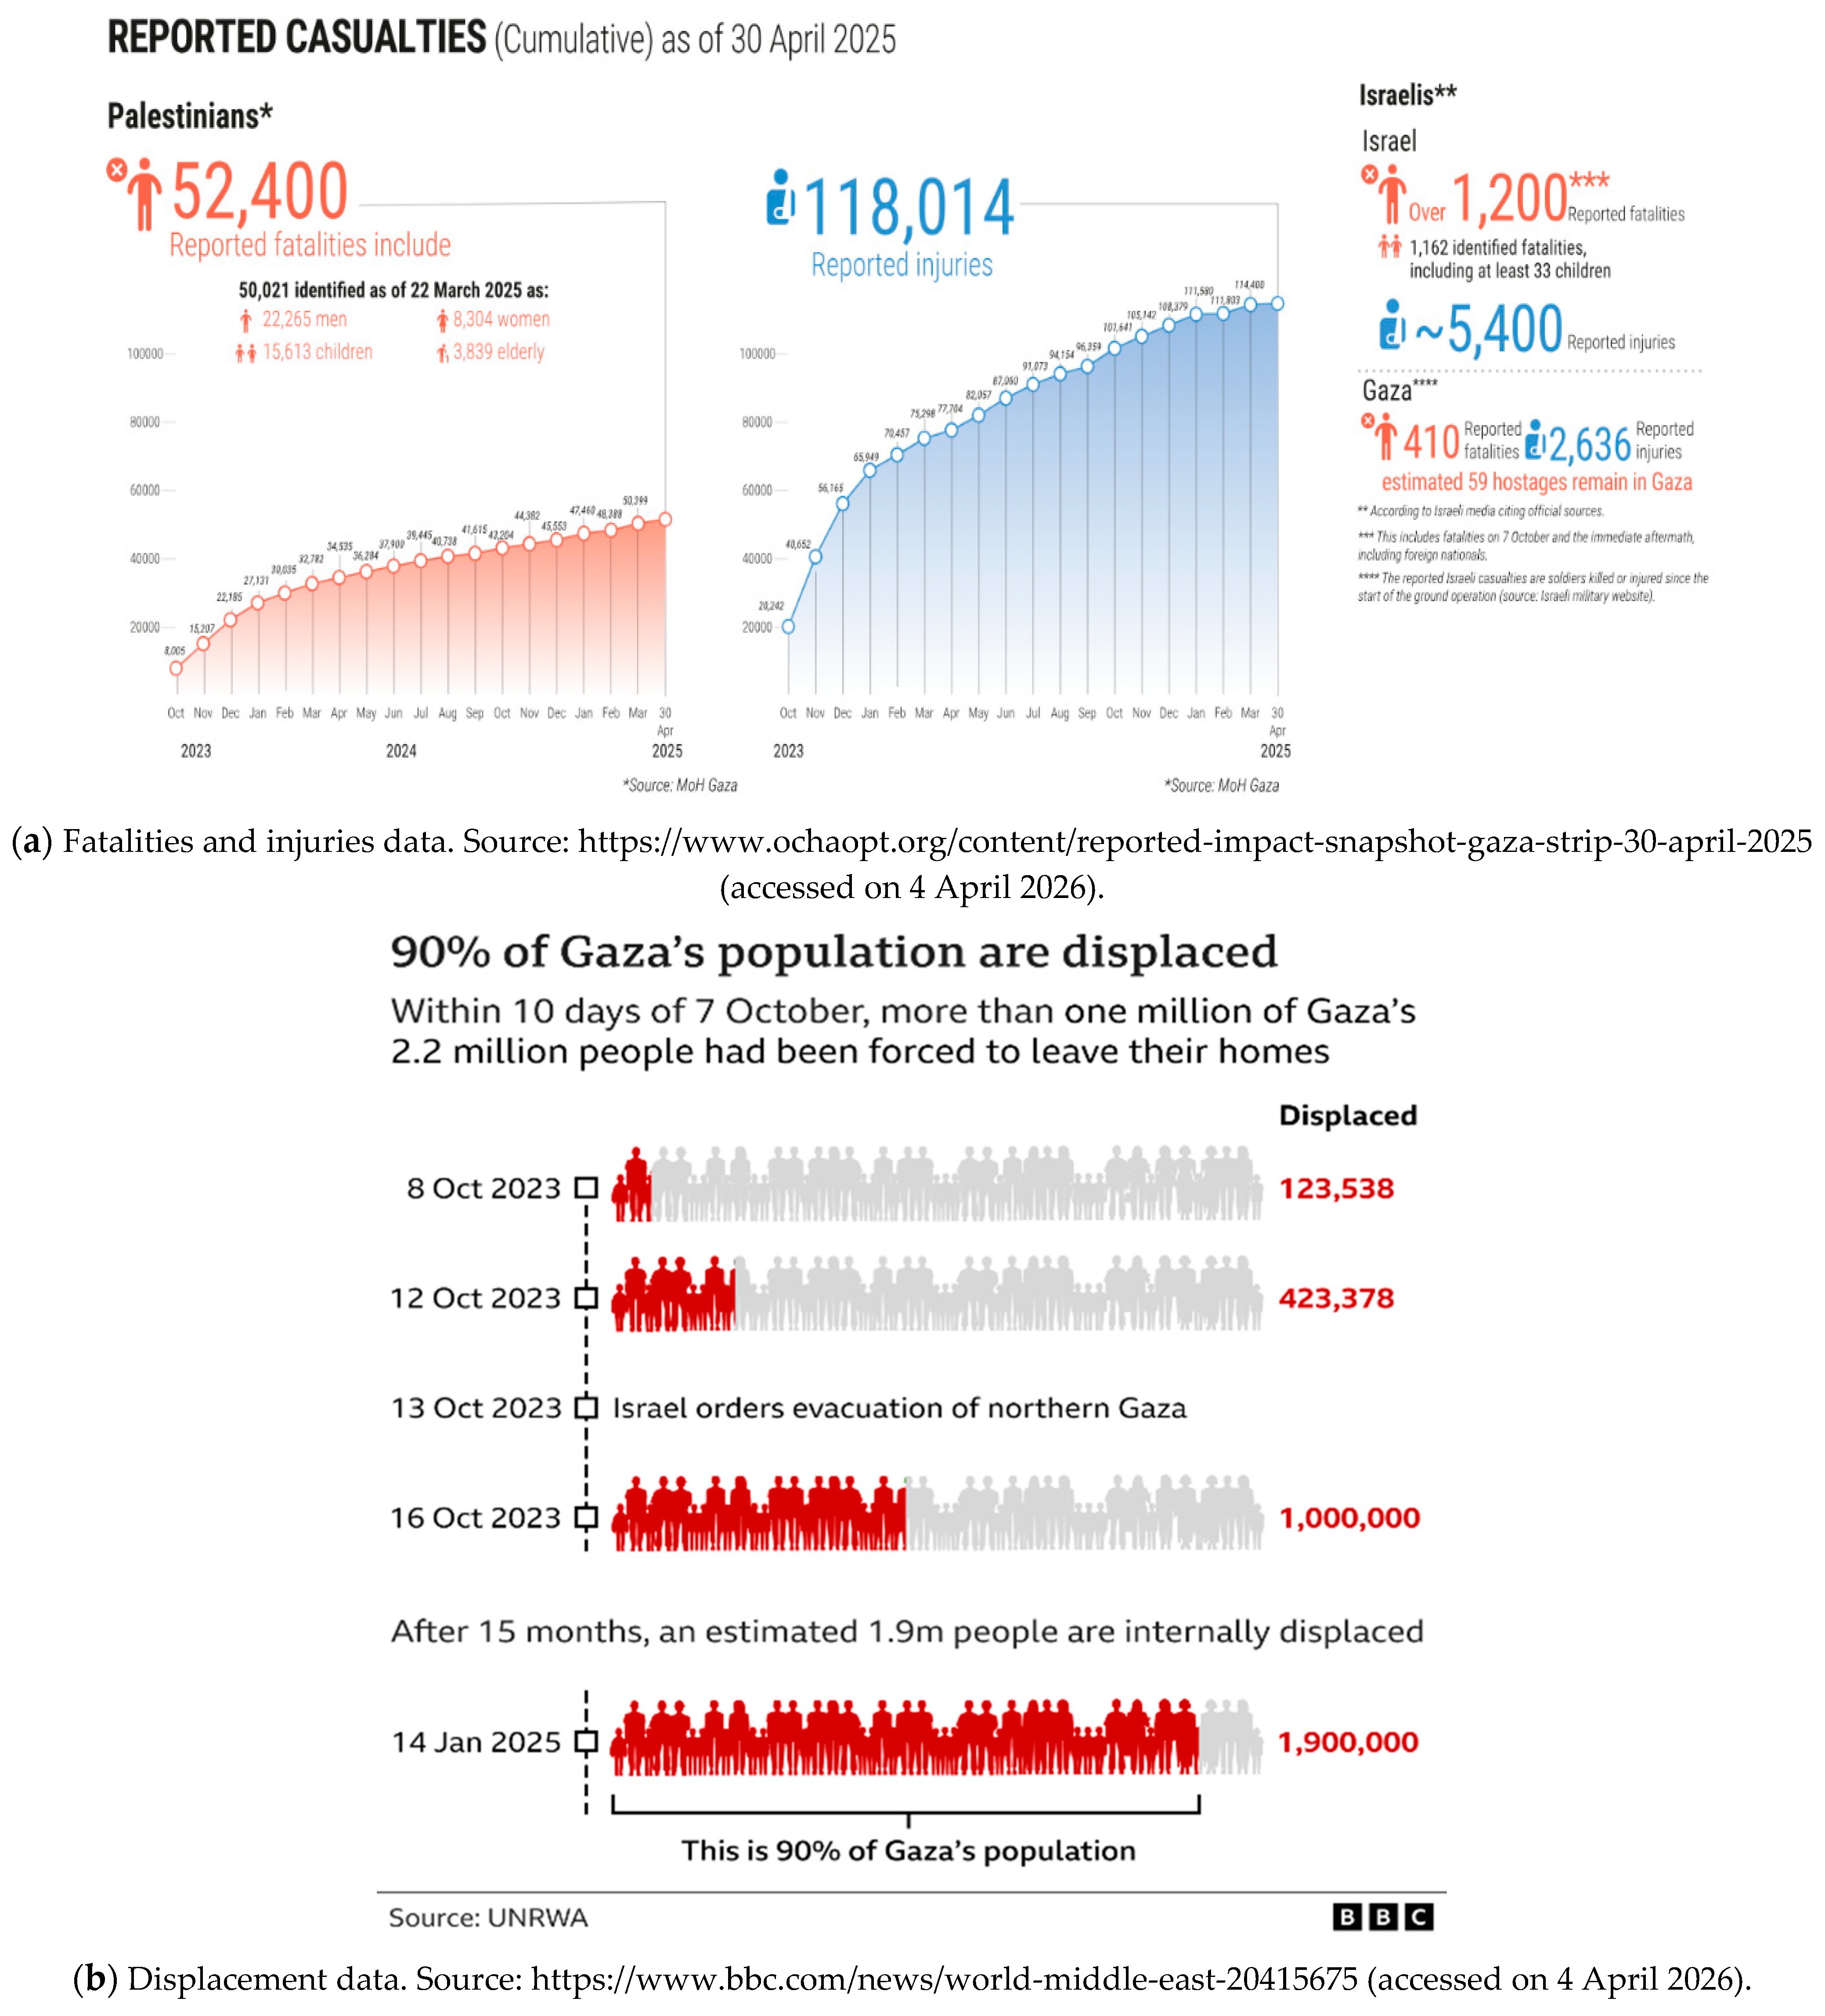
The Gaza War of 2023 represents the latest and most intense escalation of the Israeli–Hamas conflict, beginning on 7 October 2023. The conflict has resulted in thousands of casualties, widespread destruction, the displacement of millions, and a significant number of hostages and missing persons (
Figure 1). While the humanitarian impact has drawn considerable scholarly attention (
Boukari et al. 2024;
Maity et al. 2024), recent studies have also examined its broader implications—including disruptions to the arms supply chain (
Anicetti 2025), economic performance, and financial market behavior.
Theoretical and empirical research has long examined the relationship between armed conflict and financial markets. Wars can reduce GDP per capita by damaging human and physical capital, lowering productivity, and weakening both domestic and international trade (
Thies and Baum 2020). However, other scholars argue that wars, particularly civil or prolonged ones, can generate long-term growth through forced innovation and structural transformation (
Ruttan 2006). Still, short-term consequences often include economic disruption and heightened uncertainty, which can lead to volatility in financial markets.
Geopolitical events are difficult to predict in terms of returns but are known to influence the risk profiles of defense and security-related firms (
Apergis et al. 2018).
Khan et al. (
2025) show that speculation and inefficiencies dominate U.S. defense stocks during wartime, contributing to price asymmetries and market volatility. Meanwhile, studies of past conflicts, such as World War II, have yielded mixed findings:
Hudson and Urquhart (
2015) found no significant impact on the British stock market, while
Akhtar et al. (
2011) observed a pronounced “negativity effect,” where bad news drives returns more than good news.
Schneider and Troeger (
2006) find that armed conflicts with geopolitical implications undermine investor confidence and increase volatility, especially in key Western markets.
Boungou and Yatié (
2022) similarly document a negative link between the Ukraine–Russia war and global stock performance, with the sharpest effects in bordering countries. However,
Kumari et al. (
2023) highlight cross-country variation, noting that political alignment, geography, and market structure mediate each country’s financial response.
Beyond traditional financial metrics, recent research has also focused on how public attention, as captured through search behavior and social media, affects markets.
Dancy and Fariss (
2024) show that interest in human rights—particularly in the Global South—is driven more by domestic repression than by global advocacy.
Siapera et al. (
2015) analyzed Twitter activity during Operation Protective Edge and found that war-related communication followed a pyramid structure, with messages spreading along geopolitical, ideological, and emotional vectors—underscoring Twitter’s role in reshaping how conflict is communicated and experienced.
Ahmed and Sleem (
2024) explore the impact of Israel’s invasion of Gaza on sectoral performance, showing that finance and technology are particularly sensitive, while industrials and real estate are less affected. These studies suggest that both the source and intensity of public attention, whether domestic or international, can have material consequences for financial performance.
In this study, we aim to examine the effect of the 2023 Israeli–Hamas war on the Tel Aviv 35 (TA35) stock index and the New Israeli Shekel–USD exchange rate (hereafter ILS). Using weekly financial data from Yahoo Finance and public interest indicators from Google Trends spanning October 2023 to April 2025, we test whether foreign and domestic search activity differentially influences market outcomes. By constructing indices of domestic and international interest through Principal Component Analysis (PCA), we investigate whether the origin of public attention plays a role in shaping investor behavior and financial performance in Israel during an extreme risk period.
Beyond its implications for asset performance, this study also contributes to the growing literature on financial risk measurement under geopolitical stress. Public attention, as captured through real-time search behavior, can be interpreted not only as a proxy for investor sentiment but also as an early signal of perceived risk and uncertainty. In this context, fluctuations in Google search intensity may reflect shifts in risk expectations, which are subsequently transmitted into asset price volatility and exchange rate dynamics. By distinguishing between global and domestic attention, the present framework allows for a more granular understanding of how different sources of information contribute to the formation and propagation of financial risk during wartime conditions. This perspective aligns closely with the objectives of risk-oriented research, emphasizing the importance of behavioral indicators in capturing forward-looking uncertainty.
The relationship between public attention and financial markets during armed conflicts operates through multiple transmission channels. First, heightened attention to conflict-related developments may affect investor sentiment and risk perception. Behavioral finance research suggests that periods of increased uncertainty amplify pessimistic expectations, raise perceived risk, and increase demand for safe assets. As a result, heightened concern regarding geopolitical events can lead to higher risk premia, stock market declines, and pressure on domestic currencies as investors rebalance their portfolios toward less risky investments.
Second, wartime attention may reflect expectations regarding the real economic consequences of conflict. Military escalation can disrupt production, trade, tourism, labor markets, and investment activity, thereby affecting firms’ expected cash flows and broader macroeconomic conditions. Increased public attention to conflict-related developments may therefore serve as an information channel through which market participants update expectations regarding future economic performance.
Importantly, the origin of attention may influence its economic implications. International search activity is more likely to reflect external perceptions of geopolitical risk and uncertainty. Higher global attention to conflict-related topics may therefore increase risk aversion among international investors, contribute to capital outflows, weaken the domestic currency, and exert downward pressure on equity prices. In contrast, domestic search activity may partly reflect information acquisition and adaptation by local economic agents. During prolonged periods of conflict, local participants often develop greater familiarity with evolving conditions and policy responses, reducing uncertainty through information gathering. Consequently, domestic attention may be associated with improved information efficiency and market stabilization rather than heightened panic.
Based on these arguments, we expect global attention to conflict-related events to be associated with adverse financial market outcomes, while domestic attention may exhibit weaker or even offsetting effects depending on whether information acquisition dominates fear-driven responses.
The rest of the paper is structured as follows:
Section 2 presents the theoretical framework;
Section 3 outlines descriptive statistics;
Section 4 details the single-index analysis;
Section 5 discusses the PCA results; and
Section 6 concludes.
2. Theoretical Framework
In recent decades, various internet-based tools have been explored for their potential to inform financial market analysis. Platforms such as Google, Twitter, and Wikipedia have emerged as valuable sources of behavioral data, helping analysts capture investor sentiment and public attention in real time (
Bollen et al. 2011;
Vlastakis and Markellos 2012;
Preis et al. 2013;
Kristoufek 2013). These tools are now commonly integrated into financial models to enhance predictions and market insights.
Similarly, recent research on the Russia–Ukraine conflict has leveraged Google Trends to quantify the behavioral dimension of geopolitical shocks on financial markets (
Lo et al. 2022;
Khalfaoui et al. 2023;
Vasileiou 2022b).
Ahmed and Sleem (
2024), for instance, constructed a war sentiment indicator to assess the impact of Israel’s invasion of Gaza on its domestic stock market and key sectors. Their results show that heightened attention to the conflict is linked to negative returns and increased volatility, particularly in the finance and technology sectors, while industrials and real estate appeared less affected.
Moreover, war significantly affects exchange rates by altering investor confidence, commodity flows, and geopolitical risk. As
Haberler (
1945) notes, exchange rate valuation must consider specific national contexts, especially during instability.
Hall (
2004) shows that during World War I, currencies of warring nations diverged in response to battlefield events, reflecting shifting expectations. More recently,
Aliu et al. (
2023) highlight how the Russia–Ukraine conflict led to Euro depreciation due to energy dependency and investor flight to safer assets like the US dollar. Together, these studies underscore how war introduces volatility and interconnected shocks to global exchange markets.
Building on this literature, our study investigates the impact of war-related Google search interest on the Israeli stock index (TA-35) and the New Israeli Shekel (NIS) exchange rate. We focus on a set of general, non-partisan search terms related to the Gaza conflict, analyzing their respective effects on financial asset performance. The terms are grouped by geographic origin of the searches:
This setup allows us to examine whether the origin of search interest (domestic vs. international) influences financial market behavior differently. For example, we assess whether increased global searches for “Palestine” have a different market impact than a surge in the same term within Israel.
In the final part of our analysis, we construct composite behavioral indices using Principal Component Analysis (PCA) in two steps: (a) aggregating all search terms, and (b) separating domestic and international search trends. To the best of our knowledge, this approach—particularly the geographic separation of search data—has not yet been applied in this context. It allows us to robustly test the influence of public interest from different regions on Israel’s financial markets.
3. Descriptive Statistics and Methodology Design
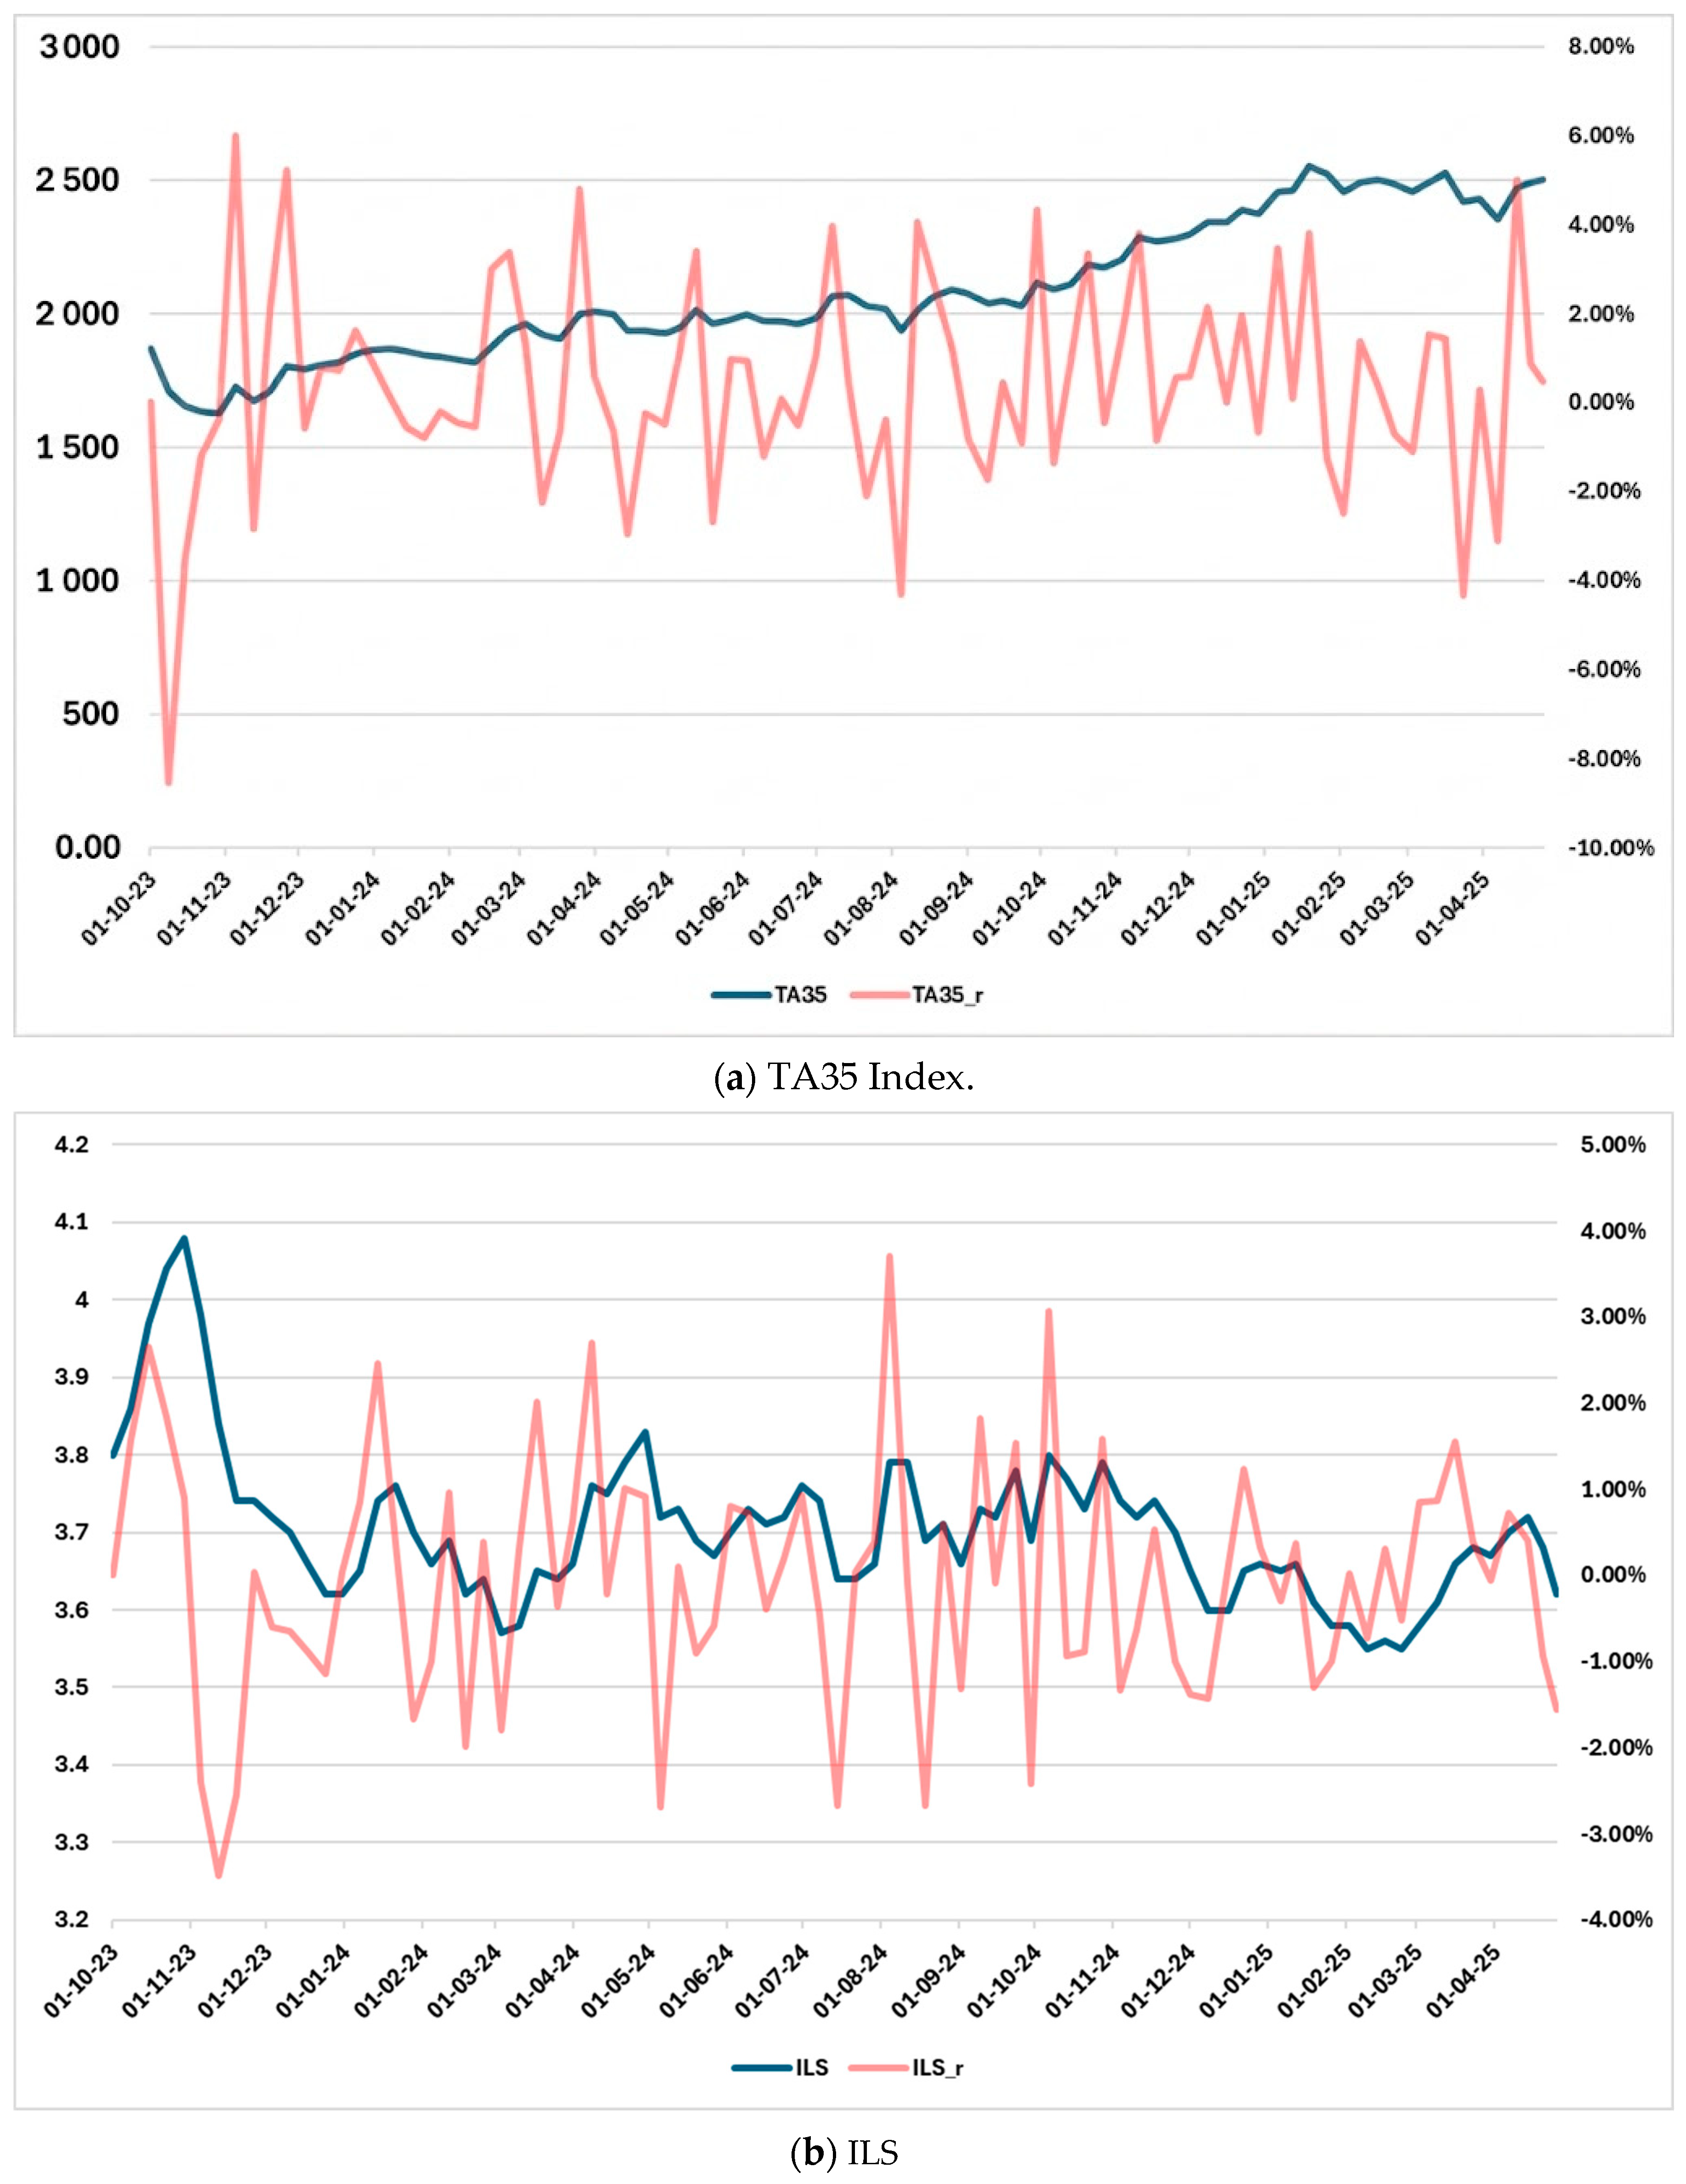
Figure 2 illustrates the performance of the TA35 index and the Israeli Shekel (ILS). A higher ILS/USD exchange rate indicates a depreciation of the ILS against the U.S. dollar, which is still widely regarded as the global reserve currency (
Aliu et al. 2023). Following the outbreak of the Gaza War in 2023, the TA35 experienced a temporary decline but later recovered, eventually showing a positive trend. Similarly, the ILS initially depreciated but later appreciated, ending the period stronger than it was before the conflict. Weekly return volatility spiked in the early weeks of the war but subsequently stabilized within a narrower range.
Table 1 presents descriptive statistics for the weekly returns of TA35 (TA35_r) and the Israeli Shekel (ILS_r). The Jarque–Bera test for TA35_r rejects normality, reflecting negative skewness and excess kurtosis, though the ADF test confirms stationarity. Negative skewness indicates that the distribution has a longer left tail, meaning extreme negative returns are more likely than extreme positive ones and that the distribution is not symmetrical. For ILS_r, tests indicate both randomness and stationarity, suggesting that an OLS model could be appropriate. However, due to the non-normality and the skewness of the TA35_r distribution—especially during the recession period—we apply the EGARCH(1,1) model to capture leverage effects and asymmetries in volatility
2. The correlation between TA35_r and ILS_r is moderate (0.41), justifying separate modeling and analysis.
Table 2 presents the descriptive statistics and correlation analysis of the Google Trends variables, offering valuable insights into public attention surrounding the Israel–Hamas conflict. The notation “(Isr)” denotes search activity originating from Israel, whereas the remaining variables capture worldwide search interest for the corresponding terms.
Google Trends reports search activity as a normalized index ranging from 0 to 100, where a value of 100 corresponds to the period of highest search intensity within the selected sample and all other observations are scaled accordingly. Therefore, the reported values reflect relative rather than absolute search volumes. An important implication of this normalization procedure is that the index is sample-dependent, meaning that changes in the observation window may alter the scaling of the series. Nevertheless, Google Trends has been widely employed in the literature as a proxy for public attention and information demand, particularly in studies examining financial markets, investor sentiment, and geopolitical events.
The descriptive statistics reveal that search terms originating from Israel generally exhibit higher mean values than their global counterparts. This finding suggests that public attention to conflict-related developments was substantially stronger within Israel than in the worldwide sample, which is consistent with expectations given the direct involvement of Israel in the conflict.
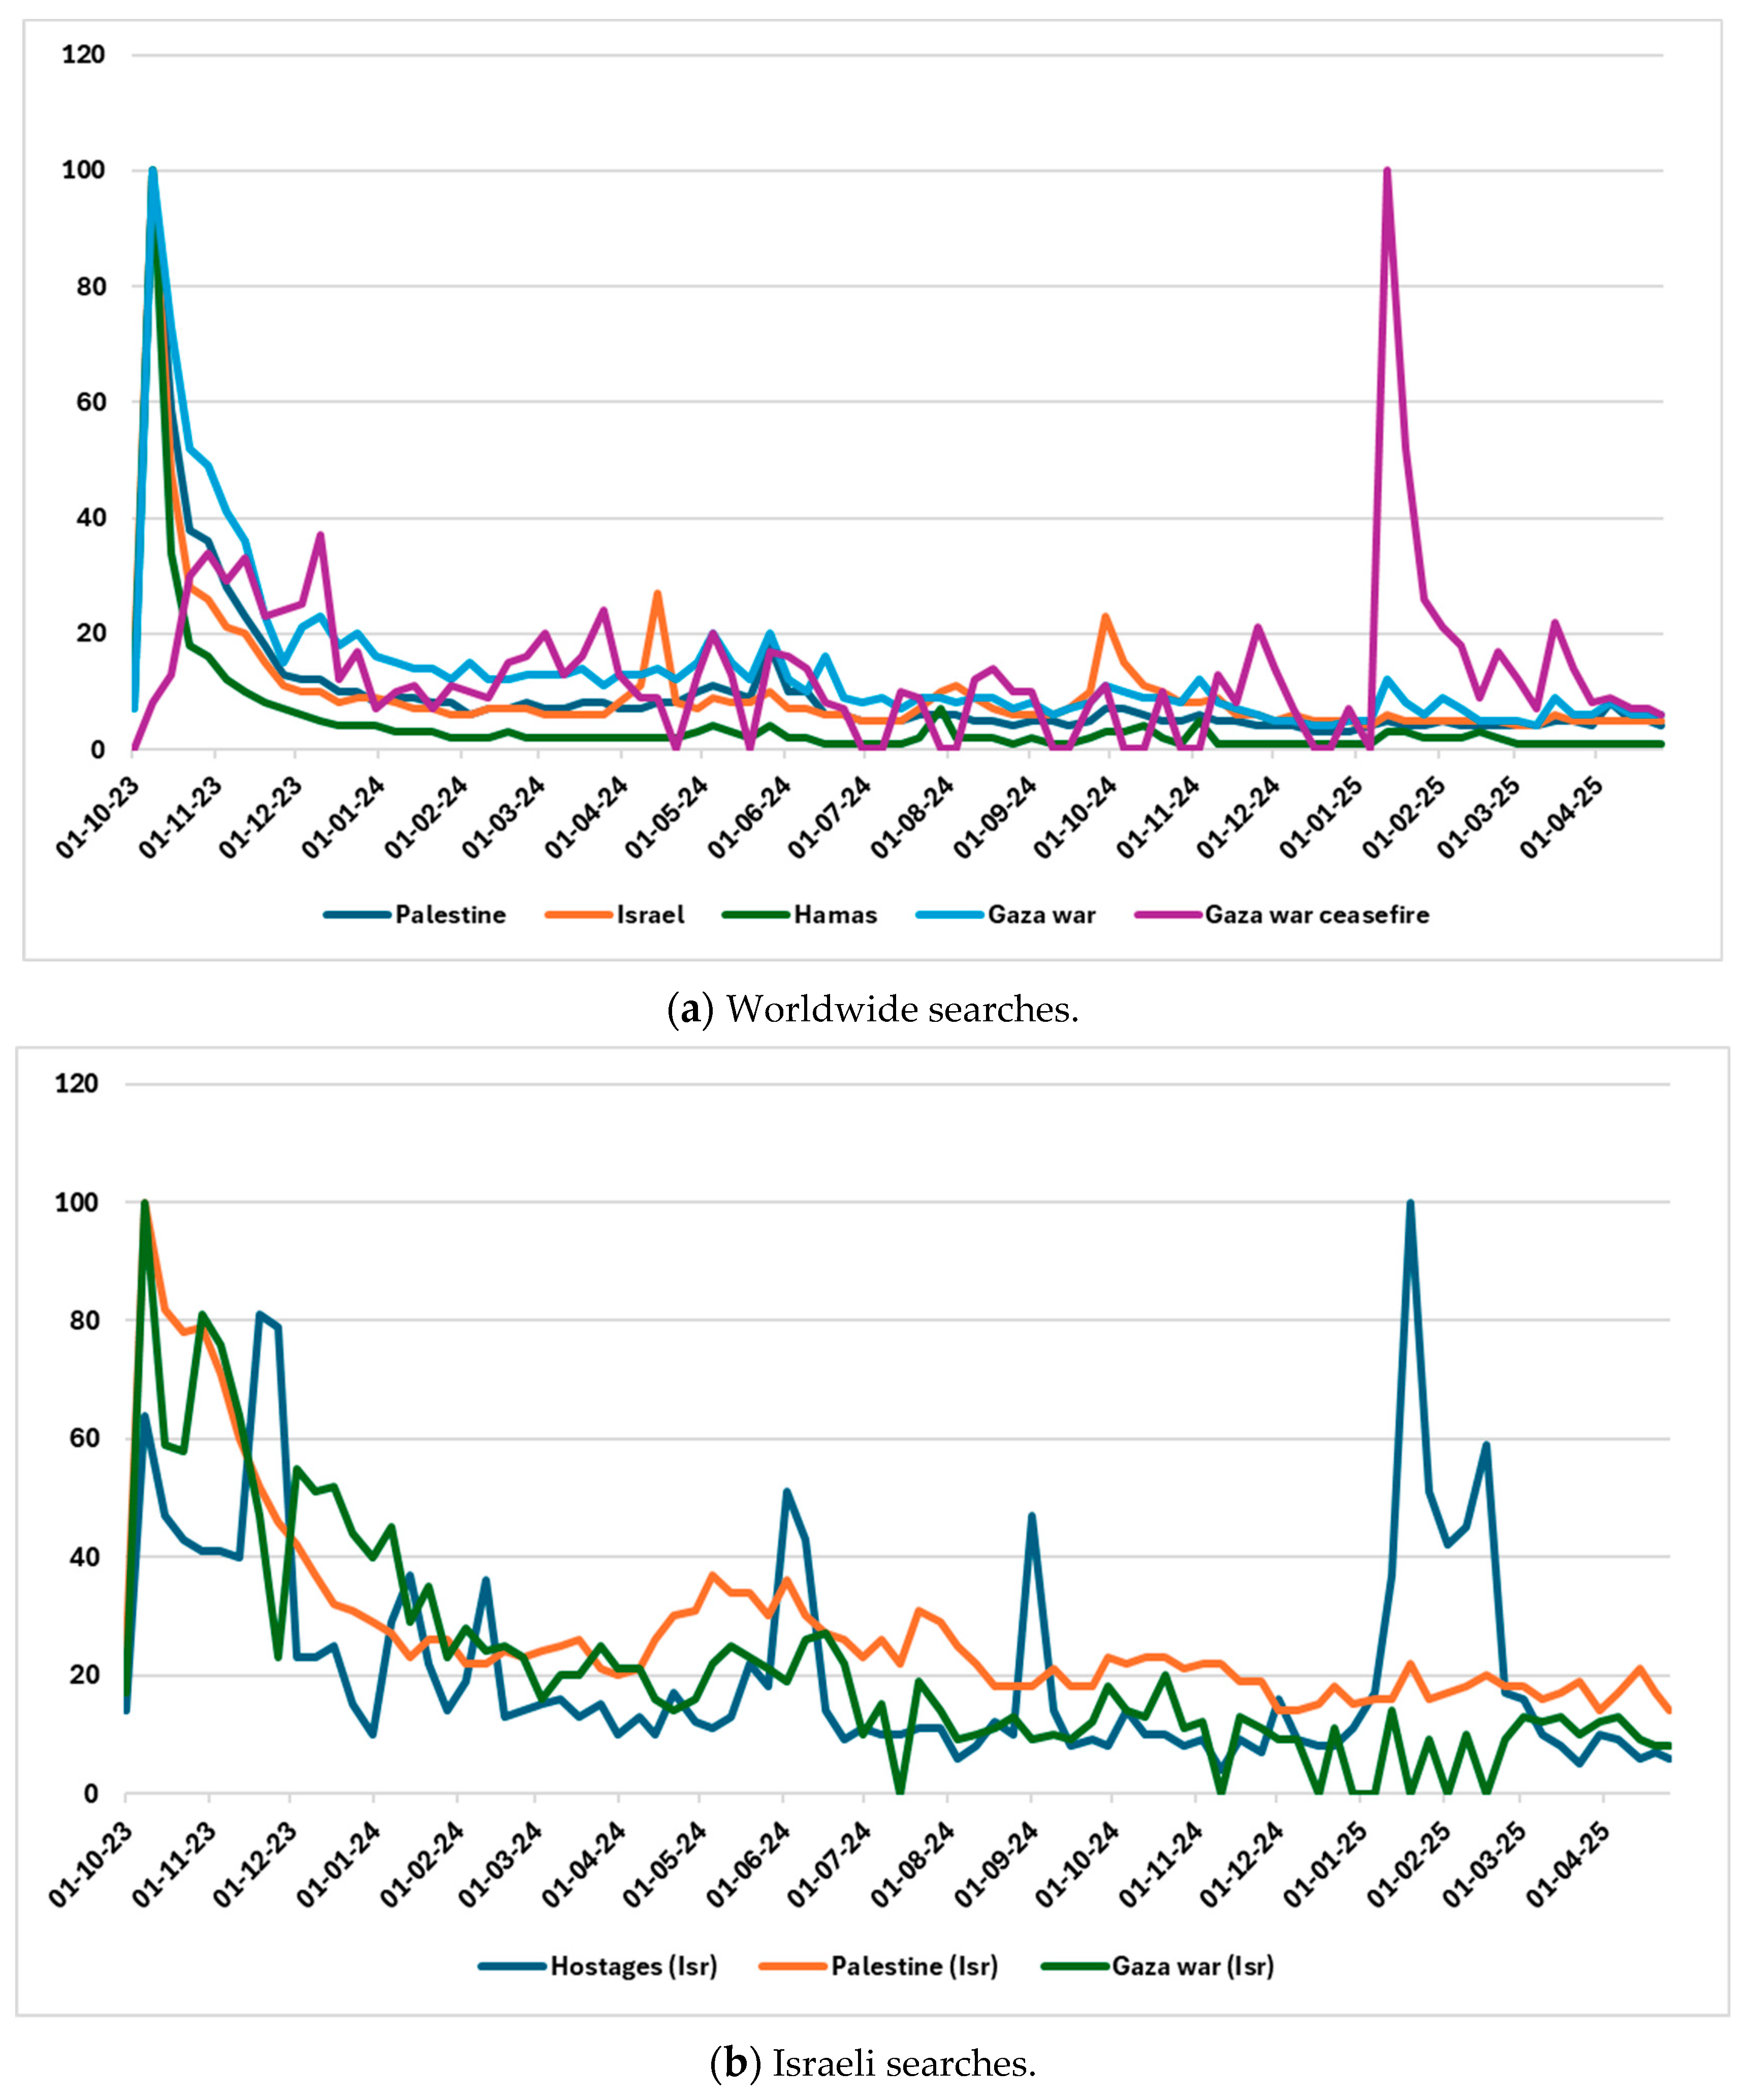
Figure 3 illustrates the evolution of Google Trends search intensity for both worldwide and Israeli search activity over the sample period.
Moreover, variables such as “Gaza war”, “Israel”, and “Palestine” exhibit notably high mean values and strong positive skewness, indicating a significant but uneven public focus. Their distributions are heavily right-skewed and leptokurtic (high kurtosis), confirming the presence of extreme peaks—suggesting that interest surged during specific high-tension periods. For instance, “Hamas” and “Israel” have exceptionally high skewness (7.12 and 5.64, respectively), pointing to abrupt spikes in attention, likely tied to breaking news or violent escalations.
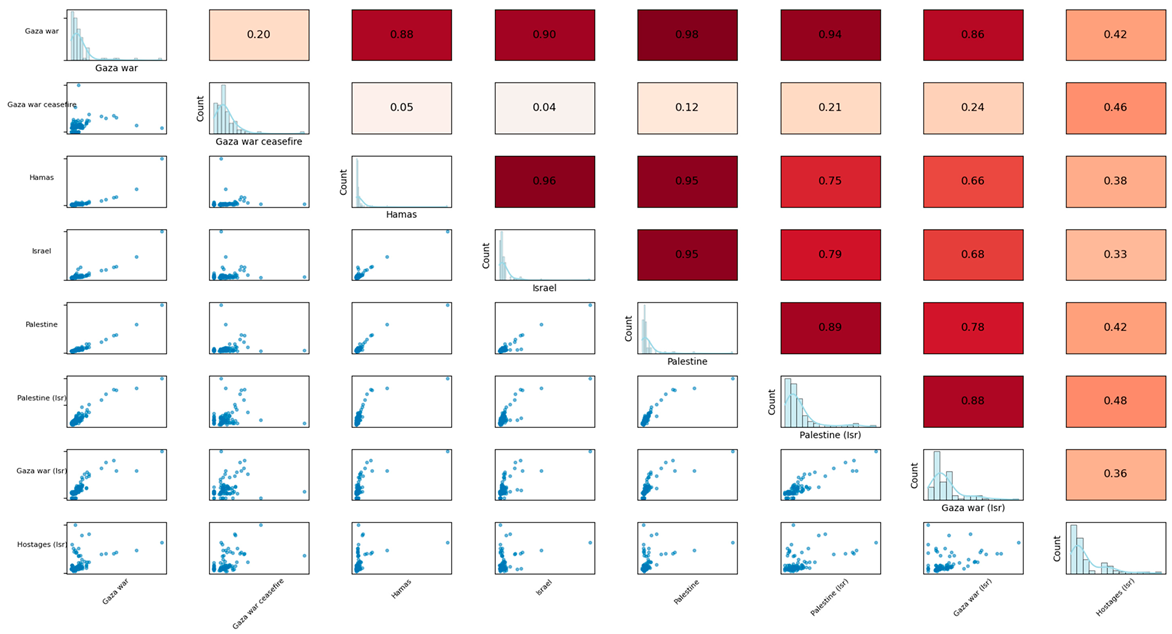
The correlation matrix reinforces this narrative. The strong correlations between “Gaza war” and both “Palestine” (r = 0.975) and “Israel” (r = 0.900) suggest that public interest in the broader war narrative is tightly interlinked with perceptions of both sides. Similarly, “Hamas” is highly correlated with “Israel” (r = 0.956) and “Palestine” (r = 0.946), indicating that spikes in searches for Hamas are strongly associated with heightened interest in the regional conflict overall. Interestingly, “Hostages_Israel”, while still positively correlated with other topics, shows weaker associations (e.g., r = 0.417 with “Gaza war”), suggesting it may represent a distinct narrative thread or a concern with different temporal dynamics. Overall, the data reflects a deeply interconnected structure of public discourse, with shared spikes in attention across actors and topics, driven by major conflict events.
4. Empirical Analysis Using Individual Variables
The objective of this study is not to construct a comprehensive asset-pricing model, but rather to investigate whether conflict-related public attention contains information relevant to Israeli financial markets during the Israel–Hamas conflict. For this reason, the empirical specifications deliberately focus on attention variables, allowing the analysis to isolate the informational role of search behavior during a period dominated by geopolitical developments.
In the previous section, we observed that, with the exception of the ILS_r variable, most variables deviate from a normal distribution due to non-zero skewness and leptokurtosis. Additionally, visual inspection suggests the potential presence of a leverage effect. In line with prior studies analyzing asset performance during wartime, we employ a GARCH(1,1) family model.
The mean equation used in our analysis is as follows:
where r
t denotes the weekly returns at time t, α
0 is the intercept, α
1 is the coefficient associated with the Google Trends index under consideration, and ε
t is the error term, assumed to be normally distributed. The subscript
i corresponds to one of the following search terms: ‘
Gaza war’, ‘
Gaza war ceasefire’, ‘
Hamas’, ‘
Israel’, ‘
Palestine’, ‘
Palestine (Isr)’
, ‘
Gaza war (Isr)’, and ‘
Hostages (Isr)’.
Although the sample is limited by the duration of the conflict period, EGARCH was selected because weekly returns exhibit strong non-normality, asymmetry, and leverage effects. Similar studies examining wartime financial behavior have employed GARCH-family models on relatively short event windows.
For model selection among GARCH variants, we relied on the Akaike Information Criterion (
Akaike 1974), the Schwarz Criterion (
Schwarz 1978), and the Hannan–Quinn Criterion (
Hannan and Quinn 1979)
3, consistent with common practice in the literature. The results favored asymmetric GARCH models—particularly the Exponential GARCH (EGARCH) model proposed by
Nelson (
1991)—as they provided a better fit due to the observed asymmetries in volatility.
The conditional variance equation for the EGARCH(1,1,1) model is given by
The logarithmic specification guarantees the non-negativity of
. A negative and statistically significant γ
1 indicates a leverage effect, while a positive and significant value reflects an anti-leverage effect. The coefficients c
1 and c
2 represent the ARCH and GARCH effects, respectively. The empirical findings are presented in
Table 3.
The EGARCH(1,1,1) estimation for TA35 weekly returns reveals meaningful differences in the statistical significance of Google Trends variables. In the mean equation, the coefficients for “Israel,” “Palestine,” and “Hamas” are statistically significant, with negative signs for the latter two, suggesting that heightened search activity related to these terms corresponds to lower market returns—likely reflecting investor anxiety during periods of conflict. The remaining variables do not exhibit significant influence on mean returns. We should highlight that the statistically significant searches are the Global, while the Israeli searches do not have a statistically significant impact.
In the conditional variance equation, all models display strongly significant asymmetry terms (γ1), all negative, confirming the presence of leverage effects—where negative shocks lead to greater volatility than positive ones. The persistence of volatility is high across specifications, as evidenced by significant and large b1 coefficients, while the α1 coefficients suggest short-term volatility response is also significant and negative. All constants in the variance equations (a0) are highly significant and negative, supporting the stability of the models under EGARCH assumptions. Comparing information criteria across models, the lowest AIC, SIC, and HQ values are associated with the model including “Palestine,” suggesting it offers the best in-sample fit among the examined search variables, and is likely the most informative predictor of TA35 return behavior during the conflict period.
Similarly, estimates for weekly ILS returns reveal important insights into how Google Trends search volumes relate to exchange rate dynamics. In the mean equation, the variables Gaza war ceasefire and Hostages (Isr) have statistically significant negative coefficients, suggesting that increased public attention to ceasefire efforts and hostage-related developments corresponds to shekel appreciation—likely reflecting perceived de-escalation or resolution of conflict. Conversely, Israel and Palestine (Isr) exhibit positive coefficients, implying that intensified search activity around these terms is associated with shekel depreciation, possibly due to heightened geopolitical concern.
Regarding the conditional volatility, we observe that in some cases γ1 > 0 and statistically significant, indicating that depreciations of the shekel (i.e., positive returns or bad news for ILS) have a greater impact on volatility than appreciations, and vice versa when γ1 < 0. The volatility persistence (c2) is notably high and significant for models like Gaza war ceasefire and Hostages (Isr), supporting their relevance for market uncertainty. Based on the information criteria (AIC, SIC, HQ), the best-fitting models are those with Israel, Hostages (Isr), and Gaza war ceasefire variables, indicating these search terms are the most informative predictors of ILS exchange rate behavior during the conflict period.
From a risk modeling perspective, the use of EGARCH specifications enables the identification of asymmetric volatility responses associated with attention shocks. This feature is particularly relevant during periods of geopolitical stress, when negative information tends to exert a disproportionate effect on market risk. By incorporating attention-based variables into conditional volatility models, the study offers a behavioral extension to traditional risk modeling approaches, allowing real-time, non-financial indicators to inform the assessment of financial risk.
In this context, the existing literature has consistently shown that advanced econometric frameworks—such as models from the GARCH family—provide more accurate estimates of financial risk compared to conventional approaches (
Angelidis et al. 2004;
Degiannakis et al. 2012). Building on these insights, the present study introduces a complementary dimension by integrating fear-related indicators, proxied by Google Trends data, into the modeling framework. This approach captures the behavioral component of risk formation and has the potential to enhance the accuracy and responsiveness of risk estimation, particularly in rapidly evolving crisis environments.
5. Empirical Analysis Using Principal Component Analysis (PCA)
In the previous section, we found that global search terms such as “Palestine” and “Hamas” were the most informative for explaining movements in the TA35 index, while terms like “Israel”, “Gaza war ceasefire”, and the Israeli search for “Hostages” were most relevant for the ILS. However, the relevance of specific search terms can vary over time depending on the unfolding of events, making it difficult to rely consistently on a fixed set of keywords. One approach is to dynamically reassess and select the most appropriate terms at each point in time. An alternative, more stable strategy is to synthesize the information from all available variables into a single index that captures their shared variation.
To achieve this, we employ Principal Component Analysis (PCA), a technique commonly used in the presence of many explanatory variables and potential multicollinearity (
Hotelling 1933;
Abdi and Williams 2010;
Wooldridge 2010;
Guironnet and Parent 2019;
Compton et al. 2025). PCA allows us to reduce dimensionality while retaining the most relevant information, automatically generating optimal weights for each component. This avoids the need to subjectively assign weights in constructing a composite index. We conduct PCA using (a) the full set of search variables to capture the maximum joint variability, and (b) separate PCA indices for global and Israeli searches to distinguish between international and domestic interest regarding the conflict.
- (a)
PCA using the whole set of the tested independent variables
We apply Principal Component Analysis (PCA) to the full set of Israeli and global search terms in order to construct a representative set of orthogonal time series that capture the underlying variability in the data. As shown in
Table 4, the Kaiser–Meyer–Olkin (KMO) measure of sampling adequacy is 0.797, well above the recommended threshold of 0.5 (
Kaiser 1974), indicating that the data are suitable for factor analysis. Furthermore, Bartlett’s test of sphericity yields a Chi-Square statistic of 1054.487 with 28 degrees of freedom and a
p-value below 0.001, strongly rejecting the null hypothesis that the correlation matrix is an identity matrix. Together, these diagnostics confirm that the dataset exhibits sufficient correlation structure and is appropriate for dimensionality reduction through PCA.
The next stage of the analysis involves examining the communalities, which represent the proportion of each variable’s variance explained by the extracted principal component. These values, reported in
Table 5, indicate how well the factor model captures the variability in each original variable. High communalities suggest that the derived PCA index provides a good representation of the underlying data. For instance, the communality for the Gaza war variable is 0.968, implying that approximately 96.8% of its variance is accounted for by the principal component. Similarly, other key terms such as Palestine (0.977), Israel (0.911), and Hamas (0.877) also exhibit strong explanatory shares. These results confirm that the constructed PCA-based index effectively summarizes the joint dynamics of the underlying search variables.
The results from the total variance explained, as shown in
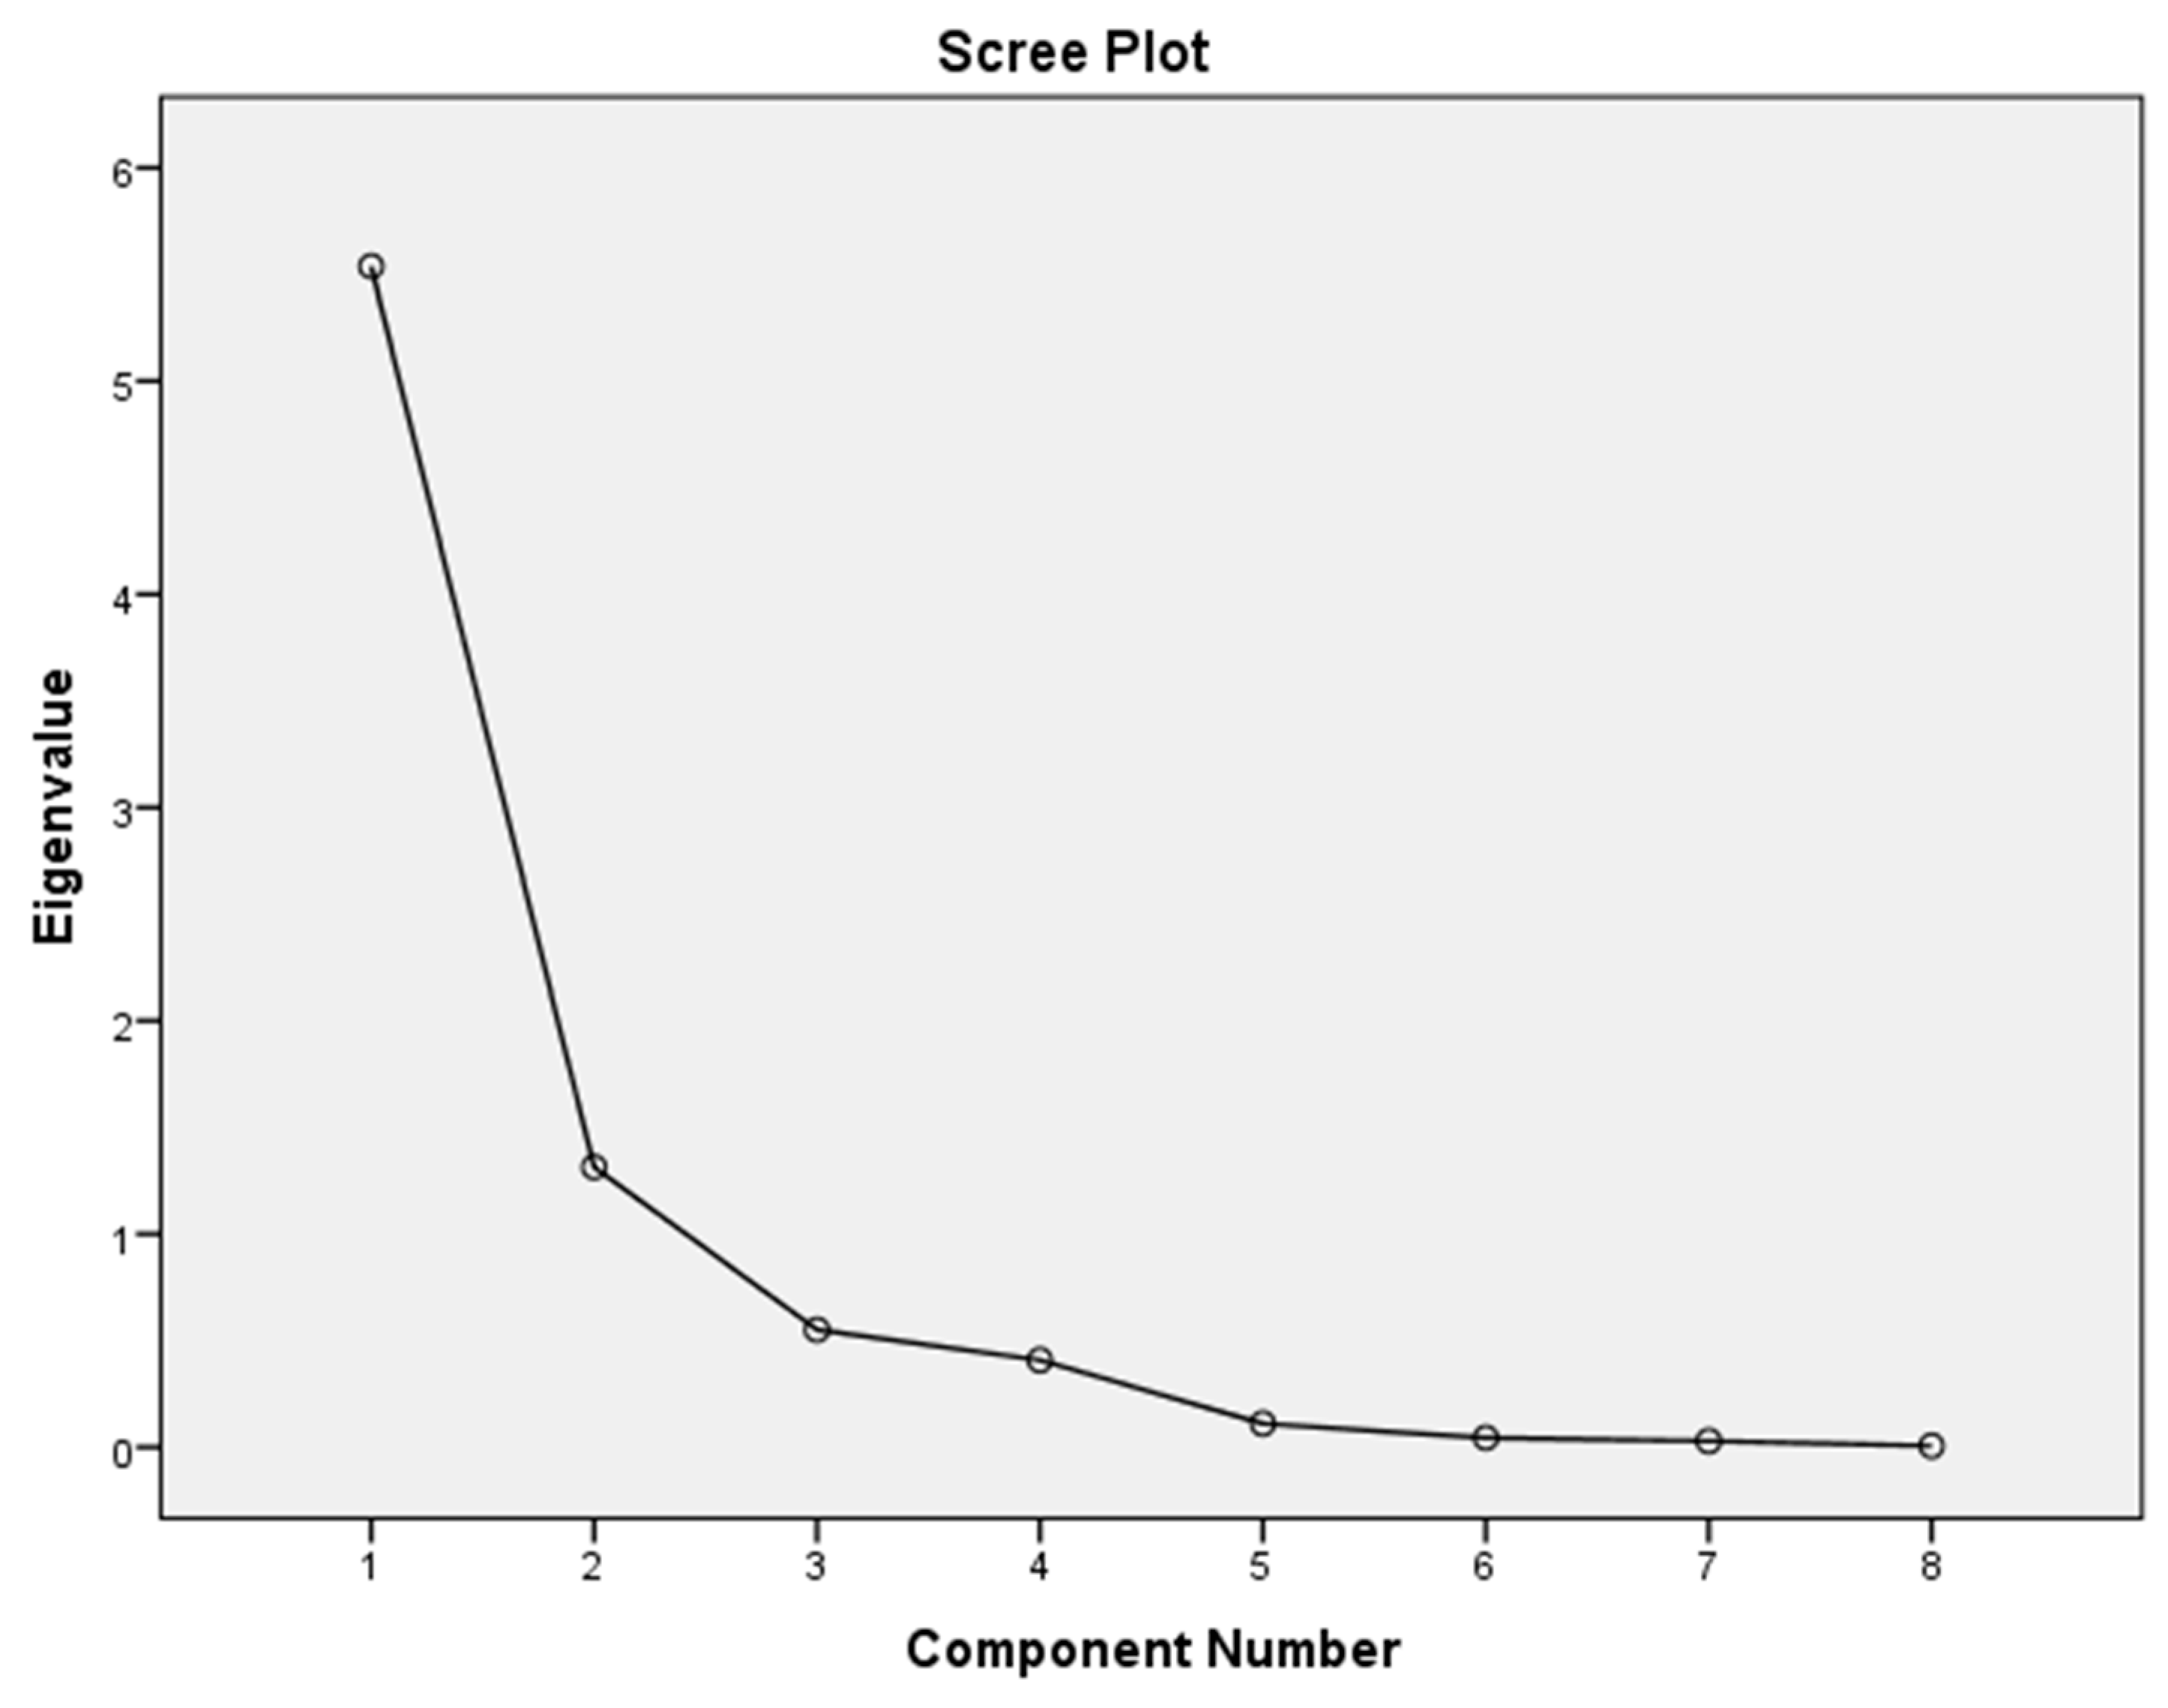
Table 6, indicate that the first principal component accounts for 69.23% of the total variance, demonstrating that a single underlying factor captures the majority of the information contained in the set of governance indicators. The sharp decline in the variance explained by subsequent components—where the second component contributes just 16.42%, and all remaining components explain less than 7% each—further reinforces the dominance of the first factor. This substantial drop supports the adequacy of a one-factor solution in capturing the core structure of the data.
Consequently, the first principal component can be interpreted as a comprehensive index that effectively summarizes the common dynamics across the underlying search variables. The first component explains the majority of variance and is sufficient for dimensionality reduction. However, because the second component possesses an eigenvalue greater than one (1.313) and represents a conceptually distinct humanitarian/ceasefire dimension, it was retained for interpretability purposes. This conclusion is visually corroborated by the scree plot in
Figure 44, which exhibits a clear inflection after the first component, consistent with the “elbow” criterion commonly used to determine the number of retained factors.
The results of the rotated component matrix, presented in
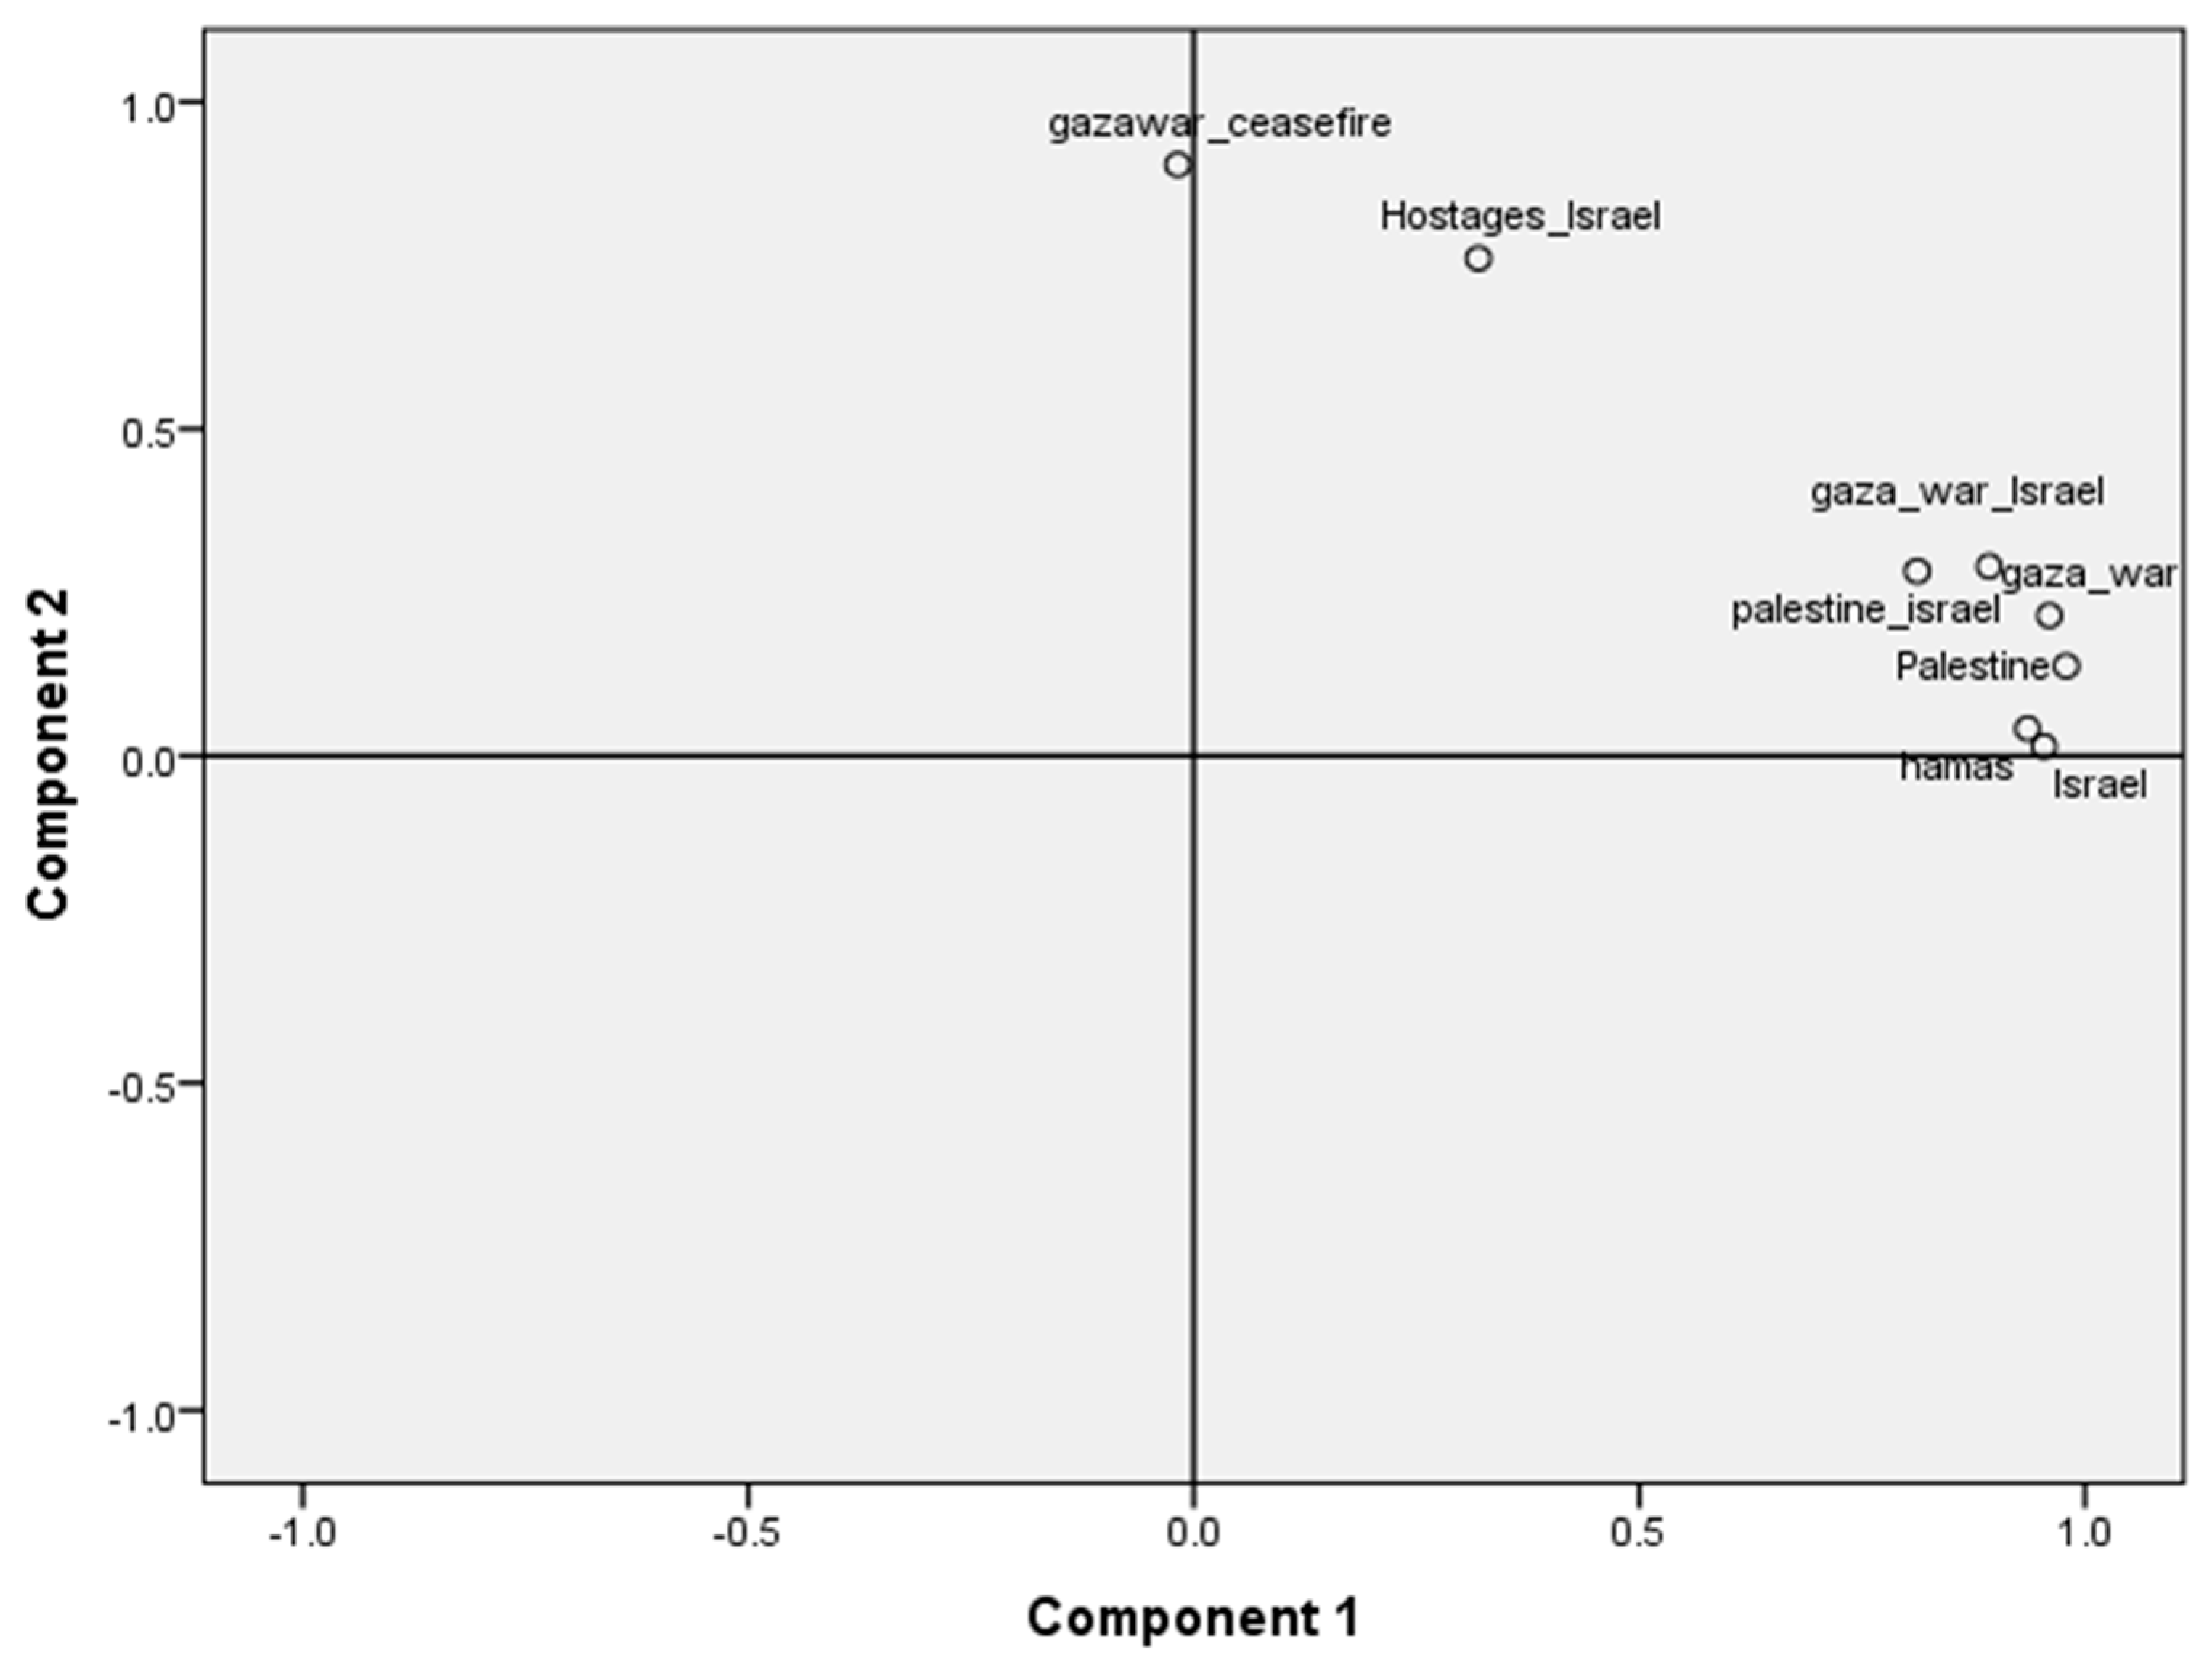
Table 7, offer valuable insights into the thematic structure underlying the set of search terms. Following Varimax rotation, two clearly distinguishable components emerge, enhancing the interpretability of the principal component analysis. Component 1 loads heavily on conflict-related terms such as “Palestine,” “Israel,” “Hamas,” and “Gaza war,” indicating a thematic cluster centered around the core dynamics of the conflict. In contrast, Component 2 is dominated by terms associated with post-conflict developments and humanitarian concerns, namely “Gaza war ceasefire” and “Hostages (Israel)”.
This rotation thus reveals meaningful and distinct dimensions within the data, capturing both the intensity of conflict and subsequent efforts toward resolution or de-escalation. The clear separation of variables into these components reinforces the robustness of the PCA in identifying latent structures across public interest, as reflected in search behavior. The final stage of the PCA analysis is the examination of the component plot in the rotated space, presented in
Figure 5. This visual representation further supports the thematic interpretation, as it shows a clear clustering of conflict-related variables, while “Gaza war ceasefire” and “Hostages (Isr)” are positioned distinctly, indicating their alignment with post-conflict or humanitarian narratives. The spatial separation in the rotated component plot thus offers additional confirmation of the dual thematic structure identified through PCA.
Following the assessment of sampling adequacy and the successful application of Principal Component Analysis (PCA), we proceed to estimate our models using the two PCA-derived indices based on the entire set of search term variables (
and
). This approach enables us to capture the broader variation in public interest—both local and global—without introducing multicollinearity. The results of these estimations are presented in
Table 8, covering both the TA35 index returns and the ILS exchange rate returns. Thus, the mean equation used in this section is as follows:
For the TA35, the first principal component (b1), which primarily reflects conflict-related interest, is negative and highly significant (at the 1% level), indicating that increased attention to conflict dynamics corresponds to declines in equity market performance. Conversely, the second component (b2), capturing de-escalation or humanitarian themes, is positively and significantly associated with stock returns, implying that investor sentiment improves when the discourse shifts toward resolution or recovery.
Regarding the ILS, the first component shows a weak but statistically significant positive effect (at the 10% level), suggesting that increased conflict-related interest may be linked to temporary depreciation (undervaluation) of the Shekel. The second component, however, does not show statistical significance, implying a limited or inconsistent impact of resolution-related interest on FX performance.
Beyond statistical significance, the estimated coefficients also suggest economically meaningful effects. Increases in conflict-related public attention are associated with non-negligible changes in both stock market returns and exchange-rate dynamics, indicating that attention shocks may have practical relevance for investors, policymakers, and risk managers. Although the primary focus of the analysis is on statistical inference, the magnitude and direction of the estimated effects suggest that public attention constitutes an important informational factor during periods of geopolitical uncertainty.
In terms of volatility dynamics, the TA35 model displays a statistically significant negative asymmetry coefficient (γ1), confirming the presence of leverage effects—where negative shocks (bad news or increased uncertainty) lead to greater volatility compared to positive shocks. The ILS model, on the other hand, does not exhibit statistically significant variance dynamics, indicating a more stable volatility pattern in response to search interest during the sample period. Autocorrelation and ARCH LM test results suggest that the models are well-specified, with no significant serial correlation or heteroskedasticity remaining in the residuals. Overall, these findings underscore the value of PCA in distilling complex public attention measures into interpretable indices that meaningfully influence financial market behavior.
- (b)
Empirical Analysis Using Separate PCA Indices for Israeli and Global Searches
The previous analysis, based on the full set of search terms, revealed a clear separation between humanitarian-related and conflict-related components. To further explore these dynamics, we now conduct separate PCA analyses using only the Global Search terms in one case and only the Israeli Search terms in another.
As shown in
Table 9, both datasets exhibit strong sampling adequacy (KMO > 0.5) and highly significant Bartlett’s tests (
p < 0.001), confirming that the correlation matrices are suitable for PCA.
Table 10 further supports this by presenting high communalities (generally > 0.8), indicating that the extracted components successfully explain the majority of the variance in the underlying variables across both global and Israeli searches.
Table 11 presents the Eigenvalues of the Principal Component Analysis. For the Global searches case, the first principal component accounts for 76.3% of the total variance, indicating a dominant underlying factor in global search interest related to the conflict. The second component adds another 20.1%, bringing the cumulative variance explained to over 96%, which suggests a strong two-factor structure that captures nearly all variability in the dataset.
For Israeli search data, the first component explains 72.7% of the total variance, indicating a similarly strong unidimensional pattern. The steep drop-off to the second component (23.6%) supports a simpler structure, where the first component alone captures the majority of the information, reinforcing its robustness for summarizing local search behavior.
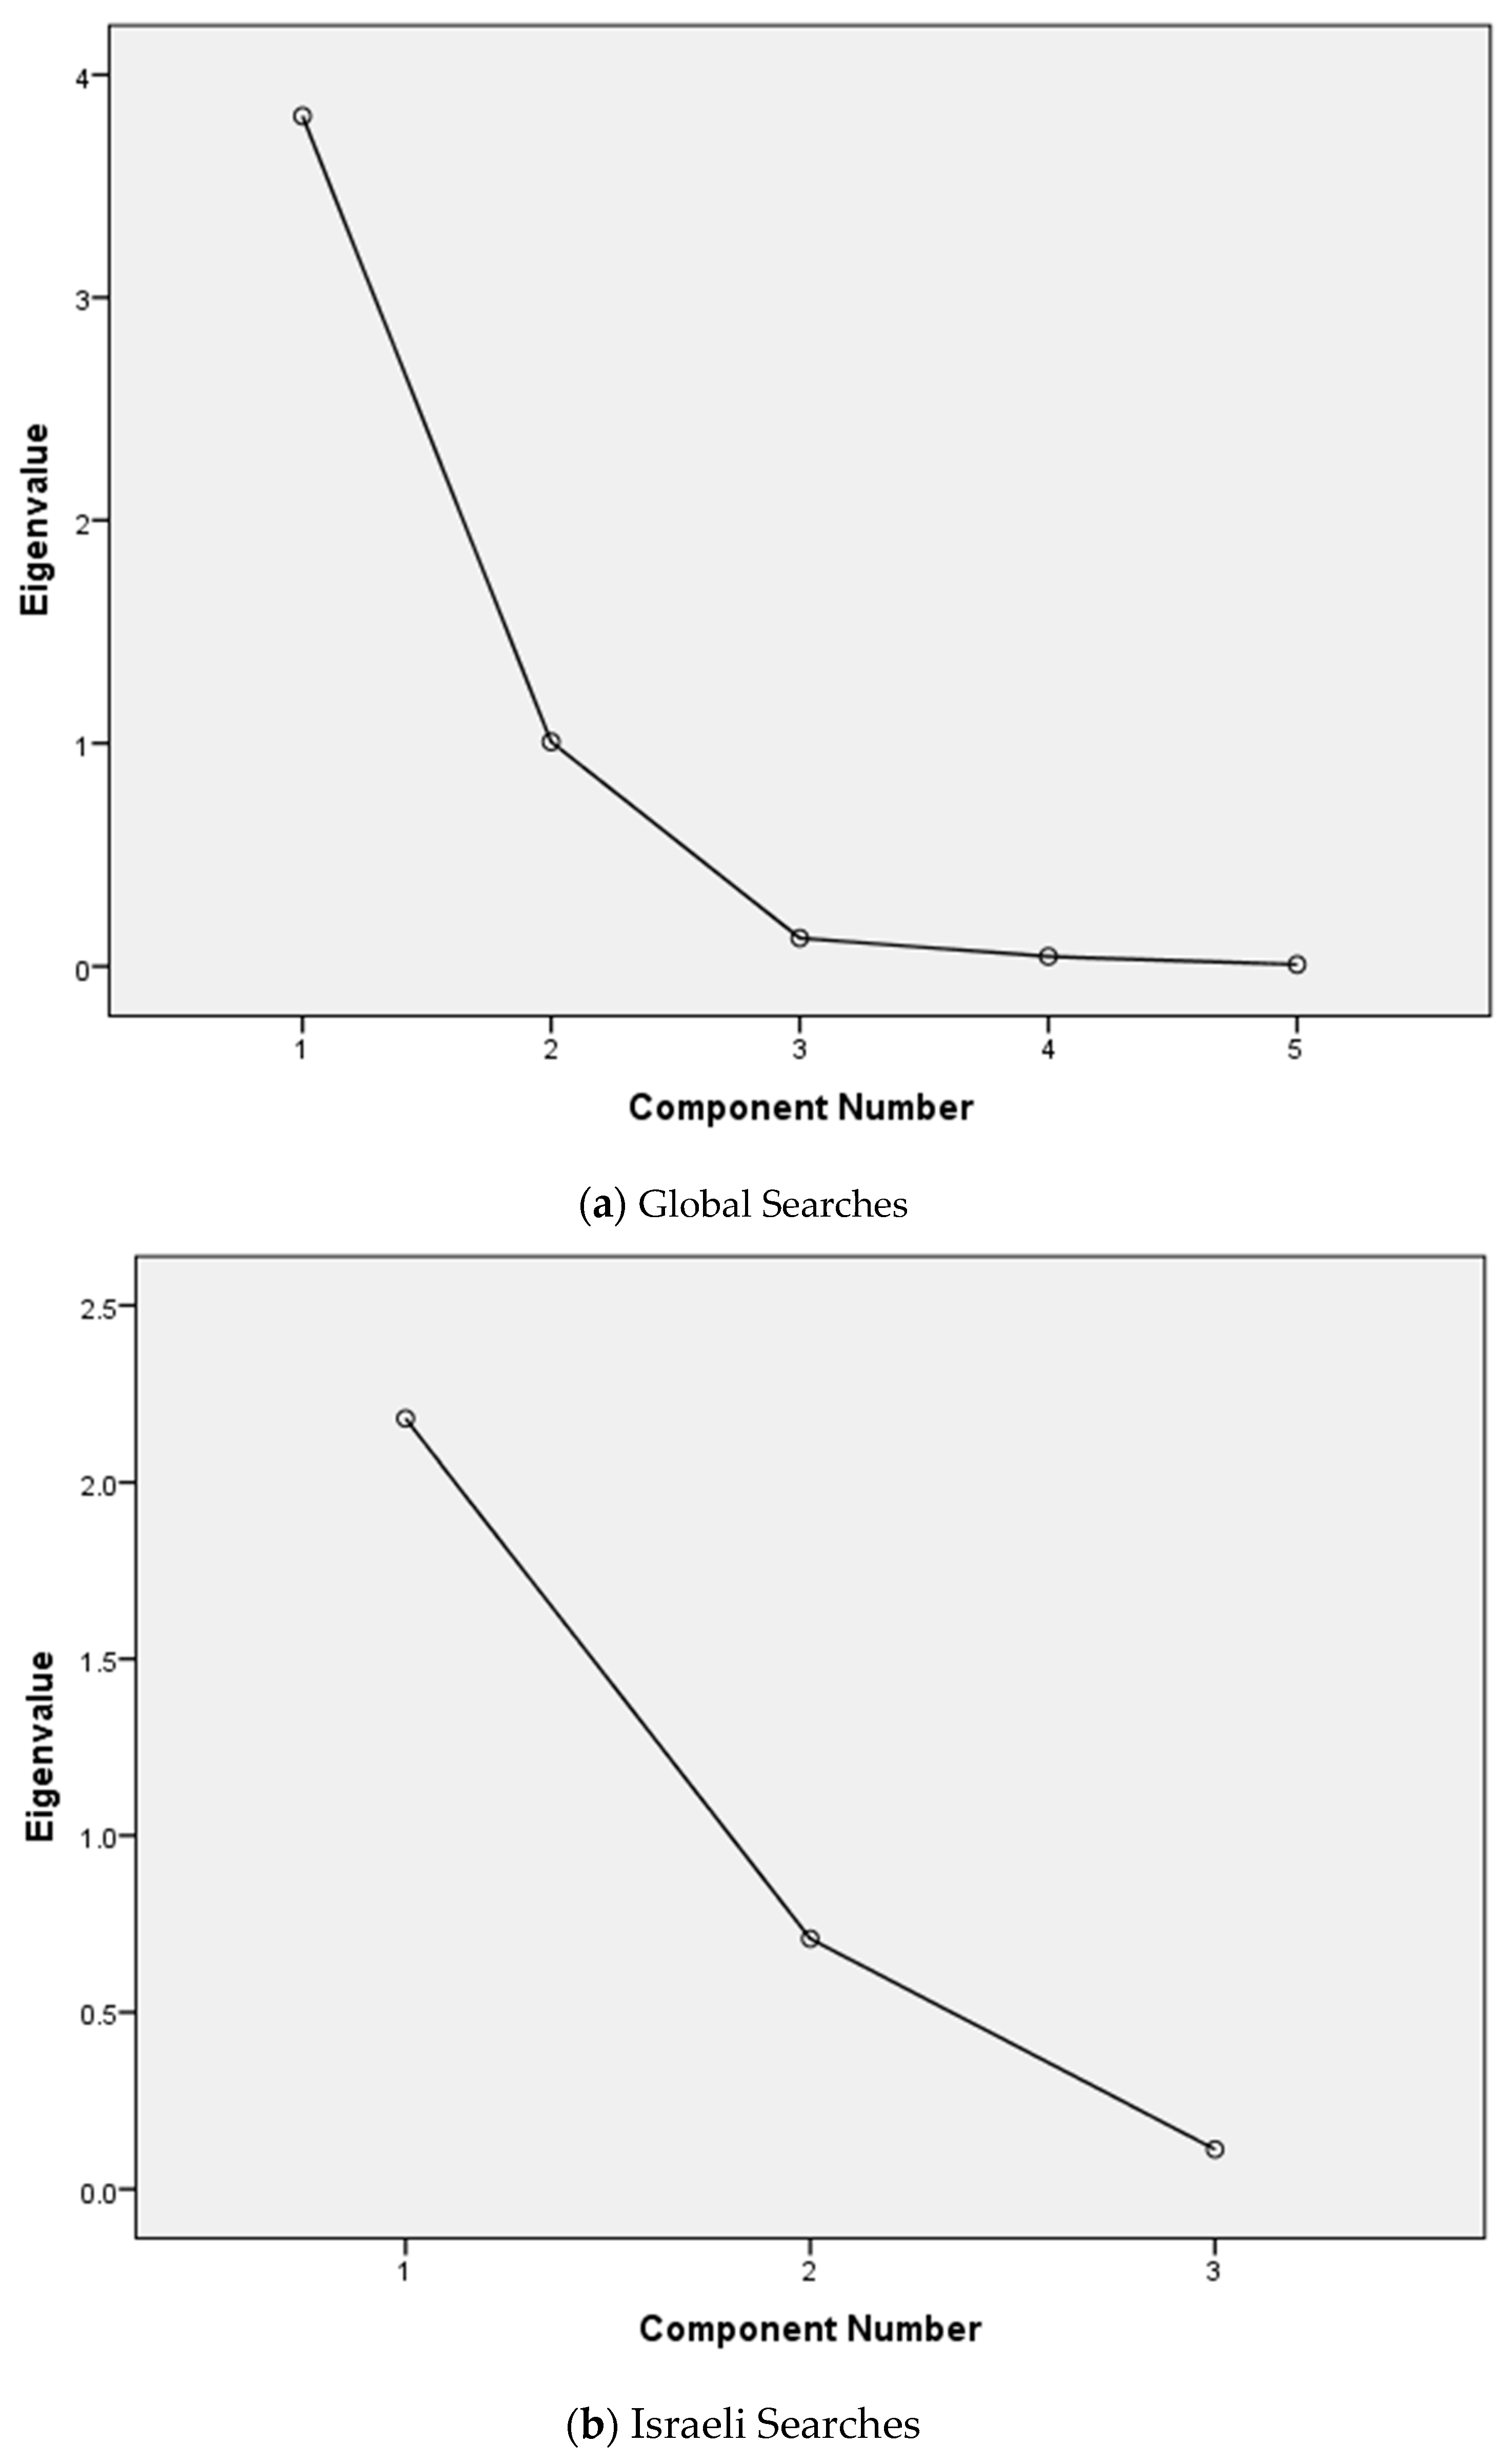
Figure 6 is the Scree Plot of Eigenvalues after PCA. The Global scree plot shows a sharp decline after the first two components, forming a clear “elbow” that supports a two-factor solution. This visual confirmation aligns with the eigenvalue results, suggesting that most of the variance in global search behavior can be captured by the first two components. The scree plot for Israeli searches reveals a steep drop after the first component, indicating a dominant single-factor structure. The minimal contribution of additional components confirms that a unidimensional index sufficiently summarizes domestic search dynamics related to the conflict.
Finally, regarding the PCA analysis,
Table 12 presents the Component Matrix. The matrix for the Global searches reveals two distinct thematic components. The first component loads heavily on conflict-related terms (“Gaza war,” “Hamas,” “Israel,” “Palestine”), suggesting a strong association with general war intensity and geopolitical interest. The second component is dominated by “Gaza war ceasefire,” indicating a separate dimension tied to conflict resolution or peace-related narratives. The Israeli search component shows strong loadings for “Palestine (Isr)” and “Gaza war (Isr),” reflecting domestic concern with territorial and conflict issues. “Hostages (Isr)” loads moderately, suggesting it shares variance with the broader conflict theme but also reflects a more humanitarian or specific concern.
Having constructed the new indices from the PCA,
Table 13 presents their correlation matrix. The results show a strong positive correlation between the first global component and the Israeli component (ρ = 0.800), suggesting that global concern with conflict-related issues closely mirrors domestic search behavior. In contrast, the second global component is nearly uncorrelated with the others, highlighting its thematic distinctiveness, likely associated with post-conflict or humanitarian narratives.
Although the correlation between PCA_1Global and PCAIsraeli is relatively high, additional diagnostic tests indicate that multicollinearity does not pose a serious concern for the empirical analysis. Specifically, the VIF values remain below the conventional threshold of 5, with VIF values of 3.45 for PCA_1Global, 1.38 for PCA_2Global, and 3.83 for PCAIsraeli. These results suggest that the explanatory variables do not exhibit problematic levels of multicollinearity and can therefore be included simultaneously in the regression model without compromising the reliability of the coefficient estimates.
We proceed by estimating EGARCH(1,1) models using these indices as explanatory variables. The specification of the mean equation is adjusted as follows:
where
and
are the PCA indices 1 and 2 that were derived from the Global searches, and
is the PCA index that was derived from the Israeli searches. The results of these models are presented in
Table 14.
Table 14 shows that the first global PCA component (PCA
1_Global) has a statistically significant negative effect on TA35 returns and a positive effect on ILS returns. This suggests that increased global concern about conflict-related issues tends to depress equity market performance while leading to ILS depreciation—a plausible outcome when international sentiment turns risk-averse. The Israeli PCA index, by contrast, has a positive effect on TA35 returns and a negative, highly significant appreciation effect on ILS returns. One interpretation could be that domestic awareness might trigger confidence-building policy actions or reflect internal resilience, supporting the currency. In contrast, the more remote but amplified global concern exerts negative financial pressure.
On the volatility side, the TA35 model exhibits a significant negative asymmetry coefficient (γ1), confirming the presence of a leverage effect—where bad news raises volatility more than good news. The ILS model shows no such significant asymmetry, indicating a more symmetric volatility response. Both models pass the Q-statistic and ARCH LM tests, with low Akaike and Schwarz values supporting the robustness of model specification.
We observe that while the proposed model demonstrates robustness, it does not outperform the previously presented single-index models when evaluated using information criteria (see comparison between
Table 3 and
Table 14). However, it is important to highlight that the approach of constructing separate PCA indices from domestic and international Google search data does outperform the initial PCA model that used the full set of search indices in a single procedure (compare
Table 8 and
Table 14).
Building on this insight, we refine the model further by excluding the second global PCA index,
, from the mean equation, as it was found to be statistically insignificant. The adjusted mean equation is now specified as follows:
The results of this revised model are presented in
Table 15.
Table 15 confirms that the exclusion of the non-significant term enhances model parsimony without compromising performance. All remaining explanatory variables are statistically significant at conventional levels, and the model passes key diagnostic tests for autocorrelation and ARCH effects. Furthermore, improvements in information criteria (Akaike, Schwarz, and Hannan–Quinn) suggest a better overall fit compared to the more complex specification.
These findings reinforce the value of PCA in capturing latent dimensions of public interest in conflict-related topics. Importantly, the model performs more effectively when the PCA inputs are separated into global and domestic search behavior, reflecting distinct thematic emphases and impacts on financial markets. Finally, removing statistically insignificant components further improves model accuracy and interpretability, making this approach a compelling alternative to more cumbersome variable-by-variable selection methods.
6. Concluding Remarks
This study explores how public attention, as proxied by Google search trends during the Israel–Hamas conflict (October 2023 to April 2025), influences key Israeli financial indicators—namely, the TA35 equity index and the ILS exchange rate. By incorporating both global and domestic search interest, we examine whether the origin of attention differentiates its financial impact.
Initial EGARCH(1,1) estimations using individual search terms indicate that global search terms such as “Israel,” “Palestine,” and “Hamas” significantly affect TA35 returns, with negative coefficients suggesting that heightened global concern is associated with declining market performance. In contrast, Israeli-originated searches show limited explanatory power in the mean equations. For ILS returns, searches related to ceasefires and hostages are associated with appreciation, while terms such as “Israel” and “Palestine (Isr)” correspond to depreciation—highlighting the nuanced interpretation investors place on different aspects of the conflict.
To enhance robustness and interpretability, we employ Principal Component Analysis (PCA) to synthesize the high-dimensional search data into a set of latent thematic indices, separately for global and Israeli searches. The PCA results reveal distinct components corresponding to conflict and humanitarian narratives, while correlation analysis confirms that these indices can be jointly included without multicollinearity concerns.
The final models—based on PCA-derived indices—offer more parsimonious and stable estimations. Global attention consistently exerts a negative and statistically significant effect on TA35 returns and ILS valuation, reflecting the sensitivity of financial markets to international geopolitical sentiment. In contrast, domestic attention appears to play a stabilizing role, being positively associated with equity returns and currency appreciation. This divergence suggests that local search behavior may reflect greater resilience or confidence in managing the economic consequences of the conflict.
Furthermore, models based on separate PCA decompositions for global and domestic searches outperform those based on a unified index, both in explanatory power and information criteria. The exclusion of statistically insignificant components further improves model parsimony without reducing explanatory capacity.
Overall, the findings underscore the economic relevance of digital public sentiment during periods of geopolitical stress. The proposed framework, combining attention-based indicators with dimensionality reduction techniques, offers a replicable and real-time approach for analyzing how public interest translates into financial market dynamics.
From a financial risk perspective, the results further highlight the importance of incorporating behavioral indicators into risk assessment frameworks. Attention-driven shocks influence not only returns but also volatility, particularly through asymmetric responses to negative information, which become more pronounced during crisis periods. By integrating EGARCH models with real-time attention measures, risk can be more effectively captured when behavioral factors are taken into account, providing a forward-looking complement to traditional approaches.
While the findings provide evidence that conflict-related public attention contains valuable information for understanding financial market behavior during periods of geopolitical stress, several limitations should be acknowledged. The empirical analysis focuses primarily on attention-based indicators derived from Google Trends, consistent with the study’s objective of examining the informational role of public attention during the Israel–Hamas conflict. However, financial markets are also influenced by a broader set of economic and financial factors, including global risk sentiment, commodity price fluctuations, monetary conditions, and other geopolitical developments. Consequently, the reported relationships should be interpreted as evidence of statistically significant associations rather than definitive causal effects.
An additional limitation relates to the construction of Google Trends data. Since search intensity is reported as a normalized index rather than absolute search volume, the values are inherently dependent on the selected sample period. Consequently, changes in the observation window may affect the scaling of the underlying series, although not necessarily the relative patterns of attention captured by the index.
Future research may build upon the proposed framework by incorporating additional macroeconomic and financial control variables, alternative measures of geopolitical uncertainty, and complementary sources of public attention and sentiment, such as social media platforms, Wikipedia activity, and textual news-based indicators. Such extensions could further enhance the robustness of attention and sentiment measurement and contribute to a deeper understanding of how collective information demand shapes financial market dynamics during periods of geopolitical crisis.