1. Introduction
Political events can affect financial markets by changing asset prices, market volatility, and investor decisions. Empirical studies on political uncertainty generally show that higher perceived political instability is linked to lower stock returns and higher volatility in financial assets (
Arouri et al. 2016;
Agoraki et al. 2022). Political and trade-related events can indeed act as significant exogenous shocks, influencing macroeconomic expectations, regulatory frameworks, and the stability of international economic relations. These shocks propagate across borders through various mechanisms, including trade linkages, financial exposure, and shifts in global risk sentiment (
Mei and Guo 2004;
Dungey et al. 2018;
Cunha and Kern 2022).
This study examines the reaction of G7 stock markets to two major U.S.-centred events, treated as distinct types of exogenous shocks, i.e., the U.S. presidential election held on 5 November 2024 and President Trump’s 2 April 2025 announcement of “reciprocal tariffs” (the so-called Liberation Day). We classify these events as an uncertainty shock and an action shock, respectively. In this context, the uncertainty shock is associated with a political event whose consequences remain highly uncertain even after the outcome is known, whereas the action shock is associated with a discrete policy move with immediate price relevance. While both events originated in the United States, their global relevance is evident. The U.S. economy plays a central role in international trade, financial markets, and global capital allocation. Consequently, shifts in U.S. political and trade policy can affect other G7 economies through multiple channels, including export exposure, multinational corporate earnings, exchange rate adjustments, and portfolio rebalancing. However, the magnitude and nature of these effects are likely to be heterogeneous, reflecting differences in economic structure, financial integration, and sectoral composition of stock indices.
Methodologically, this paper employs a Dynamic Conditional Correlation GARCH (DCC-GARCH) model. This approach captures changes in both conditional volatility and time-varying cross-market correlations between the U.S. market and each of the remaining G7 leading stock indices. Specifically, we estimate six USA-G7 country pairs and analyse the two exogenous shocks separately.
The main contribution of this study is threefold. First, it introduces a comparative shock-based perspective by distinguishing between two conceptually different U.S.-centred exogenous shocks, i.e., an uncertainty shock, represented by the 2024 U.S. presidential election, and an action shock, represented by the 2 April 2025 reciprocal tariff announcement. By separating a shock that primarily alters expectations and perceived uncertainty from a shock that reflects a realised policy intervention with immediate economic relevance, this paper does not treat political and policy-related events as a homogeneous class of disturbances. Second, using a DCC-GARCH model, this study measures how each shock changes conditional volatility and time-varying cross-market correlations between the United States and the other G7 stock markets. Third, by estimating six USA-G7 pairs and analysing both shocks separately, it documents cross-country differences in dynamic dependence and provides new, event-specific evidence on how different exogenous shocks shape international equity market synchronisation that is relevant for cross-border risk assessment and diversification.
This paper is organised as follows:
Section 2 presents the literature review, followed by
Section 3—methodology, then
Section 4—results and discussion, and finally
Section 5—our conclusions.
2. Literature Review
Exogenous shocks are widely treated as drivers of financial market dynamics because they reshape expectations about future cash flows, discount rates and risk premia (
Antonakakis et al. 2013). In globally integrated systems, such shocks are rarely contained within national borders, but spread through trade linkages, financial exposures and shifts in risk sentiment, with contagion and spillover mechanisms documented across crises and normal times (
Baig and Goldfajn 1999;
Bekaert et al. 2014;
Diebold and Yilmaz 2009). Political shocks form an important subset of these disturbances, encompassing elections and policy changes, and their relevance has been linked to globalisation, geopolitical tensions and populist movements (
Gordell and Volgy 2022;
Chan 2025).
To model the transmission of political and trade events to equity markets, it is important to distinguish between shocks that primarily raise uncertainty and those that reflect a realised policy action. Uncertainty shocks are commonly defined as discrete increases in the dispersion of expectations about future macroeconomic or policy conditions, consistent with Knightian uncertainty, in which probabilities are not precisely known (
Jurado et al. 2015;
Bloom 2009). In empirical work, uncertainty is often proxied by broad indicators such as economic policy uncertainty (
Baker et al. 2016), and structural approaches separate uncertainty-driven disturbances from other macro-financial shocks (
Dery and Serletis 2023;
Basu and Bundick 2017). By contrast, action shocks refer to discrete and observable decisions that constitute an immediate policy intervention with direct price relevance. Relative to uncertainty shocks, their effects are typically more readily identifiable, because the decision itself is clear and the likely direction of its impact can be assessed more promptly, even if the magnitude of second-round effects remains uncertain (
Kuttner 2001;
Rigobon and Sack 2004;
Basu and Bundick 2017;
Bauer et al. 2022).
In this study, we treat the U.S. presidential election held on 5 November 2024 as an uncertainty shock, and we treat the 2 April 2025 announcement of “reciprocal tariffs” as an action shock.
Uncertainty shocks are typically defined as sudden increases in uncertainty about future macroeconomic and policy conditions, which raise perceived risk in financial markets (
Jurado et al. 2015;
Bloom 2009). In equity markets, this channel is commonly linked to lower valuations and higher required returns, because policy-related uncertainty can generate a systematic risk premium that investors cannot easily diversify away (
Pástor and Veronesi 2012,
2013). At the same time, uncertainty shocks are often reflected in higher implied and realised volatility, and their effects can be amplified when financial frictions weaken balance sheets and tighten overall financial conditions (
Jurado et al. 2015;
Arellano et al. 2019;
Lin et al. 2025). Elections are a good example of such a shock because they can either resolve uncertainty or intensify it, and international evidence shows that election timing is associated with changes in returns and volatility (
Pantzalis et al. 2000;
Białkowski et al. 2008). In the United States, presidential elections have also been linked to movements in implied volatility consistent with election-related political uncertainty (
Goodell and Vähämaa 2013). Recent evidence directly treats the 2024 U.S. presidential election cycle as a prominent uncertainty episode and shows that the pre-election period is priced as an uncertainty shock (
Flynn and Tarkom 2025).
Action shocks are usually understood as discrete policy actions or decisions that are observable and can trigger an immediate market response because they directly change economic conditions relevant for pricing (
Kuttner 2001;
Rigobon and Sack 2004). This is consistent with research that treats policy shocks as realised interventions and separates them from uncertainty about future states or policy paths (
Basu and Bundick 2017;
Auerbach et al. 2024;
Dery and Serletis 2023). Empirical studies show that such decisions can lead to rapid asset revaluation by altering expected payoffs, especially when the decision arrives as a surprise and stock markets adjust in narrow announcement windows (
Bauer et al. 2022;
Klick 2025;
Kuttner 2001;
Rigobon and Sack 2004). Trade policy decisions can be treated as an action shock because tariffs change effective costs and market access, which matters for firms with international exposure and can induce portfolio rebalancing. Evidence from the Trump trade war documents measurable effects on U.S. financial markets (
Chen et al. 2023), and related studies highlight the role of trade policy and value chains in shaping market outcomes (
Blanchard et al. 2026). The trade policy literature also explicitly separates uncertainty from decision or news components, supporting the idea that realised trade actions should be analysed separately from trade policy uncertainty (
Caldara et al. 2020;
Graziano et al. 2024).
In the literature, the impact of shocks on equity markets has been examined from several perspectives, ranging from effects on price levels and return dynamics to price volatility and conditional variance, and from changes in cross-market dependence, measured by correlations in returns and in conditional volatilities. Some studies focus on price-level responses, reporting that political and policy-related shocks affect equity valuations and generate time-varying risk premia (
Pástor and Veronesi 2012,
2013;
Brogaard and Detzel 2015;
Pantzalis et al. 2000;
Chiang 2019). Other studies shift attention from average returns to the structure of price interdependence, showing that shocks are associated with stronger co-movements across markets, particularly in stress regimes (
Longin and Solnik 2001;
Forbes and Rigobon 2002). Other research investigates volatility responses, consistently finding that both uncertainty-related and policy-driven shocks lead to increases in return volatility and persistent volatility clustering, producing sharp, though heterogeneous, spikes in realised or implied volatility (
Bloom 2009;
Ederington and Lee 1993;
Białkowski et al. 2008;
Goodell and Vähämaa 2013;
Liu and Zhang 2015). Other studies separate realised volatility from conditional volatility, for which ARCH/GARCH models are applied (
Engle 1982;
Bollerslev 1986;
Engle and Ng 1993;
Glosten et al. 1993).
Moreover, the analysis of shock transmission across financial markets increasingly relies on multivariate GARCH models with time-varying conditional correlations, and DCC-type specifications have become standard tools for studying how dependence structures evolve during periods of heightened uncertainty.
Engle (
2002) introduces the Dynamic Conditional Correlation (DCC) model as an approach that combines univariate GARCH dynamics for conditional variances with a flexible parametric structure for correlations. He shows that correlations vary substantially over time and tend to increase during turbulent market conditions.
Tse and Tsui (
2002) propose a closely related multivariate GARCH model with autoregressive dynamics in the conditional correlation matrix, emphasising its ability to capture changes in cross-market dependence while preserving positive definiteness.
Bauwens et al. (
2006), in their survey of multivariate ARCH and GARCH models, stress that allowing for time-varying correlations is essential for modelling volatility spillovers and co-movements generated by common shocks across markets. Applications link time-varying correlations to uncertainty and implied volatility (
Antonakakis et al. 2013), document correlation increases during global turmoil (
Bekaert et al. 2014;
Akhtaruzzaman et al. 2021), and show that geopolitical events can affect dynamic conditional correlations in G7-related settings (
Lakhal and Zorgati 2025). Given the documented international transmission of U.S. shocks to G7 equity markets (
Hanisch and Kempa 2017), we employ DCC-GARCH models to examine time-varying conditional volatility correlations across major stock indices around two distinct shocks. In particular, we compare correlation dynamics under an uncertainty shock and under an action shock. The literature supports DCC-type models as suitable tools for analysing how shocks influence the joint behaviour of market volatilities, while also highlighting remaining challenges in identifying and interpreting correlation dynamics across different shock types.
The existing literature leaves a specific research gap. Most studies focus on a single class of shocks, such as general policy uncertainty, crisis periods, geopolitical risk, or trade policy uncertainty. Others examine returns and volatility around elections or tariff announcements without directly comparing how conceptually different shocks change conditional cross-market synchronisation within the same group of countries. In the literature, there is a lack of empirical studies on whether an uncertainty shock and a realised policy action shock generate systematically different correlation responses across the same developed markets (G7 countries). Our study contributes by analysing two distinct U.S.-centred shocks and by comparing their effects on the time-varying correlations between the United States and the other G7 stock markets.
Based on the reviewed literature, two hypotheses are proposed.
H1. The 2024 U.S. presidential election, treated as an uncertainty shock, is expected to reduce USA-G7 conditional correlations.
H2. The 2 April 2025 reciprocal tariff announcement, treated as an action shock, is expected to increase USA-G7 conditional correlations.
3. Materials and Methods
The objective of this study is to examine how major U.S.-related shocks affect the time-varying conditional correlations between the U.S. equity market and other G7 stock markets. In particular, the analysis focuses on two distinct types of shocks: an uncertainty shock, represented by the U.S. presidential election in November 2024, and an action shock, represented by the announcement of U.S. tariff increases in April 2025. While the former primarily reflects political uncertainty and expectations, the latter constitutes a direct economic policy intervention with potentially global spillover effects.
The empirical analysis is conducted using daily stock market indices for the United States and six other G7 economies, i.e., Canada, France, Germany, Italy, Japan, and the United Kingdom. The U.S. market is represented by the S&P 500, while the international markets include TSX 60 (Canada), FTSE All Share (United Kingdom), DAX (Germany), CAC All (France), FTSE Italia All Share (Italy), and TOPIX (Japan). The sample covers the period from January 2010 to July 2025 and consists of daily observations.
All price series are transformed into logarithmic returns, computed as the first difference of the natural logarithm of index prices. This transformation ensures stationarity and allows for a consistent interpretation of returns across markets.
This study employs the Dynamic Conditional Correlation GARCH model (DCC-GARCH) (
Engle 2002) to analyse time-varying dependence between the United States and other G7 stock market leading indices. The model allows for jointly modelling conditional variances and dynamic correlations of financial return series.
Let
denote a vector of asset logarithmic returns. The conditional mean and variance structure is given by
where
is a diagonal matrix of conditional standard deviations (
) and
is the time-varying correlation matrix. Each conditional variance follows a univariate GARCH(1,1) process:
Dynamic conditional correlations are obtained from standardised residuals and summarised by the bivariate correlation coefficient , which captures the time-varying dependence between asset returns.
Following
Engle (
2002), the dynamics of the conditional correlation matrix are modelled using the DCC(1,1) specification:
where
denotes the vector of standardized residuals,
is the unconditional covariance correlation matrix of
, and
is the intermediate time-varying covariance matrix.
The dynamic conditional correlation matrix
is obtained by rescaling
as
The parameters and govern the dynamics of conditional correlation, where measures the impact of new shocks on correlation. While captures the persistence of correlation dynamics. The condition ensures mean reversion and stationarity of the dynamic correlation.
The DCC-GARCH model is estimated over the full sample period (2010–2025) to capture long-run volatility and the dynamics of correlation between the USA and each G7 market. The study period starts in January 2010 to ensure a sufficiently long post-global financial crisis period for stable estimation of GARCH and DCC parameters across all U.S.-G7 bilateral pairs, while ending in 2025 so as to include the post-event adjustment following the April 2025 reciprocal tariff announcement. Based on the estimated model, time-varying conditional correlations are extracted for each country–USA pair.
To provide a clearer visualisation of correlation dynamics around the selected shocks, dynamic conditional correlation paths are plotted for the period July 2024 to July 2025, which encompasses both events of interest, i.e., the 2024 U.S. presidential election and President Trump’s announcement of “reciprocal tariffs”. The selected time window enables more precise identification of changes in correlation patterns associated with the U.S. presidential election and the subsequent tariff announcement. In addition to visual inspection, an event study approach is used to measure changes in conditional correlations. For each event, a symmetric ±30-day (calendar days) window around the event date is considered. The window length was selected as a compromise between capturing immediate event-related adjustments and limiting contamination from unrelated or random developments. Average conditional correlations are computed separately for the pre-event and post-event subperiods.
A positive change in average conditional correlation indicates an increase in market co-movement, suggesting stronger financial integration or a synchronised response to the shock. Conversely, a negative change implies a reduction in co-movement, which may be interpreted as market decoupling or increased idiosyncratic uncertainty. The magnitude of the correlation change reflects the economic relevance of the shock, with larger absolute values indicating a stronger impact on cross-market dependence.
To complement the descriptive comparison of pre-event and post-event average conditional correlations, we additionally test whether the observed changes are statistically significant. For each country/USA pair and each event window, we estimate a simple regression as
where
denotes the dynamic conditional correlation obtained from the DCC-GARCH model and
is a dummy variable equal to 1 for observations after the event date and 0 otherwise. The coefficient
captures the post-event change in the mean conditional correlation. Since the event window series may exhibit heteroskedasticity and serial dependence, statistical inference is based on heteroskedasticity-consistent and autocorrelation-consistent (HAC) standard errors computed using the Newey–West estimator.
As an additional robustness check, we also apply the Welch two-sample t-test to compare pre-event and post-event mean conditional correlations. This test does not assume equal variances across the two subperiods and serves as a complementary benchmark for the statistical significance of the event-related changes.
By combining full-sample DCC-GARCH estimation with event-centred analysis, this approach allows for assessing both the persistent nature of correlation dynamics and the short-term impact of specific uncertainty and action shocks on USA-G7 stock market interdependence.
4. Results and Discussion
To examine the dynamics of conditional volatility and time-varying dependence between the U.S. stock market and other G7 equity markets, Dynamic Conditional Correlation GARCH models are estimated for pairs consisting of a U.S. stock index and one selected G7 stock index, yielding six bilateral market pairs. As a prerequisite for the DCC model, univariate volatility models are first estimated for each return series.
Table 1 reports the estimated parameters of the univariate GARCH(1,1) variance equations defined in Equation (3) for the equity indices.
Table 1 presents the estimates of the variance constant
, the ARCH parameter
capturing the impact of past shocks, and the GARCH parameter
measuring volatility persistence through lagged conditional variance. The sum
is also reported to assess the degree of volatility persistence implied by the model.
The estimated GARCH(1,1) parameters reported in
Table 1 indicate a high degree of volatility persistence across all G7 equity markets. In all cases, the ARCH coefficients (
) are positive and moderate in size, suggesting that new shocks to returns have a noticeable but limited short-run impact on conditional volatility. The GARCH coefficients (
) are consistently large, implying that volatility responds strongly to its own past realisations. As a result, the sum
is close to unity for all markets, indicating slow mean reversion and long-lasting volatility effects. For most non-U.S. markets, the ARCH and GARCH coefficients are statistically significant, confirming that past shocks and lagged conditional variance play an important role in explaining volatility dynamics. The evidence is particularly strong for Canada, the UK, Italy, and Japan, whereas the German specification is less precisely estimated. The results confirm that the GARCH(1,1) specification provides an adequate representation of conditional variance dynamics for all examined stock indices.
Based on the standardised residuals obtained from estimated GARCH(1,1) models, in the second step, we estimate the Dynamic Conditional Correlation structure.
Table 2 presents the estimated DCC parameters, as defined in Equation (4), for each USA-G7 equity index pair.
Table 2 reports the shock parameter
, which measures the impact of new shocks on correlation, while
captures the persistence of correlation dynamics. The sum
is reported to evaluate the persistence and stationarity of the dynamic conditional correlation process.
The DCC parameter estimates reported in
Table 2 reveal highly persistent correlation dynamics between the USA and other G7 equity markets. The shock parameter
is relatively small across all country pairs and is significant only for selected pairs, indicating that conditional correlations respond only modestly to new information or short-term shocks. In contrast, the persistence parameter
is positive, close to unity, and highly statistically significant in all cases, leading to values of
that approach one while remaining below the stationarity threshold. This implies that changes in cross-market correlations are highly persistent and tend to vanish slowly over time. The strongest persistence is observed for the USA-UK and USA/Germany pairs, while relatively lower (but still substantial) persistence characterises the USA/Canada correlation. These findings suggest that correlation dynamics among developed equity markets are dominated by long-run integration effects rather than transitory shocks, making them particularly susceptible to prolonged periods of heightened co-movement following major global events.
The DCC-GARCH model was estimated using the full sample of daily data from 1 January 2010 to 31 December 2025, allowing for a characterisation of long-run volatility and correlation dynamics between the U.S. equity market and other G7 markets. Based on these estimates, time-varying dynamic conditional correlations are obtained for each country/USA pair.
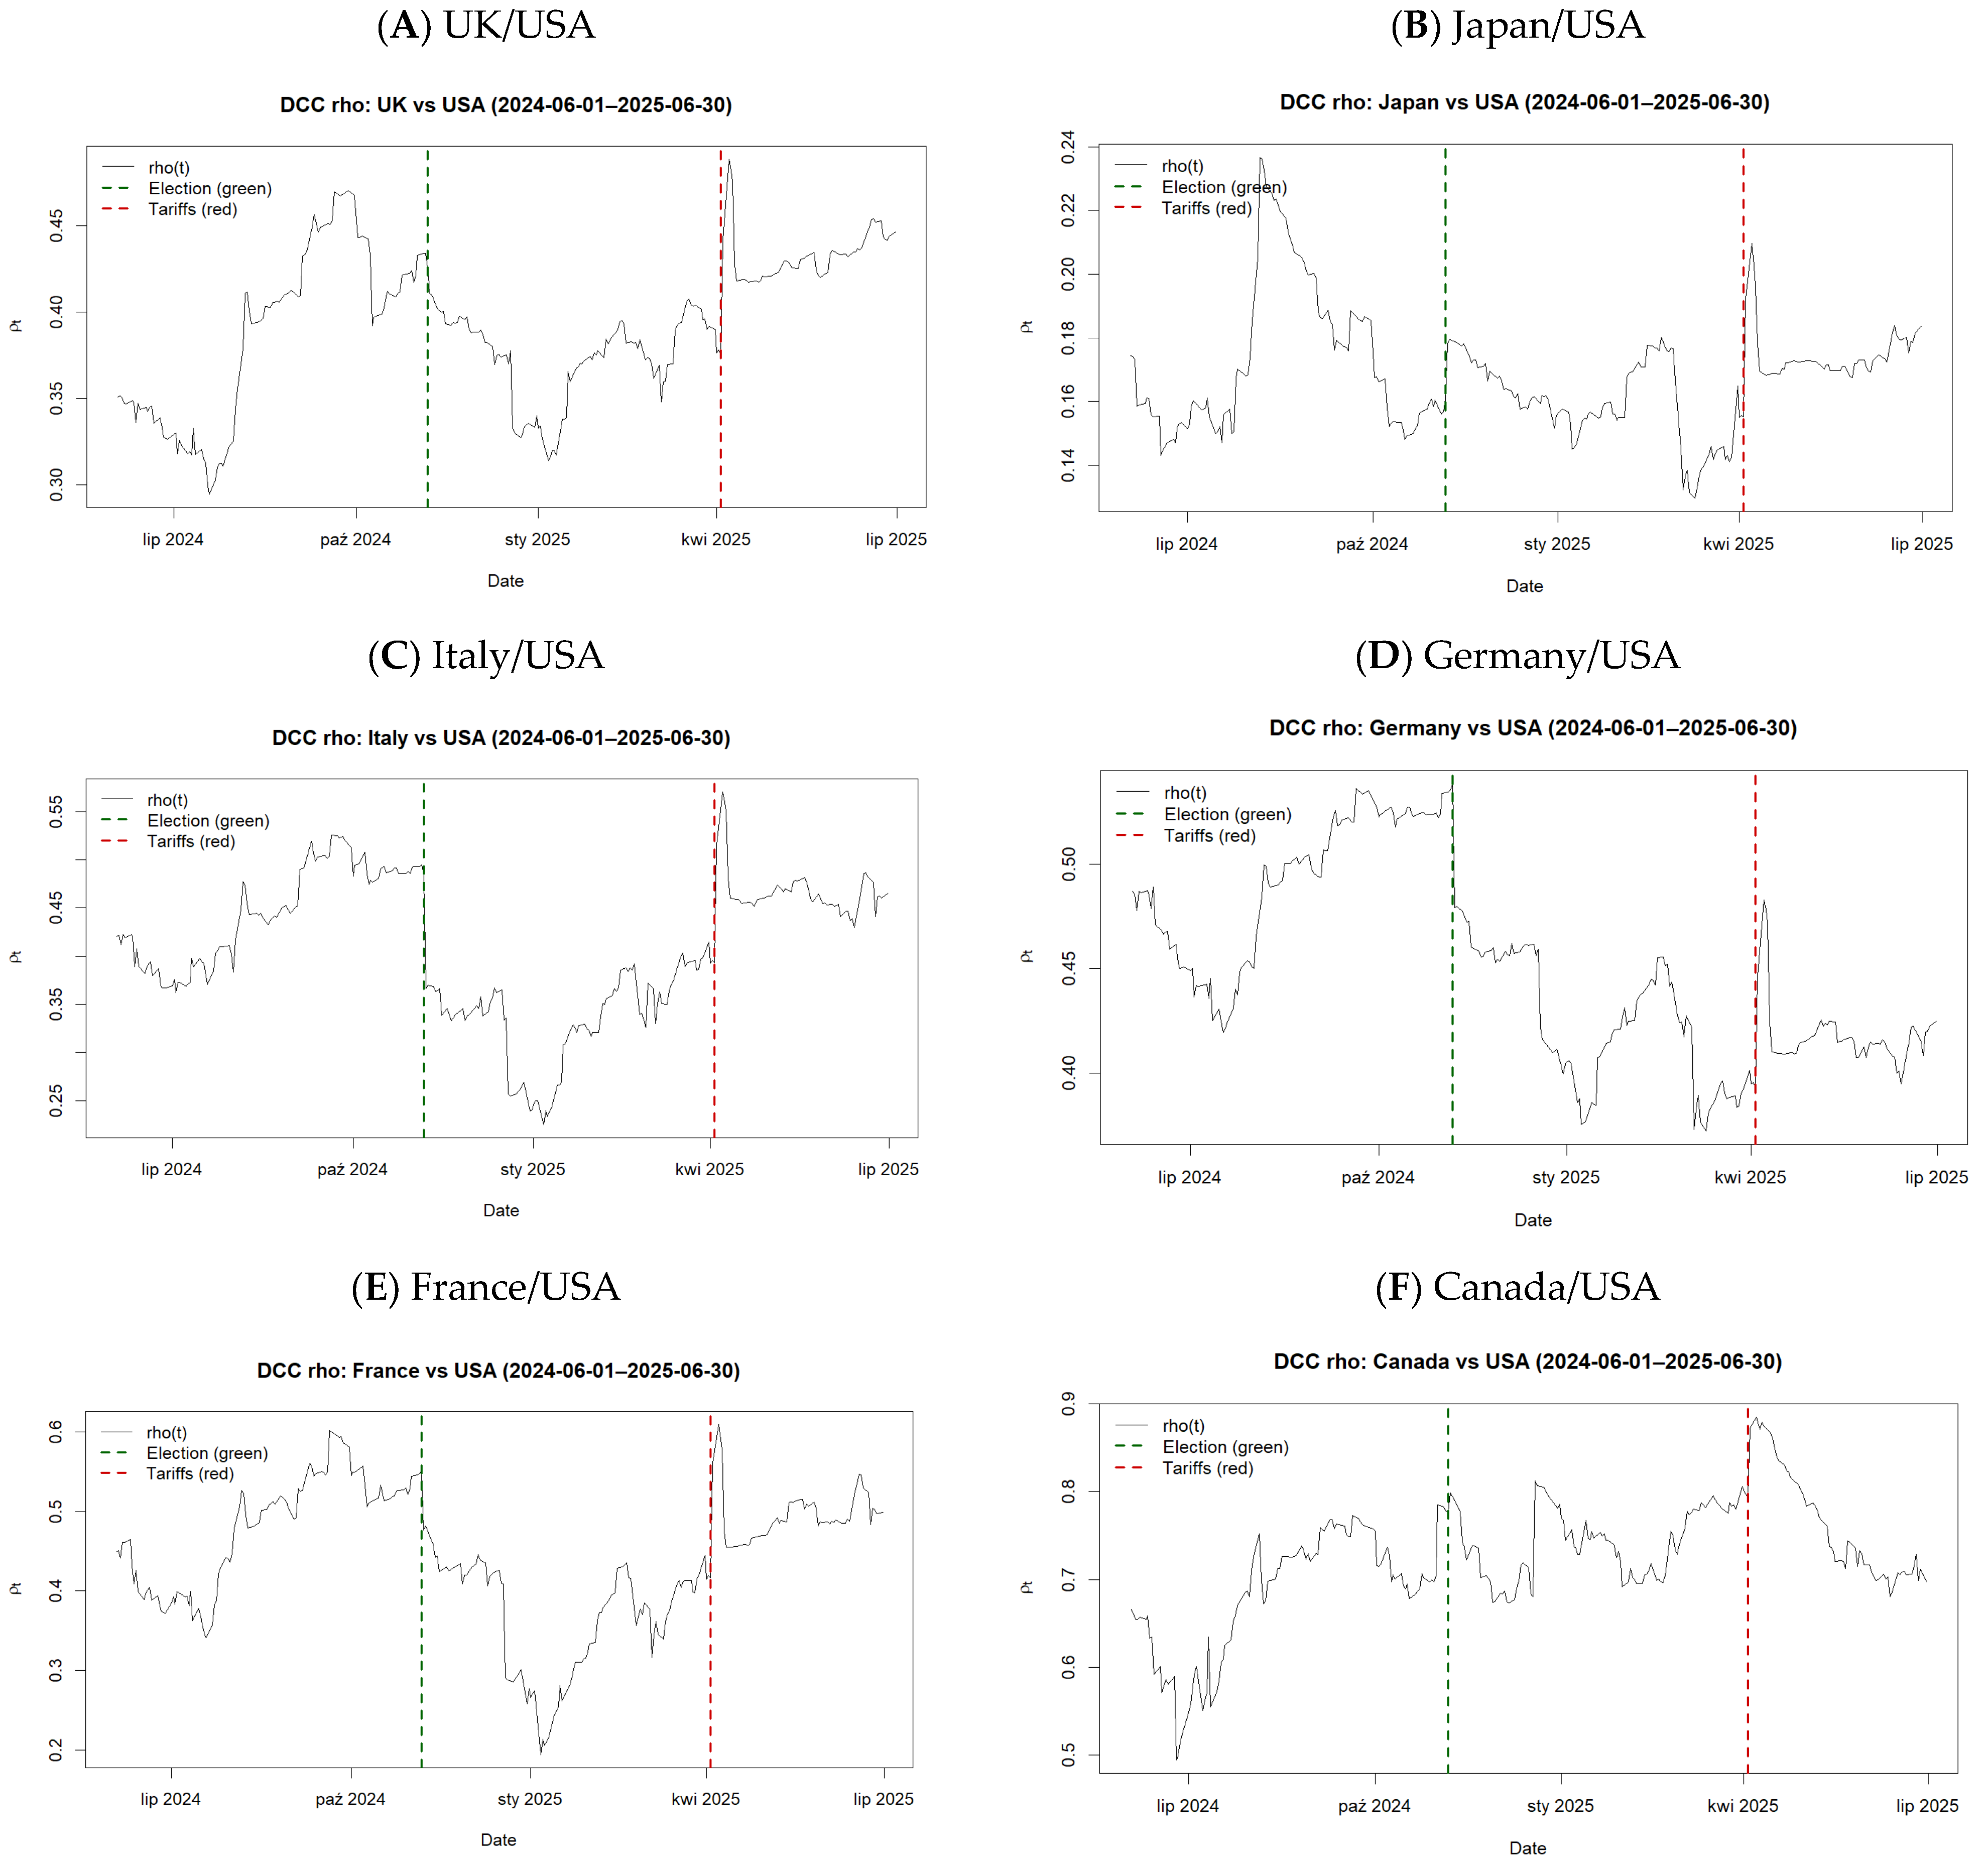
In the next step, we aim to verify the effect of two analysed shocks (uncertainty shock and action shock) on dynamic conditional correlation for each country/USA pair. To better capture the effects of these shocks, the analysis of correlation dynamics is presented graphically for a restricted time window from 1 June 2024 to 30 June 2025. This window encompasses the two events of interest and allows for a clearer visualisation of changes in conditional correlations around their occurrence. The dynamic conditional correlation plots include vertical reference lines marking the timing of the analysed shocks. The U.S. presidential election held on 5 November 2024 is indicated by a green dashed vertical line and represents a 2024 presidential election uncertainty shock. President Trump’s announcement of U.S. tariff increases on 2 April 2025 is marked by a red dashed vertical line and captures a trade policy action shock with potentially broad international spillover effects (
Figure 1A–F).
Figure 1 reveals that baseline dependence differs markedly across pairs, with Canada/USA showing the highest and most persistent correlation throughout the window, Japan/USA remaining consistently the lowest, and the European pairs lying in between. Second, the two analysed shocks are associated with clearly different correlation responses. Around the 2024 U.S. presidential election date, the dominant pattern is a decline in conditional correlation for the European markets, indicating temporary decoupling and more idiosyncratic dynamics during the uncertainty event period, with the largest and most persistent post-election drops visible for France/USA and Italy/USA, a pronounced but less extreme decline for Germany/USA, and a milder downward adjustment for the UK-USA. By contrast, Canada/USA and Japan/USA react only modestly around the election, suggesting limited changes in co-movement for these two pairs in response to political uncertainty.
Around President Trump’s tariff announcement on 2 April 2025, the pattern reverses across all six country/USA pairs, with an immediate upward jump in conditional correlations that is visible for every analysed pair, consistent with a common, policy action synchronising markets. The magnitude of this action shock response is clearly heterogeneous, i.e., it is strongest for Canada/USA (a sharp move to a local peak followed by gradual mean reversion), very large for France/USA and Italy/USA (a steep increase and a higher post-event level than in the months preceding the announcement), moderate for the UK-USA and Germany/USA, and smallest for Japan–USA, where the increase is noticeable but remains limited in absolute terms. In summary, the election-related uncertainty shock is associated mainly with a weakening of correlations concentrated in Europe, whereas the tariff-related action shock generates a broad, positive correlation shift across all country/USA pairs, with the largest synchronisation effects in North America and parts of Europe, and the weakest in Japan.
In the next step, we compute average conditional correlations over a symmetric ±30-day (calendar days) window around each of the two analysed event dates using DCC-GARCH estimates (
Table 3). In addition to reporting pre-event and post-event mean correlations,
Table 3 includes t-statistics based on HAC (Newey–West) standard errors and Welch two-sample t-statistics, both accompanied by significance indicators.
The results in
Table 3 for the 2024 U.S. presidential election indicate a heterogeneous but statistically significant response across markets. For the European pairs, i.e., France–USA, Germany–USA, Italy–USA, and UK–USA, the post-event changes in conditional correlations are negative and statistically significant under both the HAC and Welch tests. The strongest decline is observed for Italy–USA, followed by France–USA and Germany–USA. In contrast, the change for Canada–USA is small and not statistically significant, whereas Japan–USA shows a modest, statistically significant increase in correlation. A markedly different pattern emerges for the 2025 tariff announcement. In all country–USA pairs, post-event mean correlations exceed their pre-event values, and the increases are statistically significant across both HAC and Welch tests. The largest increases are observed for France–USA and Italy–USA, followed by Canada–USA and the UK–USA, while Japan–USA shows the smallest, yet still significant, increase. In general, the results in
Table 3 support the interpretation that the election uncertainty shock leads to heterogeneous, region-specific correlation responses, while the trade policy action shock acts as a common disturbance that significantly strengthens international market synchronisation across the G7 markets.
These differences may reflect cross-country variation in economic and financial linkages with the United States, including differences in trade exposure, market integration, and index composition. Canada’s particularly strong response to the tariff announcement is consistent with its exceptionally high degree of North American trade and financial integration, which makes its equity market especially sensitive to realised U.S. policy actions. The comparatively strong increases observed for France and Italy may indicate greater sensitivity to global growth repricing and external demand channels, while the more moderate responses of Germany and the UK may be associated with differences in sectoral composition, multinational diversification, and the relative importance of domestic market factors. Japan’s weaker response is economically plausible given its lower direct exposure to U.S.-centred trade policy transmission, its distinct regional market environment, and the stronger role of domestic and Asia-specific determinants of equity valuation. The election-related uncertainty shock appears to have operated differently, producing weaker correlations mainly in Europe, where investors may have revised U.S.-related risks in a more heterogeneous and less synchronised way.
Our findings align with prior evidence that election periods can be associated with shifts in co-movement and volatility, and that such effects are heterogeneous across countries (
Pantzalis et al. 2000;
Białkowski et al. 2008;
Goodell and Vähämaa 2013). In our results, the 2024 election-related uncertainty shock is mainly associated with lower conditional correlations for the European pairs, indicating a temporary decline in synchronisation with the U.S. market. This is consistent with the view that international dependence is state-dependent and can weaken around shocks that raise uncertainty and generate more idiosyncratic dynamics (
Longin and Solnik 2001;
Forbes and Rigobon 2002). By contrast, the tariff announcement is followed by increases in correlation across all pairs, consistent with evidence that trade policy settings distinguish realised decision/news components from uncertainty components and that such decisions can operate as common shocks (
Caldara et al. 2020).
From a hypothesis-testing perspective, the study findings provide partial support for H1 and strong support for H2. The analysed election-related uncertainty shock reduces correlations only in part of the sample, primarily among the European G7 markets, while the tariff-related action shock produces a uniform and statistically significant increase in conditional correlations across all U.S.-G7 pairs. The results indicate that uncertainty shocks and action shocks differ not only in magnitude but also in the cross-sectional consistency of their effects on international equity market synchronisation.
5. Conclusions
Stock markets respond to major exogenous shocks, which can alter cross-market co-movement. In this study, we distinguish two exogenous shock types from the perspective of financial markets. The uncertainty shock is linked to political uncertainty around the U.S. presidential election in November 2024. The action shock is linked to a discrete trade policy intervention, namely President Trump’s announcement of reciprocal tariffs in April 2025.
This study examines how these shocks affect time-varying conditional correlations between the U.S. equity market and other G7 markets. We use daily data for the S&P 500 and leading equity indices for Canada, France, Germany, Italy, Japan and the United Kingdom from January 2010 to July 2025. Conditional correlation is modelled with DCC-GARCH and estimated for six USA-G7 pairs, and shock effects are assessed with correlation paths for 1 June 2024 to 30 June 2025 and a symmetric ±30-day event window.
The results confirm that both analysed geopolitical events significantly affect the dynamic correlations between the USA and other G7 equity markets. The event analysis indicates that the election-related uncertainty shock mainly reduces conditional correlations for European pairs, with the largest decline for Italy and clear drops for France and Germany, consistent with temporary decoupling and more idiosyncratic dynamics. Canada and Japan show only small changes around the election. By contrast, the tariff-related action shock significantly increases conditional correlations for every analysed country/USA pair, with the largest rises for France and Italy, a sizeable increase for Canada, and the smallest adjustment for Japan. While the 2024 U.S. presidential election is associated with a decline in correlations for European markets, the 2025 tariff announcement leads to a widespread increase in cross-market synchronisation. These effects are statistically significant under the HAC (Newey–West) and Welch tests. This highlights that different types of shocks generate distinct patterns of international market co-movement. Stock market synchronisation weakens in response to the uncertainty shock and strengthens in response to the action shock.
Our findings have some implications for international portfolio allocation and financial risk management. Higher conditional correlations observed after action shocks suggest that realised policy interventions may compress diversification benefits more strongly than uncertainty-driven events, as they induce more synchronous cross-market repricing and strengthen spillover effects across major equity markets. Consequently, investors and risk managers should not treat political and policy-related events as a homogeneous category of shocks. Instead, scenario analysis and portfolio stress testing should explicitly distinguish between uncertainty-driven episodes and realised policy actions, since the latter may generate more immediate and broader increases in market interdependence.
This study has some limitations. Firstly, it focuses on six bilateral G7 pairs and two specific U.S.-centred events, which limits generalisability. Moreover, event window evidence cannot fully isolate concurrent issues, including, e.g., macro-financial news. Additionally, broad market indices may conceal sector-level heterogeneity in shock transmission.
This paper’s contribution is to classify the two events as different shock types and to document opposite correlation responses across the same set of developed markets within a DCC-GARCH approach. To the best of our knowledge, such a comparison for these events within the G7 setting has not been provided before. Future research can extend the analysis to additional countries and shocks and assess robustness using alternative correlation models, including asymmetric DCC-GARCH specifications.