2. Theoretical Framework
The fourth industrial revolution transformed business models, enabling new ways of communication and information sharing in the insurance sector, where new challenges emerged, attributable to significant changes in customer needs and demands and the increasing use of new technologies (
Ricci and Battaglia 2021). Therefore, there is expected to be the use not of a single technology but the interaction of several technologies whose effects create new modes of operation, resulting in an influence on the organizations, the environment, and social functions (
Schmidt et al. 2015).
In the academic literature, the InsurTech phenomenon is often treated as a part of FinTech and is not recognized as having its own identity (
Cosma and Rimo 2024). However, the InsurTech startup sector is demonstrating the same dynamic in the insurance sector, which has affected the entire financial service industry (
Swiss Re Institute 2017). Notably, in the banking and insurance sectors, technologies have been disruptive for a decade, with new developments and innovative styles of operations occurring in these sectors every year in the form of FinTech and InsurTech (
Ratnakaram et al. 2021). As
Schmidt (
2018) emphasizes, the technologies of the fourth industrial revolution, such as cloud computing, telematics, the Internet of Things (IoT), blockchain technology, artificial intelligence, and predictive modeling, are profoundly affecting the entire insurance business model. These technologies enable new methods of communication, information sharing, and insuring (
Cappiello 2020).
This scenario is the basis for the emergence of InsurTech. Thus, as a new competitor, InsurTech startups have significantly impacted traditional insurance companies and economic growth (
Manta 2021). As
Nicoletti (
2021) points out, insurance organizations and InsurTech firms have several points in common since, although the financial base of the former is significantly higher, InsurTech is the natural evolution of insurance according to Darwinian principles of evolution, being the outcome of a still ongoing process of adaptation and mutual influence with the external environment.
From the preceding, the term is used in association with bringing new technologies and innovations in the field of insurance to impact the regulatory practices of insurance markets (
Rawat et al. 2021). This term describes technology-led companies emerging in the insurance sector, which are taking advantage of new technologies to provide coverage to a more digitally savvy customer base (
Ostrowska 2021), as innovative or specialized players that provide important solutions in terms of information and technology (
Dominique-Ferreira 2018). Thus, an InsurTech can typically be a startup creating technology that affects, to the point of changing, an element of insurance operations or services (
Neale et al. 2020). Academics define InsurTech as a phenomenon comprising innovations of one or more traditional or non-traditional market players exploiting information technology to deliver solutions specific to the insurance industry (
Stoeckli et al. 2018). This is supported by
Xu and Zweifel (
2020), who define the term as a phenomenon in which traditional or non-traditional market players, aimed at lowering cost, improving efficiency, or providing consumers with more service value, exploit information technology to deliver data-driven or customer-oriented solutions specific to the improvement in insurance business including marketing and distribution, risk assessment and underwriting, claims handling and value-added service provision, as well as innovation in insurance products or services, digitalized operation, partnerships, and business models.
For this reason, the insurance sector’s structure belongs to the network economy and is shaped by complementary network effects (
Greineder et al. 2020). In this regard, the value for the customers and the organizations is obtained by an ecosystem combining network organizations, vendors, customers, and public administrations (
Nicoletti 2017). In this sense, managing connections in the value network skillfully is a crucial source of competitive advantage, stating that the source of competitive advantage is the skillful management of connections in the value network (
Porter and Heppelmann 2014). This approach can be further expanded upon by
Nicoletti (
2021), who argues that organizations are undergoing a fundamental shift from the traditional linear value chain to the value network, which it refers to as the ecosystem. In this ecosystem, value is no longer created in isolated steps but emerges from the interconnected relationships and mutual dependencies between various actors. This perspective is supported by
McKinsey (
2019), who defines an ecosystem as interconnected sets of services that enable users to satisfy multiple needs through a single, integrated experience.
As a result, InsurTech startups are transforming the traditional value paradigm of the insurance industry by consistently innovating and introducing new insurance models (
Stoeckli et al. 2018). Researchers have proposed a framework to classify startups based on a wide range of InsurTech business models, identifying nine distinct categories (
Braun and Schreiber 2017): Comparison Portals, Digital Brokers, Insurance Cross Sellers, Peer-to-Peer Insurance, On-Demand Insurance, Digital Insurers, Big Data Analytics and Insurance Software, Internet of Things, and Blockchain and Smart Contracts. Utilizing the Business Model Navigator (
Gassmann et al. 2014),
Braun and Schreiber (
2017) systematically categorized these models to understand the sector comprehensively. This framework integrates the dimensions of who, what, how, and why to analyze business models, offering a structured methodology to explore the strategies employed by InsurTech startups in driving innovation within the insurance ecosystem.
Continuous innovation by InsurTech is expected to profoundly influence the industry’s evolution (
Marano 2019). As
Sosa and Montes (
2023) noted, InsurTech encapsulates technology-enabled innovations that create value through digital, data-driven, and customer-centric solutions. However, their disruptive potential also challenges incumbents to rethink their capabilities, strategies, and positions within this emergent ecosystem (
Naylor 2017;
Nicoletti 2021). Transitioning toward “Insurance 4.0” requires firms to act as service providers and ecosystem coordinators (
Chang et al. 2009).
Khokale and Baskaran (
2023) explain this idea as being aligned with a business ecosystem in which companies work together to create value. Furthermore, the influence of InsurTech extends beyond traditional insurance structures, as
Stoeckli et al. (
2018) highlight the critical role of these firms in fostering strategic partnerships and ecosystems. These partnerships involve collaborations between startups, established insurers, technology providers, regulators, and customers, all working together to create value and drive innovation within the insurance ecosystem.
The conceptualization of ecosystems in the business literature further enriches this analysis. According to
Lei and Slocum (
2005), ecosystems can be classified based on (A) the industry life cycle (mature and growth) and (B) the rate of technological change (low and high), from which four archetypes are derived (consolidators, concept learners, concept drivers, and pioneers). In the (1) Steady Evolution ecosystem, consolidators focus on developing a broad line of standard products for customers. Based on the (2) Creative Destruction ecosystem, concept learners are archetypes that focus on learning and adapting to new concepts and technologies. Regarding the (3) Fast Growth ecosystem, concept drivers are firms’ archetypes that actively drive and shape industrial concepts and technologies. Then, in the (4) Wild Wild West ecosystem, pioneers are archetypes that aggressively pursue new technologies and strive to be first to market.
Therefore, by understanding and adapting to an industry’s life cycle stages and the technological change rate, firms can strategically position themselves to navigate industry evolution effectively and gain a competitive advantage (
Nair and Boulton 2008). From the preceding, according to the industry’s life cycle,
Lei and Slocum (
2005) point out that industries typically go through stages of birth, growth, maturity, and decline at varying rates. Concerning the rate of technological change, these academics argue that new technologies can create opportunities for new firms and lead to the development of entirely new products and services, where technological advancements can destabilize existing industry equilibriums, leading to the emergence of new industry ecosystems. Notably, scholars analyzing the InsurTech ecosystem have outlined five strategic priorities for the insurance industry (
Greineder et al. 2020): fostering customer-centric approaches, designing coverage solutions tailored to the customer ecosystem, reorganizing operations to support digital transformation, enhancing internal collaboration, and establishing partnerships with complementary service providers within the ecosystem.
Building on this foundation,
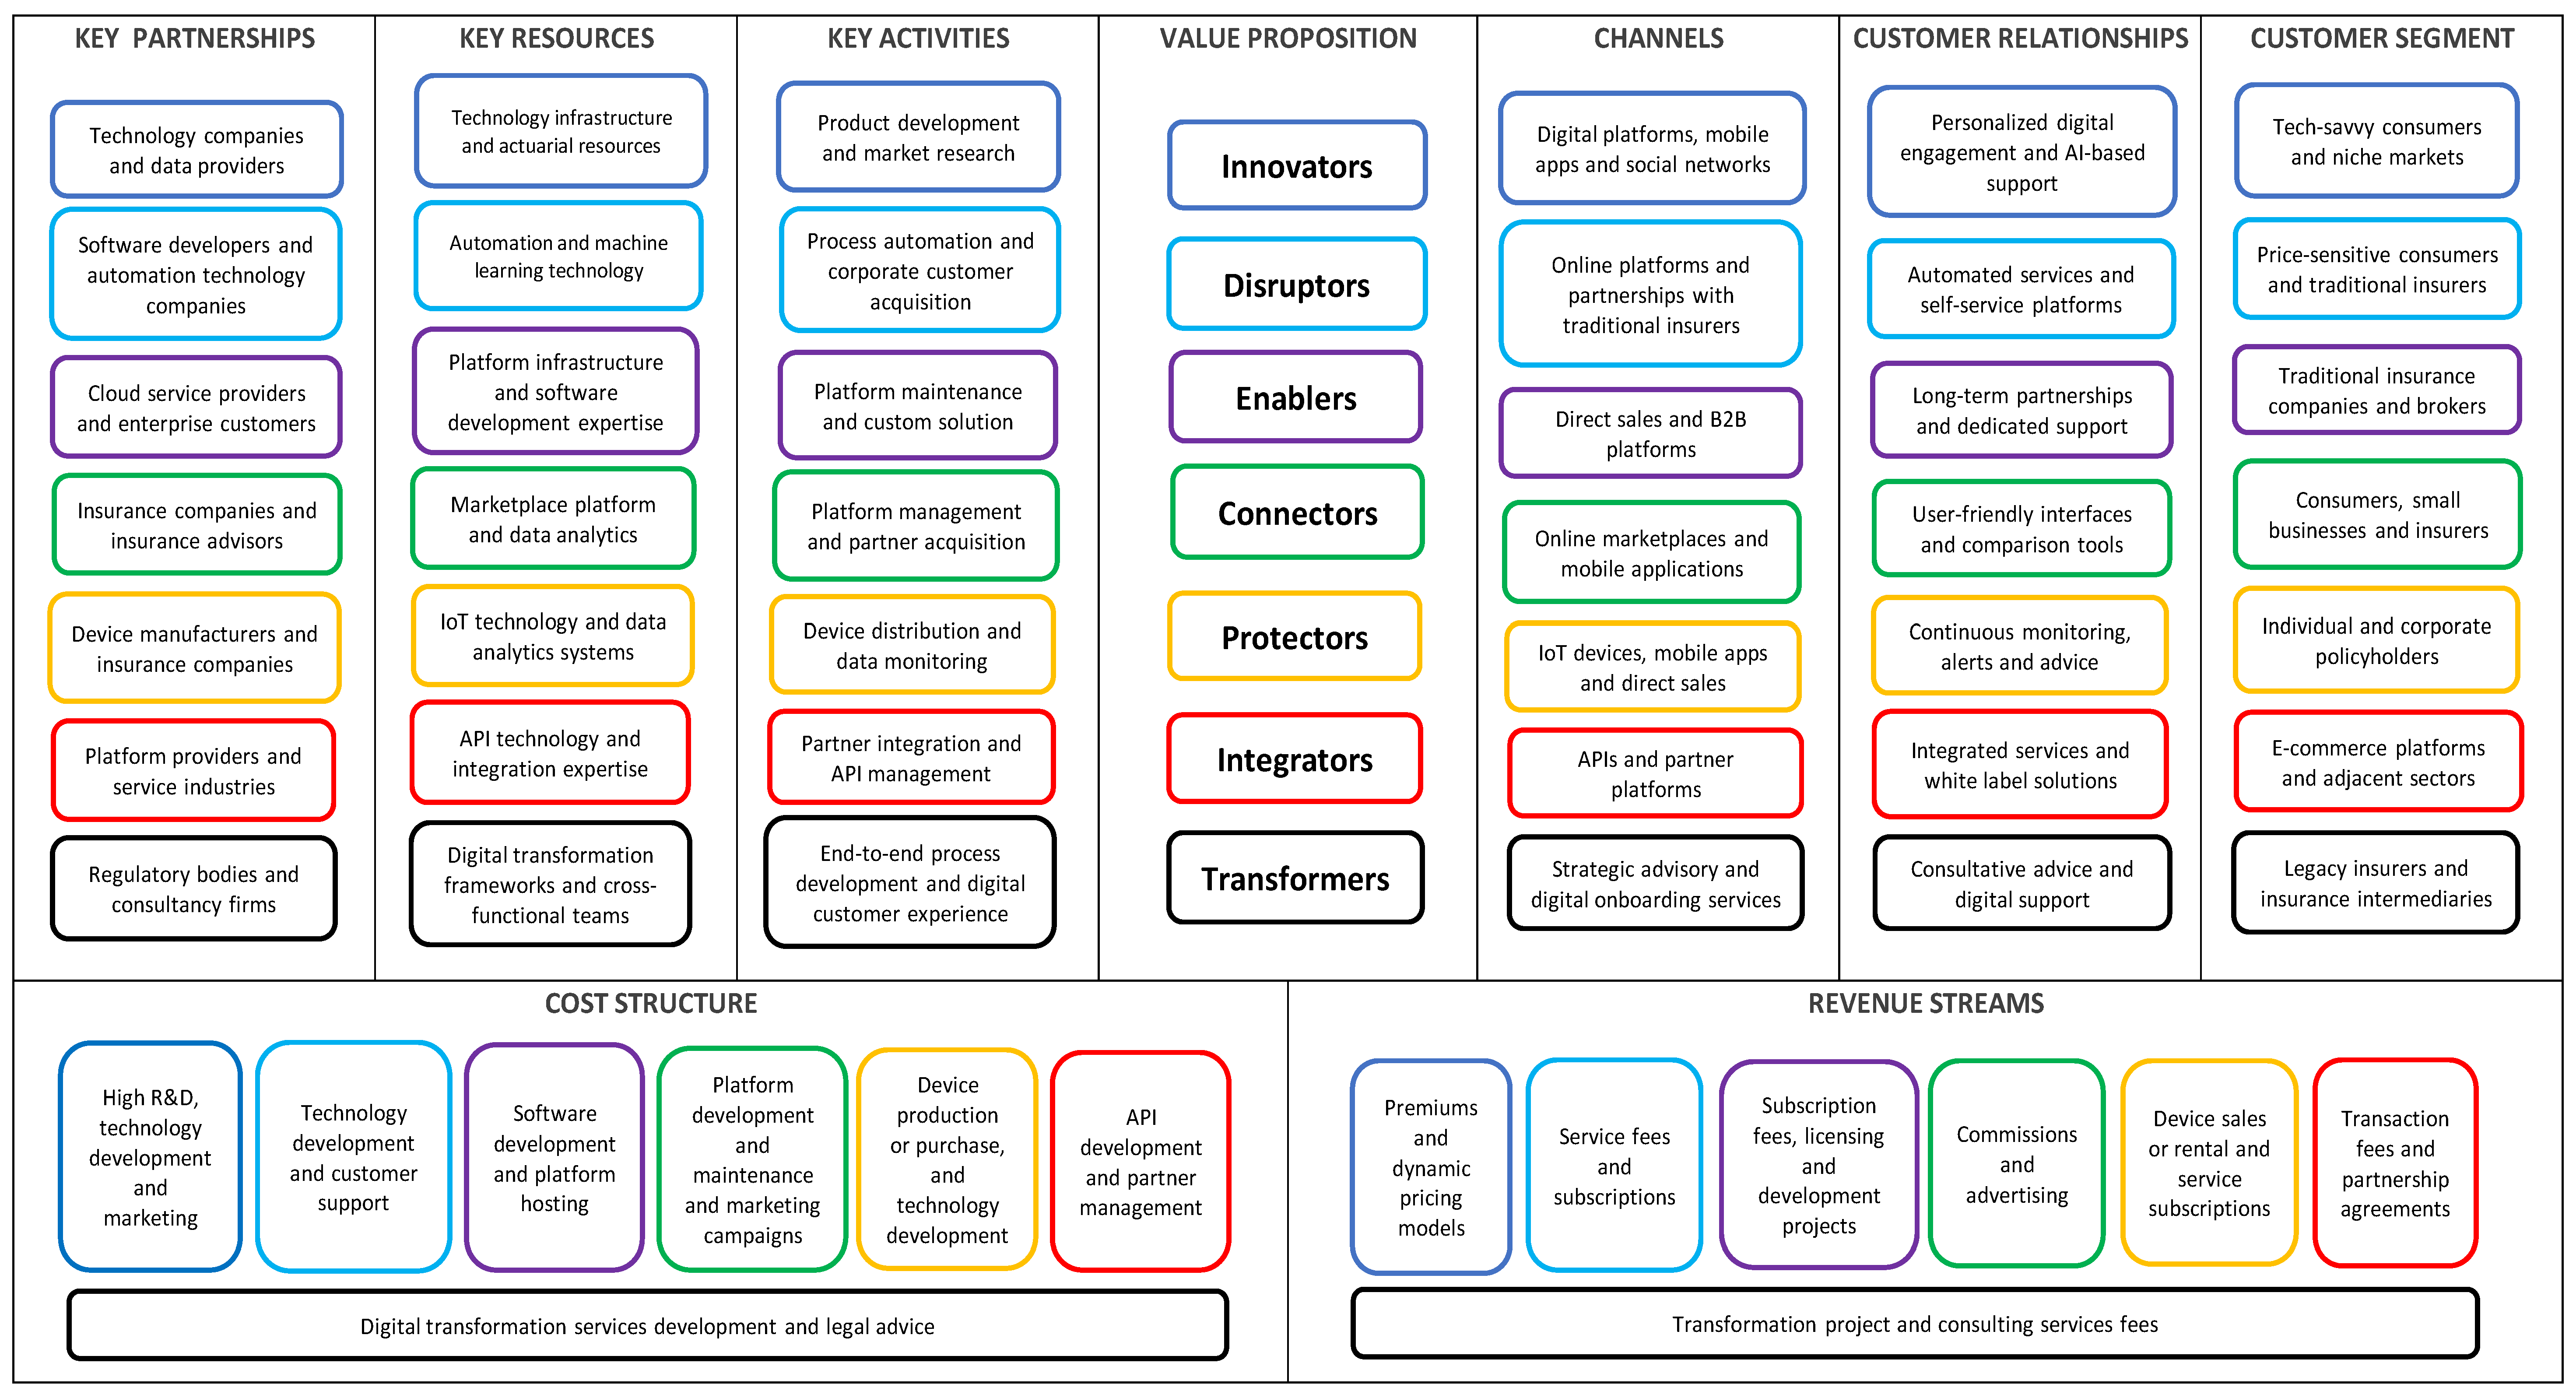
Sosa and Sosa (
2024) present a detailed taxonomy of InsurTech startups, categorizing them into seven key archetypes: Innovator, Disruptor, Enabler, Connector, Protector, Integrator, and Transformer. These archetypes encapsulate the diverse roles that InsurTech firms play in creating, delivering, and capturing value within the insurance industry. Each archetype represents a specific approach to leveraging technology and innovation to address the challenges and opportunities of an increasingly interconnected and customer-centric industry. The Innovator archetype focuses on developing new insurance models, such as on-demand insurance and microinsurance, aimed at meeting specific consumer needs. The Disruptor archetype, on the other hand, challenges traditional processes, introducing efficiency and automation to streamline operations and improve customer experiences. The Enabler archetype acts as the technological backbone of the ecosystem, providing platforms and infrastructure that enable traditional insurers and other InsurTech companies to digitize their services. The Connector archetype facilitates access to the insurance market, linking providers with customers through digital platforms and marketplaces, thereby extending market reach. The Protector archetype focuses on risk prevention and management, offering solutions to reduce claims and improve policyholder safety. The Integrator archetype seamlessly integrates insurance solutions into broader consumer journeys, making insurance products more accessible and intuitive. Finally, the Transformer archetype aids in the digital transformation of legacy insurers, enabling them to modernize their operations and adapt to the digital-first demands of today’s customers.
This taxonomy, formalized in the InsurTech Ecosystem Business Model Canvas (IEBMC), provides a structured framework for analyzing how these archetypes interact and contribute to the broader InsurTech ecosystem (see
Figure A1 in
Appendix A). By mapping the roles and interactions of InsurTech archetypes, these academics (
Sosa and Sosa 2024) offer valuable insights into the strategies that drive success in this rapidly evolving landscape, mainly because the IEBMC emphasizes the interconnectedness of these role archetypes by underscoring the importance of collaboration among stakeholders within the insurance industry, including traditional insurers, technology providers, regulators, and customers.
However, while the taxonomy proposed by academics identifies and categorizes InsurTech archetypes, there is limited research on how these specifically create, deliver, and capture value within the ecosystem from an empirical approach. Therefore, despite robust taxonomies of InsurTech startups, no previous research empirically maps their co-occurrence dynamics or quantifies their collaborative value creation within the ecosystem.
This research gap is particularly significant because the fundamental premise of ecosystem theory is interdependence; companies do not act in isolation but rather create value together through complex and evolving network interactions (
Moore 1993;
Iansiti and Levien 2004). Without empirically analyzing these interactions, it is difficult to fully understand the strategic roles played by the different InsurTech firms. Therefore, this research responds to the need for an empirically validated framework to analyze InsurTech companies in terms of their structural positioning and creation of relational value within the ecosystem. This contribution is theoretically significant, as it refines the understanding of the ecosystem and is practically relevant, as it provides valuable insights into how traditional insurers, startups, and policymakers can navigate the emerging InsurTech landscape more effectively.
4. Results
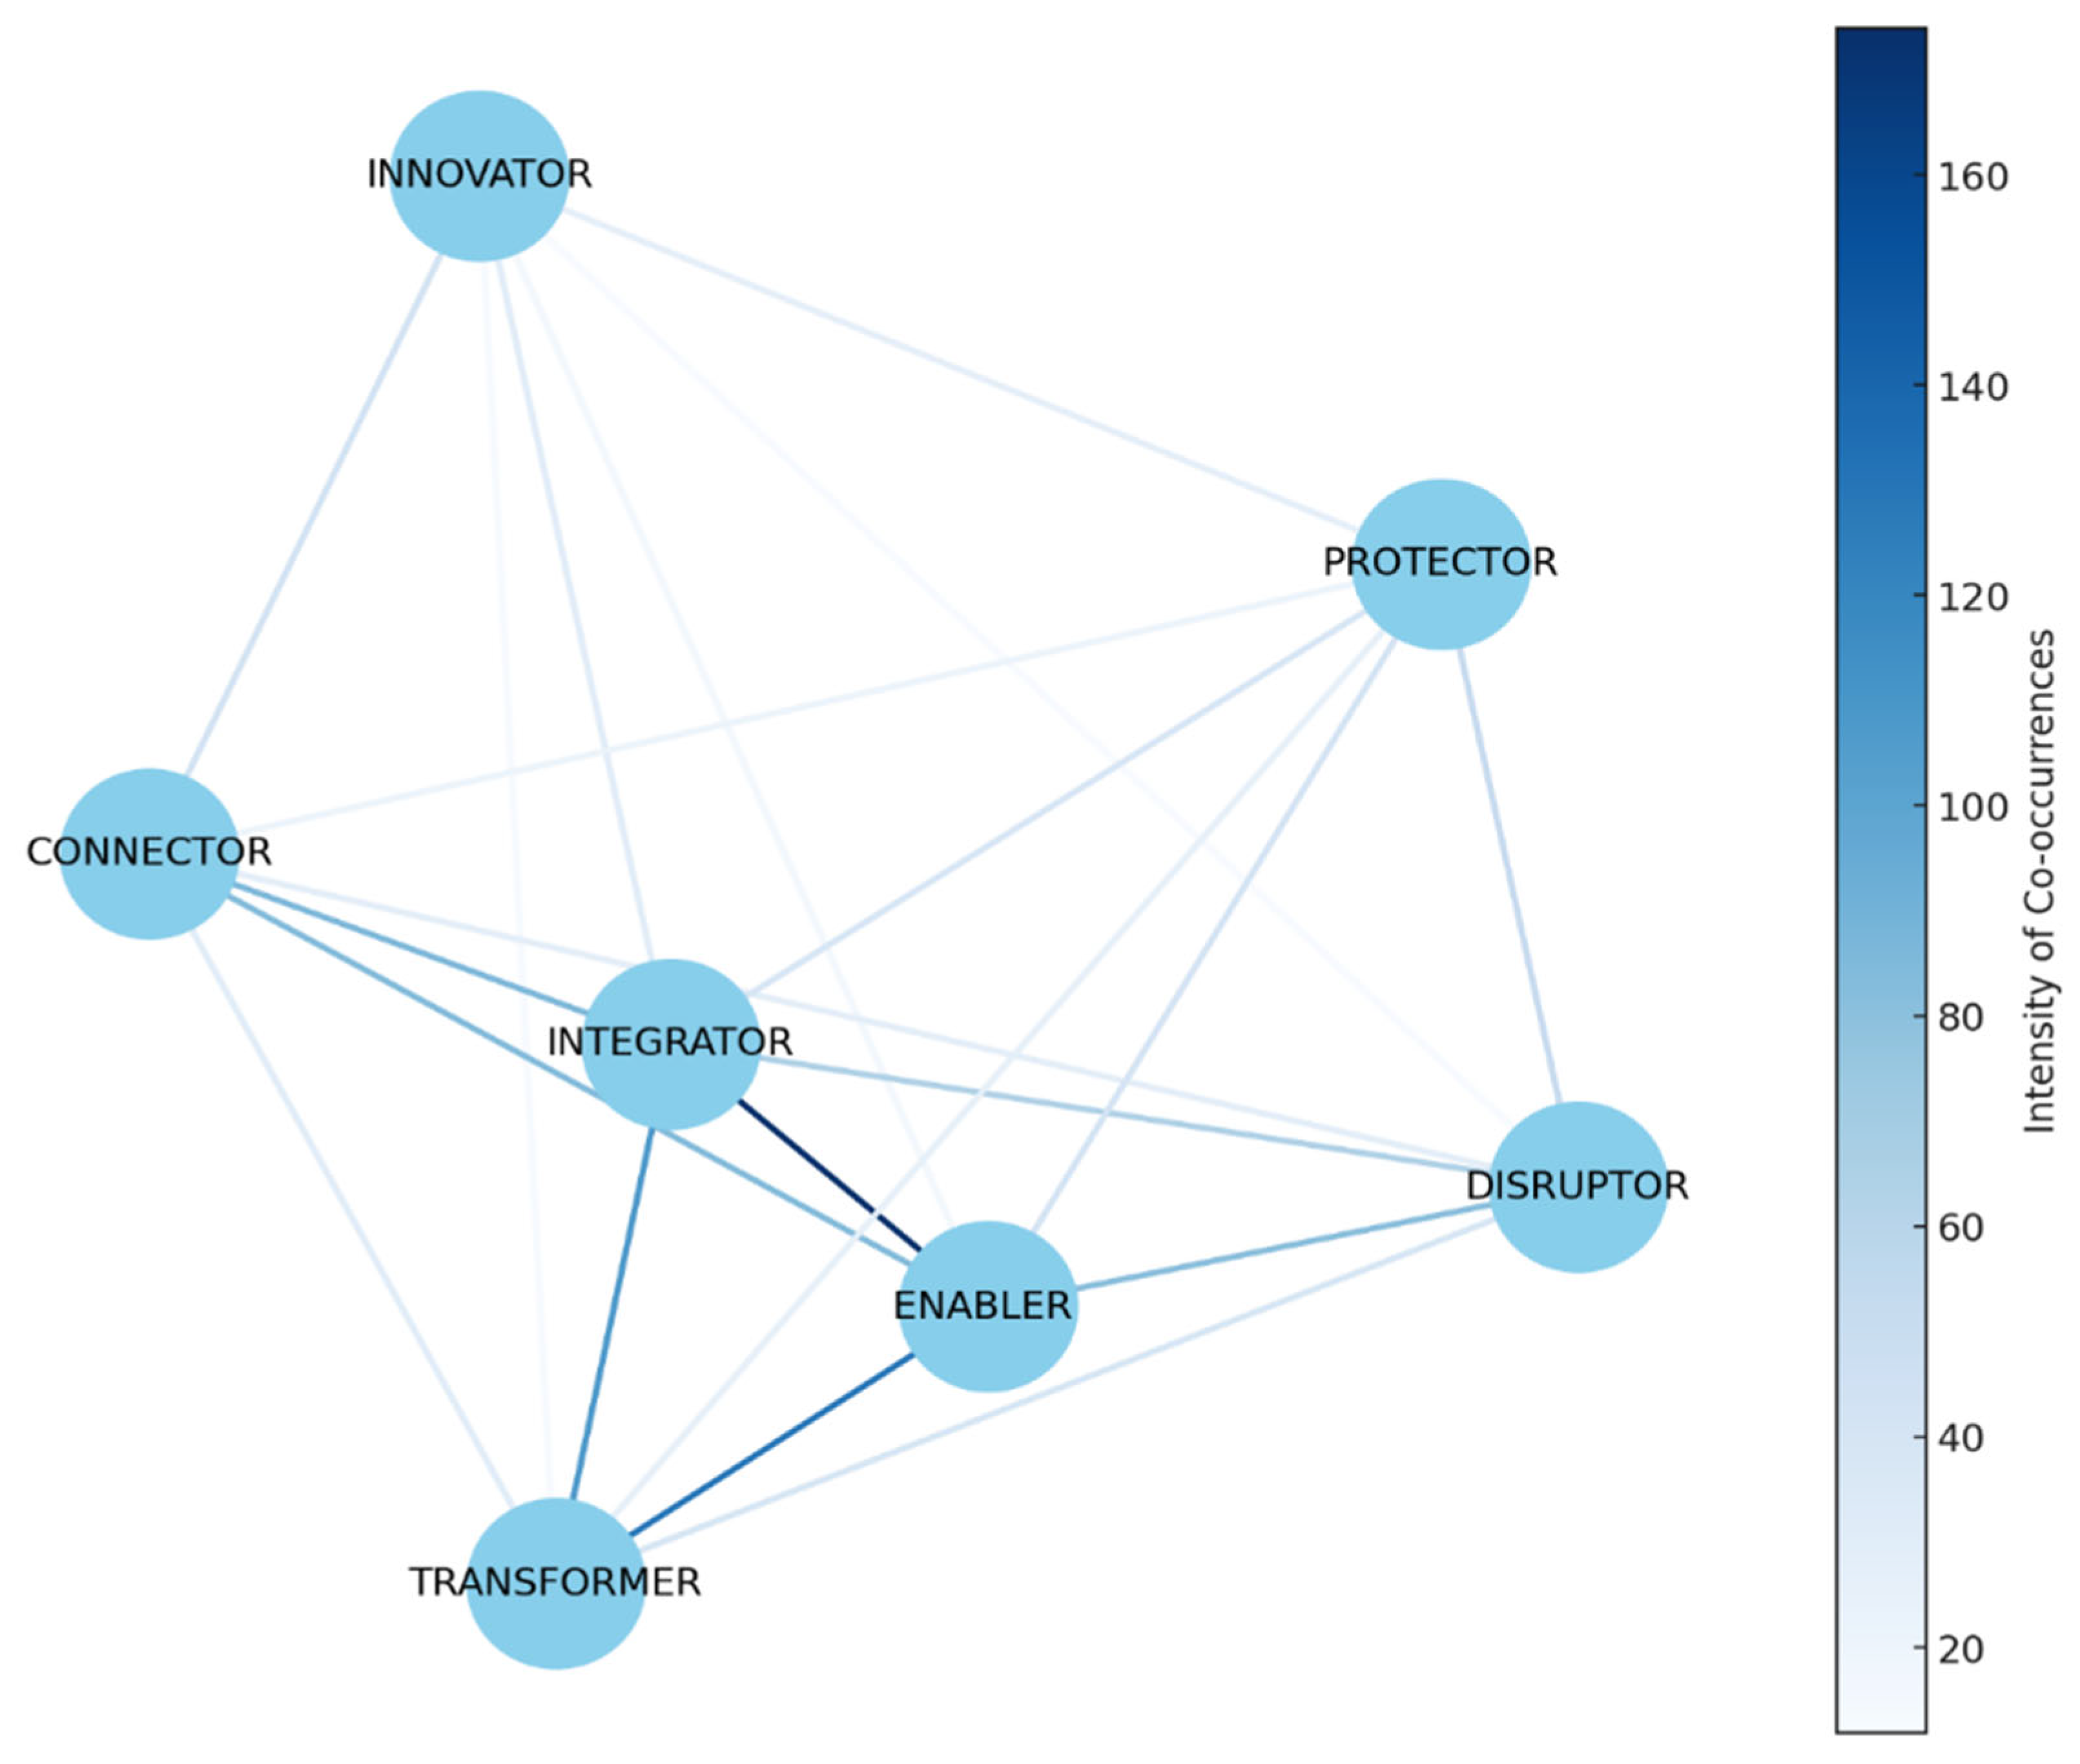
The InsurTech ecosystem landscape illustrates the interconnectedness of various InsurTech archetypes through their co-occurrences. It reveals a dynamics scenario where each archetype contributes uniquely but also relies on others to maximize its impact. The intensity of the connections suggests the extent to which these firms collaborate or influence each other in the InsurTech landscape (see
Figure 3).
The strength and number of connections reflect insights about how each archetype interacts within the ecosystem. The overall analysis reveals a dynamic and interdependent network in which each archetype’s role is both influenced by and crucial to the others. Consequently, the InsurTech ecosystem landscape illustrates the interconnectedness of the InsurTech archetypes through their co-occurrences.
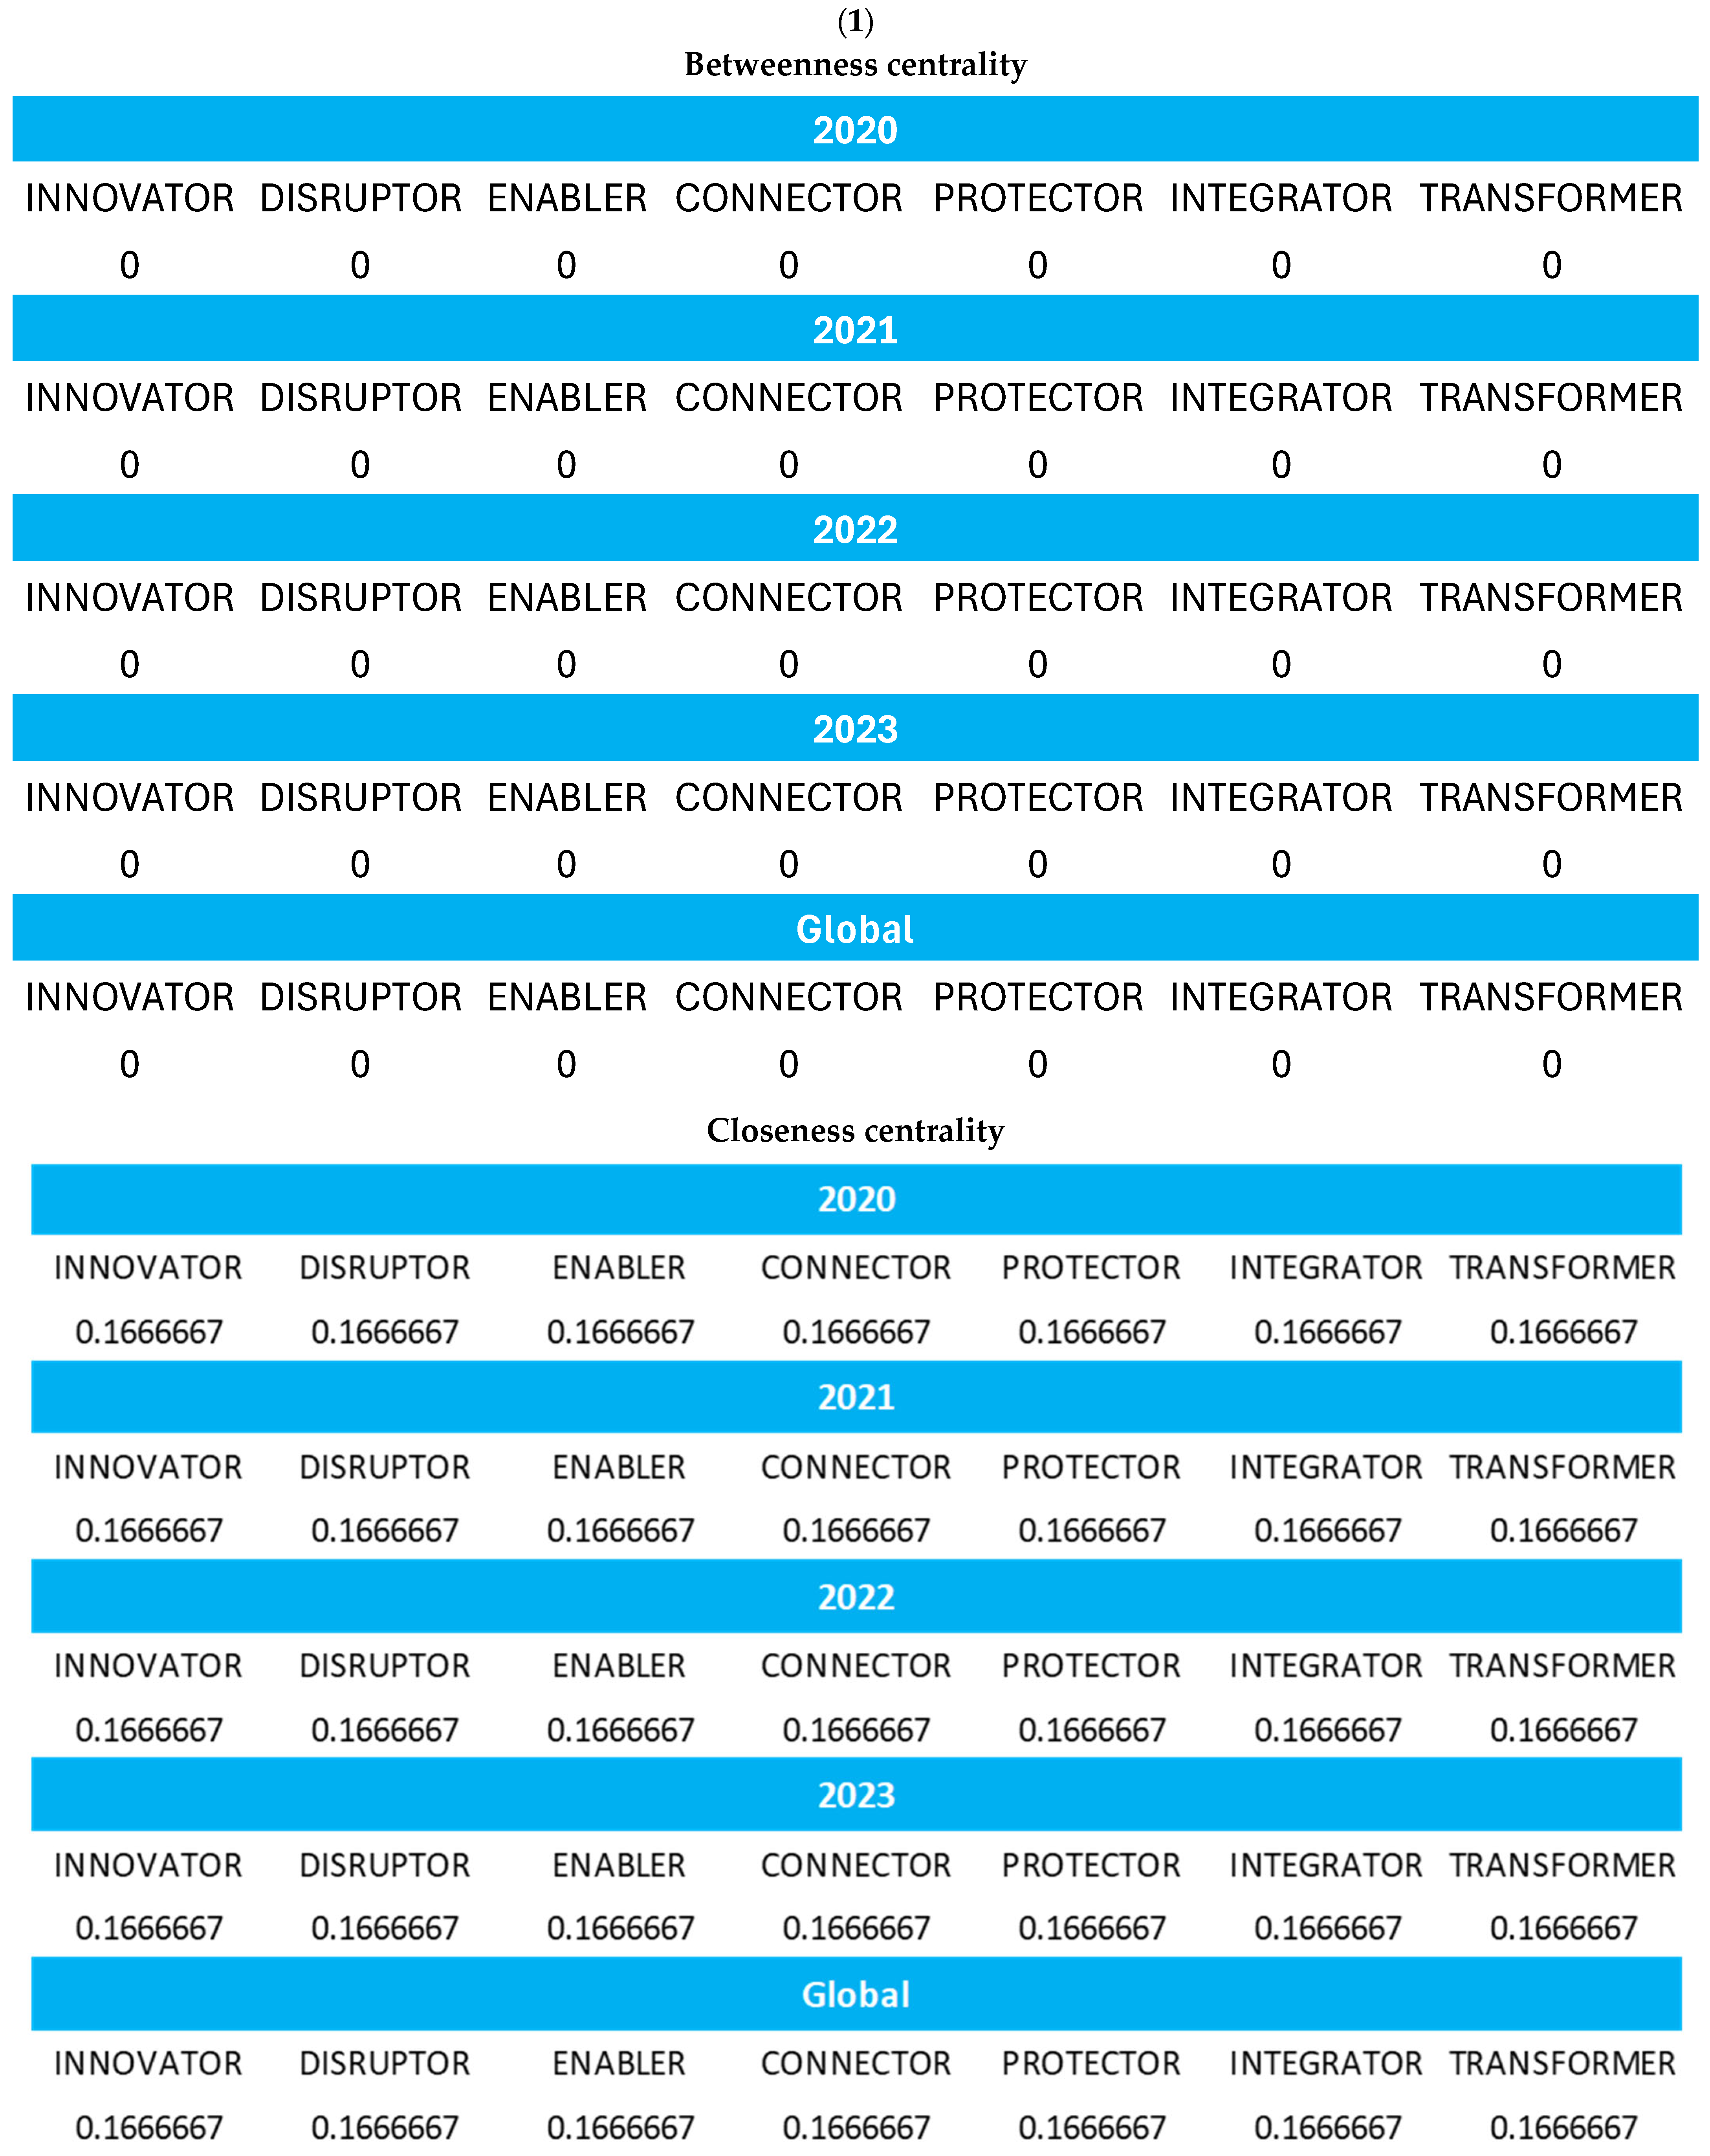
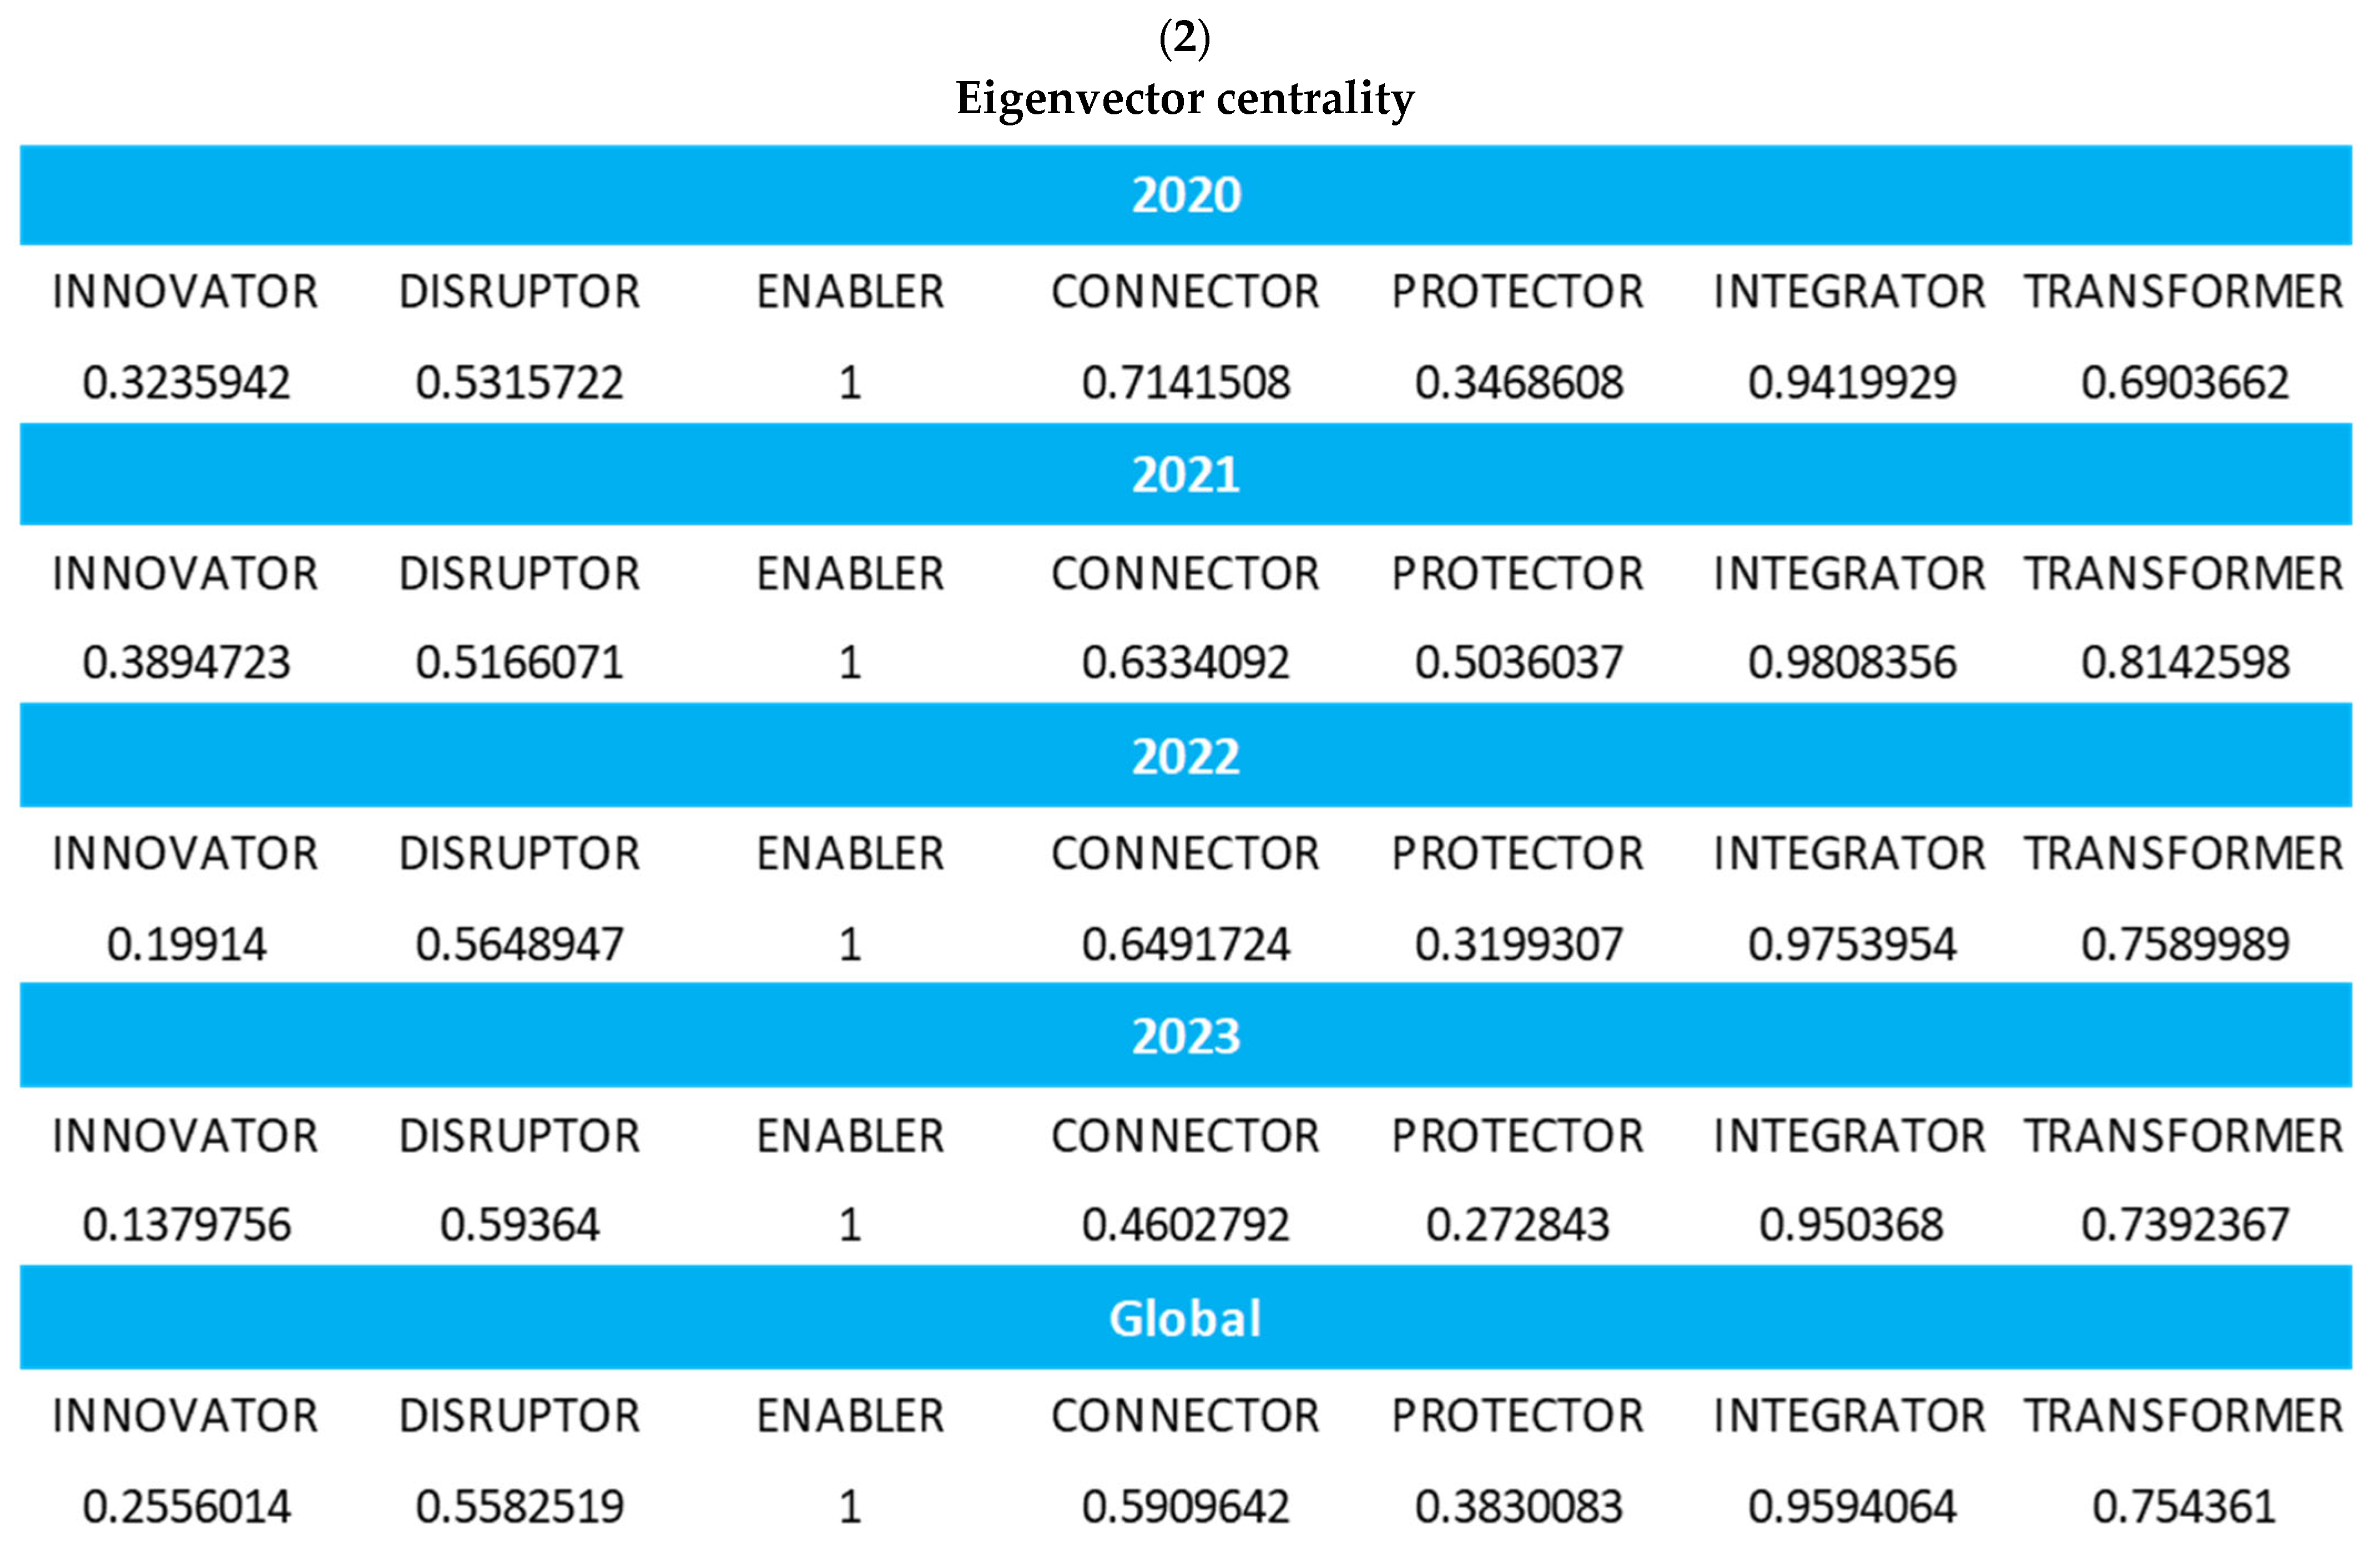
For this reason, analyzing network metrics provides valuable insights into the strategic functions of InsurTech archetypes within the evolving digital ecosystem. As illustrated in
Figure 3, which visualizes the intensity of co-occurrences between archetypes based on the final sample of 364 active InsurTech firms, the Facilitator and Integrator archetypes emerge as the most structurally influential. These two archetypes exhibit the highest degree of eigenvector centrality values, indicating their high level of connection and strategic positioning at the core of the ecosystem. They act as the technological and infrastructural backbone, enabling other archetypes to operate efficiently by facilitating integration, data flow, and digital capabilities. In contrast, Disruptors and Protectors occupy more peripheral roles, contributing specialized functionalities. Their presence, although not central, adds resilience to the overall structure of the ecosystem. Although not as dominant as the Enablers or Integrators, the Connectors show intermediate centrality values and play a crucial role in bridging the gap between customer-facing functions (such as Innovators) and more platform or operation-based capabilities (such as Transformers). Their positioning highlights the importance of access, distribution, and market interface within a digitally enabled insurance environment. Therefore, the properties of the network and the visual structure confirm that the formation of the ecosystem is not random but is shaped by strategic interdependencies as certain archetypes emerge as structural axes in the orchestration of collaborative dynamics.
Notably, the prominence of connections suggests that Enablers are foundational to the ecosystem’s functionality by providing the technological infrastructure. This archetype is crucial to the ecosystem’s infrastructure, reflecting that Enablers have multiple and robust connections with archetypes like Integrators and Transformers, which implies that they provide the necessary technologies and platforms for other archetypes to execute their operations and business models effectively. The platform of EasySend is designed to transform forms into user-friendly digital experiences whose services cater to the insurance industry and other sectors, streamlining the data intake process and workflow automation. Instanda provides a digital insurance management system designed to innovate product portfolios rapidly and integrate seamlessly with other platforms, offering a no-code insurance software platform for carriers and MGAs.
The Transformer archetype’s connections indicate that Enablers support their role in digital transformation and work closely with Innovators to apply these transformative processes to new insurance products. Their place in the ecosystem supports the idea of Transformers as agents of change, being instrumental in applying new technologies and processes within the industry, often acting as a bridge between the old (legacy) and the new (digital). Quantexa provides solutions for various industries, including banking, insurance, and government, by creating a comprehensive context, enhancing analytics, and automating decisions to optimize operations by employing a decision intelligence platform. Surfly enhances online interactions through its web technology, offering features like video and voice chat, secure e-signing, document annotation, and file sharing, seamlessly integrating into existing websites and CRM systems.
Analyzing the ecosystem landscape indicates that the role of Integrators involves combining multiple functionalities, which is facilitated by their links to other archetypes. This archetype’s strong ties with both Connectors and Enablers suggest a collaborative relationship where Integrators are using the platforms and infrastructures developed by Enablers for API technology and the market access facilitated by Connectors to create integrated offerings enhancing distribution channels. Companjon specializes in embedded insurance solutions that are fully digital, automated, and designed for high-growth businesses, offering their services by providing flexible and instant insurance coverages directly within partner platforms. Bsurance provides embedded insurance solutions that accelerate digital transformation for businesses with API connectivity and real-time policy management by enabling businesses to integrate digital insurance products at the point of sale.
The landscape’s visualization indicates that Connectors are pivotal for distributing services and integrating various aspects of the InsurTech ecosystem. Connectors are positioned as having various connections with other archetypes, especially Integrators and Enablers, suggesting they use the technological infrastructure provided by Enablers to create marketplaces that bring products to consumers while working with Integrators to offer a more seamless user experience. ManyPets is an insurance provider offering pet insurance policies for dogs and cats, offering coverage for vet bills by promising no networks or restrictions, a hassle-free claims process, and stable pricing regardless of claim frequency. Relay offers a quoting platform that simplifies cyber insurance by increasing deal flow management, providing access to digital-first and traditional carriers, and integrating solutions to boost sales efficiency.
The role of Innovators often intersects with Enablers, who provide the technological infrastructure and platform expertise necessary for Innovators to develop and deploy their products. Innovators are the foundation for new ideas and insurance products within the ecosystem. However, the thickness of the lines in the landscape manifests that the frequency and strength of these influences are low, suggesting that the insurance industry is not placing new insurance coverage models. Blink Parametric offers innovative insurance products focusing on parametric solutions by utilizing real-time data to provide immediate assistance rather than compensation after an event, involving travel insurance that automatically provides compensation if a flight is delayed. Jooycar uses telematics to enhance profitability and sales for insurers while offering better access, coverage, and pricing for car owners, since it specializes in usage-based insurance with a product that provides app-based vehicle safety and savings.
Protectors have significant co-occurrence with Innovators, suggesting that the risk mitigation technologies and strategies that Protectors develop are often the result of pioneering innovations in the industry. This connection also indicates that as Innovators introduce new products, Protectors are significant in ensuring they are secure and risk-averse. This archetype is also related to Enablers, which suggests that services add value features to the customer segments. Shapa Health focuses on behavior change for health improvement, offering digital tools and programs for employers, health coaches, and insurers, engaging users, and managing health conditions like diabetes, aiming to prevent costly medical events. DynaRisk aims to eliminate vulnerabilities and predict breaches with extensive data monitoring, offering cyber risk management and analytics tools designed to protect consumers or businesses at scale, employing solutions for insurers, brokers, and fund managers.
In this regard, the landscape indicates that Disruptors have a less intense connection with Protectors. This may imply a focus on areas other than risk mitigation, such as process innovation or cost reduction, challenging traditional business models. Disruptors’ link with Enablers could suggest that Disruptors often leverage the platforms and technologies provided by Enablers to challenge existing market norms, focusing on process automation and customer acquisition. By streamlining underwriting and claims, Bdeo revolutionizes the insurance industry with its visual intelligence solution, enabling precise damage analysis, cost estimation, and evidence capture, enhancing insurers’ decision-making capabilities. The insurance pricing platform of Hyperexponential, designed for actuaries and underwriters, enables the build and deployment of pricing models to drive profitable pricing decisions with analytics, improving change tracking and portfolio performance.
Therefore, the interaction of InsurTech dynamics allows for a symbiotic relationship in the ecosystem. Innovators may depend on Connectors for market access, while Enablers may depend on the business contributed by Connectors and Integrators to sustain platform growth. Transformers may also facilitate the adoption of new business models and technologies, promoting growth and adaptation. These archetypes’ combined activities and resources drive the ecosystem’s capacity to deliver personalized, efficient, and innovative insurance products to diverse customers. All archetypes collectively contribute to a robust landscape where connections are vital for building the InsurTech ecosystem.
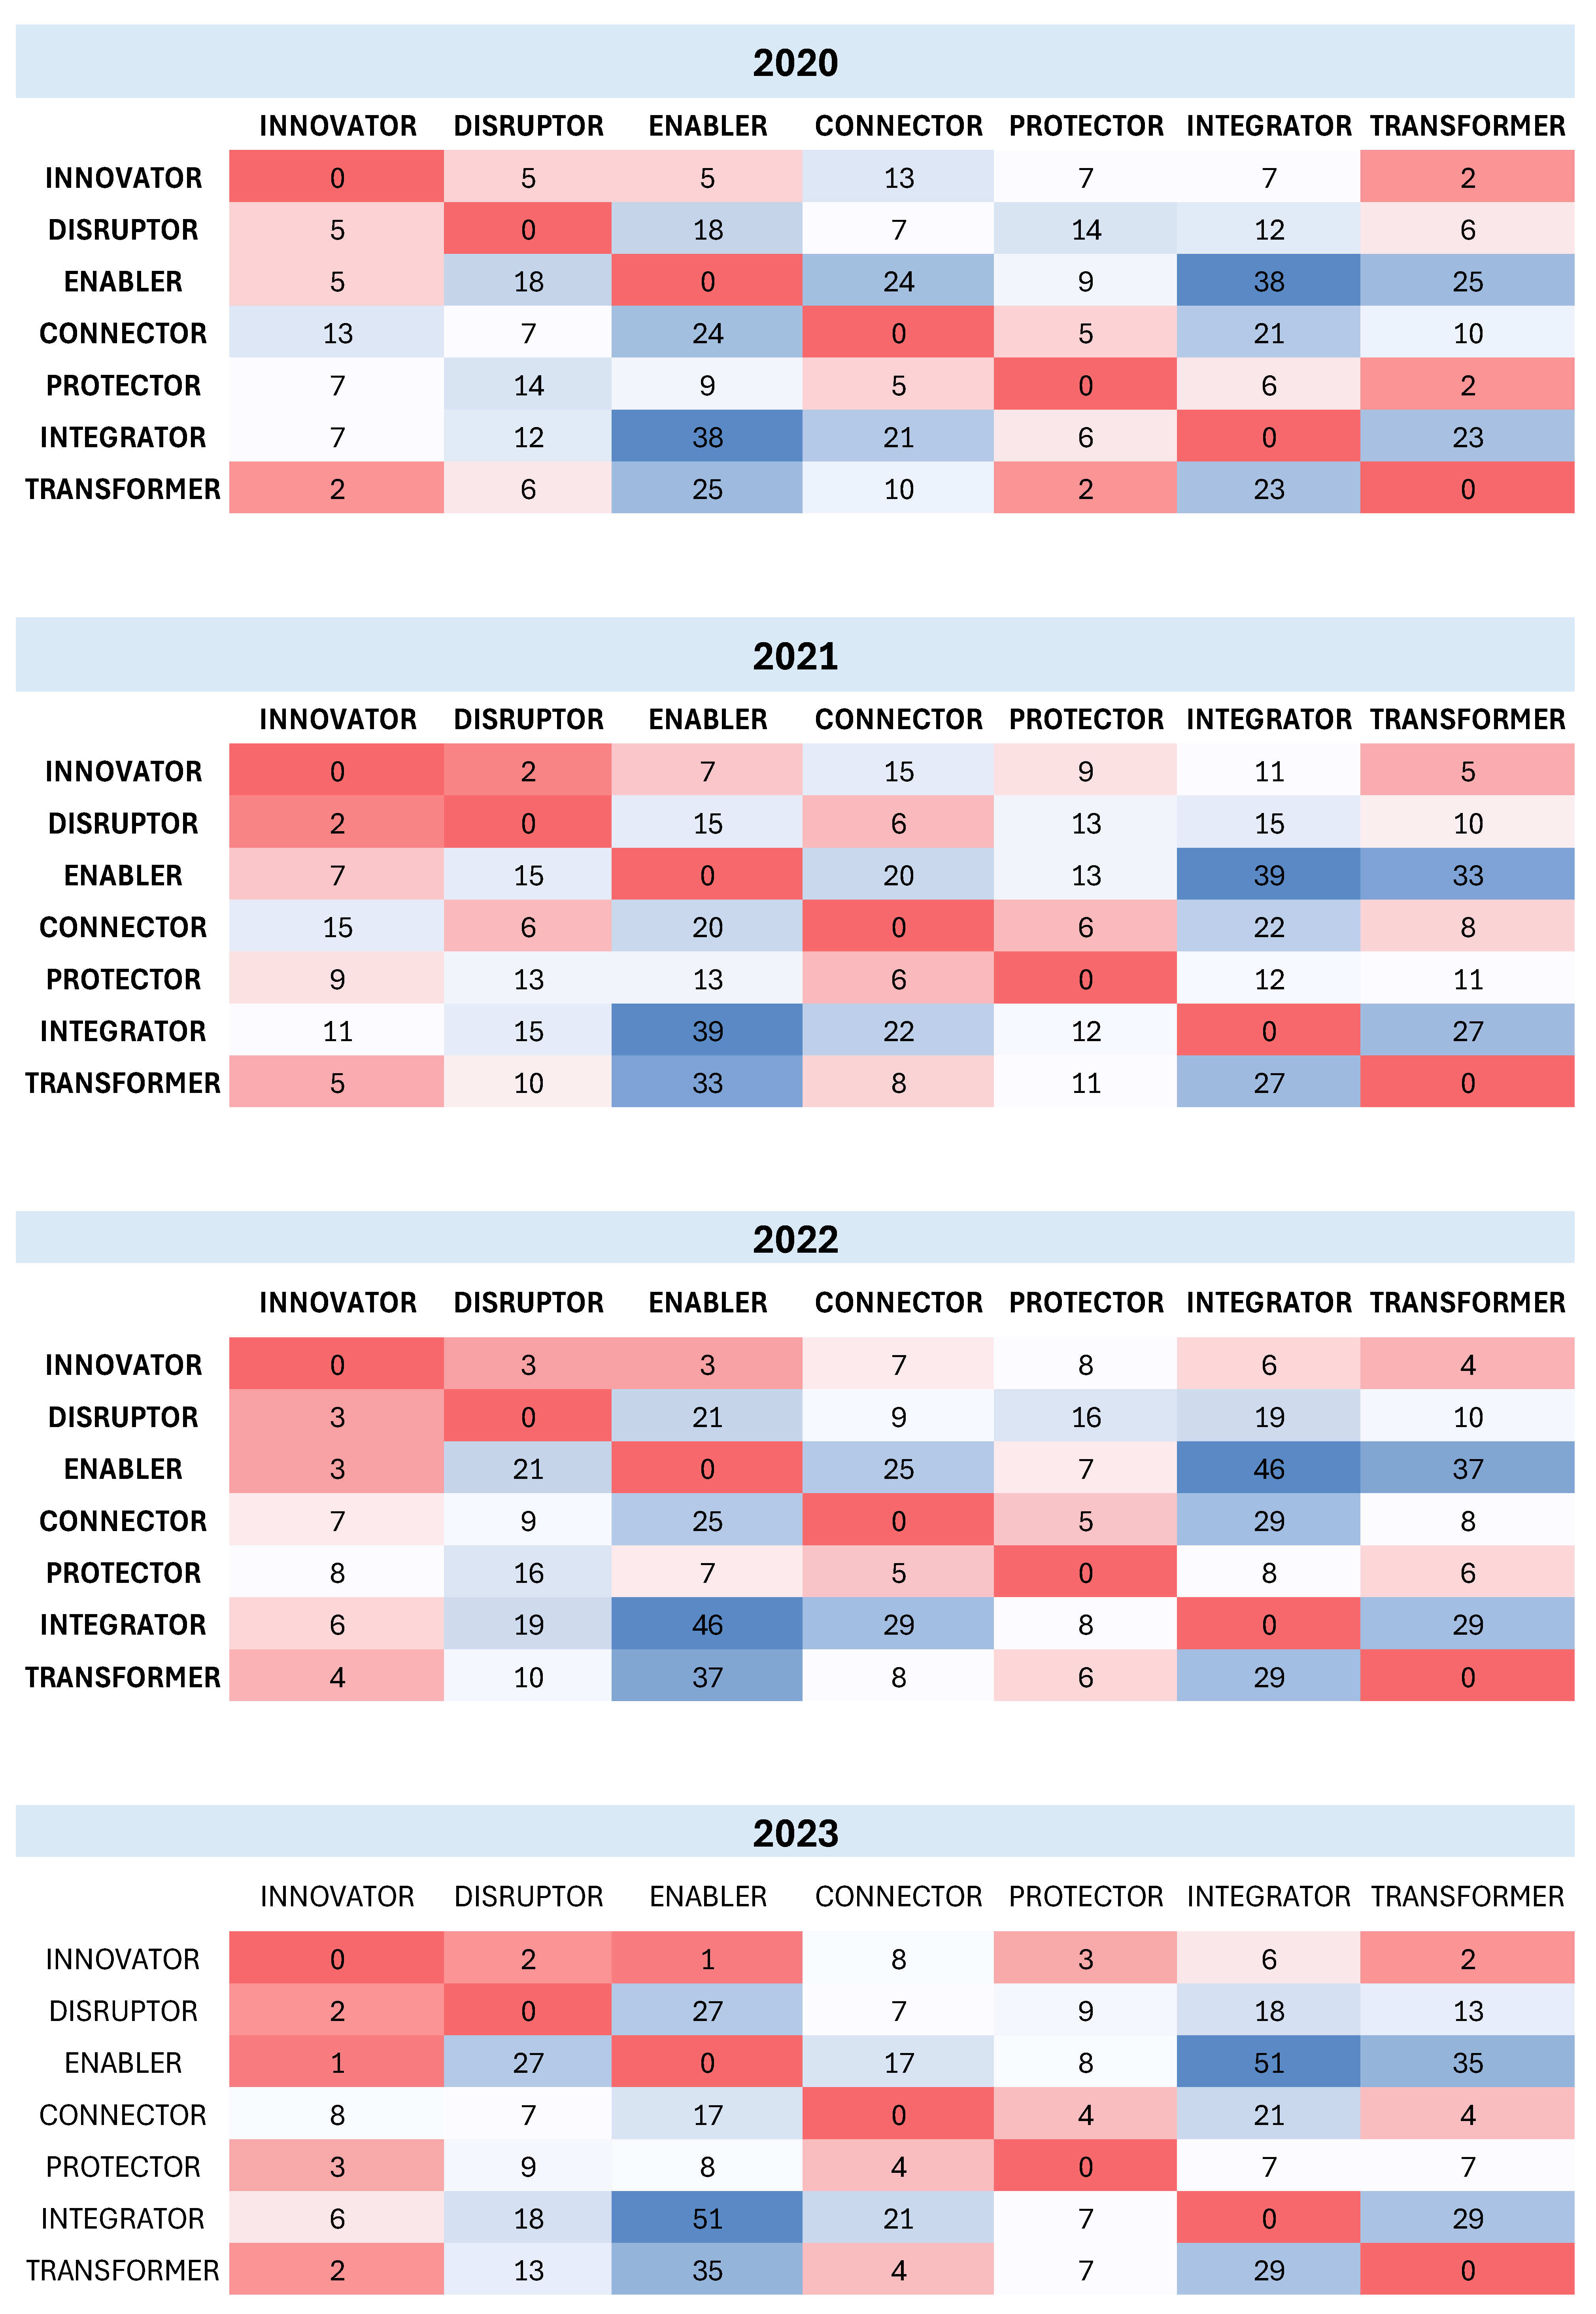
Thus, the landscape reveals a dynamic ecosystem in which the intensity of connections suggests the extent to which these archetypes collaborate or influence each other. This highlights the importance of synergistic relationships and co-innovation between the different archetypes in driving the InsurTech ecosystem within the insurance industry. From a dynamic perspective, it is evolving towards a more integrated and interconnected landscape, with different archetypes playing specialized though complementary roles. Analyzing the different InsurTech ecosystem landscapes from 2020 to 2023, shifts in the relationships and co-occurrences between the various archetypes can be observed.
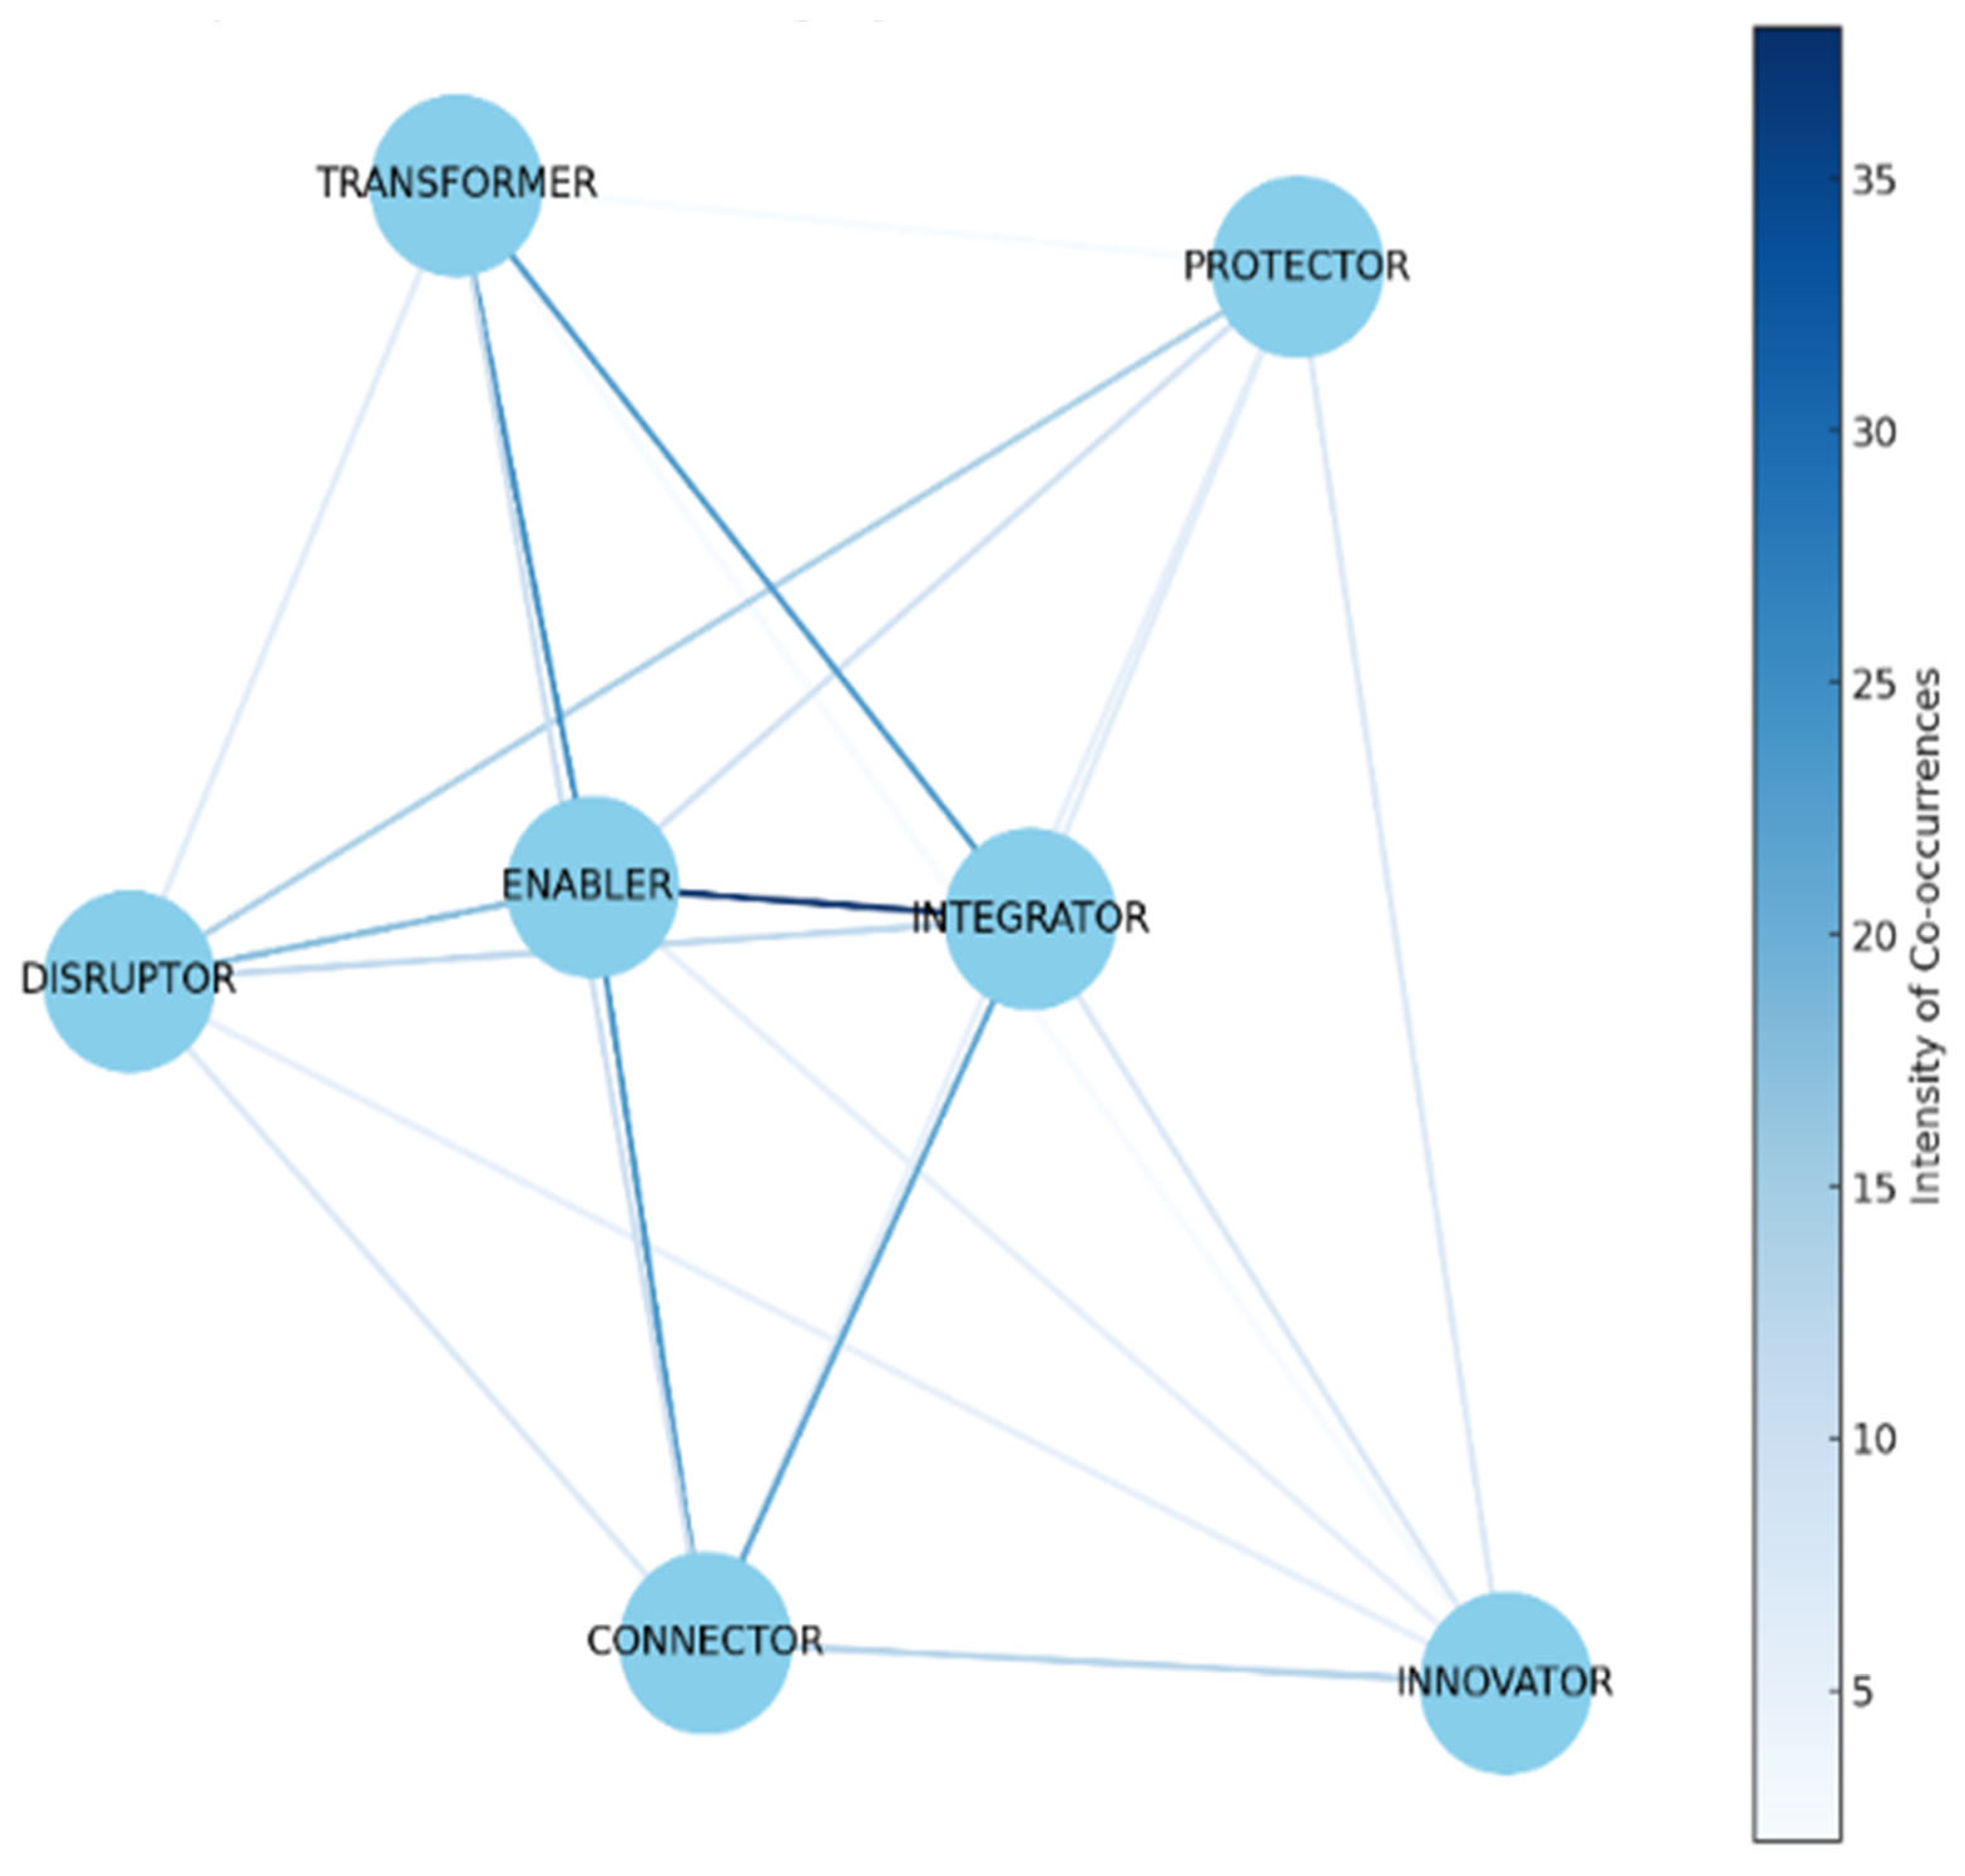
In 2020, the Enabler archetype was highly central, with strong ties to most other archetypes, suggesting it would provide them with the necessary infrastructure and technology (see
Figure 4). Also, the Transformer archetype has prominent connections, indicating a period of significant digital transformation initiatives within the industry likely driven by technological advancements and changing customer expectations. According to the insights provided by
Mapfre Economics (
2021), the pandemic accelerated the need for digital transformation across the insurance sector, making digital tools and infrastructure vital. This situation aligns with the Enabler’s role in facilitating the technological backbone that supports other archetypes. The transformative impact of technology, as underscored by these connections, indicates that the Enabler and Transformer archetypes were crucial in steering the industry through a period of unprecedented change. In this regard, it is understood that the Economic and Industry Outlook Report (
Mapfre Economics 2021) highlights that insurers had to embrace digital tools to enhance customer interaction, streamline operations, manage risks, and maintain financial stability in a volatile environment.
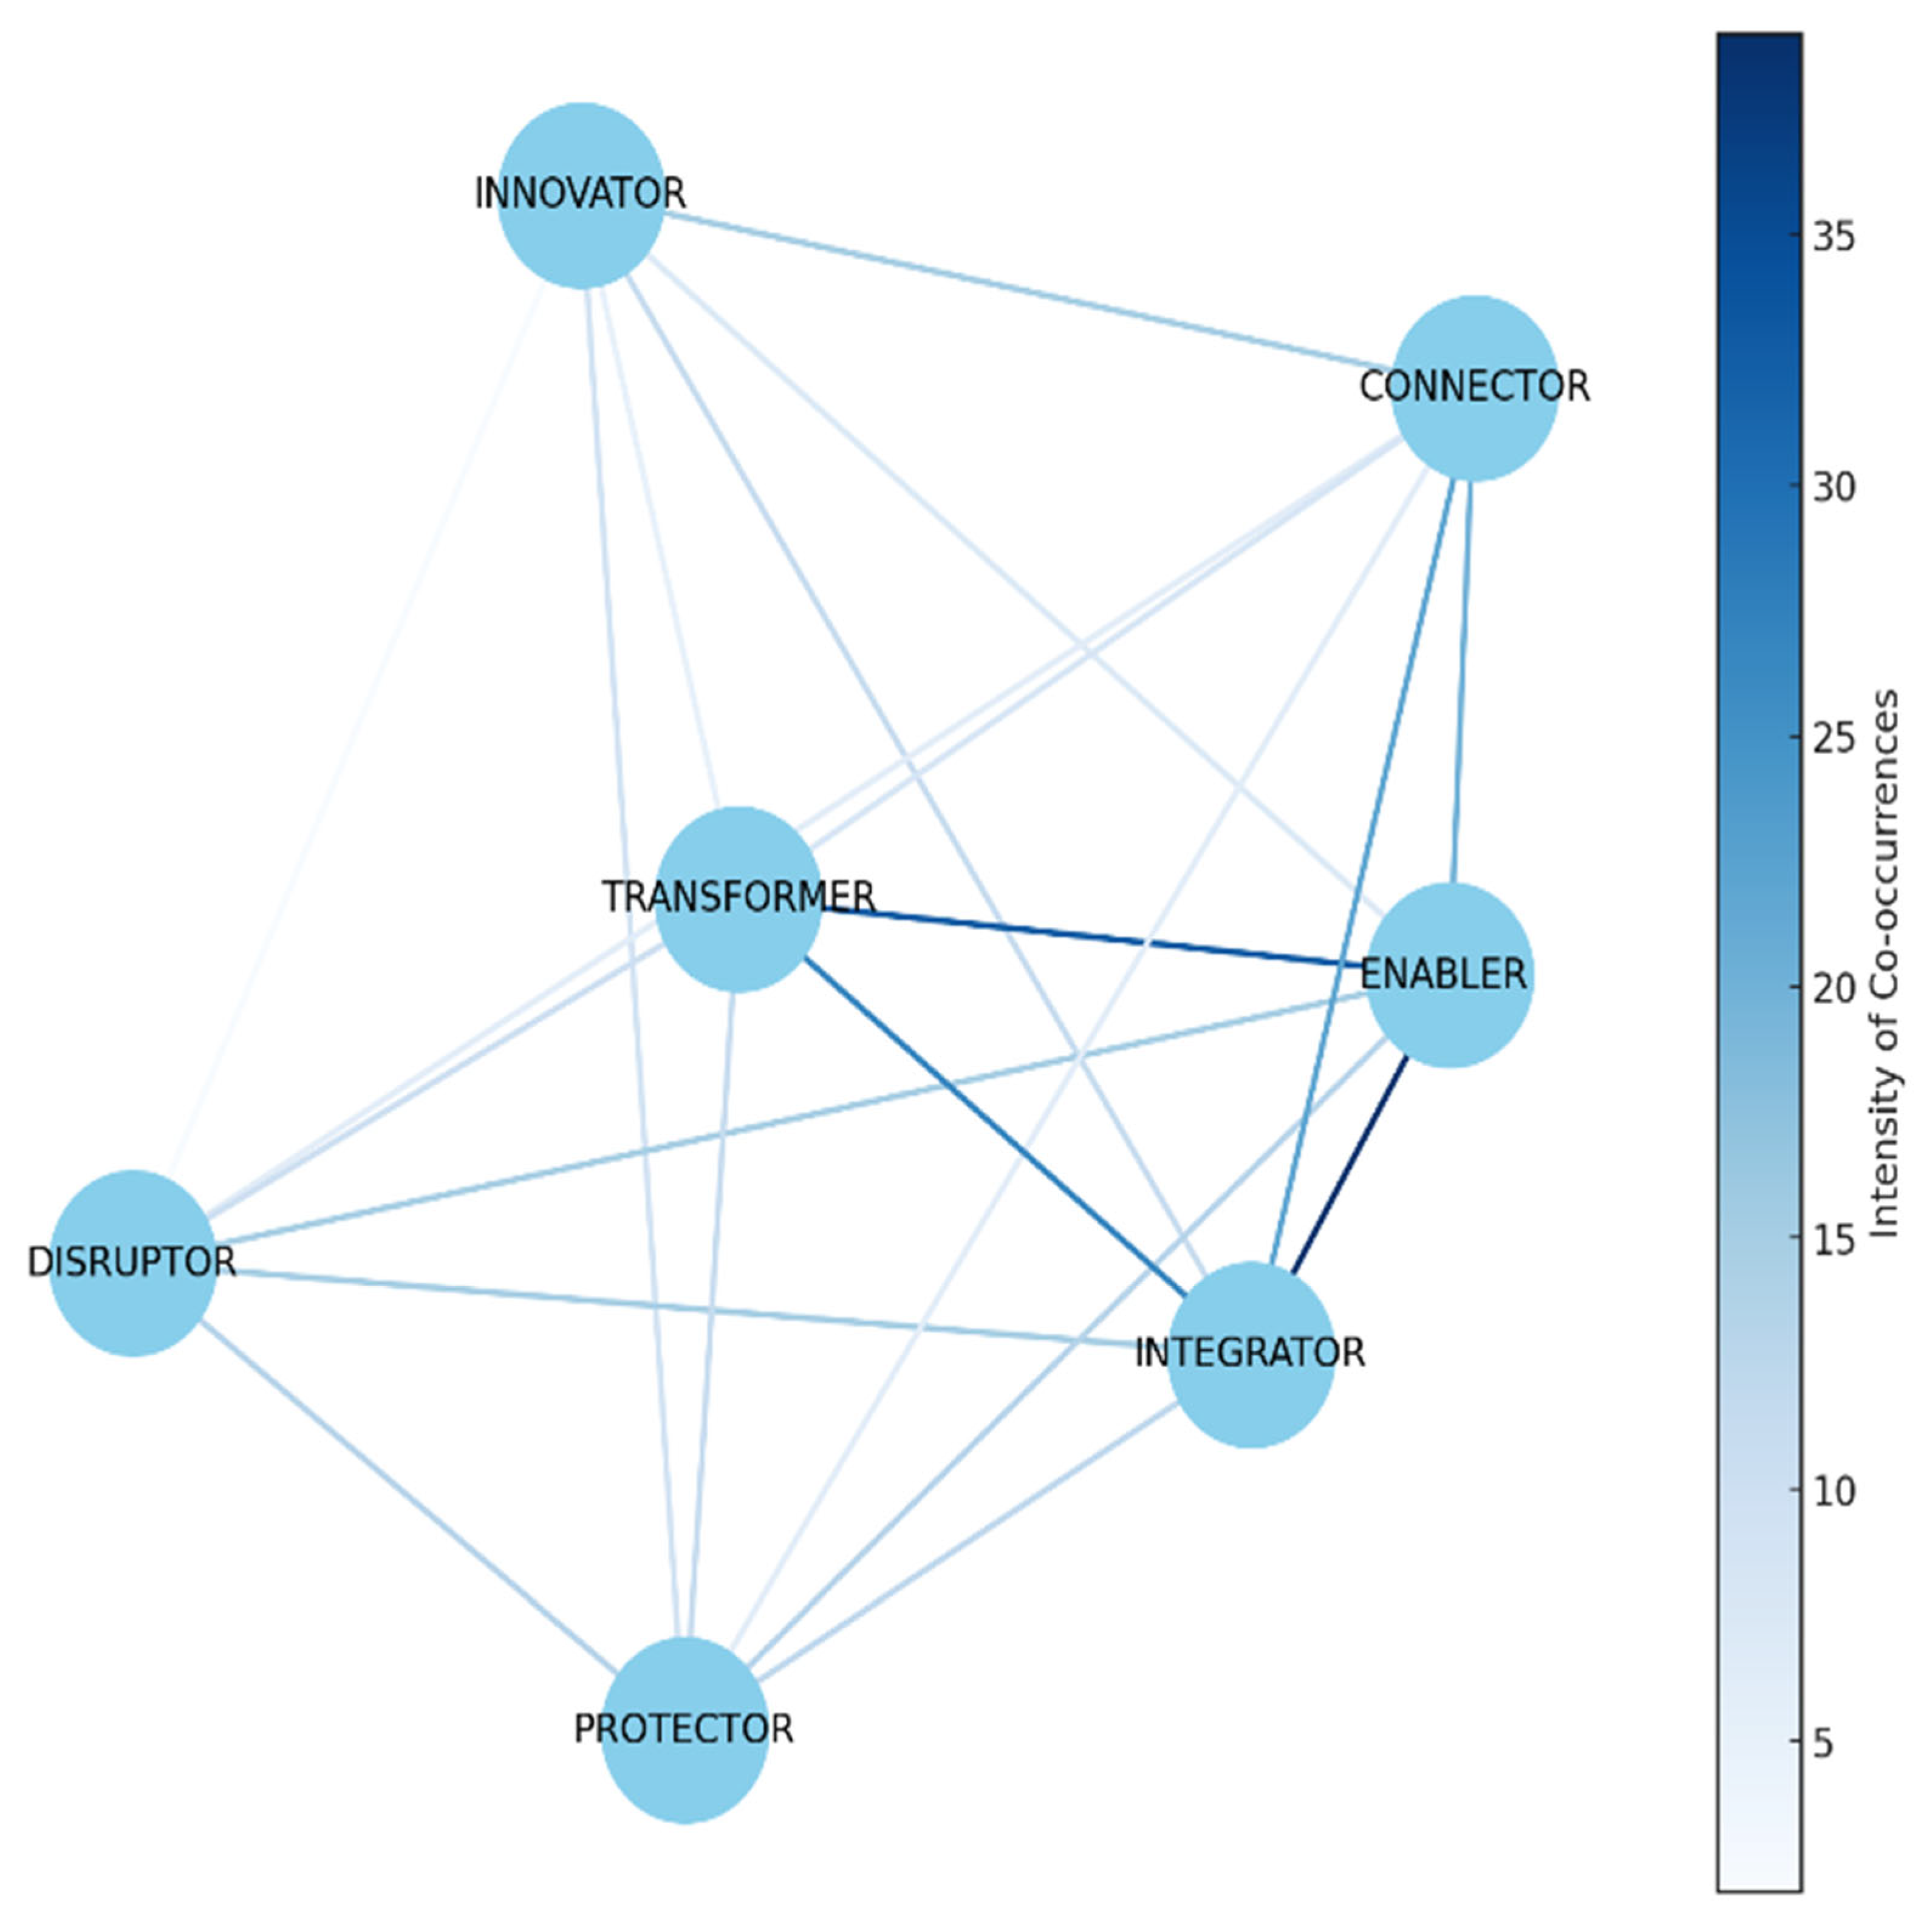
During 2021, the network dynamics shift slightly, with Connectors becoming more central alongside Enablers, suggesting a growing importance of platforms enabling connections within the ecosystem (see
Figure 5). According to
Mapfre Economics (
2022), the global economy faced significant challenges in 2021, including supply chain disruptions, rising commodity prices, and evolving consumer behaviors due to the pandemic. These factors pushed the insurance industry to focus on reinforcing existing technologies and platforms to maintain stability. It has been observed that Innovators have fewer connections than in 2020, which may imply a period of consolidation where the ecosystem is focused on expanding existing technologies and solutions. Instead of introducing entirely new innovations, the focus was on expanding and refining existing technologies and solutions to navigate the uncertainties brought by the pandemic and the shifting economic landscape. The observation that innovators had fewer connections than in 2020 is consistent with the Economic and Industry Outlook Report (
Mapfre Economics 2022), since they noted that 2021 was a year of consolidation for many sectors.
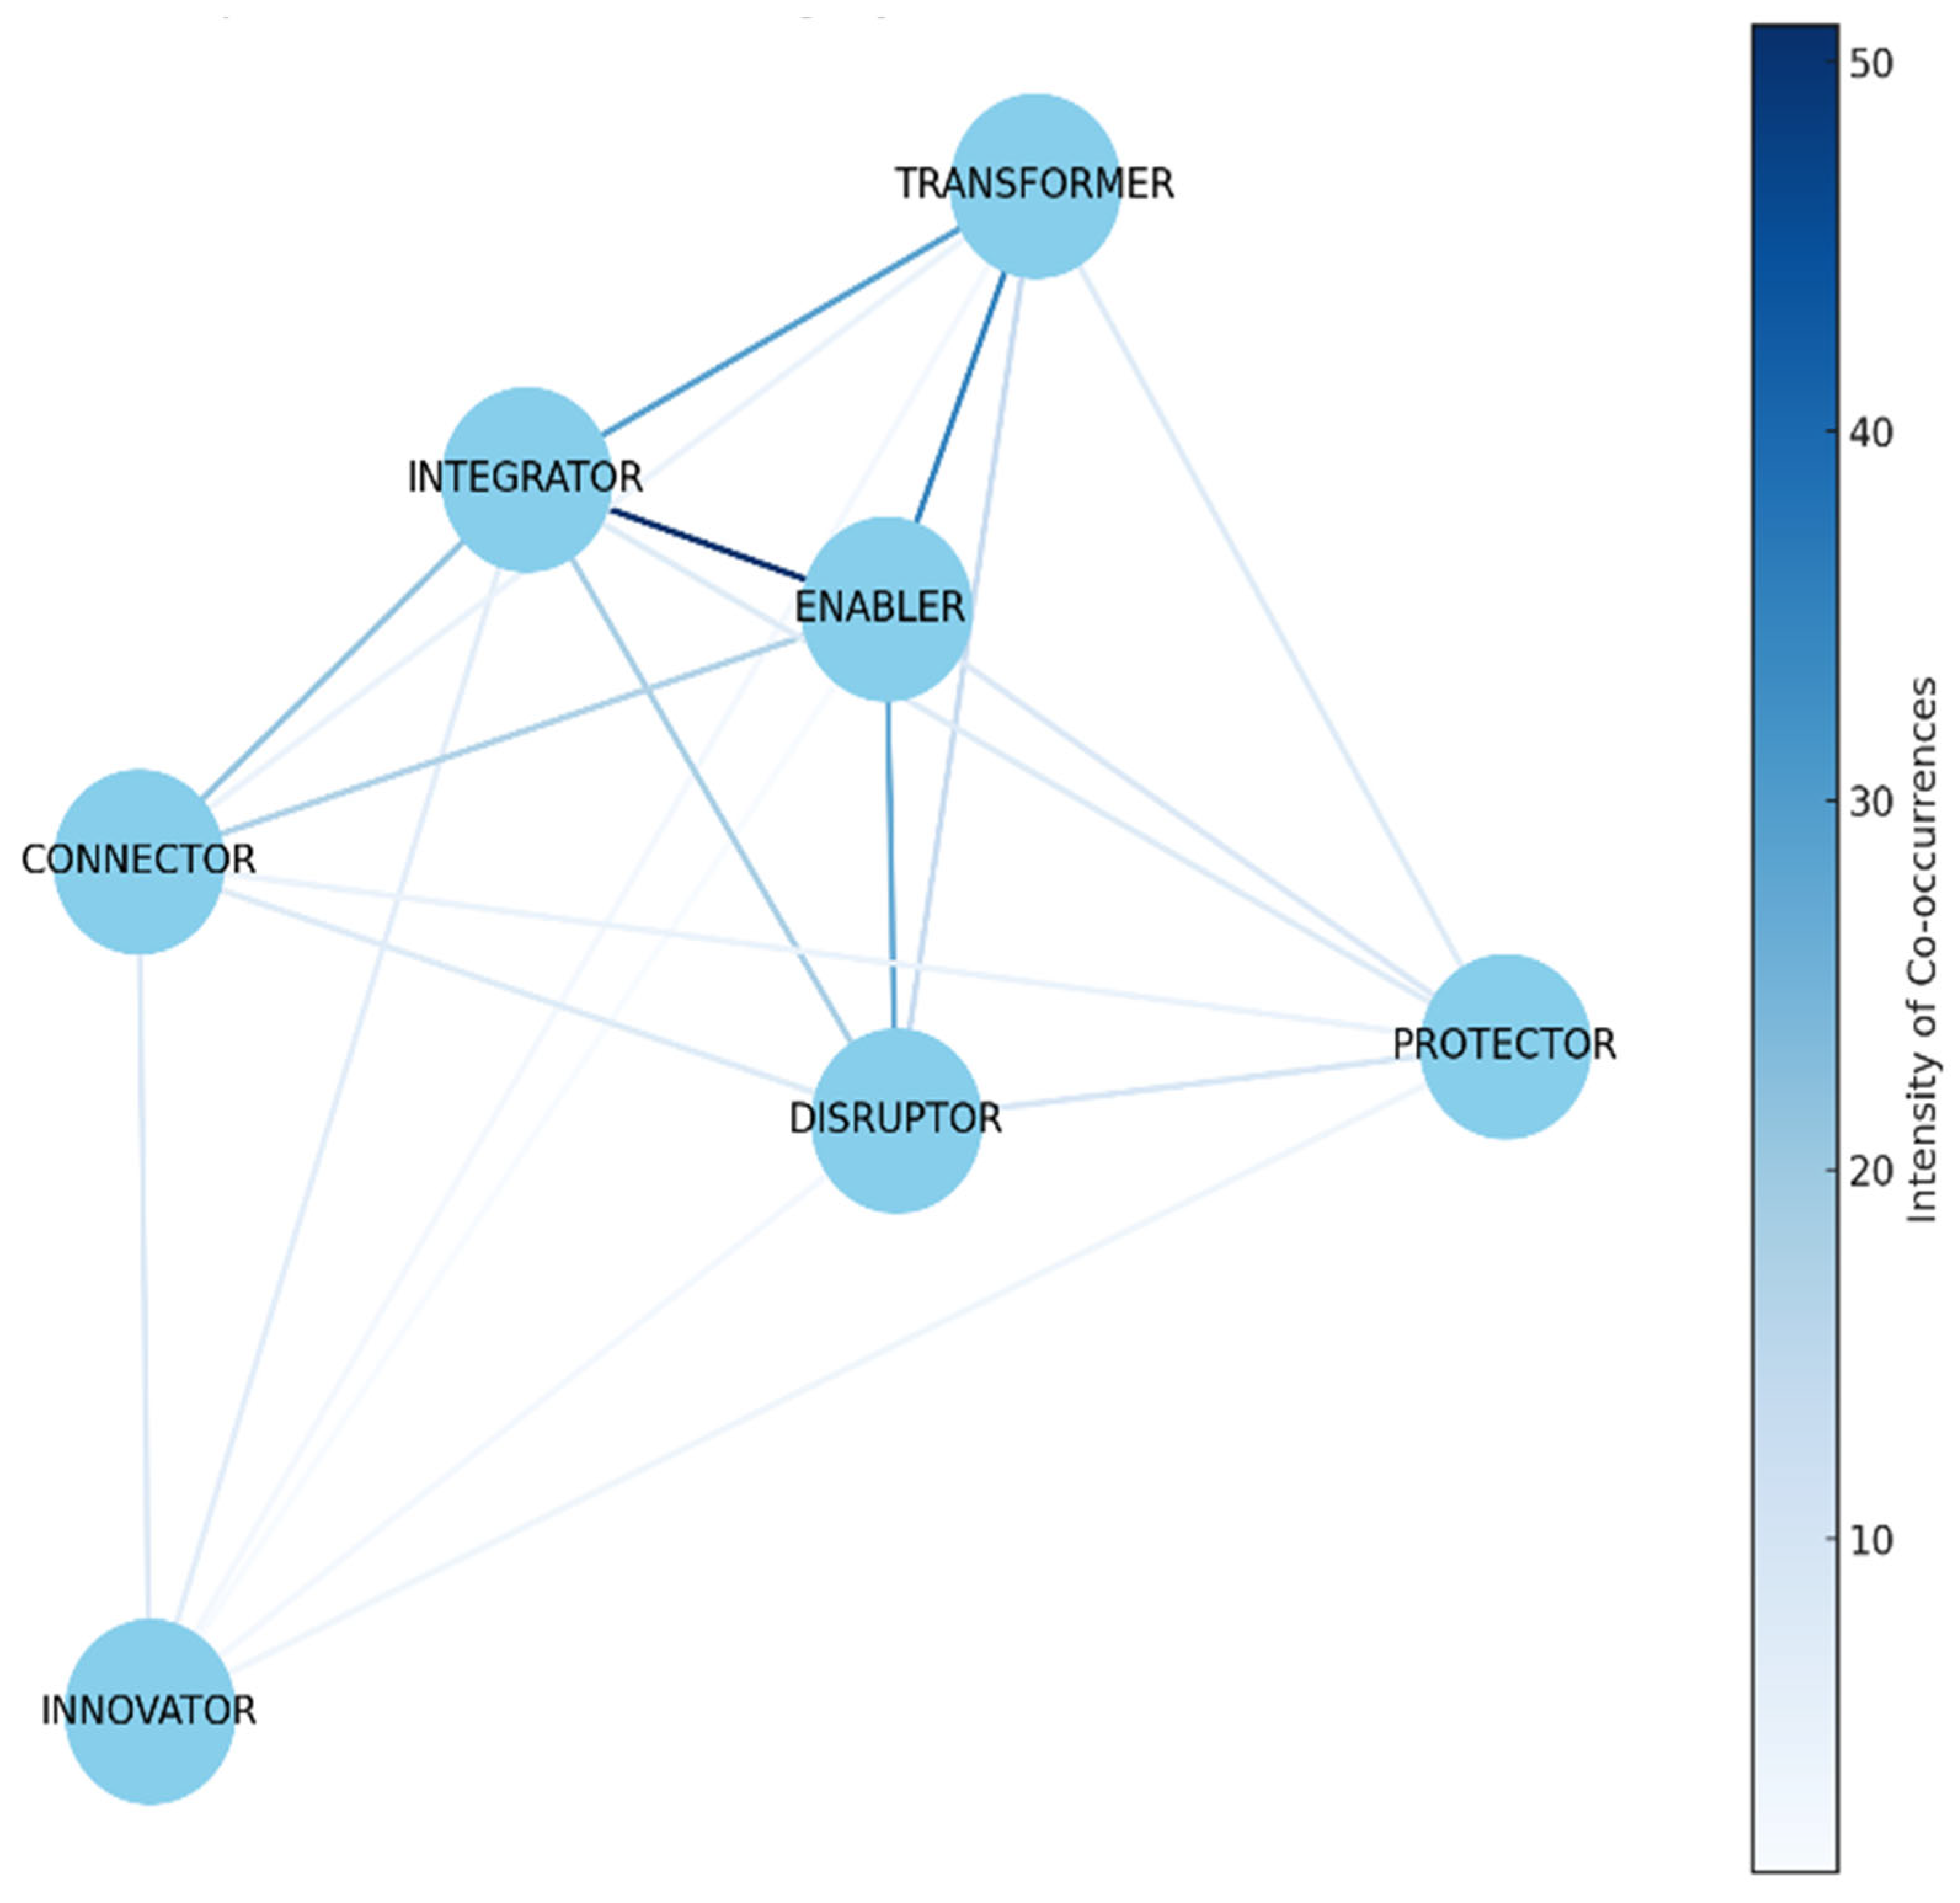
The year 2022 confirms that connections around the Enabler archetype remain strong, emphasizing the need for technological infrastructure to maintain its central role in the ecosystem (see
Figure 6). This is aligned with
Mapfre Economics (
2023), which comments on the importance of digital transformation and technology integration in the insurance industry, driven by the need to adapt to a complex and uncertain global economic environment. An increased co-occurrence between the Connector and the Integrator archetypes suggests a continued effort towards integrating seamless service offerings and connecting various aspects of the industry. In this regard, the Economic and Industry Outlook Report (
Mapfre Economics 2023) points out that, as the global economy faces stagflation and possible recessions, the insurance industry’s reliance on robust technology infrastructure and integration is even more vital to overcoming these challenges.
In 2023, the InsurTech ecosystem continues to show strong relationships between the Integrator and Enabler archetypes, reflecting current trends in the development and use of integrated platforms, given that as the sector continues to evolve, integrating services and strengthening technology infrastructure will remain key drivers for maintaining competitiveness in the industry (see
Figure 7). This is mainly because, according to
Mapfre Economics (
2024), the global economic environment remains complex, with challenges such as inflation, geopolitical tensions, and economic slowdowns impacting the dynamics of the financial industry. Furthermore, in 2023, the network shows a more balanced distribution of connections between archetypes, suggesting a maturation of the ecosystem in which roles are more distributed and interdependent. This is understandable; as stated in the Economic and Sector Outlook Report (
Mapfre Economics 2024), the insurance industry has increasingly relied on technology infrastructure in various aspects of the industry as insurers seek to maintain efficiency in an uncertain environment.
Therefore, the evolution of the InsurTech ecosystem from 2020 to 2023 suggests that Enablers and Integrators consistently have a strong connection throughout the years, highlighting the importance of robust platforms integrating multiple services and functions. Connectors increase their presence, indicating that marketplaces and platforms for insurance products are growing in importance as they facilitate the interaction between consumers and insurers. Disruptors have varying degrees of connection strength, which might be due to the nature of disruption being initially strong when a new model is introduced, then potentially declining as the market adapts and these models become the new norm. Protectors and Transformers show fluctuating intensities of co-occurrences, reflecting the varying focus on risk mitigation and digital transformation initiatives over the years. Lastly, a reduction in the centrality of Innovators in the subsequent years could indicate a shift from pioneering new ideas to implementing and integrating these innovations within the industry.
5. Discussion
These findings underscore the symbiotic relationship between a thriving startup ecosystem and the innovative potential of startups, affirming the need for comprehensive strategies to leverage ecosystem support for entrepreneurial ventures (
Crnogaj and Rus 2023). The role of insurance will be to build and coordinate an ecosystem composed of different InsurTech archetypes in collaboration with partners. This will not be an easy task, but it will be essential (
Nicoletti 2021), mainly because the InsurTech phenomenon shows no signs of slowing down, and the insurance industry must continue to embrace innovation to remain relevant in today’s rapidly evolving business landscape (
Sosa 2024).
In a digital ecosystem, symbiotic relationships between different entities drive value co-creation, leading to continuous research, development, and innovation (
Zou et al. 2022). In this regard, the InsurTech landscape from 2020 to 2023 exhibits a trend towards collaboration and integration, with technology-driven archetypes playing crucial roles in connecting various facets of the industry and enabling other archetypes to innovate and scale their offerings. As the ecosystem matures, there appears to be a balancing out of roles, indicating a possible market stabilization and establishment of collaborative pathways. A robust ecosystem nurtures innovation and provides the support and infrastructure necessary for startups to scale effectively, navigate market challenges, and sustain themselves (
Crnogaj and Rus 2023).
In the insurance industry, the evolution of the InsurTech ecosystem is multifaceted. Understanding this evolution requires a comprehensive analysis of how InsurTech has transformed the traditional insurance sector into a more dynamic and user-centric ecosystem (
Sosa and Montes 2022). Then, the formation of the InsurTech landscape suggests an evolution from sequential developments through distinct but interconnected phases. This evolution can be systematically understood through a phased approach that demonstrates the progressive construction of the current industry structure, establishing a clear cause-and-effect rationale that links these phases to the industry’s evolution in the stage-based model. Thus, the phases described provide a structured framework for understanding the progressive emergence of the InsurTech ecosystem, which suggests the formation of the scenario describing a clear evolutionary trajectory. This development, which can be defined as a transition from isolated technology-driven innovations to a collaborative and value-generating digital insurance landscape, has not occurred spontaneously but through a methodical progression that reveals interrelated stages.
In phase 1, digitalization and technologies, the dynamic nature of each InsurTech archetype is marked by its initial response to the infusion of technology into the insurance industry. This foundational phase lays the groundwork for all subsequent industry development. In this context, the increasingly competitive environment is pushing insurance companies to use advanced technologies to address multiple challenges, notably lack of trust, transparency, and economic instability (
Loukil et al. 2021). At this stage, archetypes are dynamic in the sense that they begin to shape each other’s trajectories and influence each other. In this regard, the technology provided by Enablers is critical for Innovators and Disruptors to develop their products and services. Connectors and Integrators have begun to redefine how consumers access and use these products, while Protectors and Transformers are working to make the industry more proactive and efficient.
In this scenario, the direct insurer–consumer relationship facilitated by InsurTech enhances speed, ease, and transparency in insurance processes (
Widyani 2023). This phase is about laying the digital foundation for the rest of the InsurTech ecosystem. This is mainly because implementing a complete digital transformation is not accessible for incumbent companies, since they still have to devote most of their resources to maintaining current processes and attending to the existing business (
Albrecher et al. 2019). For this reason, compared to incumbent insurers with infrastructure legacies (
Eling and Lehmann 2018), InsurTech companies typically demonstrate greater agility in testing and implementing new technologies and products (
EIOPA 2020).
In phase 2, the customer-centric approach, InsurTech archetypes begin to orient their innovations and services around the end-user experience, emphasizing personalization, convenience, and engagement. For this reason, InsurTech propositions often emphasize the individualization of coverage and pricing (
Röschmann et al. 2022), with a focus on simplicity, flexibility, and customer centricity as common value propositions (
Stoeckli et al. 2018). During this stage, the dynamism of InsurTech archetypes is highlighted by their pivot toward customer needs, ensuring that their technological advances translate into real value for the user. Transformers begin collaborating with Facilitators who provide digital onboarding and real-time data processing capabilities, enabling a seamless user experience. At the same time, Connectors play a key role in aggregating personalized offerings from multiple providers, while Integrators streamline the delivery of these tailored products through unified digital platforms. This growing interaction between archetypes reflects a shift from isolated innovation to coordinated, customer-centric value delivery, because the real value of a company comes from the customers, without whom the company itself would not have revenues, since satisfying customers is the source of sustainable value creation (
Kaplan and Norton 2004).
Academics point out that customer value in the insurance industry consists of three factors—customer value provided by the company, the agent, and the product—and affects information disclosure directly and indirectly via satisfaction and trust (
Steiner and Maas 2018). The focus is then on designing and delivering insurance products that are not only innovative but also closely aligned with what customers want and how they behave. For this reason, InsurTech has enabled insurance businesses to shift from a product-centric approach to a predominantly client-centric approach (
Krishnakanthan et al. 2021). Thus, this customer-centric phase is characterized by the fusion of technology and user experience, setting a precedent for personalized and intuitive insurance services. This phase is related to improving customer interaction and enhancing service levels through customer-oriented and data-driven solutions (
Stricker et al. 2023).
In phase 3, data and analytics, InsurTech archetypes leverage big data and advanced analytical tools to refine their offerings, improve risk assessment, and drive operational efficiency. In this phase, data and analytics become the backbone of growth and innovation within the InsurTech ecosystem, since they can deeply align with the operational characteristics of the insurance industry and improve the multi-dimensional analysis ability and efficiency of insurance companies (
Ghosh 2017). Specifically, it is relevant to note that big data is at the heart of the insurance industry through its usage, considering the beginning when humans could store more digital information in technological tools than ever (
Belhadi et al. 2023).
For instance, the operation of commercial health insurance focuses on using data as new factors of production, analyzing and applying them through InsurTech, realizing the transfer of data from unstructured to structured, and improving the risk selection, underwriting structure, and pricing capabilities of the traditional insurance industry (
Zhao et al. 2023). Thus, each archetype becomes more dynamic by using data to inform its strategies and operations and creating feedback loops in which data collection and analysis lead to continuous improvement and adaptation. During this phase, Protectors leverage cybersecurity analytics to help insurers and policyholders mitigate digital risks before claims occur. At the same time, Disruptors use behavioral data and artificial intelligence to automate underwriting and claim processing, improving the speed and accuracy of risk assessment. These innovations are often supported by Enablers, who provide advanced data platforms and insights that power the models used by Disruptors and Protectors. These interactions highlight how data and analytics are integrated across the ecosystem, enabling each archetype to contribute to a more predictive, responsive, and intelligence-driven insurance model. This focused stage is characterized by greater responsiveness and can use predictive rather than merely reactive business models, where insurers face the problem that data across an ecosystem may be specified in quite different ways and will require substantial work to integrate (
Naylor 2017). This is mainly because insurance is about information and not goods, since data are the basis of the information on the insured asset (
Nicoletti 2021).
In phase 4, platform-based business models, InsurTech archetypes capitalize on digital platforms to extend their reach, enhance customer engagement, and create new value networks. The integration of InsurTech has led to the creation of new value networks within the insurance sector, emphasizing the importance of understanding the exchanged resources between actors for value creation (
Stoeckli et al. 2018). Connectors act as multifaceted digital platforms that connect insurers, brokers, and customers through a unified interface, simplifying the purchase and management of insurance products. At the same time, Integrators incorporate insurance offerings directly into broader consumer journeys, such as mobility or gig economy platforms, while Enablers provide the underlying infrastructure to scale these solutions efficiently. This convergence illustrates how archetypes collaborate within platform-centric models, transforming insurance distribution into a seamless, data-rich, customer-centric experience. For this reason, with new business models, such as the digital platform, which is gaining popularity across different industries, the key to business model innovation is imitation (
Frankenberger and Stam 2020). This phase is characterized by the strategic use of platforms to facilitate collaboration. For this reason, as
Naylor (
2017) pointed out, most current platform providers are not inherently interested in providing insurance, since they take the opportunistic view that it is one of many possible products they could provide via their platforms.
Then, in this phase, the dynamism of InsurTech archetypes is manifested in their ability to adapt and exploit platform-centric business models, since platforms allow them to connect more deeply with customers, experiment with new business models, and increase efficiency. Notably, the success of InsurTech firms and the expectations that customers bring from e-commerce experiences force insurers to adapt the architecture of their business model (
Röschmann et al. 2022). It is, therefore, understandable that the future growth of InsurTech platforms was anticipated in the
Business Wire (
2020), which projected that global InsurTech market revenues will increase at a compound annual growth rate of 10.8% from 2019 to 2025. The platform can be considered a dynamic business ecosystem that combines a range of complementary products with an integrated structure, which constitutes a specific market (
Baldwin et al. 2006). Then, with an increasing number of digital platforms, insurance companies face the challenge of aligning their business models with customer demands, embracing intellectualization, enhancing product flexibility, and establishing an open ecosystem (
Volosovych et al. 2021), because multi-sided platforms are emerging as new market forms for insurance intermediation (
Stricker et al. 2023). Consequently, the shift to platforms represents a significant evolution in the way insurance products are developed, distributed, and consumed, and the InsurTech archetypes that thrive in this environment are the ones that can leverage these platforms to create competitive advantages and new customer value propositions.
In phase 5, ecosystem partnerships, InsurTech archetypes engage in strategic collaborations that go beyond the traditional boundaries of the insurance industry. This is the logical evolution of the previous phase, as the platform innovation ecosystem is an interdependent partnership established by the central company, which opens the innovation interface with other participants that develop products or supporting technology for the platform company (
Yao and Zhou 2016). Consequently, successful organizations increasingly do not just add value but reinvent it by mobilizing value creation through new combinations of players and services in an integrated ecosystem (
Nicoletti 2021). They form alliances with various stakeholders, including those from different sectors, to innovate, expand, and diversify their offerings. For instance, Transformers have developed strategic partnerships with healthcare, e-commerce, and mobility companies to integrate insurance into broader service ecosystems, enabling cross-sector integration. Meanwhile, Innovators collaborate with telecommunications operators and mobile wallet providers to offer microinsurance in emerging markets, combining distribution, data, and financial infrastructure. The ecosystem concept provides a more customer-focused system view in the industry, in contrast to the traditional focus on insurance services that only included a single insurance provider and a customer (
Greineder et al. 2020).
Therefore, the evolution of the InsurTech ecosystem, as conceptualized through the five-phase model, reflects a progressive evolution of the insurance sector. Phase 1 (digitalization and technologies) lays the digital foundations necessary to overcome the limitations of legacy systems, enabling a new paradigm in which users can simultaneously consume and co-create services (
Greineder et al. 2020;
Riasanow et al. 2018). Phase 2 (customer-centric approach) marks a strategic shift towards personalization and user experience as the main drivers of value. In this context, customer satisfaction is not a secondary outcome but the cornerstone of long-term value creation (
Kaplan and Norton 2004). In phase 3 (data and analytics), predictive models, advanced analytics, and real-time data processing become the operational core of the ecosystem, enabling the development of personalized insurance solutions aligned with dynamic risk profiles (
Cosma and Rimo 2024). Phase 4 (platform-based business models) reflects a stage of consolidation in which co-creation of value occurs through modular and multilateral platforms. This platform improves cross-functional collaboration and fosters systemic efficiency within the ecosystem (
Frankenberger and Stam 2020;
Greineder et al. 2020). Finally, phase 5 (ecosystem partnerships) signals the maturity of the InsurTech ecosystem, as companies increasingly integrate insurance into a broader landscape of services and strategic alliances. This phase represents a networked value proposition in which insurance is integrated into broader constellations of services, reflecting the logic of open innovation and interdependent systems (
Nicoletti 2021;
Jahn and Bohnet-Joschko 2022).
For this reason, InsurTech firms are breaking down the industry’s traditional silos and actively seeking growth and innovation through partnerships. Based on the rising importance of this scenario, an insurer’s ability to build ecosystems becomes a critical source of competitive advantage (
Jahn and Bohnet-Joschko 2022) since, at a theoretical level, insurance value provided by a resilient ecosystem is a dynamic ecosystem service (
Quaas et al. 2019). This convergence within the InsurTech landscape reflects a mature understanding of the value that can be unlocked through shared expertise, data, and technology. This scenario presents a future in which insurance is not a stand-alone offering but an integral network of interconnected services and value propositions. In this evolving landscape, even an insurance startup with limited capital and no prior experience can potentially disrupt the market, significantly challenging the established positioning of incumbent companies (
Nicoletti 2021).
6. Conclusions
InsurTech has emerged as a disruptive global player in the insurance industry, challenging the status quo and transforming traditional practices within the insurance industry. The dynamics of interactions between InsurTech firms have contributed to developing a maturing ecosystem in the insurance industry by introducing a high level of interconnectedness between various stakeholders, including insurers, reinsurers, startups, technology providers, and regulatory institutions. For this reason, InsurTech dynamics employs a collaborative network of interconnected archetypes that create, deliver, and capture value in this evolving ecosystem within the insurance industry.
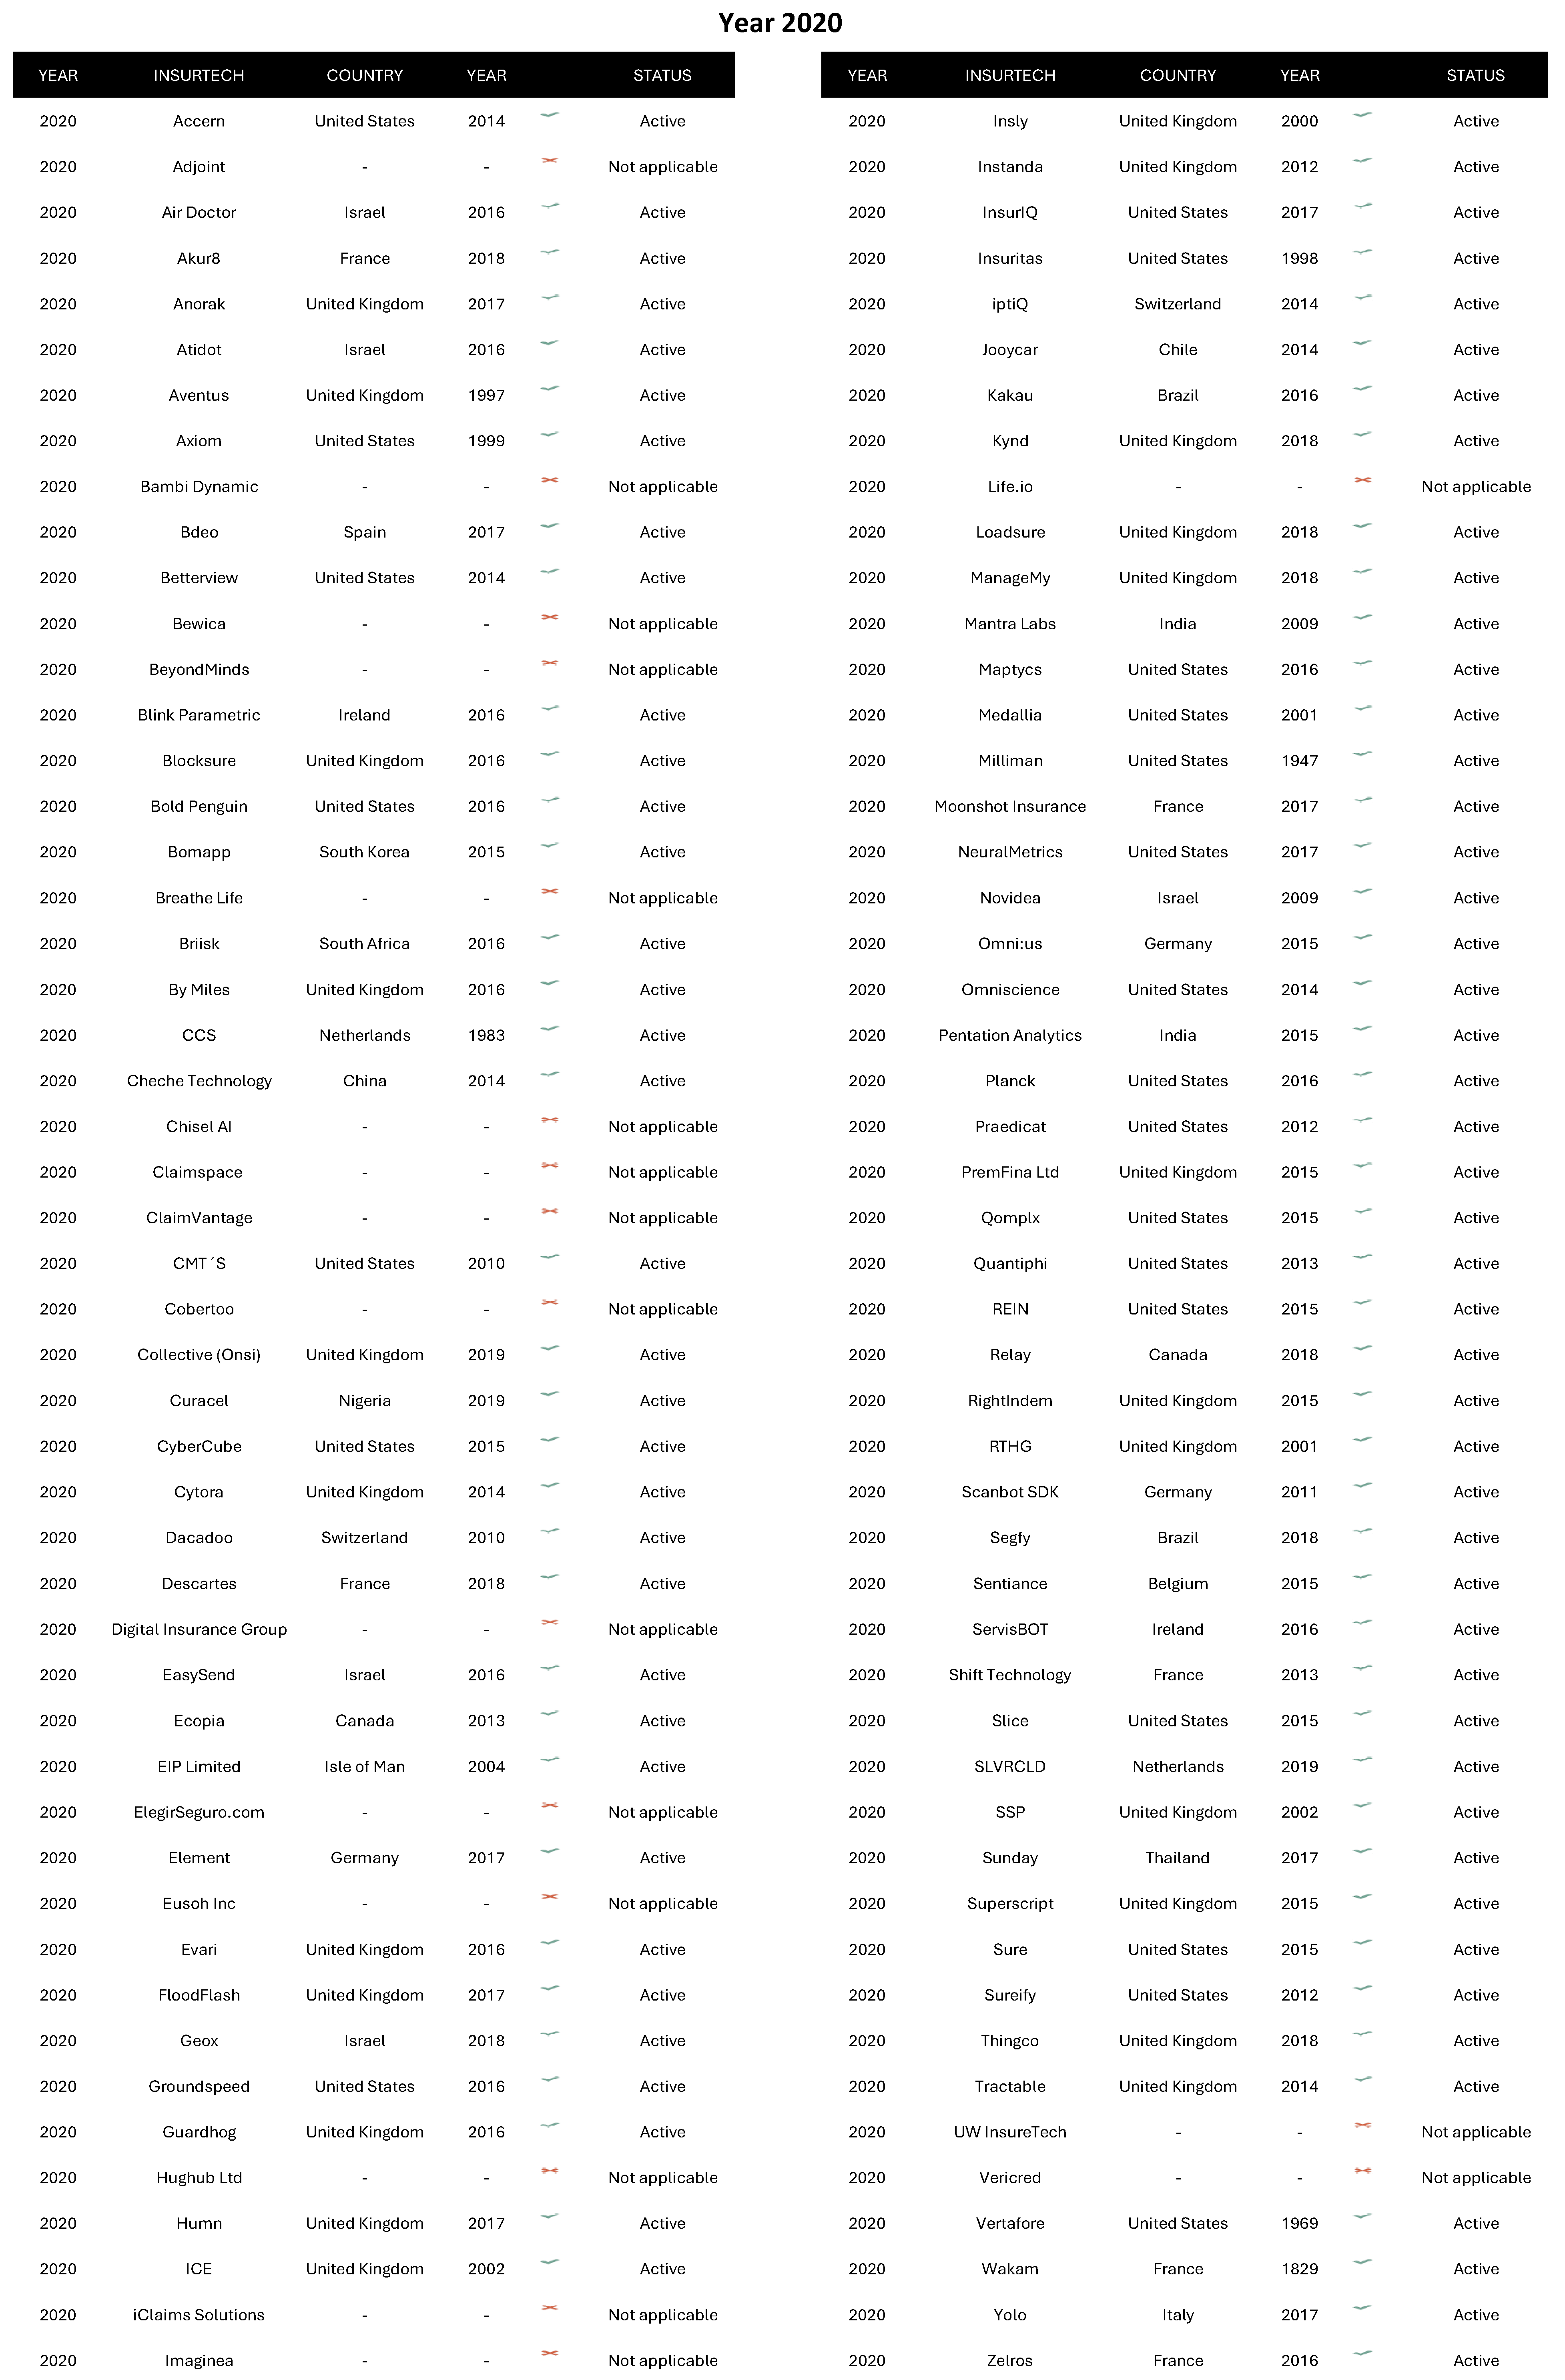
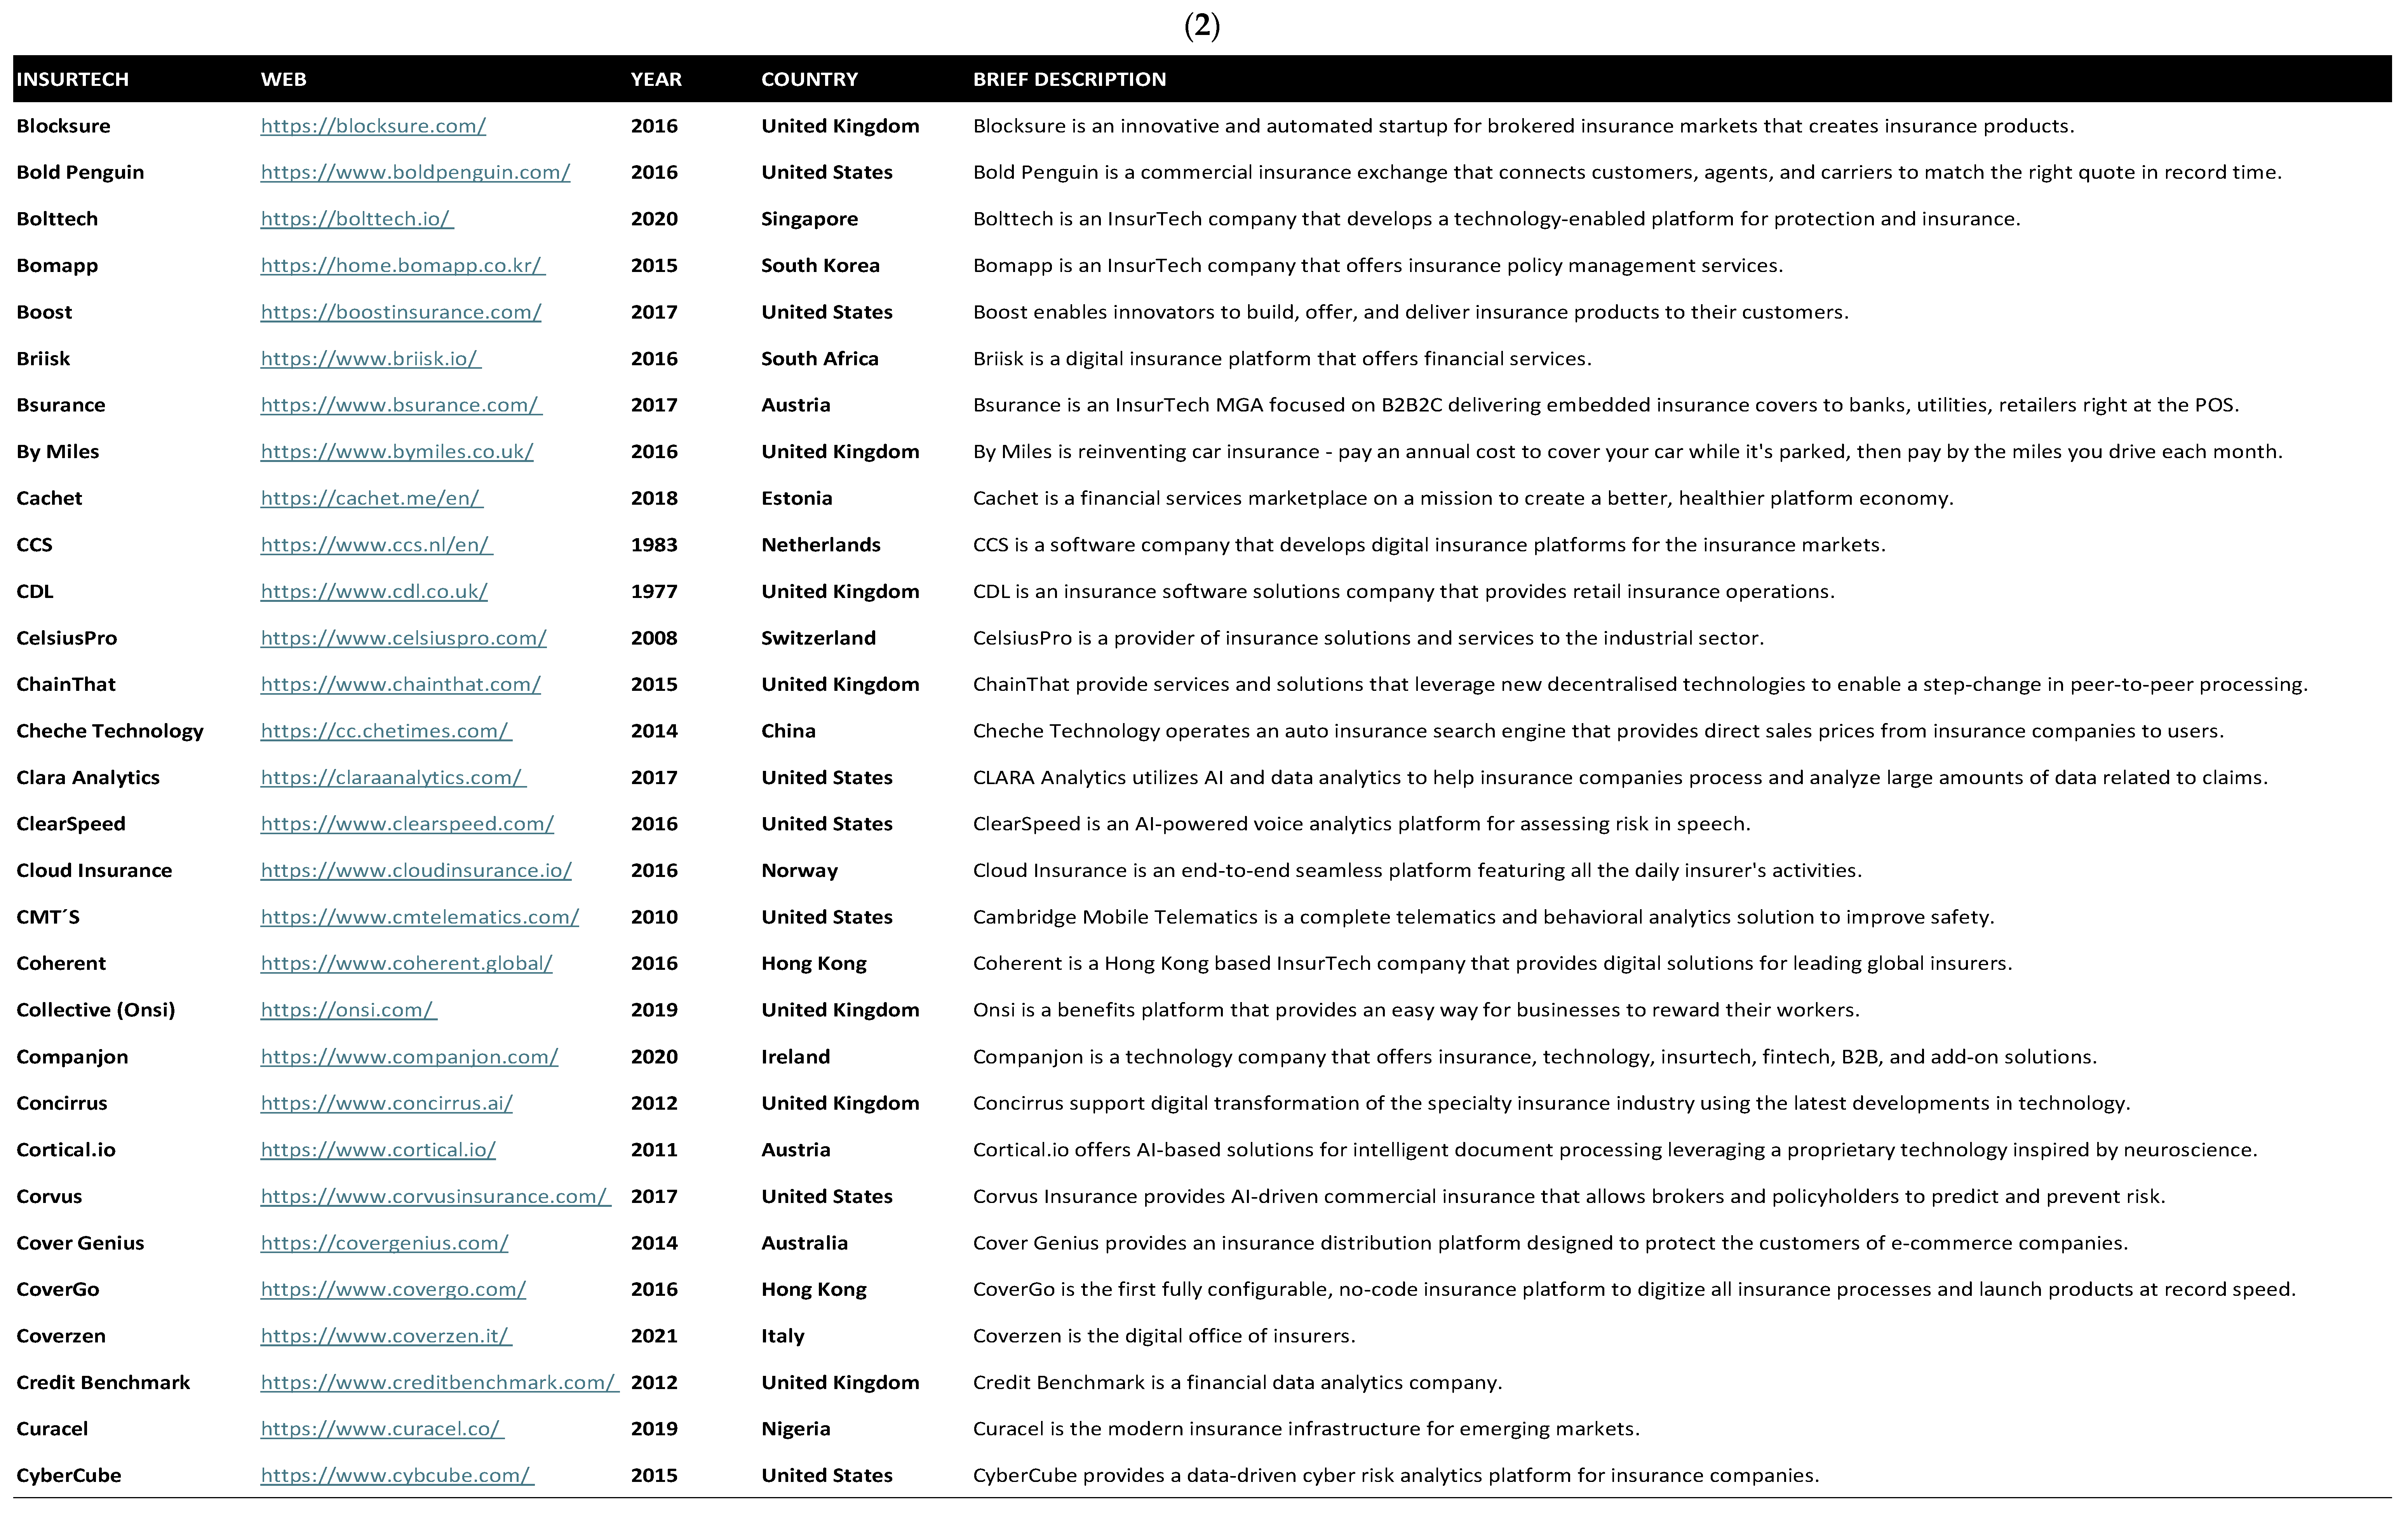
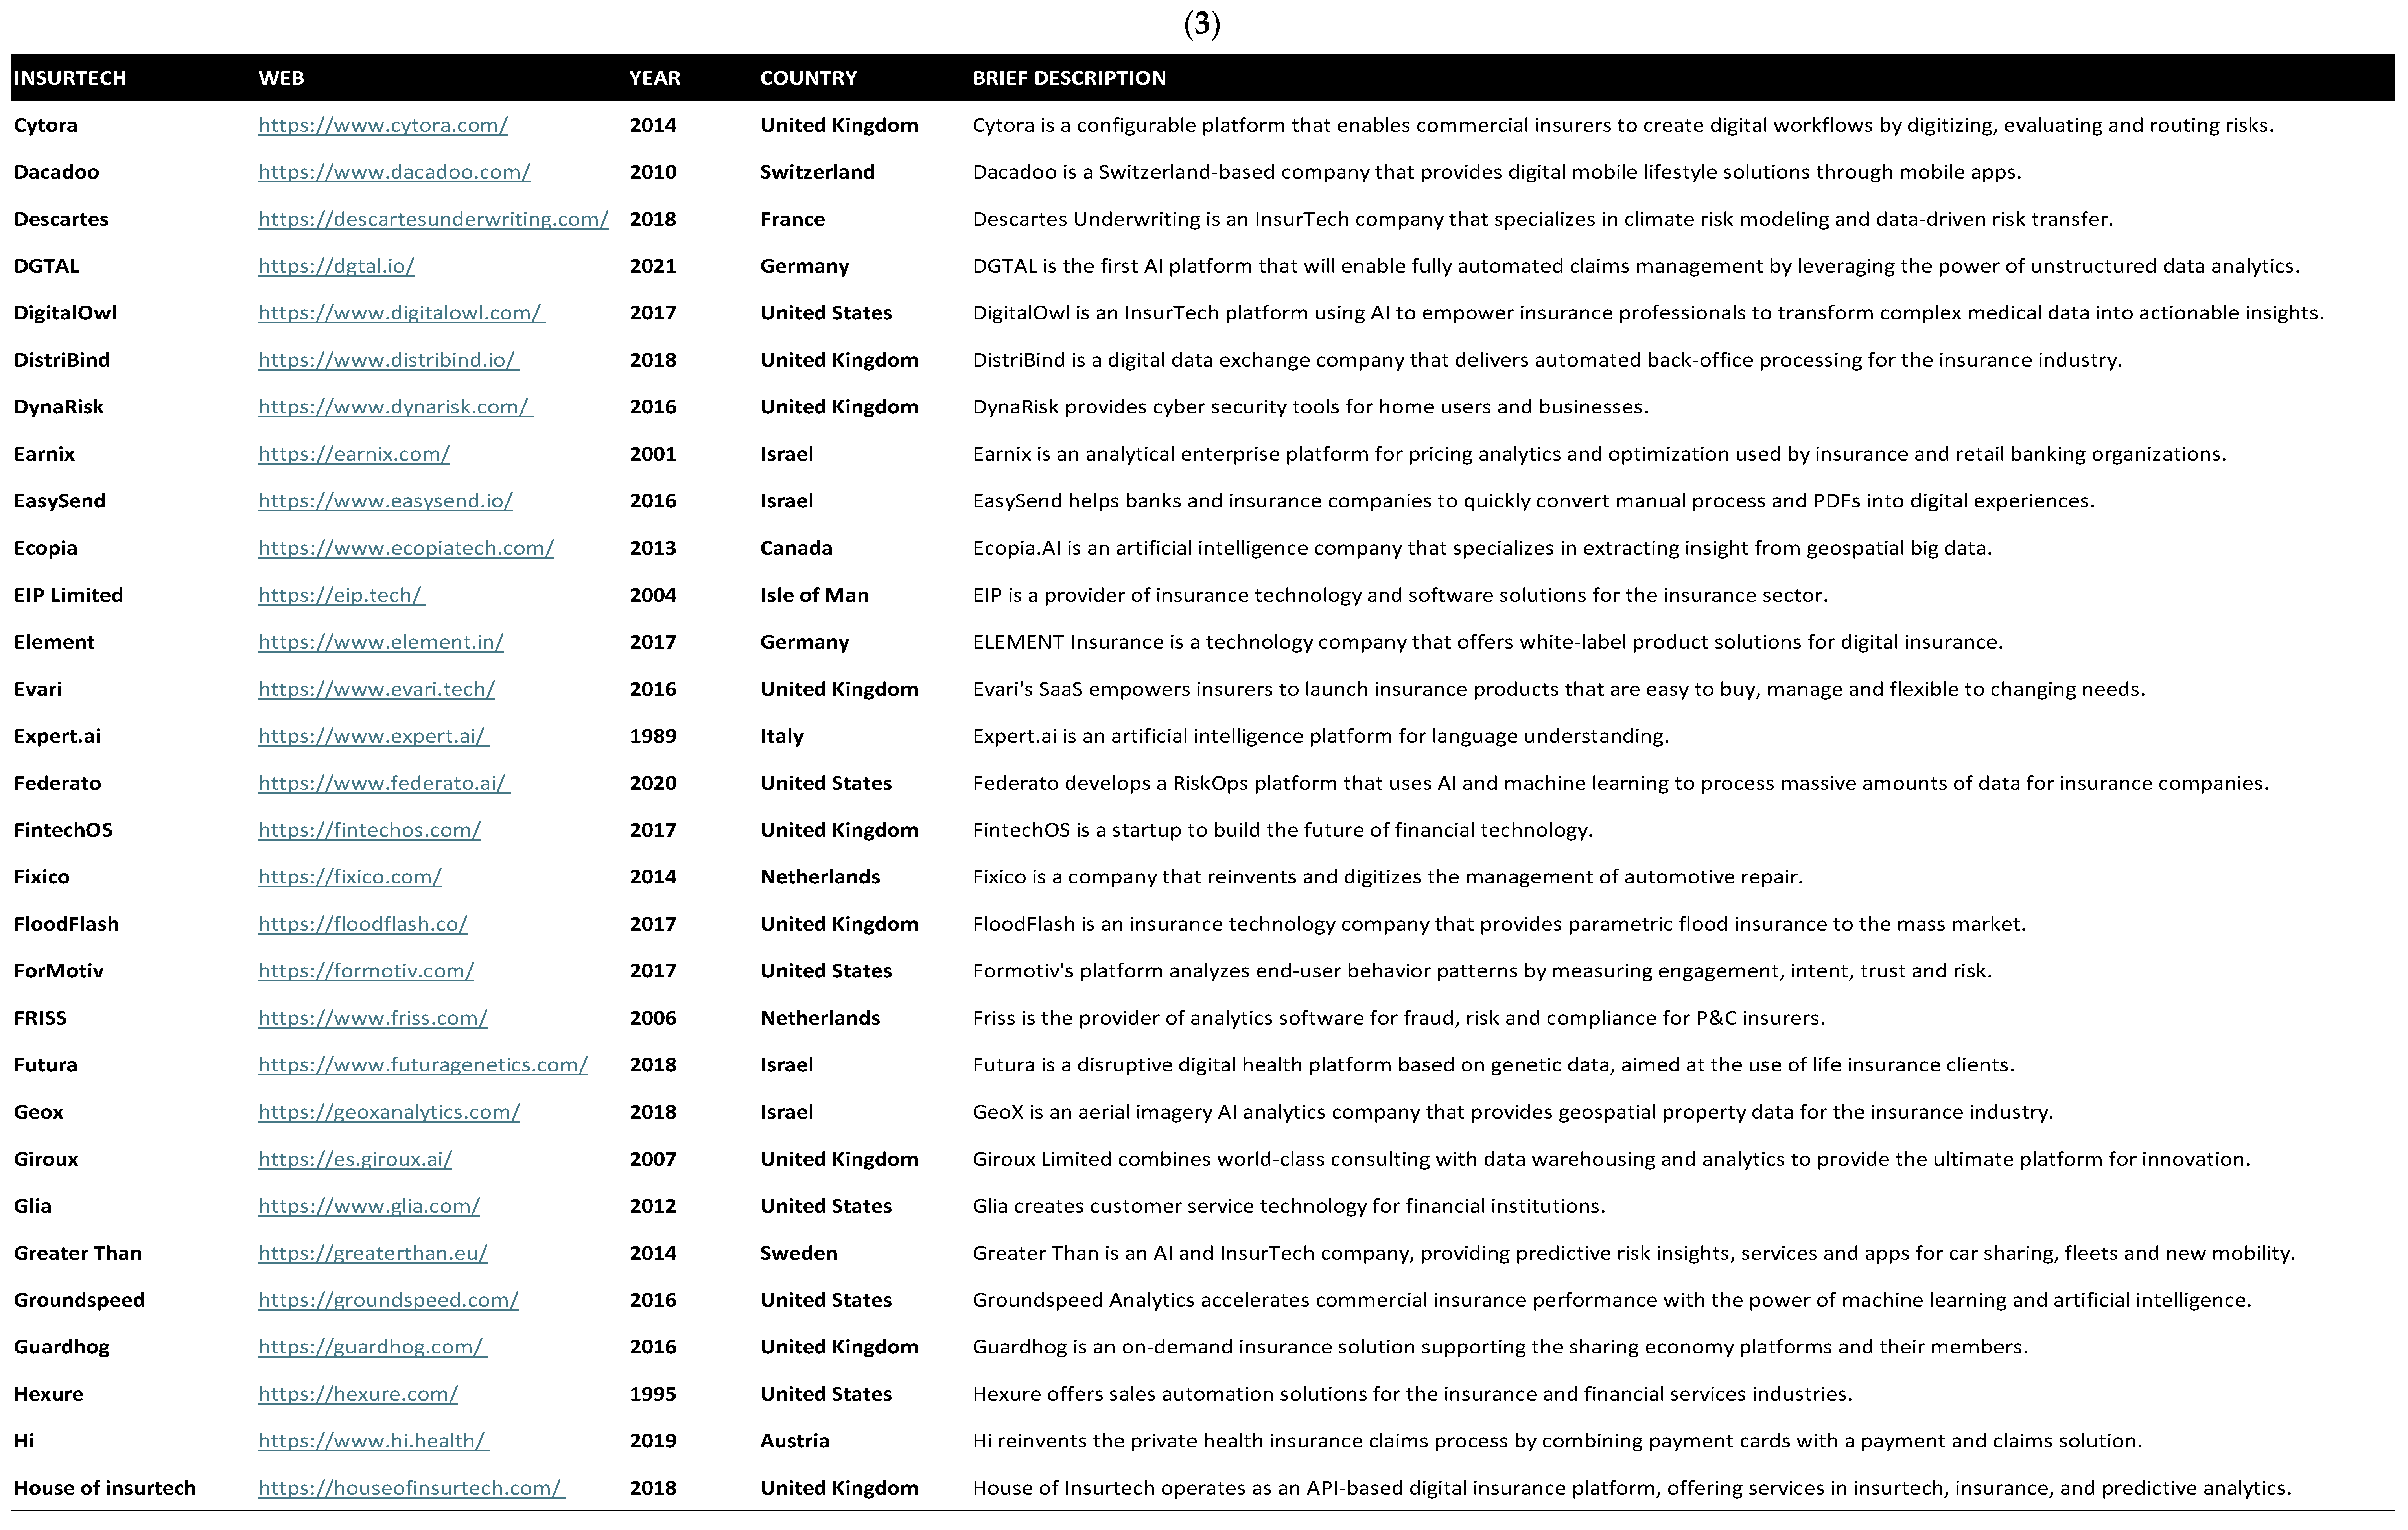
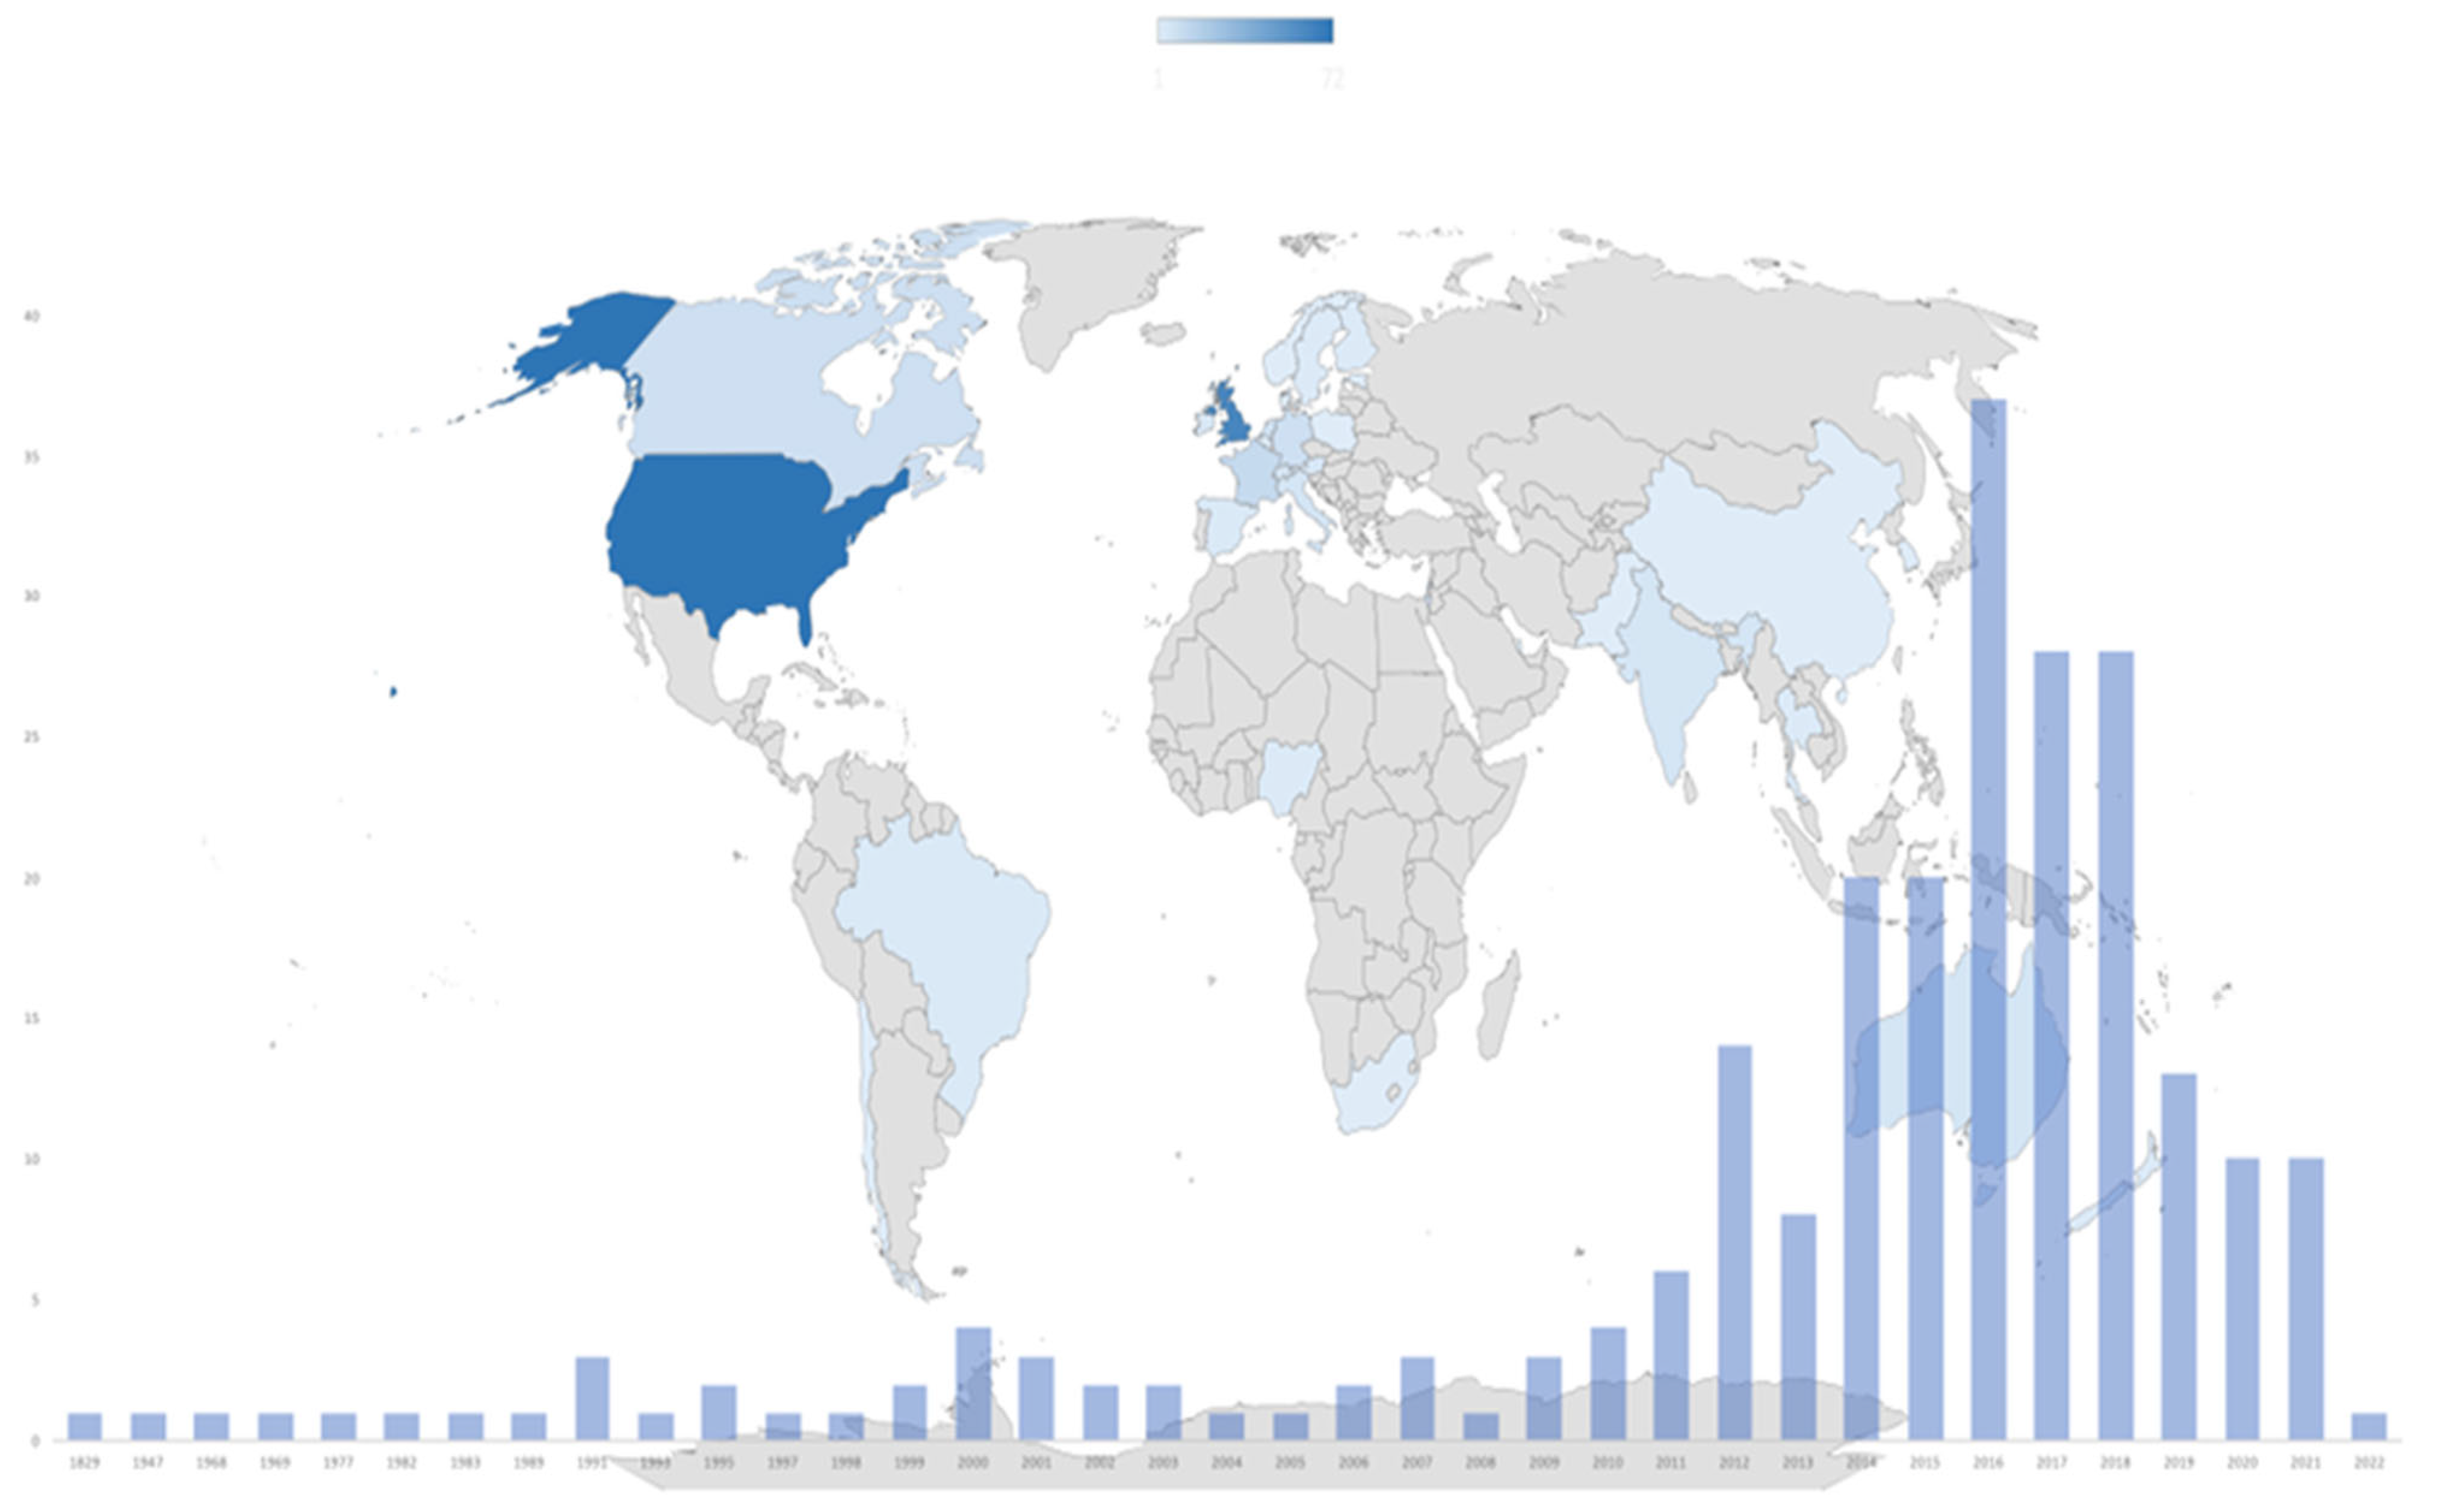
However, there remains a significant research gap in understanding how InsurTech contributes to the ecosystem perspective within the insurance industry. While existing taxonomies identify and categorize InsurTech archetypes, limited empirical research explores how these archetypes specifically create, deliver, and capture value within this interconnected framework. For this reason, the methodology employs a network analysis approach to map and understand the interactions among InsurTech archetypes within the ecosystem. Using a global dataset of 364 innovative InsurTech firms from 2020 to 2023, the research categorizes firms based on the InsurTech Ecosystem Business Model Canvas (IEBMC), identifying relationships and co-occurrences between archetypes. Through constructing adjacency matrices and applying centrality measures, the analysis evaluates the roles, influence, and interdependencies of archetypes. Additionally, network density and visualization techniques are used to assess the strength and evolution of these relationships over time, providing insights into the structural dynamics of the InsurTech ecosystem.
This research contributes a novel methodological approach to the InsurTech literature by quantifying the maturity of the ecosystem through network density measurements (0.54) and mapping the structural evolution through co-occurrence patterns between InsurTech archetypes. This empirical framework advances the theoretical understanding of how this ecosystem emerges, especially relevant for stakeholders seeking to position themselves advantageously within a rapidly evolving and increasingly interdependent insurance sector. This systematic method offers a robust perspective to understanding firms’ collaborative and strategic positioning within the ecosystem. As a result, this paper provides a detailed analysis to navigate the complex business dynamics of the insurance industry, allowing the exploration of InsurTech dynamics by mapping the evolving landscape of the ecosystem from 2020 to 2023, a landscape to which the interconnected nature of InsurTech contributes by creating network effects in which the value of the ecosystem increases as more participants interact.
Furthermore, the contributions led to an understanding of the InsurTech ecosystem by proposing a novel five-phase model that serves as a strategic roadmap for insurers, startups, and policymakers navigating the complexities of this landscape. The research identifies progression through distinct but interconnected phases: digitalization and technologies, customer-centric approach, data and analytics, platform-based business models, and ecosystem partnerships. These phases collectively describe how InsurTech dynamics enhance the capabilities of the insurance industry by driving innovation, operational efficiency, and customer engagement. By presenting this phased approach, this paper establishes a clear cause-and-effect rationale that connects the development of the InsurTech ecosystem to the broader evolution of the insurance industry, providing a structured perspective that can guide both academic research and industry practice.
Finally, it is important to recognize several limitations inherent to this research. First, the research reflects a snapshot of the InsurTech ecosystem between 2020 and 2023, marked by rapid technological evolution in the insurance sector. As the landscape continues to evolve, particularly through emerging innovations and changes in business models, some of the dynamics and configurations identified may become obsolete, making ongoing empirical research necessary to maintain their relevance. Secondly, the geographic scope of this study may limit generalization, as the sample focuses mainly on firms from specific regions. Given the variability of regulatory environments, levels of technology adoption, and market dynamics across jurisdictions, a broader analysis that includes multiple regulatory contexts would improve the understanding of InsurTech’s evolution globally. Thirdly, the research is based on a selected database derived from FinTech Global’s annual Top 100 InsurTech reports, representing 400 companies filtered down to 364 active companies. Although this dataset provides a high-quality sample, its selective nature may limit broader applicability. Future studies could extend the time horizon and size of the dataset to include a broader selection of InsurTech firms. Additionally, the uniformity restricts the identification of hierarchical positions within the network. To address this issue, the research prioritizes eigenvector centrality as the most meaningful metric for distinguishing influence and structural relevance between archetypes. For this reason, future research could address this limitation by developing firm-level relational networks grounded in concrete indicators such as strategic partnerships, investment flows, or collaborative linkages.


