Article

Gender Pension Gap in EU Countries: A Between-Group Inequality Approach

Department of Economics and Statistics, University of Salerno (I), Via Giovanni Paolo II, 132, 84084 Fisciano, Italy
*
Author to whom correspondence should be addressed.
Risks 2023, 11(3), 63; https://doi.org/10.3390/risks11030063
Submission received: 10 February 2023 / Revised: 13 March 2023 / Accepted: 15 March 2023 / Published: 20 March 2023
(This article belongs to the Special Issue Longevity Risk, Insurance and Pensions)

Abstract

:
Pension entitlements are influenced by individual career paths and labor market conditions, which often result in gender-based disparities. Women face several challenges during their working lives, such as late entry into the labor market, the gender pay gap, discontinuous working careers, and early retirement due to family caregiving, which lead to lower pension incomes. This paper investigates the gender pension gap in nine European Union countries from 2004 to 2020. Our study adopts a non-parametric estimation strategy that utilizes additively decomposable inequality measures to provide a more informative perspective on gender inequality. We aim to demonstrate that this approach surpasses the standard gender gap in pension index in capturing between-gender inequality in societies. Employing data from the SHARE database, we find that gender inequality in the studied countries is decreasing on average, with a convergence trend observed from 2011 onwards. This study contributes to a more comprehensive understanding of the gender pension gap phenomenon, which is crucial for developing effective policy responses in a welfare perspective.
JEL Classification:
H55; D63; J16

1. Introduction

Gender inequality is not only a pressing moral and social issue but it is also key for inclusive and sustainable economic growth (Bertay et al. 2020; Kochhar et al. 2017). This is clearly stated in the 2000 Millennium Declaration1 and it has been recently reasserted by the EU Commission, which has identified “the gender pay and pension gaps” as priorities to be addressed (Gender Equality Strategy 2020–2025).
The focus on the gender pension gap is mostly motivated by its peculiarities for economic analysis. Pension income disparities between genders are, indeed, the result of different kinds of penalization accrued by women during the entire working life; this includes late entry into the labor market and the gender pay gap as well as discontinuous working careers and early retirement, often due to family caring. Furthermore, the gender gap in pensions is immediately affected by the capacity of the pension scheme to promote solidarity across genders, and rich-to-poor redistribution in general (Abatemarco 2009; Belloni et al. 2020; Borella and Coda Moscarola 2006; Chlon-Domincza 2017; Coppola et al. 2022; Leombruni and Mosca 2012).
The purpose of the paper is to investigate the dynamics of the gender pension gap to identify recent tendencies and explore whether a convergence in gender gap levels across EU countries has occurred. This issue is even more important nowadays due to recent pension reforms aimed at preserving the sustainability of pension systems in the presence of risky demographic trends and increasing longevity risk. So far, the existing literature has estimated the disparity in pensions between genders with the Gender Gap in Pension index (hereafter GGP), which is defined as the distance between men’s and women’s average pension income in percentage points of men’s average pension (Abatemarco and Russolillo 2022; Bettio et al. 2013; Mavrikiou and Angelovska 2020; OECD 2021). While the GGP index is widely used and easily comprehensible, our paper demonstrates that additively decomposable inequality measures are preferable for more informative orderings and a deeper understanding of the gender gap dynamics. Through the decomposition of the inequality indices, one can gather additional evidence on within-gender and overall inequality in societies, which can be used to better comprehend the factors underlying fluctuations in the gender pension gap within a country. Intuitively, an increase in the gender pension gap may arise from a variety of factors, including pension reforms (Abatemarco and Russolillo 2022), increasing disparities in the labor market (e.g. skill-biased technological change), or gender-specific issues such as maternity leave or family care (Kleven and Landais 2017; Redmond and Mcguinness 2019). By adopting this approach, our study aims to contribute to a more complete comprehension of the gender pension gap phenomenon which is critical for developing effective policy responses in a welfare perspective.
Empirical data for this study is collected from the Survey of Health, Aging, and Retirement in Europe (SHARE) database2 which has not yet been used for this purpose by existing empirical literature on gender gap inequalities. The countries considered in this study are those that have participated in at least six out of the seven available survey waves,3 covering the period 2004–2020 (i.e., Austria, Belgium, the Czech Republic, Denmark, France, Germany, Italy, Spain, and Sweden).
Within the class of additively decomposable inequality measures (Shorrocks 1980), we consider the between-group inequality component of the mean log deviation index, which is known to satisfy path independence in the sense of Foster and Shneyerov (2000). By using this metric, we find that gender inequality in the nine EU countries is slightly decreasing on average but sensibly converging with a 40 percentage points reduction of the standard deviation from wave 1 (2004) to wave 8 (2020). We check for the robustness of our non-parametric estimation strategy by replicating the same analysis using the GGP index. Results indicate that the two methodologies generate similar, but not equivalent, orderings across each wave and for each country over time. Re-rankings and reversed dynamics between the two metrics are mostly driven by the anonymity axiom; the between-group inequality component of the mean log deviation index responds symmetrically to women’s and men’s variations of average pension income, whereas this is not the case of the GGP index that is defined up to percentage points of variations in men’s average pension income only.
For a more comprehensive understanding of gender-based inequalities in pensions, we also examine the gender pension gap in the absence of survivor pensions. This is relevant because survivor pensions represent an important policy instrument used to redistribute income from men to women. As women have historically had lower employment rates and have longer lifespans than men, they are the primary beneficiaries of such measures. Our finding supports this notion, as we observe that survivor pension schemes play a mitigating role in gender disparities in pensions, albeit to a diminishing extent in recent years.
All in all, the contributions of this paper are twofold. From an empirical perspective, we provide evidence on the convergence among nine EU countries in terms of gender pension gap, with particular emphasis on the impact of survivor pensions. From a methodological perspective, we show that, while the GGP index is a straightforward approach for political debate, a more informative estimation strategy is required for a deeper understanding of the dynamics of the gender pension gap, particularly for policy purposes.
The paper is organized as follows. Section 2 provides the institutional background of pension systems in the countries considered. In Section 3 the non-parametric estimation strategy is discussed. Data and results of our analysis are reported in Section 4. Section 5 concludes.

2. Institutional Background

To address the need for long-overdue reforms of pension systems in European Member states, the European Union established three common principles in 1999: financial sustainability, adequacy of pensions, and modernization (EC 1999). In addition, the European Council added a fourth principle in 2003, which was to promote gender equality in pension treatments (EC 2003). Despite the shared foundations, many alternative pension system designs continue to exist in Europe. In Table 1, we summarize their basic characteristics, with a particular emphasis on the insurance and redistributive building blocks.
The first-tier block includes basic, minimum, and social pensions, which are usually means-tested and independent of earnings in the working life (redistributive); a distinction is reported in Table 1 between residence- and contribution-based eligibility requirements. It is worth observing that first-tier pensions are absent in Germany only, where a new supplemental pension has been recently introduced to provide higher benefits to low earners with long careers. In Table 1, we also report the average benefit value in 2020 of first-tier pensions as a percentage of gross average wage earnings (AW). Belgium is the country showing the strongest support through first-tier pensions, whereas the Czech Republic seems to provide the minimum redistributive effort among these countries. The second-tier block refers to the insurance component of pension systems. The usual distinction between defined benefit (DB) and defined contribution (DC) formulas is emphasized, with a distinction between notional (NDC) and funded (FDC) schemes. Sweden, and especially Denmark, have the two pension systems with private insurance programs, whereas points (Pts) earned in the working career are used to obtain regular pension payments in France and Germany only.
The gender pension gap has been widely acknowledged (Betti et al. 2015; EC 2015; OECD 2012), with several studies identifying its main determinants (Bonnet et al. 2002; Jefferson 2009; Levine et al. 1999 among others). One important public measure that contributes to reducing these disparities are survivor pensions. Indeed, this type of pensions are mainly received by women: statistics show 85% of recipients being women in the OECD25, with Denmark showing the lowest share of women (67%) and Sweden the highest (99%) (OECD 2018). Eligibility criteria for survivor pension and benefit calculation vary across countries (see Table 2). For example, in Sweden, there are no mandatory survivor pension programs for widowers, in Denmark only temporary payments are provided, and in the Czech Republic and Germany the age requirement is derogated if the survivor has a dependent child. Furthermore, there are differences in the determination of benefits, as seen in Belgium where the assumption is that the deceased would have continued her career path until retirement.
To assess the impact of the differences in survivor pensions plans, we compute the gender gap again including all pensions except for survivor pensions. This allows us to examine the effectiveness of these measures in reducing gender inequalities over the studied period.

3. Methodology

Let Y = { y 1 , y N } + N be the vector of individual pension incomes within a population. Given the gender-based partition of the population, let Y f = { y 1 f , y N f f } + N f and Y m = { y 1 m , y N m m } + N m be, respectively, the pension income distribution of women and men. We indicate by μ f and μ m the average pension income of women and men, respectively, whereas the average pension income of the entire population is μ .
Given an inequality index I ( · ) : + N , additive decomposability of I ( · ) is satisfied if overall inequality can be equivalently defined as the sum of withing-group and between-group inequality components. Several inequality decomposition procedures have been proposed in the existing literature4, even if generalized entropy (GE) measures represent the class of inequality metrics that more intuitively than others satisfy this property (Maasoumi 2019).
Let y i be the pension income of the ith retiree, the class of G E inequality measures is defined as
G E α = 1 N α ( α 1 ) i = 1 N y i μ α 1 α 0 , 1 N i = 1 N y i μ ln y i μ α = 1 , 1 N i = 1 N ln y i μ α = 0
The parameter α regulates the weight given to distances between pension incomes at different parts of the income distribution; the greater is α the more the index is sensitive to pension incomes at the top of the distribution (e.g., GE increases more when a higher income increases). Vice versa, the lower is α the more the index is sensitive to pension incomes at the bottom of the distribution.
Let y i j be the pension income of the i-th retiree with gender j = ( f , m ) , each of the G E indexes in (1) is additively decomposable, so that it can be rewritten in terms of within-group ( G E α W ) and between-group ( G E α B ) inequality components as follows (Shorrocks 1980),
G E α = G E α W + G E α B = = j N j μ j N μ μ j μ α G E α j + 1 α ( α + 1 ) j N j μ j N μ μ j μ α 1
with j = ( f , m ) and G E α j indicating inequality in group j (j-th within-group inequality component).
Intuitively, this decomposition allows us to obtain the following information: (i) metrics of within-gender inequality for both women and men, G E α f and G E α m respectively, (ii) a measure of the contribution of within-gender inequality to overall inequality in the income distribution, G E α W , and (iii) an index of between-gender inequality, G E α B , by which the gender gap in pension is identified.
The between-gender inequality component, G E α B , is known to satisfy very important properties for the measurement of the gender pension gap. More specifically, (i) it is scale invariant, in that the gender gap is not affected by scalar transformations of the income vector, and (ii) it is population invariant, since any k-fold replication of the population is not altering the index. (iii) It is decreasing with rich-to-poor group-transfers (average-based Pigou–Dalton principle of transfer), meaning that any (non re-ranking) income transfer from an individual within the richer group to an individual within the poorer group is between-group inequality reducing. In addition, (iv) it can be shown that the between-group inequality component satisfies monotonicity, since it is monotonically increasing with μ m if, and only if, μ m > μ f , and vice versa. Last but not least, (v) G E α B satisfies the anonymity property since it is independent of the identity of the group; i.e., the index does not change if the gender identities of the two groups are switched.
In addition to major properties, two aspects are worth emphasizing for our purposes. First, the gender gap—as identified by the between-gender inequality component—is obtained by aggregating gender-specific average income gaps with respect to the average pension income in the entire population (i.e., ( μ j / μ ) ). Second, the between-gender inequality component is defined as a an aggregation of the gender-specific average income gaps weighted by income shares held by each group (i.e., ( N j μ j ) / ( N μ ) ).
Several well known inequality metrics can be obtained from the class of GE measures for different values of α : e.g., G E 0 is known to be the mean log deviation index; G E 1 corresponds to the Theil index; G E 2 is half the square of the coefficient of variation.
In what follows, we will consider the mean log deviation index (i.e., α = 0 ), whose between-gender inequality component is
G E 0 B = j N j N ln μ j μ
with j = ( f , m ) .5 This index is usually preferred since it is obtained from a decomposition procedure satisfying “path independence” as characterized by Foster and Shneyerov (2000). Basically, provided that the group decomposition in (2) is obtained by eliminating first within-group inequality (replacing individual incomes with average ones), and provided that the decomposition path may be reversed by eliminating first between-group inequality (rescaling incomes until equal subgroup average incomes are obtained), we use the only entropy index generating the same results independently from the path one has opted for.
In the existing literature, it is usually the case that the Gender Gap in Pension (GGP) index is used for the same purposes (Bettio et al. 2013; Dessimirova and Bustamante 2019). This index is defined as the average pension income gap between men and women, divided by mens’ average pension income,
G G P = μ m μ f μ m
with μ m μ f . As compared to the GGP index, the between-gender inequality measure in (3) presents two major advantages.
From a methodological perspective, the between-gender inequality component, G E α B α , and the GGP index differ each other for the benchmark used to obtain a relative measure of the gender gap. While the GGP index identifies the gap in terms of percentage points of mens’ average pension income ( μ m ), the between-gender inequality component takes the relative gap with respect to the overall average income in the society ( μ ). This is not irrelevant, since the same variation of the absolute income gap may generate very different variations of the GGP index depending on what average income is changing more, whereas this is not going to happen for G E α B α .6 Formally, the GGP index does not satisfy the anonymity axiom, since it is not independent of the identity assigned to each group.
From a policy perspective, since the GE inequality decomposition—not the GGP index—also provides information on within-gender and overall inequality, the gender pension gap can be better understood with respect to its origins. First, the same amount of gender gap may be more or less worrying depending on the size of the within-gender inequality component ( G E α W ); e.g., the same level of between-gender inequality is clearly more gender-specific, and thus more problematic for gender policies, if a low level of within-gender inequality is observed. Similarly, an increasing pattern of between-gender inequality may be less discriminatory if a similar increase is observed in the within-gender inequality component as well. Second, by considering the share of between-gender inequalities with respect to overall inequality (i.e., the ratio between G E α B and G E α ), one can emphasize the contribution of between-gender inequality in the society and, in the case of multi-period analyses, its dynamics over time. This is a valuable information for policy-makers in that it provides signals on the relevance of gender among all of the other factors driving inequality patterns.

4. Analysis

4.1. Data

Our analysis employs the Survey of Health, Aging, and Retirement in Europe (SHARE, Release 8.0), which has been collecting biennial data on a range of socio-economic and health-related themes since 2004 from representative samples of individuals aged 50 and above in numerous EU and non-EU nations (Bergmann et al. 2019; Börsch-Supan 2013). Our attention is primarily focused on regular waves 1, 2, 4, 5, 6, 7, and 8 which provide information on individual current work status and retirement circumstances, spanning the time period from 2004 to 2020. Notably, wave 3, which is comprised of a different questionnaire (SHARELIFE), lacks questions on most of our variables of interest, such as the amount of pension income received by the respondent.
While the total number of countries participating in the SHARE survey has grown from 12 to 29 over time, we restrict our analysis to the nine EU nations that have taken part in at least 6 of the 7 accessible waves to ensure an adequate frequency for our dynamic analysis (i.e., Austria, Belgium, Czech Republic, Denmark, France, Germany, Italy, Spain, and Sweden).
In regular waves, participants are queried about their current work status and the average amount of their net7 pension payments. Our sample solely includes retired individuals and incorporates the sum of public pensions, private occupational pensions, and public/private survivor pensions received each month, while it excludes disability, invalidity, incapacity, and war pensions. Essentially, pension incomes examined in our analysis have been selected to highlight old-age maintenance as primary objective of pension schemes, disregarding non-ordinary needs and benefits. Nonetheless, with regards to social and survivor pensions, our definition incorporates both the insurance nature (second-tier) and the social assistance component (first-tier) of pension systems.8 As such, our analysis evaluates the gender gap remaining after the implementation of redistribution and insurance policies.
To deal with implausible total pension values, we remove for each country, and each wave, observations falling outside the first and the last percentiles (Jarvis and Jenkins 1998). The total number of observations remaining after this process is 98,403. Table 3 presents summary statistics for the mean pension incomes by country and gender, based on the full sample. Statistics indicate that, as one may expect, female pension recipients receive lower average payments than their male counterparts across all countries analyzed. Additionally, we observe that the Czech Republic is characterized by the lowest average pension income, which is instead maximum in Belgium.
Table 3 also displays maximum and minimum pension income values by country. Due to country-specific regulation of the pension systems, maximum values of pension income are found sensibly higher in Austria, Belgium, and France; on the other side, minimum values are extremely low in all countries due to means-tested redistribution in the computation of pension income. For a better interpretation of the results of our analysis in the next section, it is interesting observing that (i) the country with the highest absolute gap in average payments between men and women is Germany, whereas (ii) the absolute gap in Czech Republic and Denmark appears to be significantly smaller than in other countries.
Table A1 in Appendix A displays the number of survey respondents by country, gender, and wave. Notably, the number of observations is lower for all countries in wave 7 due to the implementation of the SHARELIFE questionnaire in the same wave. In addition, Table A1 presents the average pension incomes by gender, wave, and country. These figures reveal that countries with lower initial values (namely, the Czech Republic, Italy, and Spain) are the only ones showing an increasing pattern across waves.
Table A2 in Appendix A presents the average age of the sample by country, wave, and gender. In all instances, the average age has increased over the time period under consideration, which can be attributed to both the rise in retirement age and the longer average life expectancy. Furthermore, we note that there is increased uniformity in average age across countries in the last wave compared to the first one.
Finally, Table 4 shows the statistical differences in average pension incomes between men and women when survivor pensions are not included in the computation of total pension incomes. A comparison of Table 4 with Table 3 indicates that men’s pension benefits remain almost the same, while women’s pensions decrease in all cases. Specifically, we observe a reduction in women’s average payment of 11% and 9% in Germany and France respectively. Sweden is the only country where we observe a uniform decrease (2%) independently of the gender.

4.2. Results and Discussion

In this section, we initially provide an analysis of the empirical findings concerning the gender gap in pension, obtained using the between-group component of the mean log deviation index, i.e., G E 0 B in (3). Subsequently, we check our methodological contribution by comparing the output of G E 0 B with that of the conventional GGP index in (4). In order to achieve this, we consider both (i) inter-country orderings in each wave and (ii) the temporal evolution of gender gap indicators in each country. Finally, we examine the effect on the gender gap index when survivor pensions are excluded to ascertain the influence of this policy in redistributing income from men to women.
Figure 1 displays the gender gap computed through the between-gender inequality index, G E 0 B , across seven waves from 2004 to 2020 in the nine European countries selected.9 Three main key results should be noted.10
Firstly, there exists substatial heterogeneity in the between-gender inequality levels, ranging from 0.0001 in Denmark to 0.045 in Germany, until wave 5. However, we observe a trend towards convergence in gender gap levels in the last eight years. Overall, we find a 40 percentage-point decrease in the standard deviation from wave 1 to wave 8, which is consistent with prior empirical research on both the wage gap (e.g., Kleven and Landais 2017; Redmond and Mcguinness 2019) and gender inequality in general (e.g., Eurofound and EIGE 2021).
Secondly, the data demonstrate a gradual and general decrease in between-group inequality levels over the examined period. The average inequality in pensions between men and women in the chosen European countries has halved between 2004 and 2019. This trend is expected, due to the increasing participation of women in the labor market in most European countries starting from the seventies (Barth et al. 2021; Leythienne and Pérez-Julián 2021).
Thirdly, the analysis indicates that Denmark and the Czech Republic exhibit the lowest levels of between-group inequality, while Germany displays the highest level of between-group inequality in nearly all of the observed periods. These findings align with previous research based on EU-SILC and EU-LFS databases (Mavrikiou and Angelovska 2020; Veremchuk 2020). Notably, the relatively higher gender gap observed in Germany is primarily attributed to the widespread trend for women shifting from full-time to part-time job positions after maternity (Flory 2012; Niessen-Ruenzi and Schneider 2022).
To examine the robustness of our results and to demonstrate the methodological contribution of our estimation strategy, we replicate our analysis using the GGP index in (4) and present the results in Figure 2. While we do not find a significant differences in the overall picture, a comparison of results for G E 0 B and G G P in Table A3 in Appendix B reveals (i) multiple re-rankings across countries in each of the waves from 4 to 8 (e.g., Austria vs. Belgium in wave 4) and (ii) instances of reversed dynamics for some countries across consecutive waves from wave 5 onwards (e.g., Spain from wave 5 to 6, Germany from wave 7 to 8). These findings highlight that the assessment of the gender gap in pension is significantly influenced by the choice of the benchmark variable used to construct a scale invariant measure (overall or men’s average pension income). Notably, countries exhibiting more re-rankings and reversed dynamics are the Czech Republic, Italy, and Spain, which are characterized by a substantial increase in average pension incomes during the observed time period.
Given that the inequality decomposition approach provides additional insights into overall and within-gender inequalities, we also computed the relative impact of gender inequalities with respect to overall inequalities in each wave and country (i.e., G E 0 B / G E 0 ). By comparing the absolute and the relative between-gender inequality components, one may obtain additional information that is highly relevant for policy purposes. For instance, a comparison of the values in Table A3 and Table A4 highlights that gender inequalities are relatively more significant in some countries (e.g., Austria, Germany, Italy) than in others. Furthermore, the recent trends in the relative between-gender inequality are particularly concerning in Austria, which is the only country with an increasing pattern from wave 1 to wave 8.
Finally, Figure 3 presents the gender gap in pensions when we do not account for the redistributive effects resulting from the availability of a survivor pension scheme.
Since women constitute the main recipients of survivor pensions due to both their higher share of non-working periods and their longer life expectancy, we expect this state measure to significantly impact the distribution of pension incomes across genders. The results of our analysis are consistent with our expectations, revealing a general average increase in between inequality in the selected countries. Specifically, the survivor pension appears to have the most pronounced effect in reducing gender disparities in Germany and Belgium. Conversely, we observe that the gender gap in pension is not significantly impacted by the measure in Denmark and Sweden. These findings reflect the varying design of survivor pension schemes across different countries as outlined in Table 2, where it is shown that Belgium provides the highest share of the deceased’s income to widows, while Denmark and Sweden do not offer a survivor pension scheme at all. It should also be noted that the effectiveness of this type of redistributing policy is decreasing over time and this reflects the increasing participation of women in the labor market and the lower stability of family formations.

5. Concluding Remarks

The examination of the trend of the gender pension gap in nine EU nations over time indicates both (i) a tendency towards converge within the EU and (ii) an overall decreasing pattern. The results reveal also two specific cases: Germany, which exhibits a significantly higher gender pension gap, and Austria, where an increase in gender-specific inequalities is observed from wave 1 to wave 8. Additionally, our findings provide support for the effectiveness of policy instruments such as the survivor pension in mitigating gender pension gap, albeit with a decreasing pattern observed in more recent periods.
From a methodological standpoint, our study demonstrates that information derived from implementing the GGP index may necessitate supplementary analysis concerning inequality decomposition. By breaking down the mean log deviation index into between- and within-gender inequality components, we establish that additional insights can be obtained on the factors influencing the gender pension gap dynamics. Moreover, our proposed non-parametric estimation approach can be regarded as more robust methodologically, given that it satisfies the anonymity property, which ensures equitable treatment of variations in average pension incomes for women and men.
While our results are broadly supported by the GGP index, it is important to note that a more granular analysis by cohort and year of retirement may provide better insights. Due to numerous pension reforms implemented in the EU over the past few decades, the eligibility rules and benefit formulas have varied widely across the population considered in our analysis for each wave and country. Unfortunately, the dataset does not include the requisite variables, and the number of observations in all countries is insufficient for this type of analysis. Similarly, our conclusions on EU convergence are limited to only nine countries, and a more comprehensive analysis of EU convergence would necessitate more countries. We anticipate future research endeavors aimed at addressing these limitations.

Author Contributions

All authors contributed equally to this work. All authors have read and agreed to the published version of the manuscript.

Funding

This research received no external funding.

Institutional Review Board Statement

Not applicable.

Informed Consent Statement

Not applicable.

Data Availability Statement

Publicly available datasets were analyzed in this study. This data can be found here: www.share-project.org (accessed on 2 January 2023).

Conflicts of Interest

The authors declare no conflict of interest.

Appendix A

Table A1. Summary statistics by country, wave, and gender.
CountryG.Stat.W1W2W4W5W6W7W8
AustriaM.Obs.66630910971072899145465
  Mean2588135818401652163917101850
 F.Obs.826360135112981121207640
  Mean185694112231199114712051353
BelgiumM.Obs.1326741114312901360553613
  Mean3158215138492717316425842993
 F.Obs.94654688210581173518595
  Mean2036170425602080250818882727
Czech R.M.Obs. 482111112591161263763
  Mean 312422418433460524
 F.Obs. 8211761198218524131179
  Mean 281370365381407461
DenmarkM.Obs.566478399784735334526
  Mean1510121313901482128913541424
 F.Obs.682571499935857433597
  Mean1235106612821341120213291377
FranceM.Obs.112659512371121985383718
  Mean1934173817181808185021081924
 F.Obs.1102587134513001130433860
  Mean1464108811861275133714661460
GermanyM.Obs.112053744711941101300866
  Mean1465149416091576155715871732
 F.Obs.10305043781111989308868
  Mean83583583188191110501146
ItalyM.Obs.119083594411321257500459
  Mean1057109011801186120611821227
 F.Obs.884539669831907391332
  Mean6867088208629179141000
SpainM.Obs.78849381313391225355567
  Mean7568319249619939861113
 F.Obs.272174316745645185400
  Mean637578687760789786846
SwedenM.Obs.1236565503952960287676
  Mean1668127215611936159116161666
 F.Obs.136658154110171067389758
  Mean113891612571610123413041341
Table A2. Sample mean of the age by country, wave, and gender.
CountryGenderW1W2W4W5W6W7W8
AustriaMen68.471.770.871.574.175.575.5
 Women69.171.369.570.574.873.973.9
BelgiumMen70.372.571.571.873.673.873.8
 Women70.672.671.971.973.573.773.7
Czech R.Men-72.471.271.573.974.674.6
 Women-70.170.070.572.873.773.7
DenmarkMen72.373.773.273.274.575.375.3
 Women72.974.773.672.974.274.974.9
FranceMen70.272.270.871.572.573.373.3
 Women71.473.171.672.373.074.274.2
GermanyMen70.372.372.872.874.175.575.5
 Women71.773.172.872.773.174.474.4
ItalyMen68.471.271.872.475.976.276.2
 Women68.770.770.672.074.575.975.9
SpainMen72.774.874.474.876.676.976.9
 Women74.475.274.575.275.676.176.1
SwedenMen72.876.074.874.276.076.676.6
 Women71.774.874.073.675.676.476.4

Appendix B

Table A3. Inequality decomposition of the mean log deviation index and GGP by country and wave.
CountryIndexW1W2W4W5W6W7W8
Austria G E 0 B 0.0140.0170.0210.0130.0170.0130.013
  G E 0 W 0.4550.0730.2050.1320.1000.0850.092
  G E 0 0.4690.0900.2260.1450.1160.0990.105
  G G P 0.2830.3070.3360.2750.3000.2950.269
Belgium G E 0 B 0.0250.0070.0240.0090.0080.0140.000
  G E 0 W 0.6310.4600.6620.4840.5260.3490.418
  G E 0 0.6570.4670.6850.4930.5350.3630.418
  G G P 0.3550.2080.3350.2350.2080.2690.089
Czech R. G E 0 B  0.0010.0020.0020.0020.0030.003
  G E 0 W  0.0550.1290.1610.0530.0490.073
  G E 0  0.0560.1310.1640.0550.0530.076
  G G P  0.0980.1220.1280.1200.1160.122
Denmark G E 0 B 0.0050.0020.0010.0010.0000.0000.000
  G E 0 W 0.1190.0990.0850.0980.0890.0810.075
  G E 0 0.1240.1000.0860.0990.0900.0810.075
  G G P 0.1820.1210.0770.0950.0670.0190.033
France G E 0 B 0.0090.0280.0170.0150.0130.0160.009
  G E 0 W 0.3660.1970.1650.1690.1470.1680.128
  G E 0 0.3750.2250.1820.1840.1610.1840.136
  G G P 0.2430.3740.3100.2950.2770.3050.241
Germany G E 0 B 0.0280.0330.0440.0290.0270.0150.016
  G E 0 W 0.1390.1460.1630.2060.1730.1520.146
  G E 0 0.1670.1790.2070.2340.2000.1660.162
  G G P 0.4300.4410.4840.4410.4150.3380.338
Italy G E 0 B 0.0210.0230.0170.0110.0080.0070.006
  G E 0 W 0.1320.1000.1100.0930.0770.0830.088
  G E 0 0.1530.1230.1270.1040.0850.0900.095
  G G P 0.3510.3510.3050.2730.2400.2270.185
Spain G E 0 B 0.0030.0150.0080.0040.0050.0060.005
  G E 0 W 0.2080.1540.1010.0920.0870.0880.098
  G E 0 0.2110.1690.1090.0960.0910.0940.103
  G G P 0.1580.3040.2570.2100.2050.2030.240
Sweden G E 0 B 0.0150.0110.0050.0030.0070.0040.005
  G E 0 W 0.1200.0740.1370.1790.1030.0790.121
  G E 0 0.1360.0850.1420.1820.1090.0830.126
  G G P 0.3170.2800.1950.1680.2250.1930.195
Table A4. Relative between-gender inequality ( G E 0 B / G E 0 ) by country and wave.
CountryW1W2W4W5W6W7W8Avg.
Austria0.030.180.090.090.140.140.120.10
Belgium0.040.010.030.020.020.040.000.02
Czech R. 0.020.010.010.040.060.030.03
Denmark0.040.020.010.010.000.000.000.01
France0.020.130.090.080.080.090.060.08
Germany0.170.190.210.120.140.090.100.14
Italy0.140.190.130.110.100.070.070.12
Spain0.020.090.070.050.050.070.050.05
Sweden0.110.130.030.020.060.050.040.07
Avg.0.080.100.070.060.070.060.050.07

Notes

1
The 2000 Millennium Declaration commits States to promote gender equality and the empowerment of women as effective ways to combat poverty, hunger, disease and to stimulate development.
2
This paper uses data from SHARE Waves 1, 2, 4, 5, 6, 7, and 8 (DOIs: 10.6103/SHARE.w1.800, 10.6103/SHARE.w2.800, 10.6103/SHARE.w4.800, 10.6103/SHARE.w5.800, 10.6103/SHARE.w6.800, 10.6103/SHARE.w7.800, 10.6103/SHARE.w8.800) see Börsch-Supan (2013) for methodological details. (1) The SHARE data collection has been funded by the European Commission, DG RTD, and Horizon 2020 and by DG Employment, Social Affairs and Inclusion. Additional funding from the German Ministry of Education and Research, the Max Planck Society for the Advancement of Science, the U.S. National Institute on Aging, and from various national funding sources is gratefully acknowledged (see www.share-project.org (accessed on 2 January 2023)).
3
Even though the SHARE database consists of eight waves, the third wave does not provide information on pension incomes and, for this reason, it is not included in our analysis.
4
For a review see Abatemarco (2010) among all.
5
The GE index at α = 0 is obtained from the general formula in (1) by using l’Hopital’s rule (Lambert 2001). The corresponding between-group inequality component is identified by introducing group partitions and then by separating the individual income gaps from average income gaps.
6
E.g., suppose we compare the dynamics of the GGP in two countries in two periods. In the first period, both countries are characterized by the same pension income distribution, with equally sized gender-based partitions of the population. In the second period, the absolute income gap doubles in both populations, however the sole average pension income of men increases in one country, whereas the sole average pension of income of women decreases in the other country. This would clearly generate two very different variations of the GGP index, which may significantly affect the ordering of different pension distributions in terms of gender gap.
7
In the first wave, data on average pension payments are gross values.
8
For major details on the interaction between insurance and social assistance targets in public pension plans, see Diamond (2004).
9
Pension incomes in SHARE are reported at the net value of personal income taxes from wave 2 on, not in wave 1. Hence, as far as men are, on average, richer than women, the gender gap in pension might be under-estimated in countries where the progressive personal income tax applies to pension benefits.
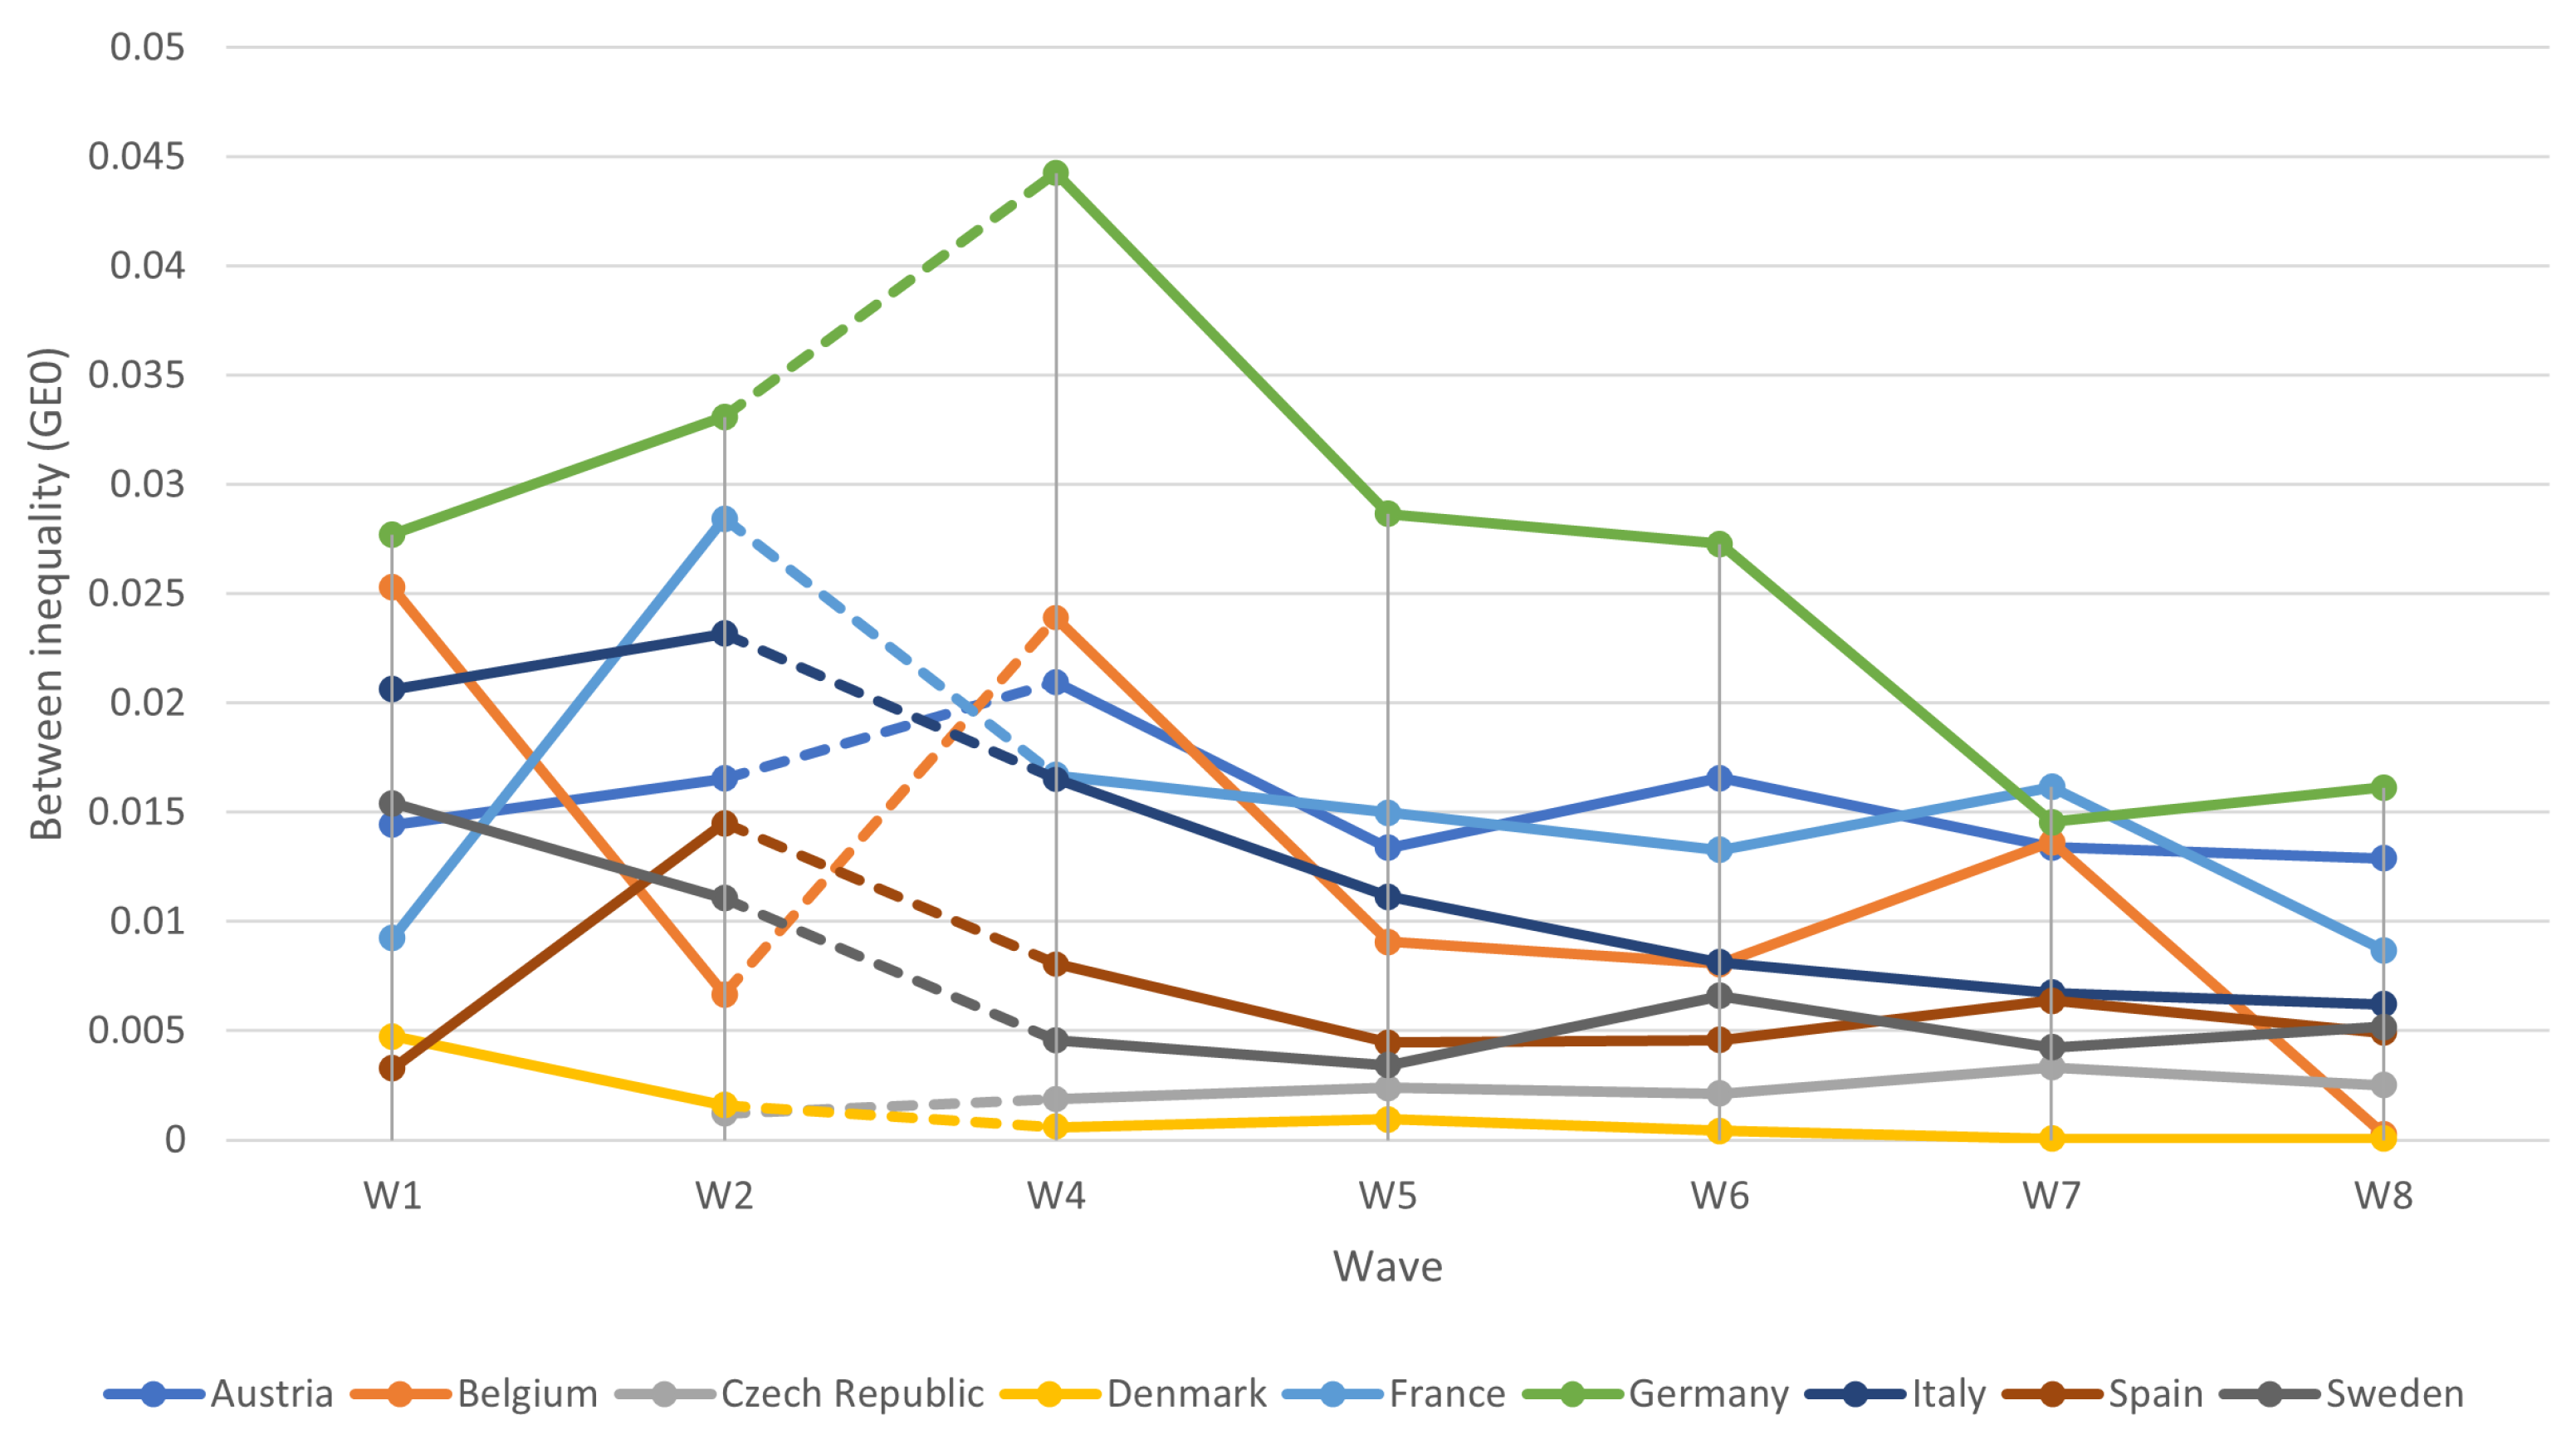
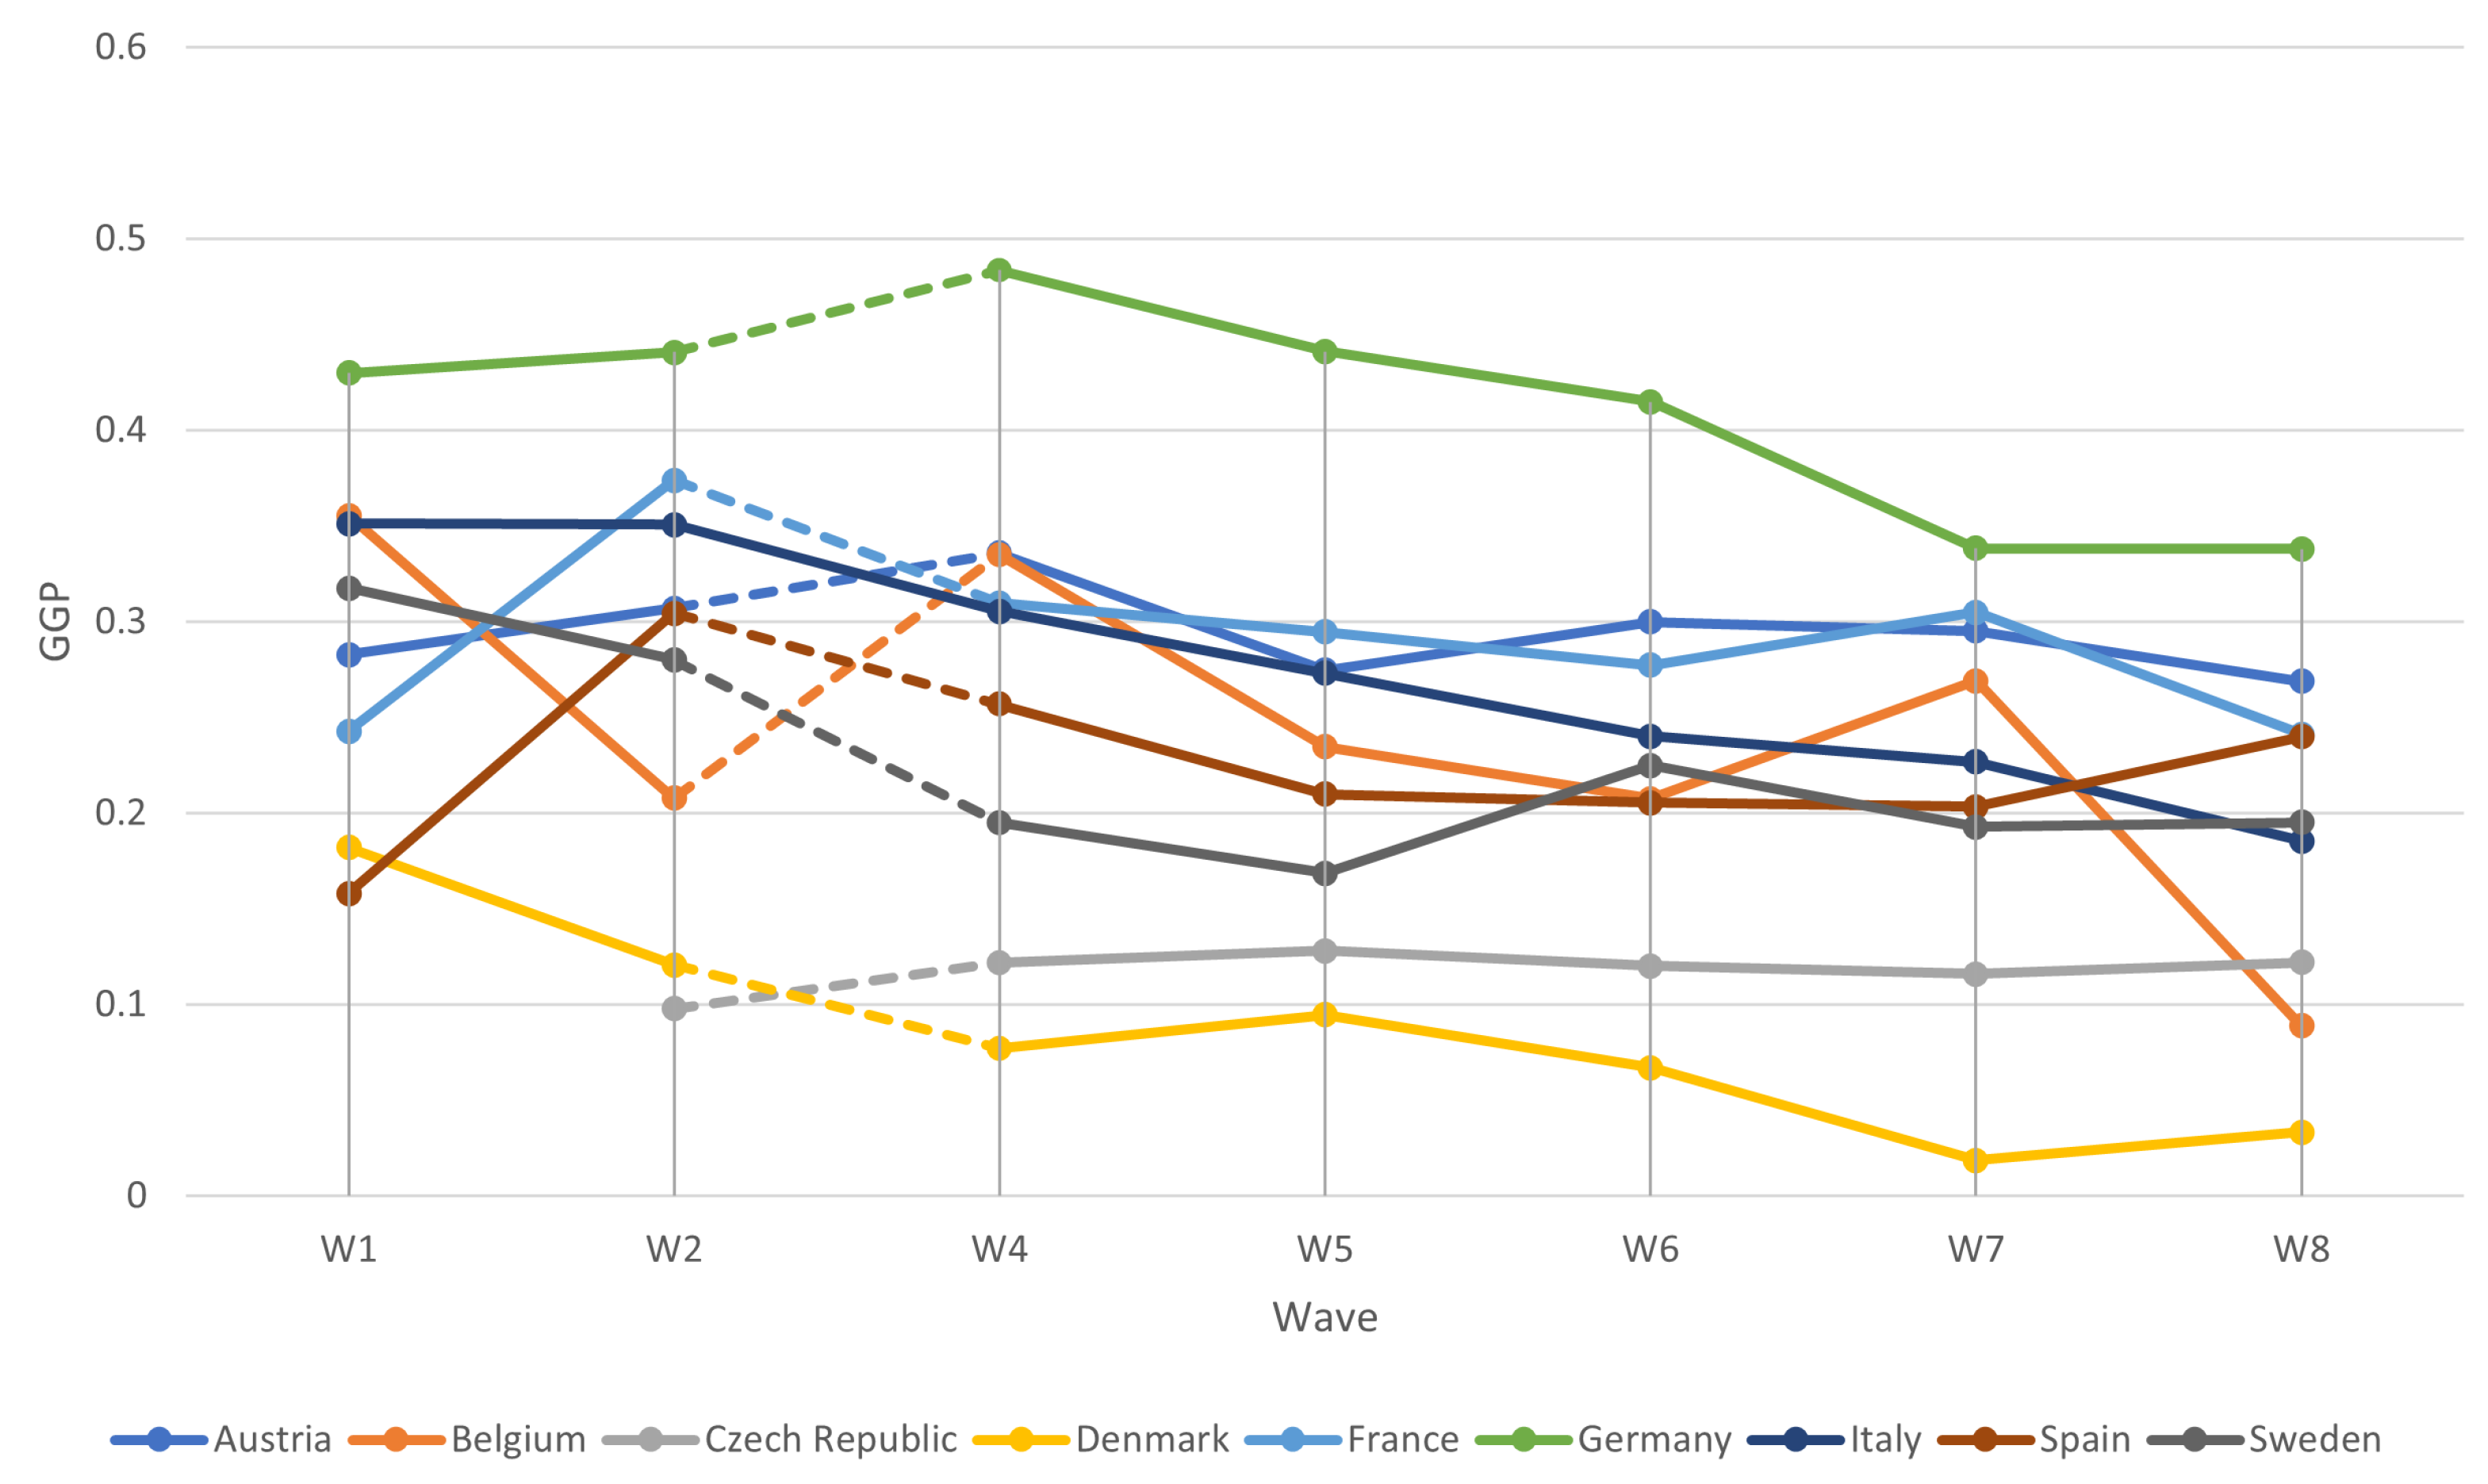
10
The dotted line connecting W2 and W4, in this and the following figures, is used to account for the missing values in W3.

References

  1. Abatemarco, Antonio. 2009. Measurement Issues for Adequacy Comparisons among Pension Systems. ENEPRI Research Report. Bruxelles: CEPS, vol. 64. [Google Scholar]
  2. Abatemarco, Antonio. 2010. Measuring Inequality of Opportunity through Between-Group Inequality Components. Journal of Economic Inequality 8: 475–90. [Google Scholar] [CrossRef]
  3. Abatemarco, Antonio, and Maria Russolillo. 2022. The dynamics of the gender gap at retirement in Italy: Evidence from SHARE. Italian Economic Journal. [Google Scholar] [CrossRef]
  4. Barth, Erling, Sari Pekkala Kerr, and Claudia Olivetti. 2021. The dynamics of gender earnings differentials: Evidence from establishment data. European Economic Review 134: 308–28. [Google Scholar] [CrossRef]
  5. Belloni, Michele, Agar Brugiavini, Raluca E. Buia, Ludovico Carrino, Danilo Cavapozzi, Cristina E. Orso, and Giacomo Pasini. 2020. What do we learn about redistribution effects of pension systems from internationally comparable measures of Social Security wealth? Journal of Pension Economics and Finance 19: 548–66. [Google Scholar] [CrossRef] [Green Version]
  6. Bergmann, Michael, Thorsten Kneip, Giuseppe De Luca, and Annette Scherpenzeel. 2019. Survey Participation in the Survey of Health, Ageing and Retirement in Europe (SHARE), Wave 1–7. Based on Release 7.0.0. SHARE Working Paper Series 41-2019. Munich: MEA, Max Planck Institute for Social Law and Social Policy. [Google Scholar]
  7. Bertay, Ata Can, Ljubica Dordevic, and Can Sever. 2020. Gender Inequality and Economic Growth: Evidence from Industry-Level Data. IMF Working Paper No. 20/119. Singapore: International Monetary Fund. [Google Scholar]
  8. Betti, Gianni, Francesca Bettio, Thomas Georgiadis, and Platon Tinios. 2015. Unequal Ageing in Europe. Women’s Independence and Pension. New York: Palgrave Macmillan. [Google Scholar]
  9. Bettio, Francesca, Platon Tinios, and Gianni Betti. 2013. The Gender Gap in Pensions in the EU. Luxembourg: Publications office of the European Union. [Google Scholar]
  10. Bonnet, Carole, Jean-Michel Hourriez, and Paul Reeve. 2002. Gender equality in pension: What role for rights accrued as a spouse or a parent? Population-E 67: 123–46. [Google Scholar] [CrossRef]
  11. Borella, Margherita, and Flavia Coda Moscarola. 2006. Distributive properties of pension systems: A simulation of the Italian transition from defined benefit to notional defined contribution. Giornale degli Economisti 65: 95–126. [Google Scholar]
  12. Börsch-Supan, Axel, Martina Brandt, Christian Hunkler, Thorsten Kneip, Julie Korbmacher, Frederic Malter, Barbara Schaan, Stephanie Stuck, and Sabrina Zuber. 2013. Data resource profile: The survey of health, ageing and retirement in Europe (SHARE). International Journal of Epidemiology 150: 549–68. [Google Scholar] [CrossRef] [PubMed]
  13. Chlon-Dominczak, Agnieszka. 2017. Gender Gap in Pensions: Looking Ahead. Brussels: European Parliament. [Google Scholar]
  14. Coppola, Mariarosaria, Maria Russolillo, and Rosaria Simone. 2022. On the evolution of the gender gap in life expectancy at normal retirement age for OECD countries. Genus 78: 27. [Google Scholar] [CrossRef]
  15. Dessimirova, Denitza, and Maria Audera Bustamante. 2019. The Gender Gap in Pensions in the EU. Washington, DC: Policy Department for Economic, Scientific and Quality of Life Policies. [Google Scholar]
  16. Diamond, Peter. 2004. Social security. American Economic Review 94: 1–24. [Google Scholar] [CrossRef]
  17. EC. 1999. Communication from the Commission to the Council, the European Parliament, the Economic and Social Committee and the Committee of the Regions. A Concerted Strategy for Modernizing Social Protection. COM 347 Final—Not Published in the Official Journal. Brussels: Commission of the European Communities. [Google Scholar]
  18. EC. 2003. Adequate and Sustainable Pensions. Joint Report by the Commission and the Council. Brussels: Commission of the European Communities. [Google Scholar]
  19. EC. 2015. Report on Equality between Women and Men. Luxembourg: Office for Publications of the European Communities. [Google Scholar]
  20. Eurofound and EIGE. 2021. Upward Convergence in Gender Equality: How Close is the Union of Equality? Luxembourg: Publications Office of the European Union. [Google Scholar]
  21. Leythienne, Denis, and Marina M. Pérez-Julián. 2021. Gender Pay Gaps in the European Union: A Statistical Analysis. EUROSTAT Statistical Working Papers. Luxembourg: EUROSTAT. [Google Scholar]
  22. Flory, Judith. 2012. The Gender Pension Gap—Developing an Indicator Measuring Fair Income Opportunities for Women and Men. Berlin: Federal Ministry for Family Affairs, Senior Citizens, Women and Youth, BMFSFJ Publication. [Google Scholar]
  23. Foster, James E., and Artyom A. Shneyerov. 2000. Path independent inequality measures. Journal of Economic Theory 91: 199–22. [Google Scholar] [CrossRef] [Green Version]
  24. Jefferson, Therese. 2009. Women and Retirement Pensions: A Research Review. Feminist Economics 15: 115–45. [Google Scholar] [CrossRef]
  25. Jarvis, Sarah, and Stephen Jenkins. 1998. How much income mobility is there in Britain? The Economic Journal 108: 428–43. [Google Scholar] [CrossRef]
  26. Kleven, Henrik, and Camille Landais. 2017. Gender Inequality and Economic Development: Fertility, Education and Norms. Economica 84: 180–209. [Google Scholar] [CrossRef]
  27. Kochhar, Ms Kalpana, Ms Sonali Jain-Chandra, and Ms Monique Newiak, eds. 2017. Women, Work, and Economic Growth: Leveling the Playing Field. Washington, DC: International Monetary Fund. [Google Scholar]
  28. Lambert, Peter. 2001. The Distribution and Redistribution of Income: A Mathematical Analysis, 3rd ed. Manchester: Manchester University Press. [Google Scholar]
  29. Leombruni, Roberto, and Michele Mosca. 2012. Le système de retraite italien compense-t-il les inégalités hommes-femmes sur le marché du travail? Retraite et Société 2: 139–63. [Google Scholar] [CrossRef]
  30. Levine, Phillip B., Olivia S. Mitchell, and John Phillips. 1999. Worklife Determinants of Retirement Income Differentials between Men and Women. NBER Working Paper. Cambridge: NBER, p. 7243. [Google Scholar]
  31. Maasoumi, Esfandiar. 2019. The Gender Gap between Earnings Distributions. Journal of Political Economy 127: 2438–504. [Google Scholar] [CrossRef] [Green Version]
  32. Mavrikiou, Petroula M., and Julijana Angelovska. 2020. Factors Determining Gender Pension Gap in Europe: A Cross National Study. UTMS Journal of Economics 11: 151–60. [Google Scholar]
  33. Niessen-Ruenzi, Alexandra, and Christoph Schneider. 2022. The Gender Pension Gap in Germany—Reasons and Remedies. In CESifo Forum. München: IFO Institute—Leibniz Institute for Economic Research at the University of Munich, vol. 23, pp. 20–24. [Google Scholar]
  34. OECD. 2012. Closing the Gender Gap Act Now: Act Now. Paris: OECD Publishing. [Google Scholar]
  35. OECD. 2018. OECD Pensions Outlook 2018. Paris: OECD Publishing. [Google Scholar]
  36. OECD. 2021. Pensions at a Glance 2021: OECD and G20 Indicators. Paris: OECD Publishing. [Google Scholar]
  37. Redmond, Paul, and Seamus McGuinness. 2019. The Gender Wage Gap in Europe: Job Preferences, Gender Convergence and Distributional Effects. Oxford Bulletin of Economics and Statistics 81: 564–87. [Google Scholar] [CrossRef]
  38. Shorrocks, Anthony. 1980. The class of additively decomposable inequality measures. Econometrica 48: 613–25. [Google Scholar] [CrossRef] [Green Version]
  39. Veremchuk, Anna. 2020. Gender Gap in Pension Income: Cross-Country Analysis and Role of Gender Attitudes. Tartu: University of Tartu, Faculty of Social Sciences, School of Economics and Business Administration. [Google Scholar]
Figure 1. Between-gender inequality ( G E 0 B ) over time and across nine European Countries.
Risks 11 00063 g001
Figure 2. GGP index over time and across nine European Countries.
Risks 11 00063 g002
Figure 3. Between inequality without survivor pensions over time and across nine European Countries.
Risks 11 00063 g003
Table 1. Basic characteristics of pension systems.
First-TierSecond-Tier
Res.Cont.% AW EarningsPublicPrivate
Austria 25.3DB
Belgium 30.7DB
Czech Rep. 11.5DB
Denmark 18.6FDCFDC
France 24.3DB+Pts
Germany 19.3Pts
Italy 21.2DB+NDC
Spain 27.9DB
Sweden 22.2NDC+FDCFDC
Note: Res. = residence-based eligibility requirement, Cont. = contribution-based eligibility requirement, % AW earnings: average benefit value of first-tier pensions as a percentage of gross average wage earnings in 2020, Ann.\temp = annuity vs temporary payment of survivor benefits, Min. Age = minimum age for access to survivor programs, % Exp. DGP = Expenditures on survivor benefits, % of GDP, 2017 or latest. Source: “Pensions at a Glance 2021—OECD and G20 Indicators”, “OECD Pensions Outlook 2018—OECD 2018”.
Table 2. Main characteristics of survivor pensions in nine EU countries.
CountryMinimum Eligibility AgeCivil UnionCohab.After DivorceAfter Remarriage% of Deceased’s PensionMeans-Testing
AustriaNoYesNoYesNo60APE
Belgium46.5NoNoNoNo100APE
Czech R.55/58NoNoNoNo58AP
DenmarkOnly temporary payments
France55/66NoNoYesYes57AOI
Germany45.5YesNoYesNo57OT
ItalyNoYesNoYesNo60APE
SpainNoYesYesYesYes60NA
SwedenNo mandatory survivor pension programs
Note: APE = affected by own pension and/or income earning, AP = affected only by own pension, AOI = affected by income of other family members, OT = affected only when earnings over certain thresholds, NA = Not affected. Source: ”OECD Pensions Outlook 2018—OECD 2018”.
Table 3. Summary statistics of pension payments by country and gender.
CountryGenderObs.Mean (€)Std. Dev.MinMax
AustriaWomen58031289140116720,000
 Men46531830181220022,000
BelgiumWomen5718224837276025,776
 Men7026302547487631,839
Czech R.Women8008377126241021
 Men503943014224971
DenmarkWomen457412625611345369
 Men382213866991345802
FranceWomen6757131811178018,200
 Men6165184512637518,000
GermanyWomen5188924590654600
 Men55651569797675000
ItalyWomen4553829414734200
 Men631711555121004200
SpainWomen2737749444596720
 Men5580939499528333
SwedenWomen5719126797910817,338
 Men5179164695210816,402
Table 4. Summary statistics of pension payments when survivor pensions are excluded by country and gender.
CountryGenderObs.Mean (€)Std. Dev.
AustriaWomen470712421422
 Men460618311819
BelgiumWomen476122093724
 Men698130244750
Czech RepWomen6525366117
 Men4810427139
DenmarkWomen43191225531
 Men37721380695
FranceWomen520512211071
 Men596918351252
GermanyWomen4294833550
 Men53931568803
ItalyWomen3955800402
 Men62441155513
SpainWomen2208728461
 Men5553939499
SwedenWomen51541243980
 Men48071611933
Disclaimer/Publisher’s Note: The statements, opinions and data contained in all publications are solely those of the individual author(s) and contributor(s) and not of MDPI and/or the editor(s). MDPI and/or the editor(s) disclaim responsibility for any injury to people or property resulting from any ideas, methods, instructions or products referred to in the content.

