The optimization of operating parameters of the analyzer has been conducted in order to obtain satisfactory separation of the analytes and the highest sensitivity of the detection system.
3.1. Separation and Multichannel Detection
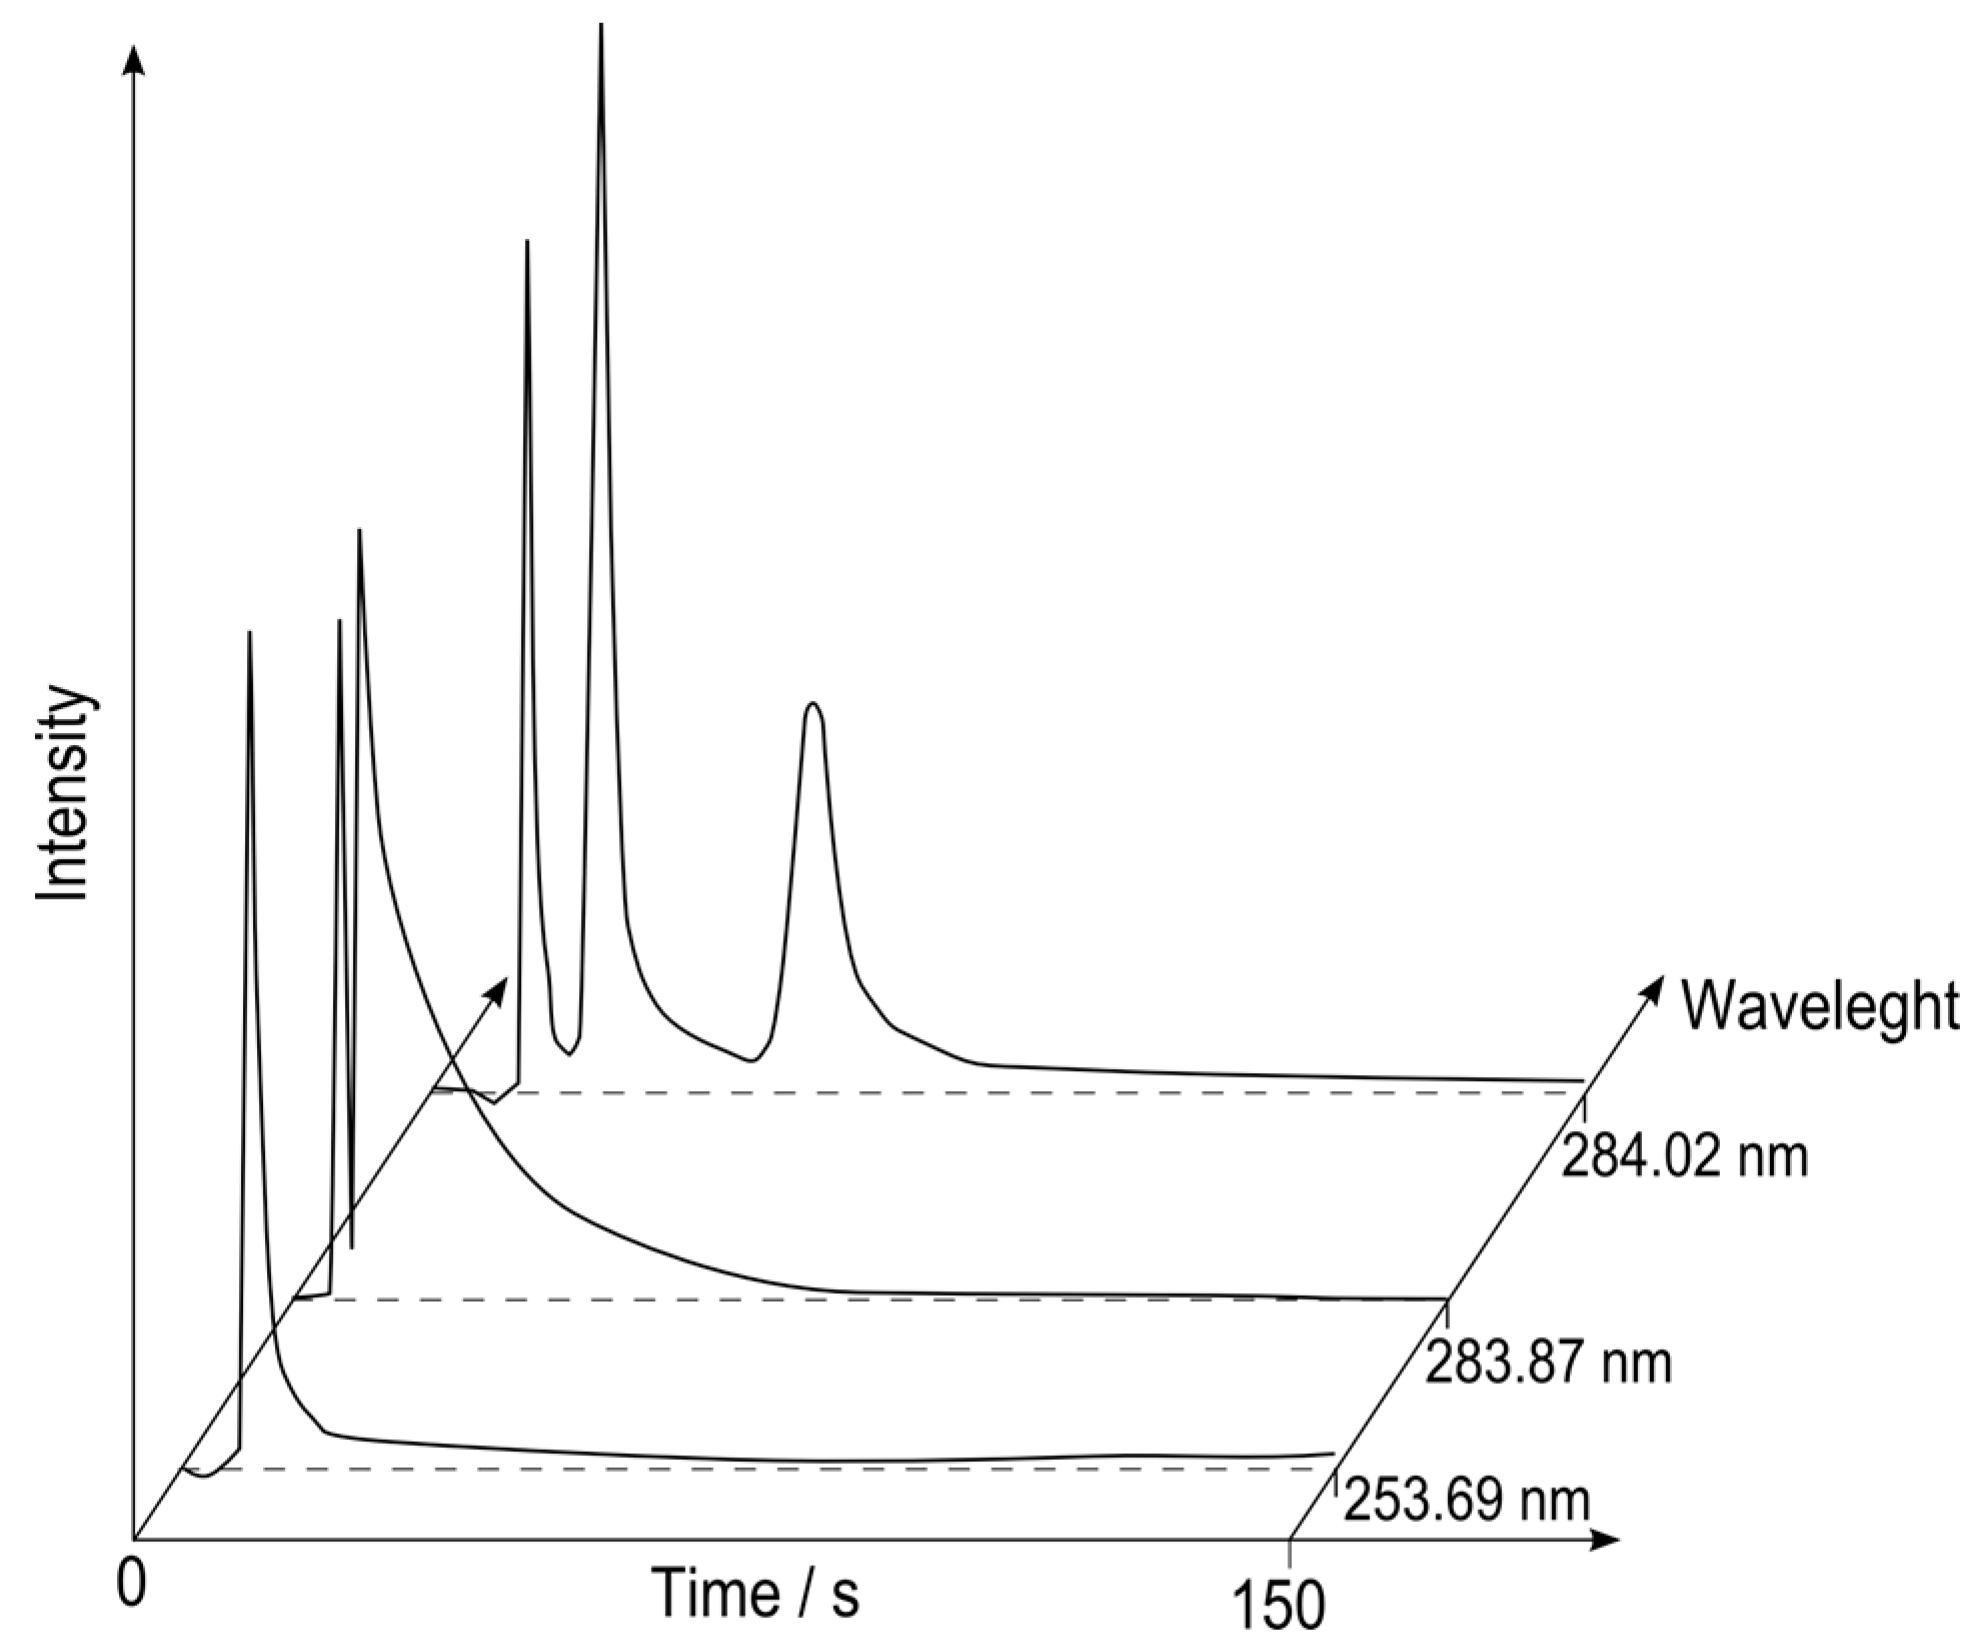
Due to usage of simultaneous CCD-based spectrometer it was possible to perform multichannel detection, which in practice enables multielement detection. A sample containing trace methylmercury and butyltin compounds has been analyzed. From more than 3600 available chromatograms, three were chosen to show the capabilities of that solution (see
Figure 2). These are chromatograms registered for spectral line of tin at 284.02 nm, OH band at 283.87 nm and mercury line at 253.69 nm.
HS SPME-MCGC separations of the organometallic compounds were carried out by using multicapillary column of only 5 cm length with inner diameters of 40 µm with fair separation efficiency (half peak widths below 4 s) in less than 10 s retention time except tributyltin derivative. Retention times of all separated compounds are collected in
Table 2. The first occurring peak within 6 ± 2 s corresponds to OH emission, and it has been established as dead retention time. OH band peak is always present when analyzing water samples so it is convenient to use this peak as a reference value for determining reduced retention times that eliminates human factor during manual sample injection. The use of the short 5-cm column allowed a slight decrease of the duration of a run for a full GC analysis of butyltins compared with a 22-cm multicapillary column used by Łobiński
et al. [
10] for temperature-programmed separation. However, a two-fold decrease of retention times for MBT and DBT was observed compared with a 1-m MCGC column.
Figure 2.
Extracted chromatograms registered at Hg (253.69 nm), OH (283.87 nm) and Sn (284.02 nm) wavelengths.
Figure 2.
Extracted chromatograms registered at Hg (253.69 nm), OH (283.87 nm) and Sn (284.02 nm) wavelengths.
Table 2.
Reduced retention times obtained for detected compounds by the SPME-MCGC-DP-OES system.
Table 2.
Reduced retention times obtained for detected compounds by the SPME-MCGC-DP-OES system.
| Peak | Reduced retention time / s |
|---|
| MeHg | 2.5 |
| MBT | 3.5 |
| DBT | 8.0 |
| TBT | 21.0 |
The other important observation is a substantial peak tailing from OH emission which influences the baseline for peaks of three butyltin compounds on the chromatogram recorded at 284.02 nm. A reduced solvent loading offered by SPME comparing with typical solvent loading is beneficial for fast GC because retention times for several analyte peaks are very close to that for solvent peak, which, however, is reasonably small in this case. Further, headspace SPME sampling is recommended rather than direct insertion mode to minimize solvent loading. Despite the short column length and relatively high carrier gas flow retention times turned out to be exceedingly long, especially for TBT. These values are similar with those obtained by Schmitt
et al. [
11] for same organotin compounds using 1 m long multicapillary column and temperature 170 °C. This proves very strong interaction between analyzed compounds and stationary phase at low temperatures, and suggests that MC column temperature would be further optimized. Also, boiling temperatures of the separated compounds should be considered being substantially different for ethylated methylmercury and three butyltin compounds.
As shown in
Figure 2, three organotin compounds are separated very well under experimental conditions with the use of the 5 cm-long MCGC column. The resolving power of a multicapillary column is determined by two measurable parameters: carrier gas flow and GC column temperature. Usually an increase of these parameters shorten retention time and peak width. Also, a decrease of analysis time by using a short column will cause a slight decrease in efficiency. Column efficiency values were calculated from following equation:
where N is number of theoretical plates, t
R is retention time and
is half peak width. Column efficiency may be also expressed by the theoretical plate height (HETP). MCGC column efficiency has been calculated for DBT and methylmercury. For DBT, the maximum number of theoretical plates and HETP has been determined for carrier gas flow rate of 40 mL∙min
−1, and they were 328 and 0.15 mm, respectively. The HETP value is very close to that obtained for tertabutyltin (below 0.2 mm) by Rodriguez Pereiro
et al. [
12] using a 1 m-long MCGC column coated with SE-30 and fast oven temperature ramp rate. Next, similar calculations have been made for methylmercury for our experimental setup, and the respective data were 270 and 0.18 mm. A similar HETP value has been obtained by Rosenkranz
et al. [
3] for diethylmercury (0.17 mm) under similar conditions but for 1 m-long MCGC column.
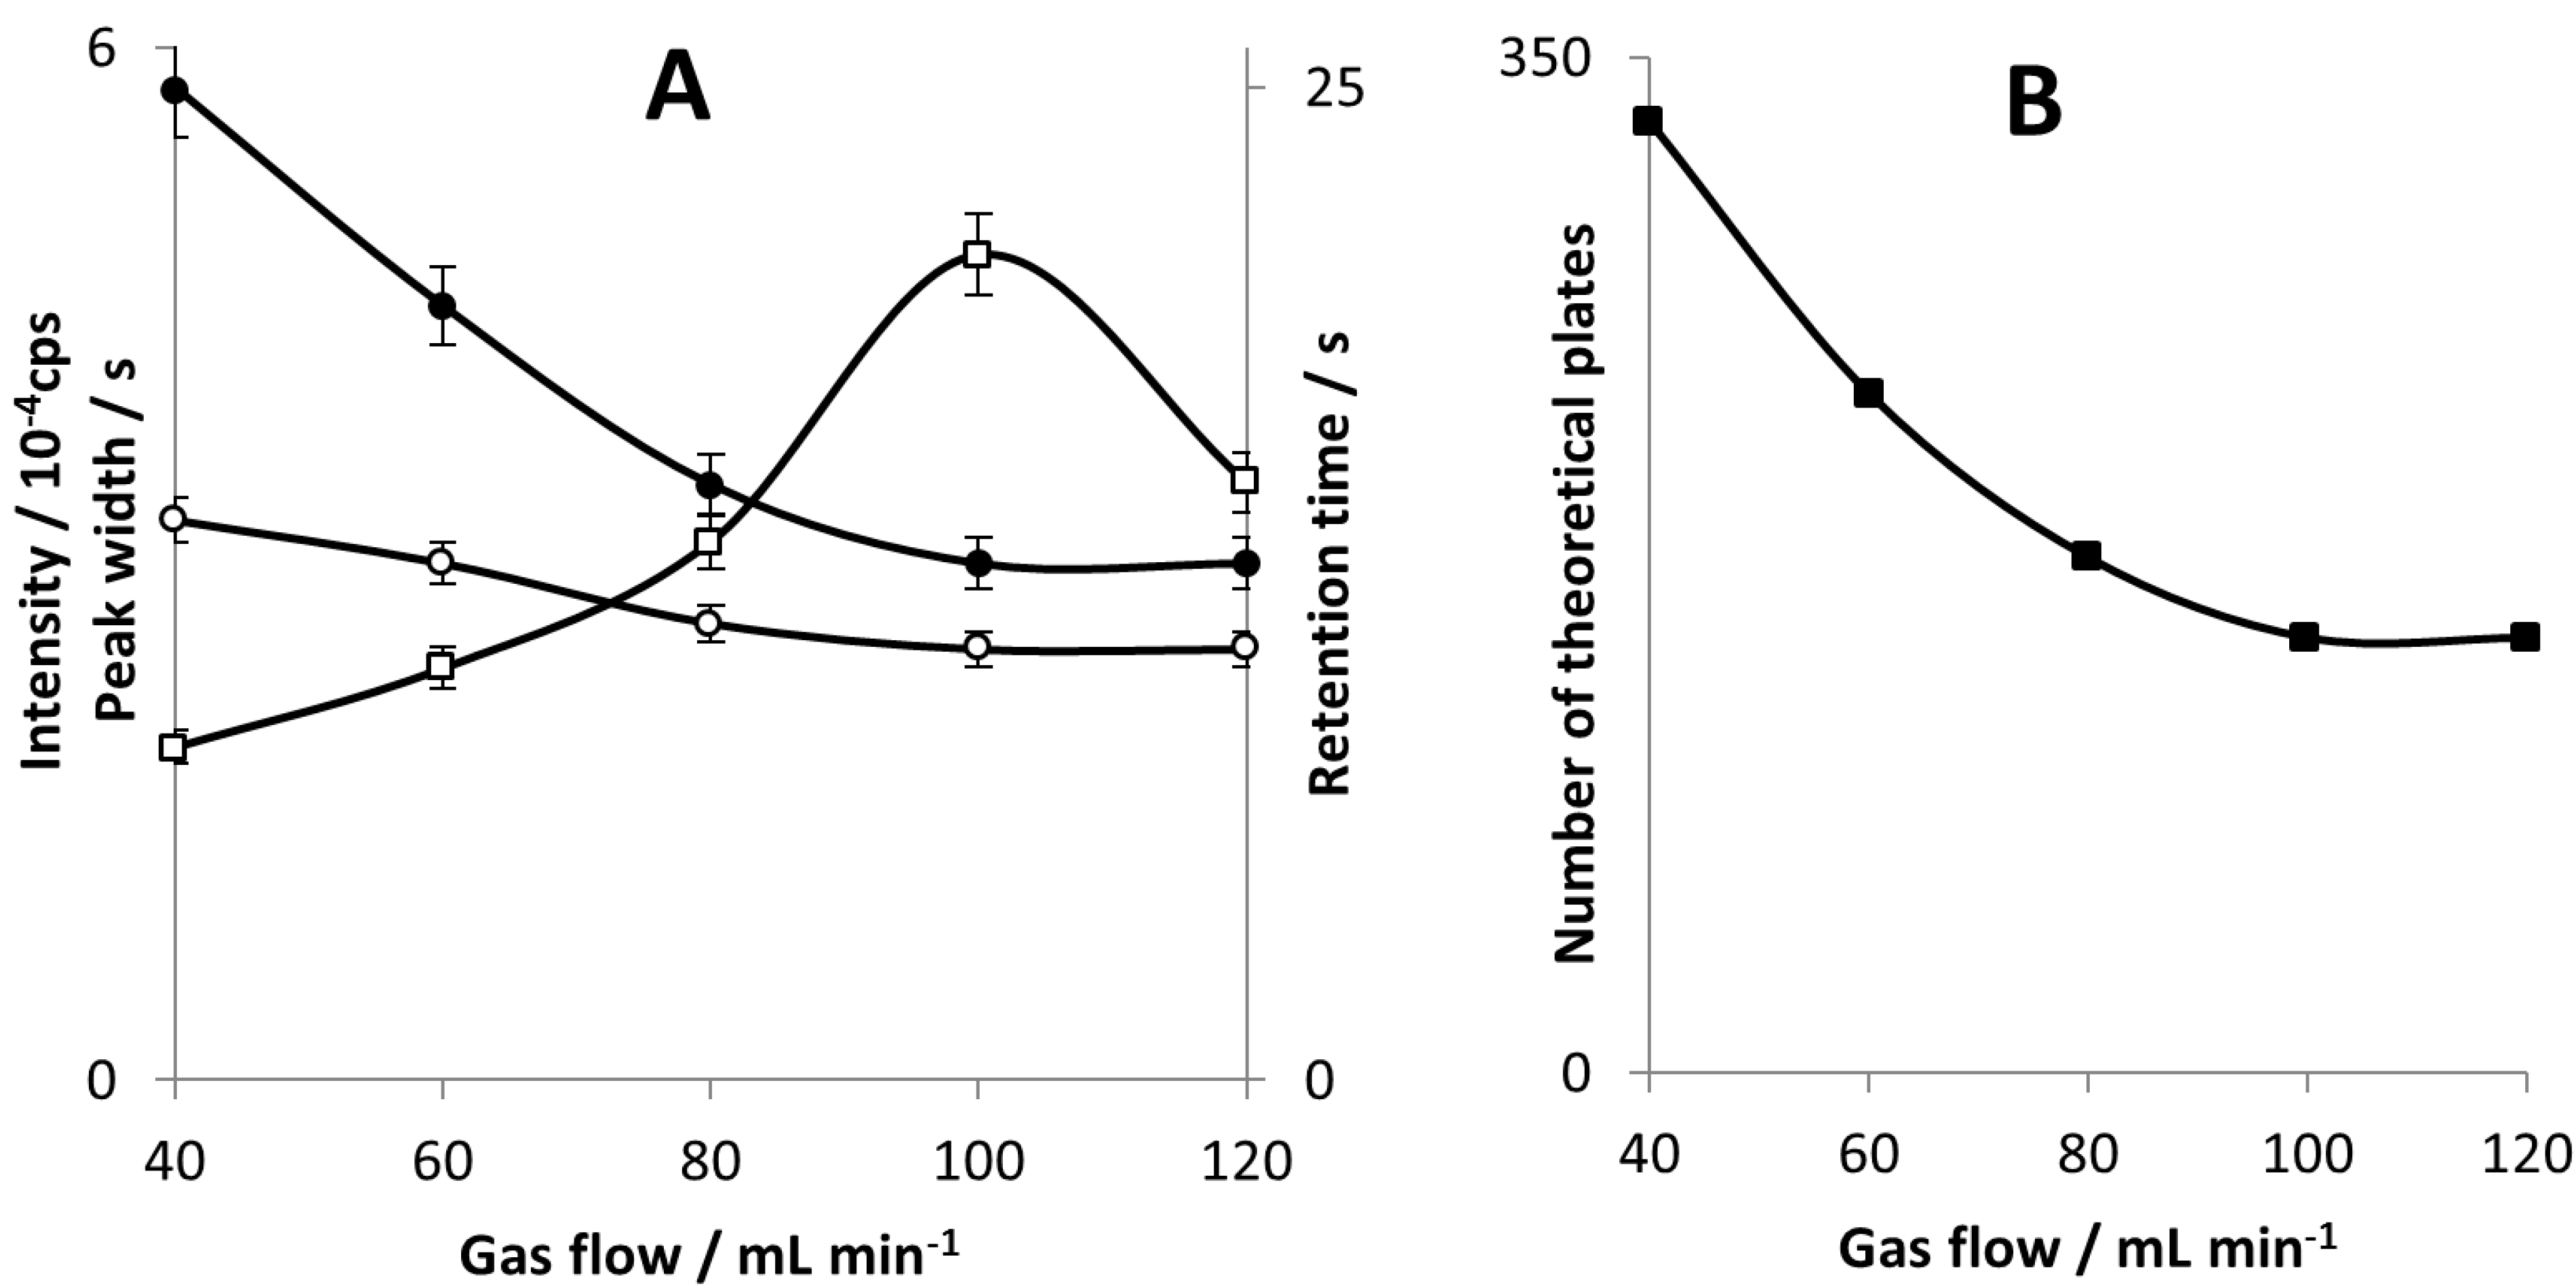
The best peak resolution has been obtained for carrier gas flow rate of 40 mL∙min
−1. However, the highest sensitivity of the signal measurement, for both peak area and peak height, have been obtained at gas flow of 100 mL∙min
−1 (see
Figure 3A). Likely, carrier gas flow rate changes the plasma excitation conditions and thus the response of the detector. A higher gas flow rate shortens sample residence time in the plasma and sample-plasma interaction is too weak. Since plasma deformation and decrease in size were visible with a bare eye, it is probable reason why there is a drop in peak height at 120 mL∙min
−1.
Figure 3.
Peak intensity (□), peak half-width (○) and retention time (●) for DBT as a function of carrier gas flow (A); column efficiency (■) calculated for DBT as a function of a carrier gas flow (B).
Figure 3.
Peak intensity (□), peak half-width (○) and retention time (●) for DBT as a function of carrier gas flow (A); column efficiency (■) calculated for DBT as a function of a carrier gas flow (B).
Our study revealed that carrier gas flow in the range of 40–120 mL min−1 significantly influences column separation efficiency. This fact is probably due to the short column length and the use of SMPE which is known to be relatively slow desorption method. That is why peak width changes very little with increasing gas flow. However, retention time shows a significant decrease with increasing gas flow so it is not balanced by peak half-width and as a result column efficiency is gas flow dependent in examined range.
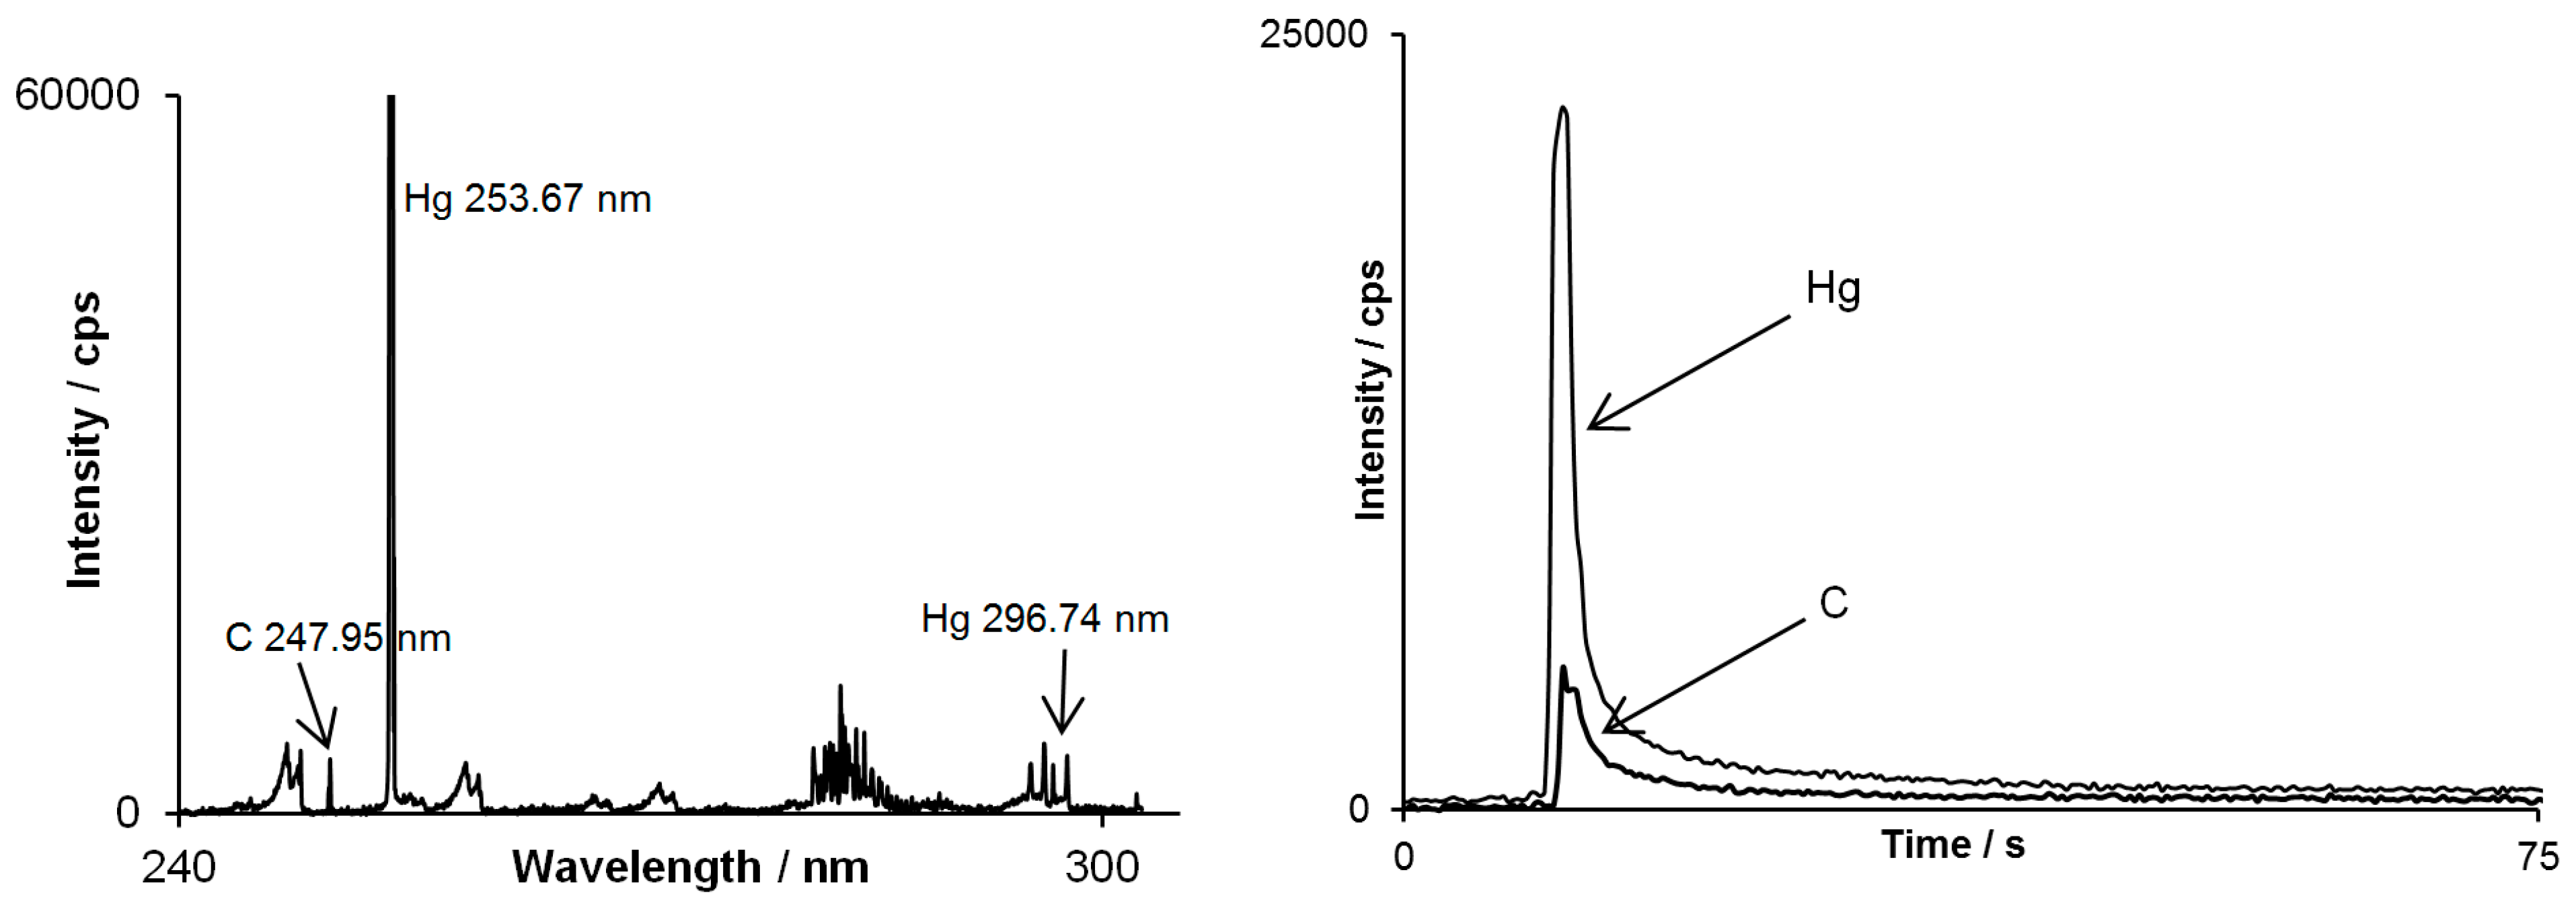
However there is another important feature which comes with the multichannel CCD-based detector used in this study in context of separation techniques. When an analyte examined is an unknown substance, a registered emission spectrum assigned to its peak may support the identification of the substance along with the retention time value. As shown in
Figure 4, on emission spectrum assigned to methylmercury peak, besides strong mercury line, carbon line occurred as well. This indicates that mercury is chemically bounded to carbon atom(s) and approves the identification of methylmercury.
Figure 4.
Spectrum by DP-OES assigned to the methylmercury peak (on the left) and chromatograms simultaneously registered for mercury line at 253.67 nm and carbon line at 247.95 nm (on the right).
Figure 4.
Spectrum by DP-OES assigned to the methylmercury peak (on the left) and chromatograms simultaneously registered for mercury line at 253.67 nm and carbon line at 247.95 nm (on the right).
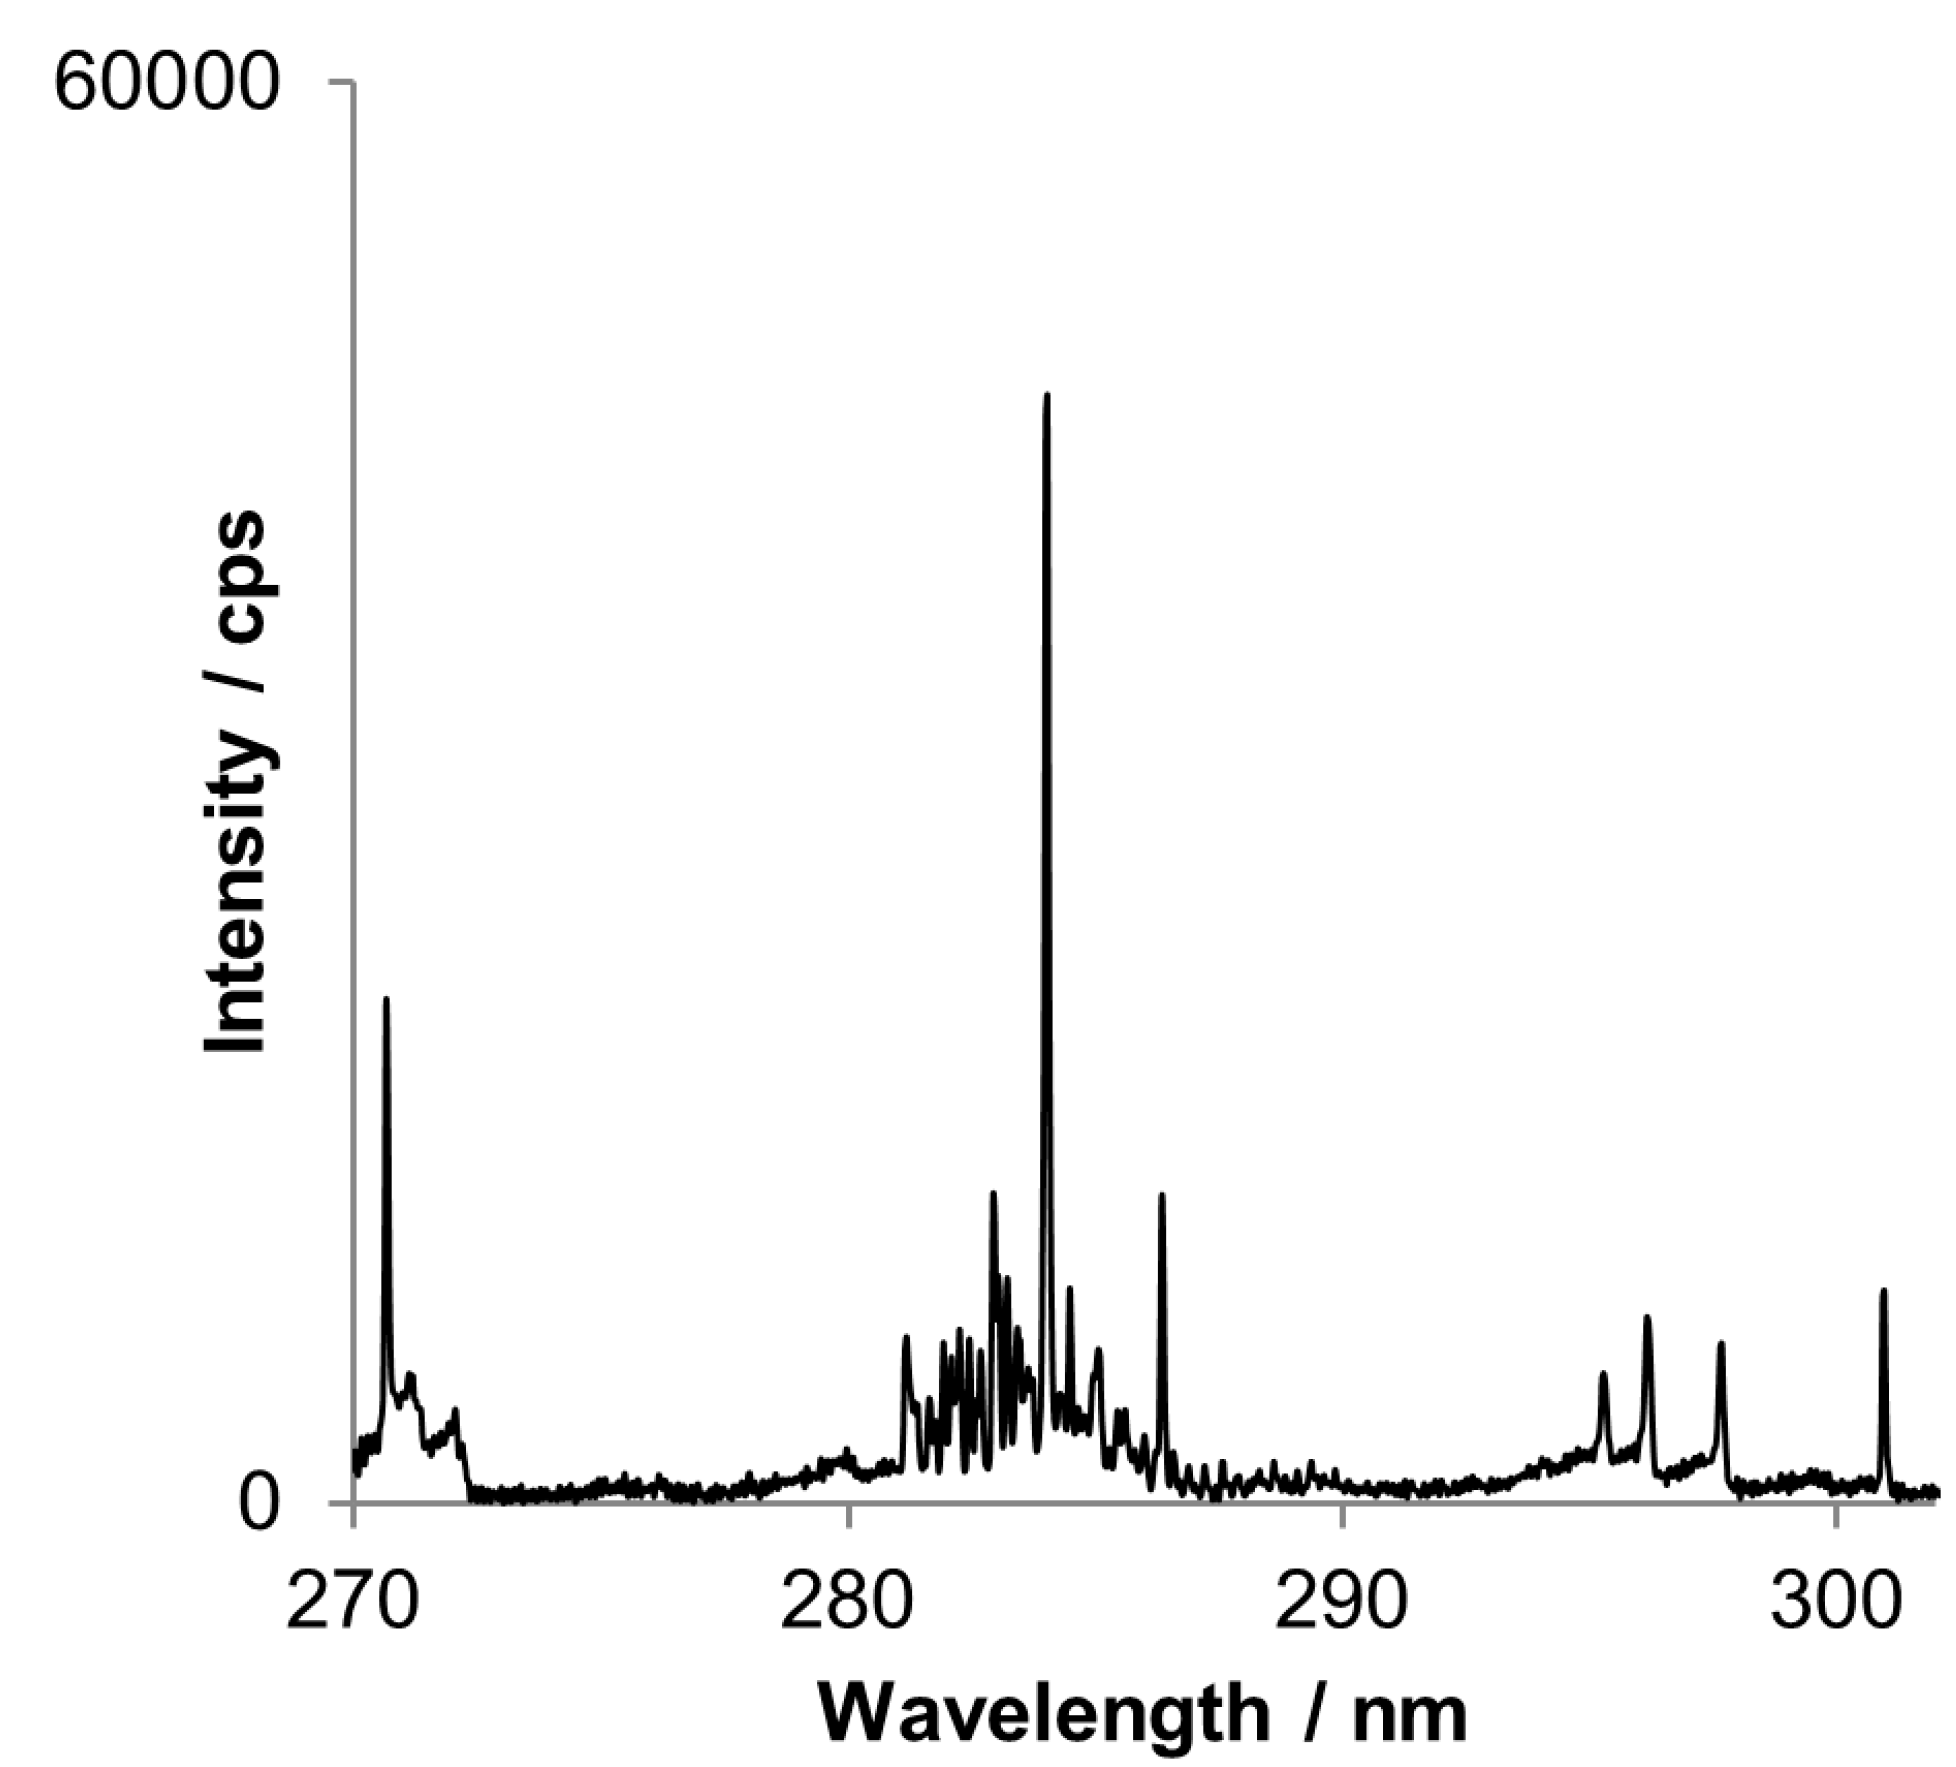
Another advantage of simultaneous CCD-based detector is possibility of best analytical line selection. When a commonly used analytical line is too strong and saturates the detector, less sensitive line may be chosen for external calibration. Recording whole spectra is also helpful when the prominent line is interfered. However as it is discussed below spectral interference does not exclude affected line when using the CCD-based detector. Often met problem is a spectral line interference caused by molecular band or background drift, as exemplary shown for tin lines in
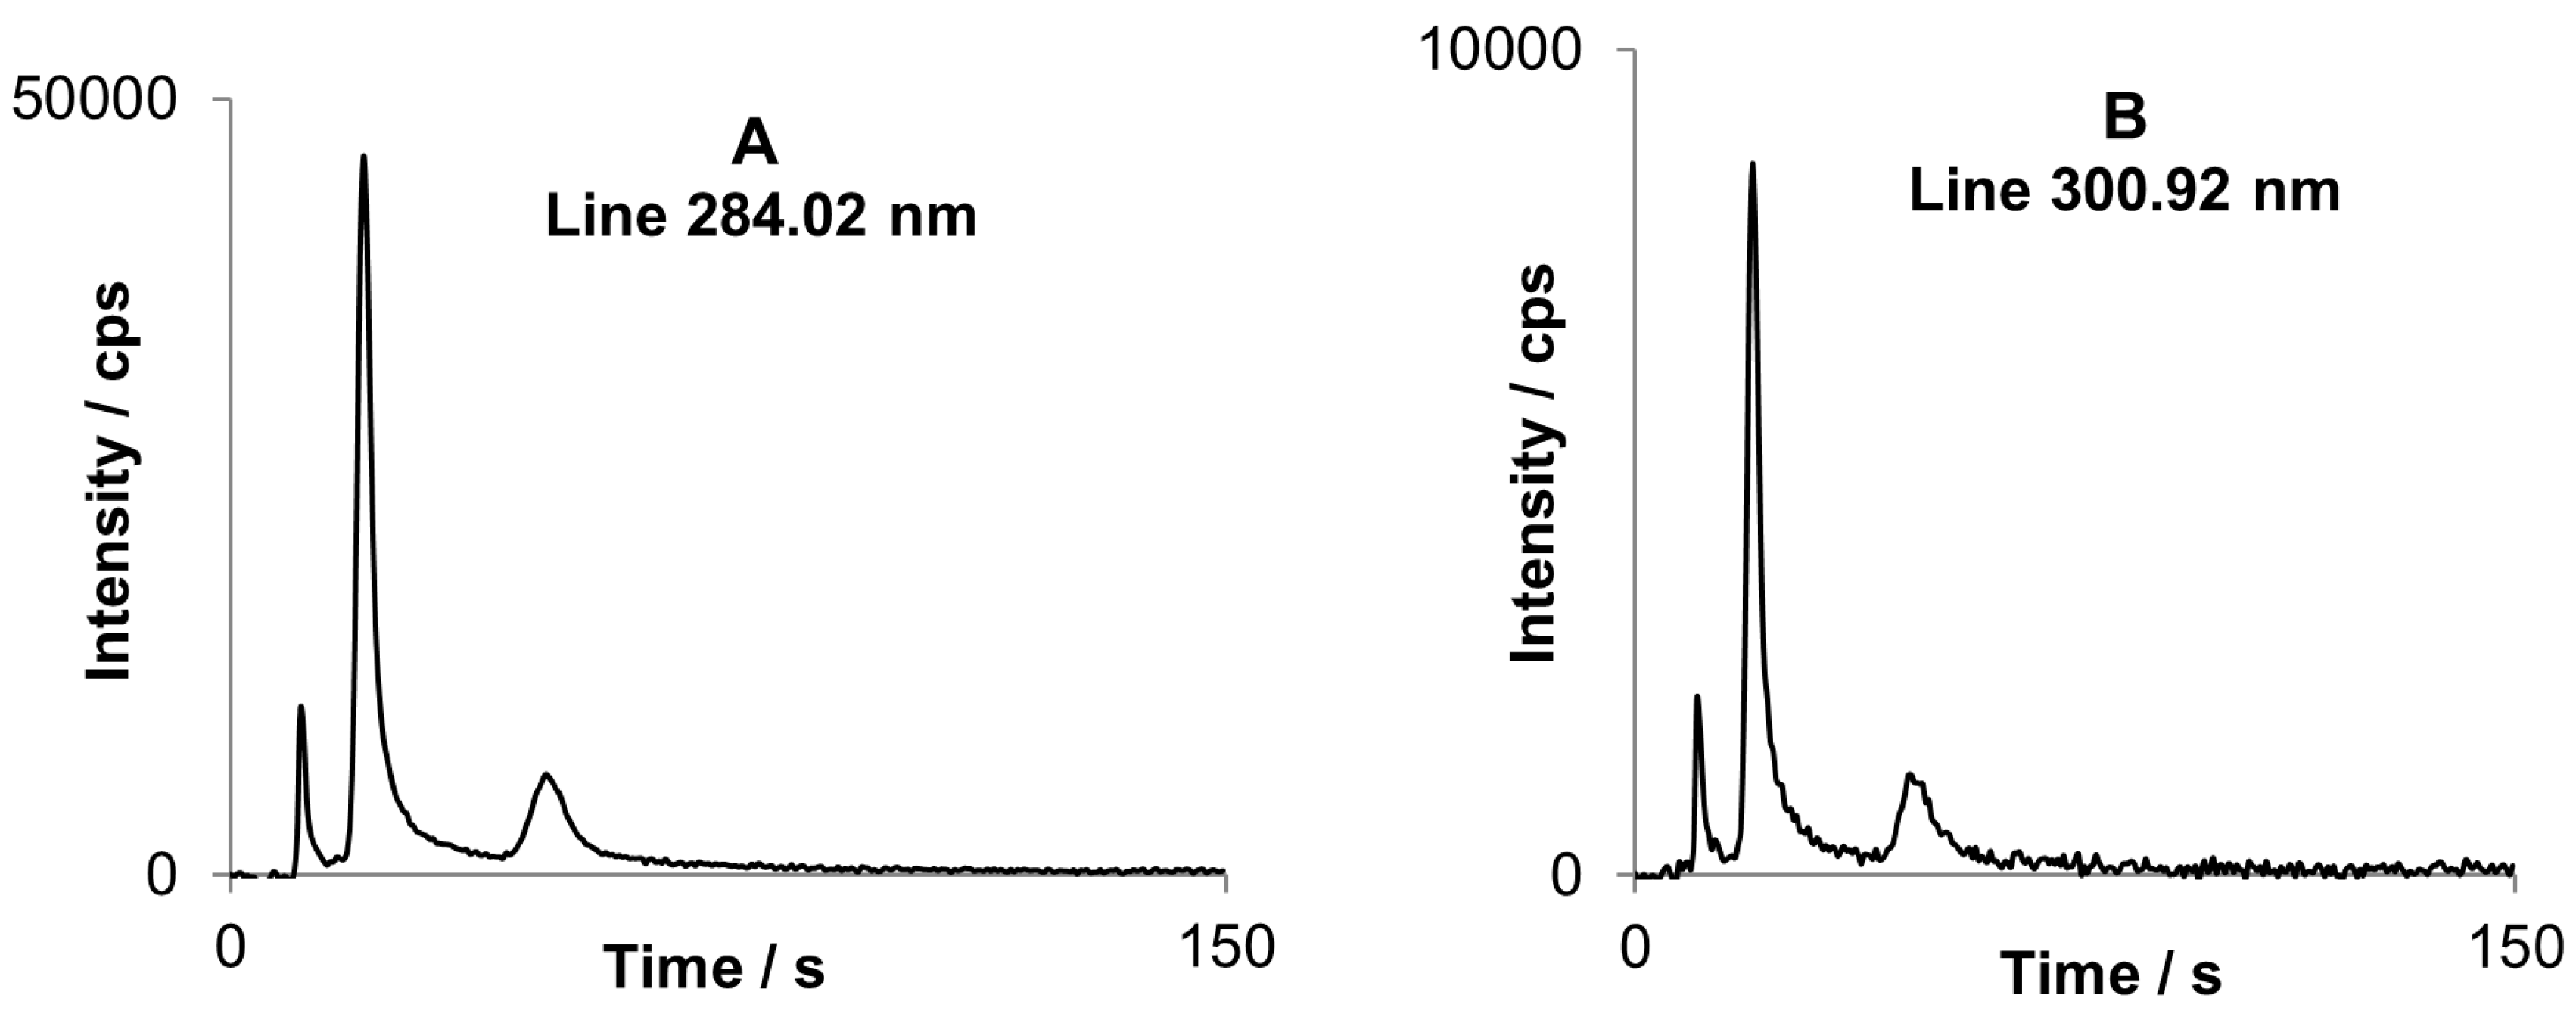
Figure 5. However this unfavorable situation may be avoided by subtraction of the transient signal registered for a “neighboring” pixel, because molecular bands are generally wide and many pixels are similarly affected by the interfering OH emission while they do not contain analyte emission. An example is attached in
Figure 6.
Figure 6A represents a chromatogram for three butyltin compounds. The most sensitive line of tin (284.02 nm) in this spectral range is significantly interfered by emission of OH rotational band (281–285 nm), typically present in spectra of cold plasmas. The interference is disclosed as long background tailing, because water is always present in a considerable amount. A simple subtraction of chromatogram at 283.87 nm where OH band emission is the same as for 284.02 nm and does not contain tin emission, deals the problem entirely. This procedure is repeatable for all tested conditions and can help to avoid strong interference without the need of performing additional measurements. Eventually profile of corrected chromatogram for 284.02 nm line is the same as for non-interfered line at 300.92 nm (
Figure 6B).
Figure 5.
A part of the spectrum by DP-OES assigned to the DBT peak (second peak on chromatograms below). Tin lines at 284.02 and 286.34 nm are interfered by OH rotational band.
Figure 5.
A part of the spectrum by DP-OES assigned to the DBT peak (second peak on chromatograms below). Tin lines at 284.02 and 286.34 nm are interfered by OH rotational band.
Figure 6.
Corrected chromatogram registered for tin spectral line at 284.02 nm (A) compared to chromatogram for non-interfered tin spectral line and 300.92 nm (B). After baseline correction profiles are similar for both chromatograms.
Figure 6.
Corrected chromatogram registered for tin spectral line at 284.02 nm (A) compared to chromatogram for non-interfered tin spectral line and 300.92 nm (B). After baseline correction profiles are similar for both chromatograms.
3.2. SPME Optimization and Analytical Performance Calculation
The SPME procedure has been briefly optimized in order to achieve maximum sensitivity, efficient use of expensive reagents and reasonably short extraction time. Parameters are listed in
Table 1. In order to evaluate the performance of SPME sampling of butyltin compounds, the experimental extraction effieciency has been determined according to Haberhauer Troyer
et al. [
13] who proposed a simple procedure for estimation of the extraction efficiency (EE), based on successive extractions of the same sample after the derivatization step. The following equation is given below.
where
PAn is peak area, and n is number of extractions. The EE (%) can be calculated from the slope of the linear regression. Results for each butyltin compound are listed in
Table 3.
Table 3.
Experimental extraction efficiency values for sampling of butyltins with PDMS fiber coating.
Table 3.
Experimental extraction efficiency values for sampling of butyltins with PDMS fiber coating.
| Compound | Extraction efficiency / % |
|---|
| MBT | 2.0 |
| DBT | 53.5 |
| TBT | 54.0 |
TBT and DBT exhibit very high extraction efficiency exceeding 50% whilst MBT reaches only 2%. The difference was easily recognized during succesive extractions when for first two compunds forth extraction signals were bearly measurable while for MBT it was possible to carry on more than 15 measurements with similar signal value. Also, the lower extraction efficiency of MBT comparing to DBT and TBT was observed in numerous studies, however, the nature of this discrepancy remains unknown and further investigation is required. The extraction efficiency values for DBT and TBT are very high when comparing to 4% and 8% obtained by Grinberg
et al. [
14] for CH
3Hg
+ and Hg
2+, respectively.
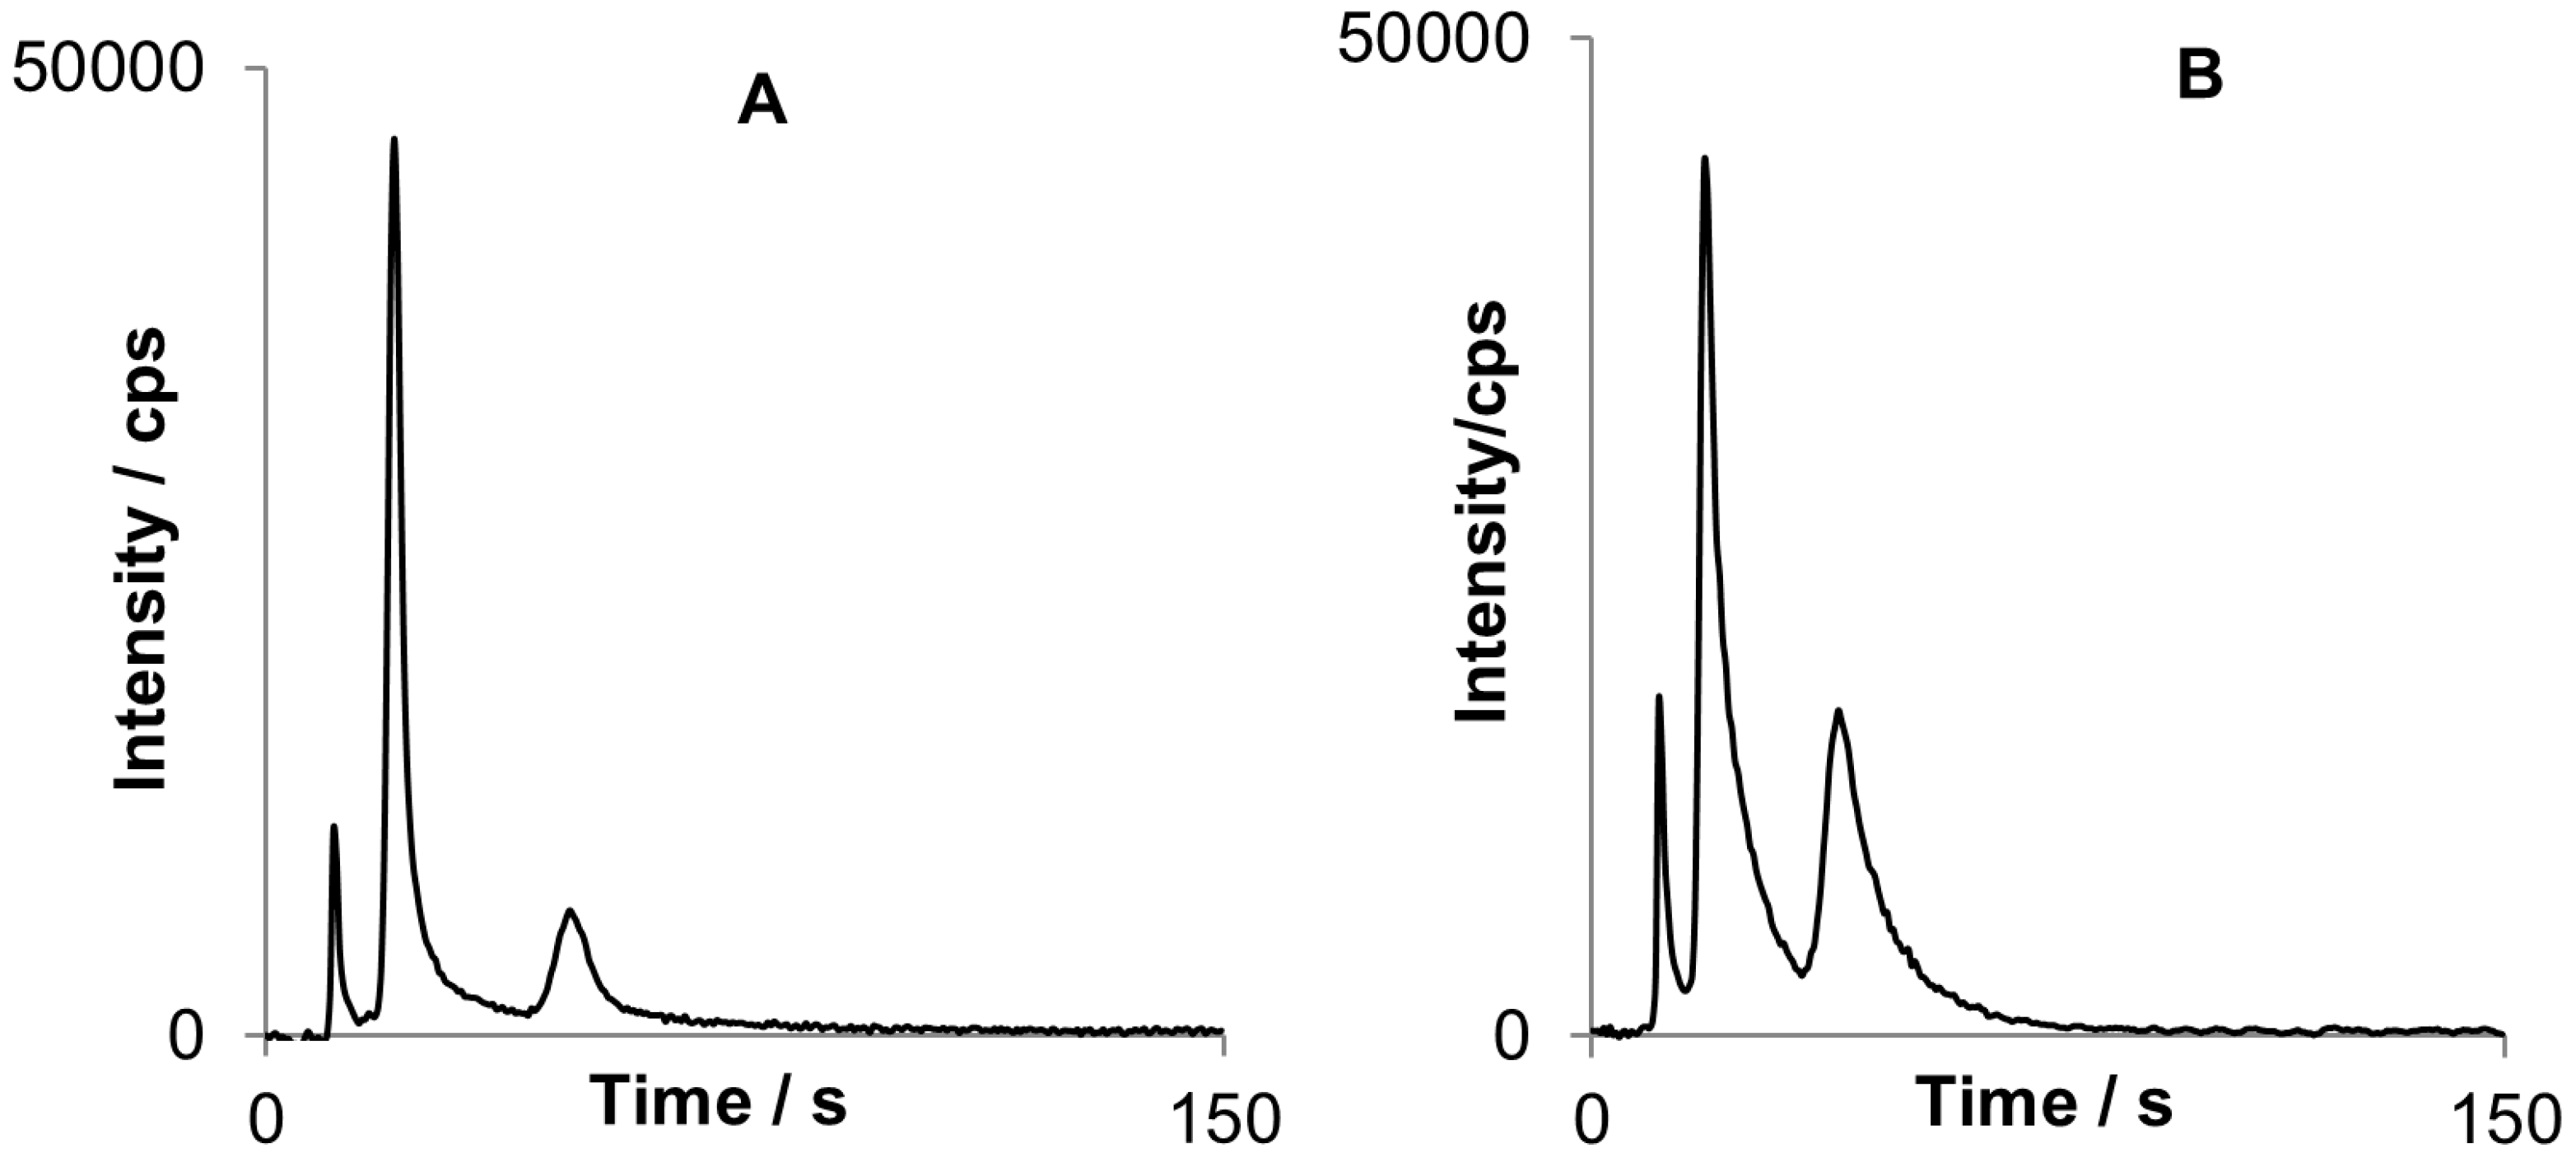
Two different fiber coatings were examined for SPME sampling procedure: Carboxen/PDMS and PDMS. To compare the performance of these fibers same sorption and detection conditions were applied (
Figure 7).
Figure 7.
Two chromatograms obtained for MBT (first peak), DBT (second peak) and TBT (third peak): Chromatogram A) was obtained after sorption on Carboxen/PDMS fiber while (B) with the use of PDMS fiber.
Figure 7.
Two chromatograms obtained for MBT (first peak), DBT (second peak) and TBT (third peak): Chromatogram A) was obtained after sorption on Carboxen/PDMS fiber while (B) with the use of PDMS fiber.
PDMS fiber turned out to be better for organotin sorption, especially for DBT and TBT with peak areas approximately twice bigger than for Carboxen/PDMS in similar conditions. However the peaks are not fully separated that implies further optimization of the system when using PDMS.
The fiber performance was evaluated and confirmed through the fiber concentration capability index (F
ij), first introduced by Zuba
et al. [
15] and modified by Hamm
et al. [
16] as:
where F
ij is the concentration capability index of fiber j for analyte i, k is the number of fibers investigated and H
ij is the peak height of analyte i with fiber j.
The fiber concentration capability index for PDMS and Carboxen/PDMS fibers was calculated to be 1.08 and 0.98, respectively. That is why PDMS fiber is recommended. On the other hand, peak shapes and lower half peak widths obtained after sorption with the use of Carboxen/PDMS comparing with PDMS suggest that desorption of the analytes from the former sorbent goes more rapidly that is beneficial for the fast GC approach.
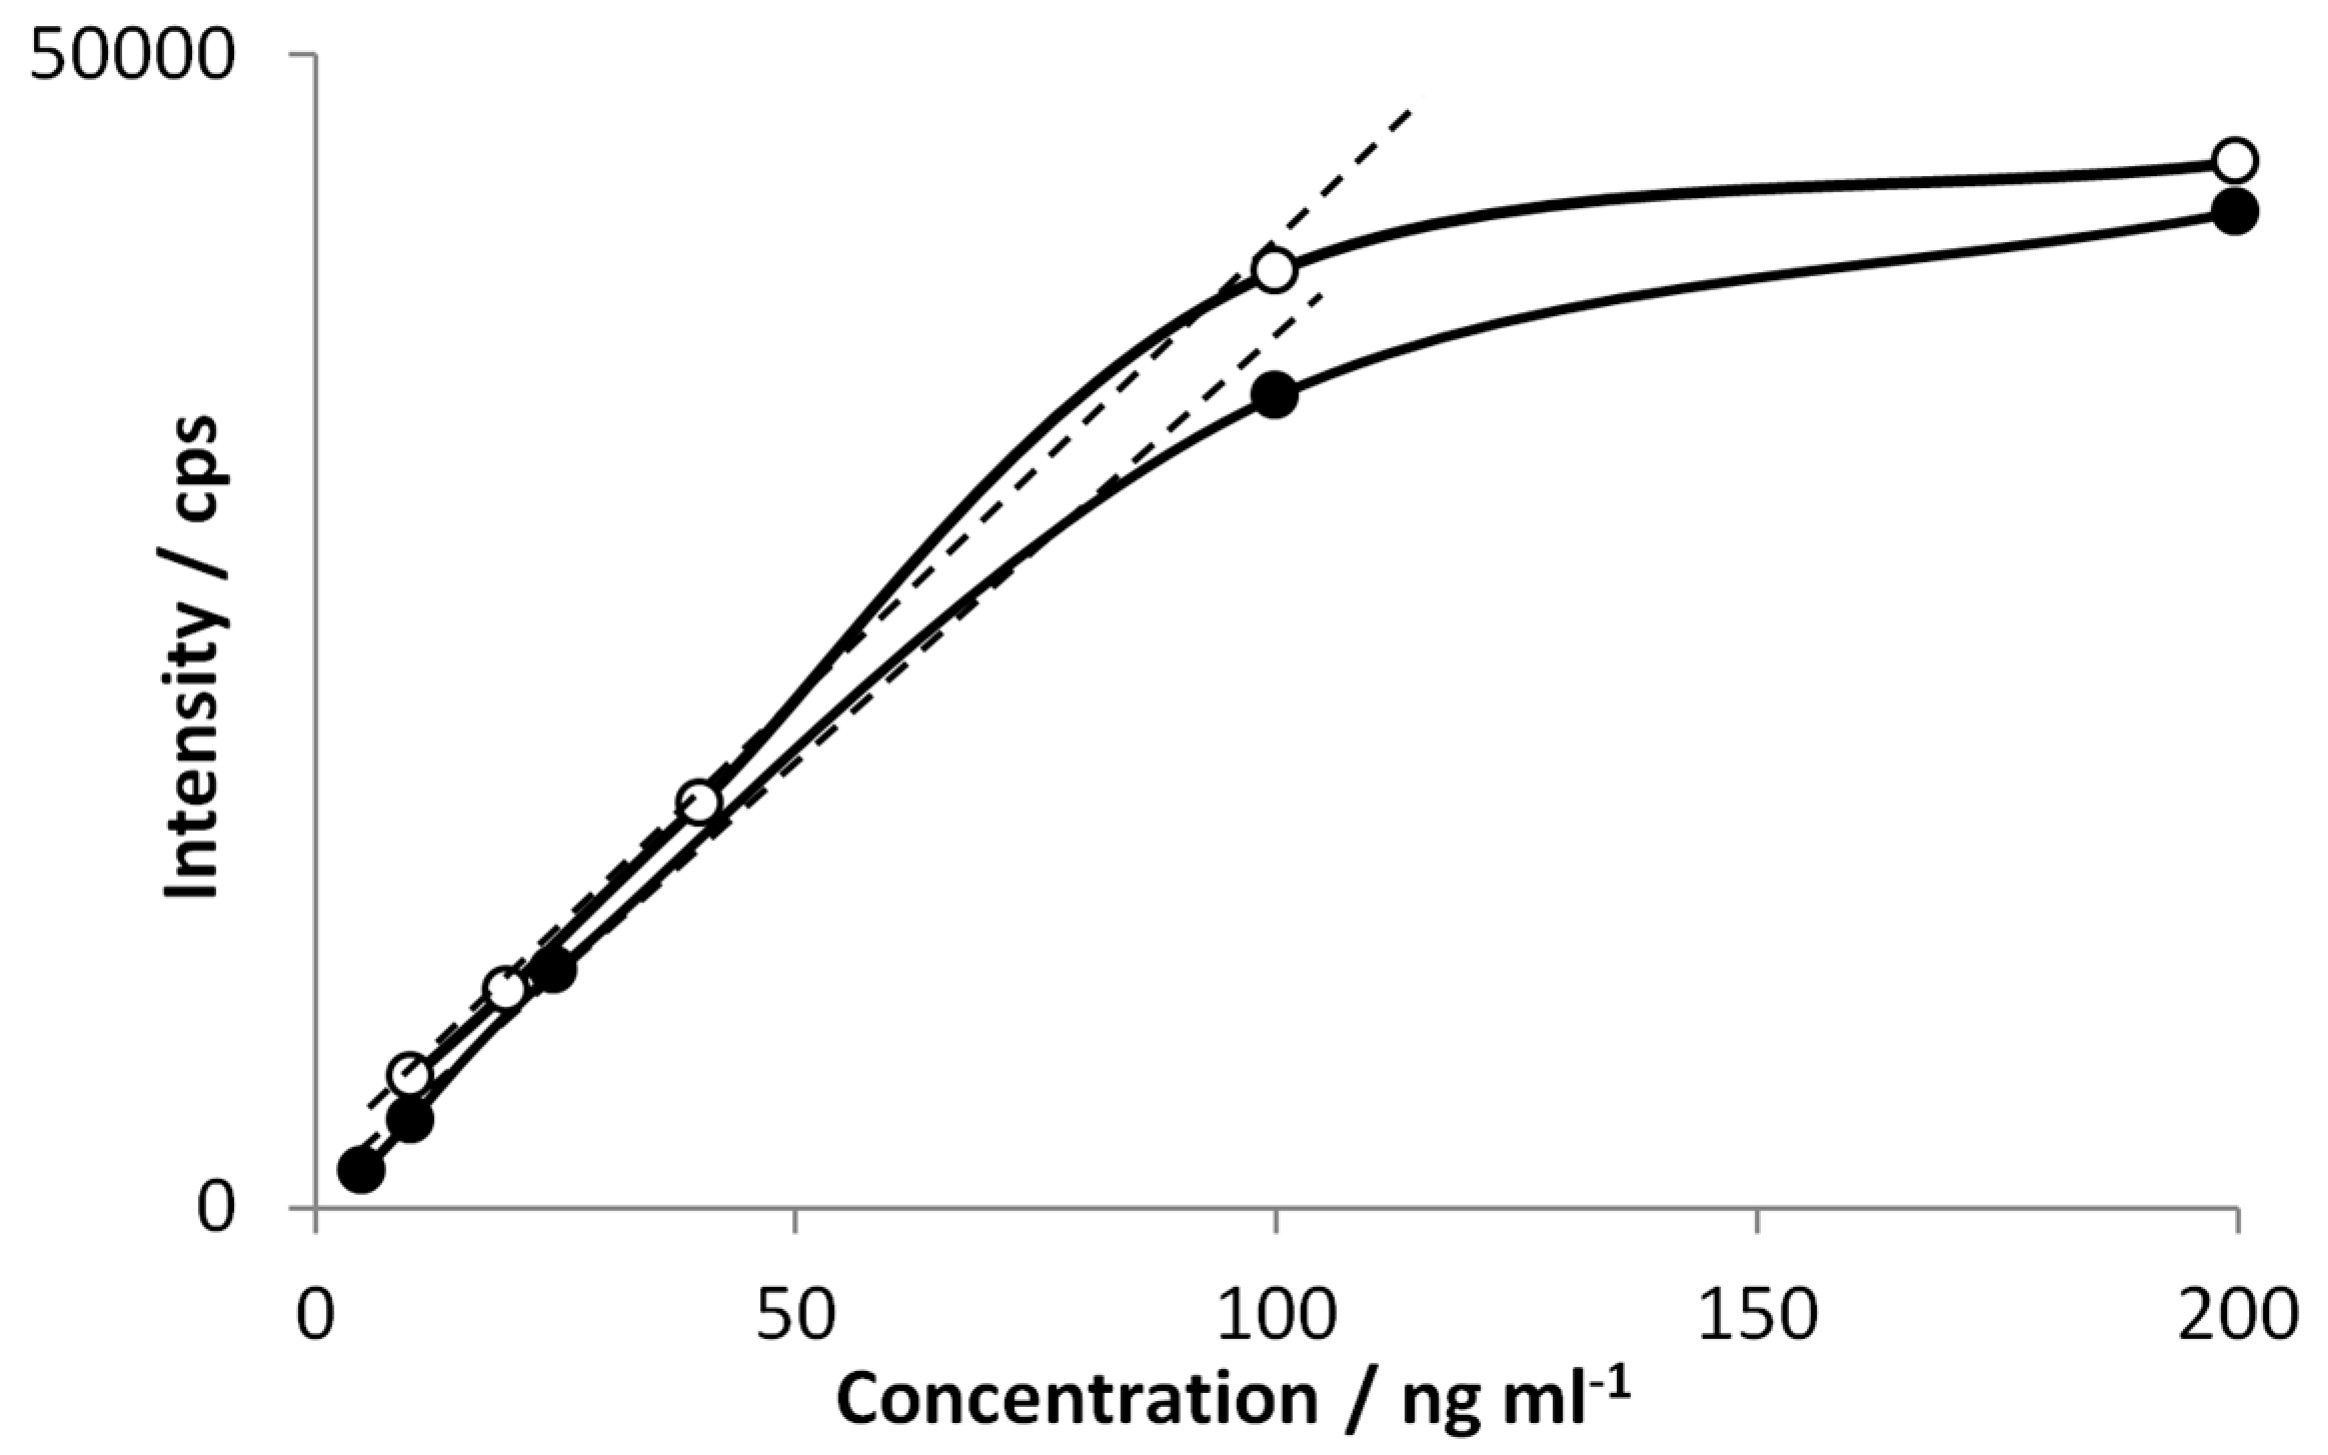
Basic analytical parameters has been calculated for dibutyltin as experimental conditions seem to be the most optimized for this compound so far. The signal intensity as a function of DBT concentration for two fiber coatings is sketched in
Figure 8.
Figure 8.
Linearity range estimated for PDMS (●) and Carboxen/PDMS fiber (○).
Figure 8.
Linearity range estimated for PDMS (●) and Carboxen/PDMS fiber (○).
This calibration function is based on peak height measurements since peak area dependence turned out to be not linear. Upper concentration limit of linearity for both fiber coatings is approximately close to 100 ng mL
−1. This means that the fibers capacity is reached for this amount of analytes and leads to the conclusion that upper limit of linearity is defined rather by the fiber properties than by the performance of the detection system. For all analyzed butyltin compounds limits of detection has been calculated (
LOD = 3σblank / s where
σblank is blank signal standard deviation and
s is method sensitivity) and were in respect to tin 278 pg mL
−1, 106 pg mL
−1, 235 pg mL
−1 for MBT, DBT and TBT, respectively. Despite big difference in extraction efficiency between MBT and TBT LODs are in the same range. Generally, for all LOD calculations peak height was used as analytical signal, which was actually similar for both compounds. However, when comparing MBT and TBT peak area at the same concentrations the second one characterizes much bigger value. That is why further system optimization must be performed in order to make TBT signal more sharp. Presented limits of detection are higher than those obtained by Botana
et al. [
4], which were in the range of 1–5 pg mL
−1. Significant decrease in sensitivity comparing to mentioned results can be explained by the use of miniature CCD-based spectrometer which obviously cannot match the performance of lab-standing spectrometers. Another factor is also a relatively low excitation efficiency of the DP source comparing with MIP source commonly used in atomic emission detectors. This implies the need of further improvement in developing small-sized portable and low-cost analyzer. Nevertheless, the limits of detection obtained in this study are fairly low to make promise for future study.


