

Association between Physical Fitness and Low Back Pain: The Pepe Cross-Sectional Study


Abstract
:1. Introduction
2. Materials and Methods
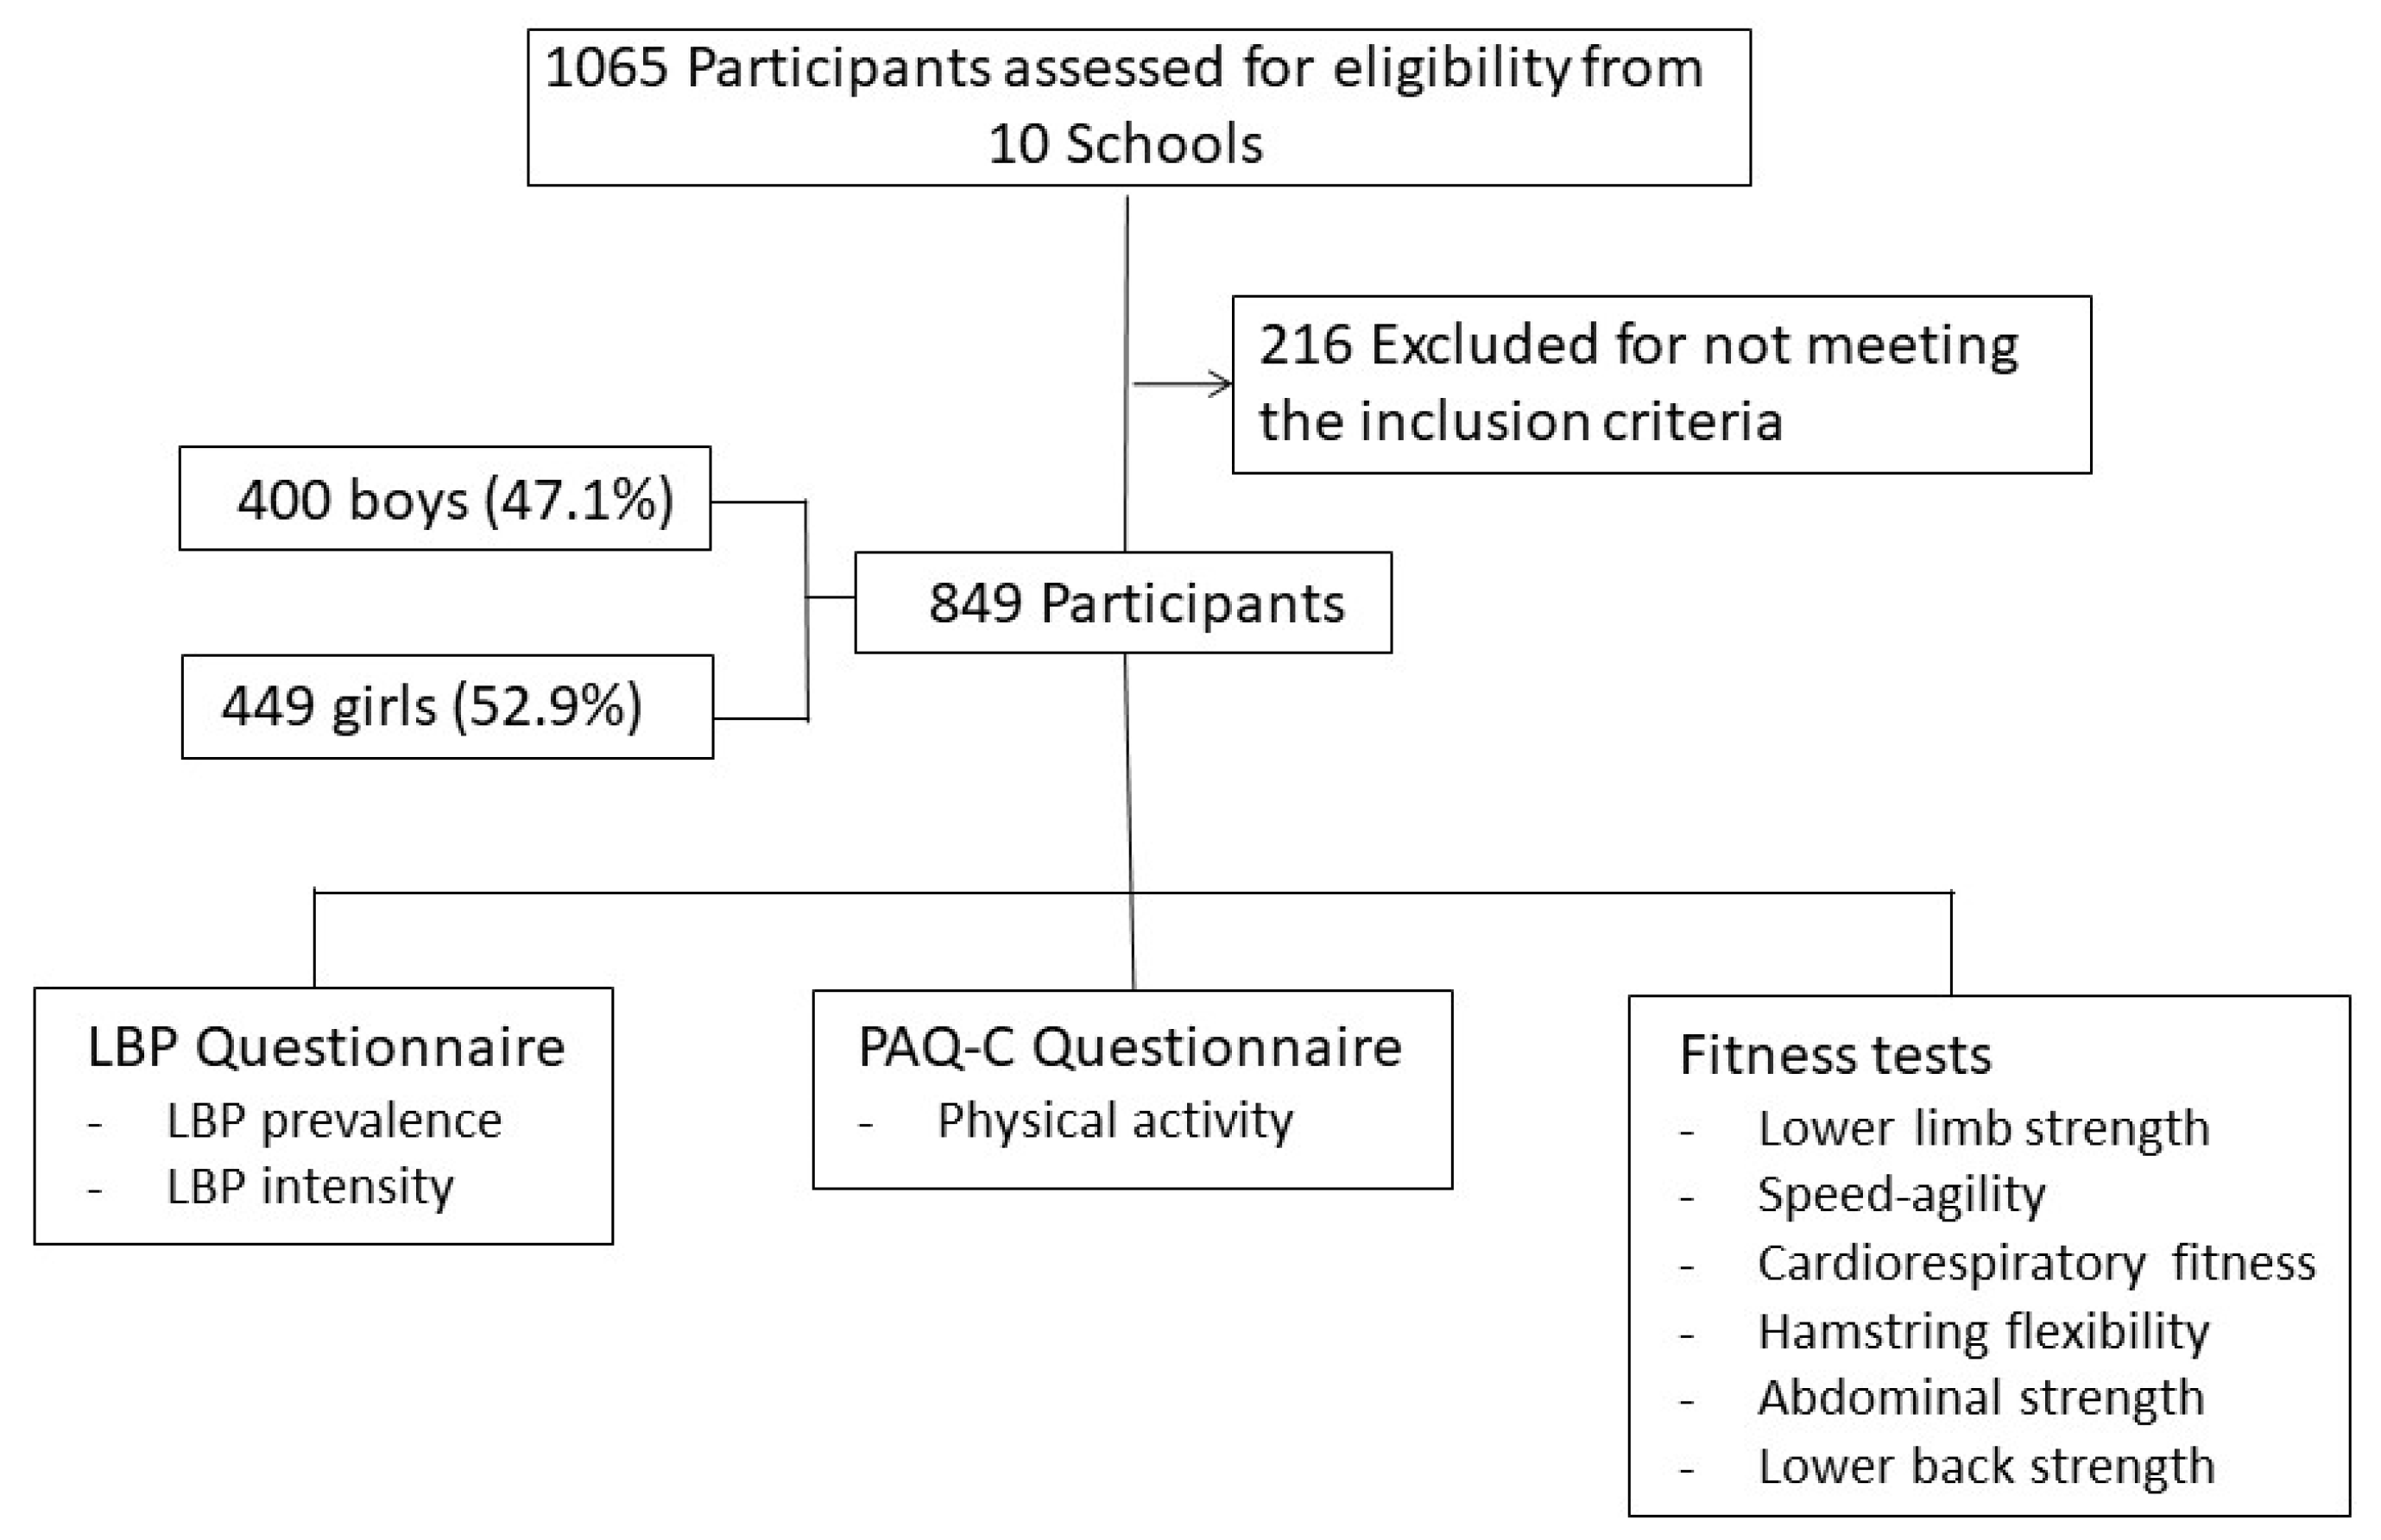
2.1. Participants
2.2. Selection Criteria
2.3. Instruments
2.4. Procedure
2.5. Statistical Analysis
3. Results
4. Discussion
5. Conclusions
Author Contributions
Funding
Institutional Review Board Statement
Informed Consent Statement
Data Availability Statement
Conflicts of Interest
References
- Kędra, A.; Plandowska, M.; Kędra, P.; Czaprowski, D. Non-specific low back pain: Cross-sectional study of 11,423 children and youth and the association with the perception of heaviness in carrying of schoolbags. PeerJ 2021, 9, e11220. [Google Scholar] [CrossRef] [PubMed]
- Vidal-Conti, J.; Borràs, P.; Palou, P.; Muntaner-Mas, A. Prevalence of Low Back Pain among School-Aged Children between 10 and 12 Years. Available online: https://www.mdpi.com/1346996 (accessed on 17 December 2021).
- Miñana-Signes, V.; Monfort-Pañego, M.; Bosh-Bivià, A.H.; Noll, M. Prevalence of low back pain among primary school students from the city of Valencia (Spain). Healthcare 2021, 9, 270. [Google Scholar] [CrossRef] [PubMed]
- Hoy, D.; March, L.; Brooks, P.; Blyth, F.; Woolf, A.; Bain, C.; Williams, G.; Smith, E.; Vos, T.; Barendregt, J.; et al. The global burden of low back pain: Estimates from the Global Burden of Disease 2010 study. Ann. Rheum. Dis. 2014, 73, 968–974. [Google Scholar] [CrossRef] [PubMed]
- Rezapur-Shahkolai, F.; Gheysvandi, E.; Tapak, L.; Dianat, I.; Karimi-Shahanjarini, A.; Heidarimoghadam, R. Risk factors for low back pain among elementary school students in western Iran using penalized logistic regression. Epidemiol. Health 2020, 42, e2020039. [Google Scholar] [CrossRef]
- Klyne, D.M.; Hall, L.M.; Nicholas, M.K.; Hodges, P.W. Risk factors for low back pain outcome: Does it matter when they are measured? Eur. J. Pain 2022, 26, 835–854. [Google Scholar] [CrossRef]
- Minghelli, B. Musculoskeletal spine pain in adolescents: Epidemiology of non-specific neck and low back pain and risk factors. J. Orthop. Sci. 2020, 25, 776–780. [Google Scholar] [CrossRef]
- Dantas, M.G.B.; Aquino, A.N.; Correia, H.J.; Ferreira, K.P.; Nascimento, B.; Silva, L.S.; Da Silva, A.; Penha, P.J.; João, S. Prevalence of Back Pain and Idiopathic Scoliosis in Adolescents From the Semiarid Region of Brazil: A Cross-sectional Study. J. Chiropr. Med. 2021, 20, 97–107. [Google Scholar] [CrossRef]
- Kovacs, F.M.; Gestoso, M.; Gil Del Real, M.T.; López, J.; Mufraggi, N.; Ignacio Méndez, J. Risk factors for non-specific low back pain in schoolchildren and their parents: A population based study. Pain 2003, 103, 259–268. [Google Scholar] [CrossRef]
- Auvinen, J.; Tammelin, T.; Taimela, S.; Zitting, P.; Karppinen, J. Associations of physical activity and inactivity with low back pain in adolescents. Scand. J. Med. Sci. Sports 2008, 18, 188–194. [Google Scholar] [CrossRef]
- Fritz, J.M.; Clifford, S.N. Low back pain in adolescents: A comparison of clinical outcomes in sports participants and nonparticipants. J. Athl. Train. 2010, 45, 61–66. [Google Scholar] [CrossRef] [Green Version]
- Potthoff, T.; de Bruin, E.D.; Rosser, S.; Humphreys, B.K.; Wirth, B. A systematic review on quantifiable physical risk factors for non-specific adolescent low back pain. J. Pediatr. Rehabil. Med. 2018, 11, 79–94. [Google Scholar] [CrossRef] [PubMed]
- García-Hermoso, A.; Ramírez-Campillo, R.; Izquierdo, M. Is Muscular Fitness Associated with Future Health Benefits in Children and Adolescents? A Systematic Review and Meta-Analysis of Longitudinal Studies. Sports Med. 2019, 49, 1079–1094. [Google Scholar] [CrossRef] [PubMed]
- Zhu, W.; Mahar, M.T.; Welk, G.J.; Going, S.B.; Cureton, K.J. Approaches for development of criterion-referenced standards in health-related youth fitness tests. Am. J. Prev. Med. 2011, 41, S68–S76. [Google Scholar] [CrossRef] [PubMed]
- Bo Andersen, L.; Wedderkopp, N.; Leboeuf-Yde, C. Association between back pain and physical fitness in adolescents. Spine 2006, 31, 1740–1744. [Google Scholar] [CrossRef] [PubMed]
- Fühner, T.; Kliegl, R.; Arntz, F.; Kriemler, S.; Granacher, U. An Update on Secular Trends in Physical Fitness of Children and Adolescents from 1972 to 2015: A Systematic Review. Sports Med. 2021, 51, 303–320. [Google Scholar] [CrossRef]
- Bull, F.C.; Al-Ansari, S.S.; Biddle, S.; Borodulin, K.; Buman, M.P.; Cardon, G.; Carty, C.; Chaput, J.P.; Chastin, S.; Chou, R.; et al. World Health Organization 2020 guidelines on physical activity and sedentary behaviour. Br. J. Sports Med. 2020, 54, 1451–1462. [Google Scholar] [CrossRef]
- Borras, P.A.; Vidal-Conti, J. An on-line school-based randomised controlled trial to prevent non-specific low back pain in children. Health Educ. J. 2022, 81, 352–362. [Google Scholar] [CrossRef]
- Palou, P.; Kovacs, F.M.; Vidal, J.; Gili, M.; Borràs, P.A.; Gestoso, M.; Ponseti, X. Validation of a questionnaire to determine risk factors for back pain in 10–12 year-old school children. Gazz. Med. Ital. Arch. Sci. Med. 2010, 169, 199–205. [Google Scholar]
- Kowalski, K.; Crocker, P.; Donen, R.; Honours, B. The Physical Activity Questionnaire for Older Children (PAQ-C) and Adolescents (PAQ-A) Manual. Available online: https://www.researchgate.net/publication/228441462 (accessed on 1 September 2022).
- Martínez-Gómez, D.; Martínez-De-Haro, V.; Pozo, T.; Welk, G.J.; Villagra, A.; Calle, M.E.; Marcos, A.; Veiga, O.L. Reliability and validity of the PAQ-A questionnaire to assess physical activity in Spanish adolescents. Rev. Esp. De Salud Publica 2009, 83, 427–439. [Google Scholar] [CrossRef]
- Ruiz, J.; España-Romero, V.; Castro-Piñero, J.; Artero, E.; Ortega, F.; Cuenca-García, M.; Jiménez-Pavón, D.; Chillón, P.; Girela-Rejón, M.; Mora, J.; et al. ALPHA-fitness test battery: Health-related field-based fitness tests assessment in children and adolescents. Nutr. Hosp. 2011, 26, 483–490. [Google Scholar]
- Castro-Pinero, J.; Chillon, P.; Ortega, F.B.; Montesinos, J.L.; Sjostrom, M.; Ruiz, J.R. Criterion-related validity of sit-and-reach and modified sit-and-reach test for estimating hamstring flexibility in children and adolescents aged 6-17 years. Int. J. Sports Med. 2009, 30, 658–662. [Google Scholar] [CrossRef] [PubMed]
- Allen, B.A.; Hannon, J.C.; Burns, R.D.; Williams, S.M. Effect of a core conditioning intervention on tests of trunk muscular endurance in school-aged children. J. Strength Cond. Res. 2014, 28, 2063–2070. [Google Scholar] [CrossRef] [PubMed]
- Biering-Sorensen, F. Physical measurements as risk indicators for low-back trouble over a one-year period. Spine 1984, 9, 106–119. [Google Scholar] [CrossRef] [PubMed]
- Fjørtoft, I.; Pedersen, A.V.; Sigmundsson, H.; Vereijken, B. Measuring physical fitness in children who are 5 to 12 years old with a test battery that is functional and easy to administer. Phys. Ther. 2011, 91, 1087–1095. [Google Scholar] [CrossRef] [PubMed]
- Lardon, A.; Leboeuf-Yde, C.; le Scanff, C. Is back pain during childhood or adolescence associated with muscle strength, muscle endurance or aerobic capacity: Three systematic literature reviews with one meta-analysis. Chiropr. Man. Ther. 2015, 23, 21. [Google Scholar] [CrossRef]
- Constantino Coledam, D.H.; Aires de Arruda, G.; Cantieri, F.P.; Gomes Ribeiro, E.A. Muscular fitness is associated with spinal pain among young people: A cross-sectional exploratory study. J. Bodyw. Mov. Ther. 2021, 26, 174–179. [Google Scholar] [CrossRef]
- Astfalck, R.G.; O’Sullivan, P.B.; Straker, L.M.; Smith, A.J. A detailed characterisation of pain, disability, physical and psychological features of a small group of adolescents with non-specific chronic low back pain. Man. Ther. 2010, 15, 240–247. [Google Scholar] [CrossRef]
- Bernard, J.C.; Bard, R.; Pujol, A.; Combey, A.; Boussard, D.; Begue, C.; Salghetti, A.M. Muscle assessment in healthy teenagers, Comparison with teenagers with low back pain. Ann. De Readapt. Et De Med. Phys. Rev. Sci. De La Soc. Fr. De Reeduc. Fonct. De Readapt. Et De Med. Phys. 2008, 51, 274–283. [Google Scholar] [CrossRef]
- Jones, M.A.; Stratton, G.; Reilly, T.; Unnithan, V.B. Biological risk indicators for recurrent non-specific low back pain in adolescents. Br. J. Sports Med. 2005, 39, 137–140. [Google Scholar] [CrossRef]
- Hayden, J.; van Tulder, M.W.; Malmivaara, A.; Koes, B.W. Exercise therapy for treatment of non-specific low back pain. Cochrane Database Syst. Rev. 2005, CD000335. [Google Scholar] [CrossRef]
- Perry, M.; Straker, L.; O’sullivan, P.; Smith, A.; Hands, B. Fitness, motor competence, and body composition are weakly associated with adolescent back pain. J. Orthop. Sports Phys. Ther. 2009, 39, 439–449. [Google Scholar] [CrossRef] [PubMed]
- Hides, J.A.; Jull, G.A.; Richardson, C.A. Long-term effects of specific stabilizing exercises for first-episode low back pain. Spine 2001, 26, E243–E248. [Google Scholar] [CrossRef] [PubMed] [Green Version]
- Behm, D.G.; Drinkwater, E.J.; Willardson, J.M.; Cowley, P.M. Canadian Society for Exercise Physiology position stand: The use of instability to train the core in athletic and nonathletic conditioning. Appl. Physiol. Nutr. Metab. 2010, 35, 109–112. [Google Scholar] [CrossRef] [PubMed]
- Cho, H.Y.; Kim, E.H.; Kim, J.; Kim, E.H. Effects of the CORE Exercise Program on Pain and Active Range of Motion in Patients with Chronic Low Back Pain. J. Phys. Ther. Sci. 2014, 26, 1237–1240. [Google Scholar] [CrossRef] [PubMed]
- Amit, K.; Manish, G.; Taruna, K. Effect of Trunk Muscles Stabilization Exercises and General Exercises on Pain in Recurrent Non Specific Low Back Ache. Int. Res. J. Med. Sci. 2013, 1, 23–26. [Google Scholar]
- Mayer, F.; Arampatzis, A.; Banzer, W.; Beck, H.; Brüggemann, G.P.; Hasenbring, M.; Kellmann, M.; Kleinert, J.; Schiltenwolf, M.; Schmidt, H.; et al. Medicine in spine exercise [mispex]—A national research network to evaluate back pain. Dtsch. Z. Fur Sportmed. 2018, 69, 229–234. [Google Scholar] [CrossRef]
- Carson, V.; Hunter, S.; Kuzik, N.; Gray, C.E.; Poitras, V.J.; Chaput, J.P.; Saunders, T.J.; Katzmarzyk, P.T.; Okely, A.D.; Connor Gorber, S.; et al. Systematic review of sedentary behaviour and health indicators in school-aged children and youth: An update. Appl. Physiol. Nutr. Metab. 2016, 41, S240–S265. [Google Scholar] [CrossRef]
- Padilla-Moledo, C.; Fernández-Santos, J.D.R.; Izquierdo-Gómez, R.; Esteban-Cornejo, I.; Rio-Cozar, P.; Carbonell-Baeza, A.; Castro-Piñero, J. Physical Fitness and Self-Rated Health in Children and Adolescents: Cross-Sectional and Longitudinal Study. Int. J. Env. Res. Public Health 2020, 17, 2413. [Google Scholar] [CrossRef]
- Todendi, P.F.; Brand, C.; Silveira, J.F.D.C.; Gaya, A.R.; Agostinis-Sobrinho, C.; Fiegenbaum, M.; Burns, R.D.; Valim, A.R. de M.; Reuter, C.P. Physical fitness attenuates the genetic predisposition to obesity in children and adolescents. Scand. J. Med. Sci. Sports 2021, 31, 894–902. [Google Scholar] [CrossRef]
- Alzahrani, H.; Mackey, M.; Stamatakis, E.; Zadro, J.R.; Shirley, D. The association between physical activity and low back pain: A systematic review and meta-analysis of observational studies. Sci. Rep. 2019, 9, 8244. [Google Scholar] [CrossRef]
- Gordon, R.; Bloxham, S. A Systematic Review of the Effects of Exercise and Physical Activity on Non-Specific Chronic Low Back Pain. Healthcare 2016, 4, 22. [Google Scholar] [CrossRef] [PubMed]
- Heneweer, H.; Staes, F.; Aufdemkampe, G.; van Rijn, M.; Vanhees, L. Physical activity and low back pain: A systematic review of recent literature. Eur. Spine J. 2011, 20, 826–845. [Google Scholar] [CrossRef]
- Sato, T.; Ito, T.; Hirano, T.; Morita, O.; Kikuchi, R.; Endo, N.; Tanabe, N. Low back pain in childhood and adolescence: Assessment of sports activities. Eur. Spine J. 2011, 20, 94–99. [Google Scholar] [CrossRef] [PubMed] [Green Version]
- Kikuchi, R.; Hirano, T.; Watanabe, K.; Sano, A.; Sato, T.; Ito, T.; Endo, N.; Tanabe, N. Gender differences in the prevalence of low back pain associated with sports activities in children and adolescents: A six-year annual survey of a birth cohort in Niigata City, Japan. BMC Musculoskelet. Disord. 2019, 20, 327. [Google Scholar] [CrossRef] [PubMed]
- Guddal, M.H.; Stensland, S.Ø.; Småstuen, M.C.; Johnsen, M.B.; Zwart, J.A.; Storheim, K. Physical Activity Level and Sport Participation in Relation to Musculoskeletal Pain in a Population-Based Study of Adolescents: The Young-HUNT Study. Orthop. J. Sports Med. 2017, 5, 2325967116685543. [Google Scholar] [CrossRef] [PubMed]
- Wedderkopp, N.; Kjaer, P.; Hestbaek, L.; Korsholm, L.; Leboeuf-Yde, C. High-level physical activity in childhood seems to protect against low back pain in early adolescence. Spine J. 2009, 9, 134–141. [Google Scholar] [CrossRef]
- Sitthipornvorakul, E.; Janwantanakul, P.; Purepong, N.; Pensri, P.; van der Beek, A.J. The association between physical activity and neck and low back pain: A systematic review. Eur. Spine J. 2011, 20, 677–689. [Google Scholar] [CrossRef]
- Aartun, E.; Hartvigsen, J.; Boyle, E.; Hestbaek, E. No associations between objectively measured physical activity and spinal pain in 11-15-year-old Danes. Eur. J. Pain 2016, 20, 447–457. [Google Scholar] [CrossRef]
- Ruiz, J.R.; Ortega, F.B.; Rizzo, N.S.; Villa, I.; Hurtig-Wennlöf, A.; Oja, L.; Sjöström, M. High cardiovascular fitness is associated with low metabolic risk score in children: The European Youth Heart Study. Pediatr. Res. 2007, 61, 350–355. [Google Scholar] [CrossRef]
- Noll, M.; Kjaer, P.; Mendonça, C.R.; Wedderkopp, N. Motor performance and back pain in children and adolescents: A systematic review. Eur. J. Pain 2022, 26, 77–102. [Google Scholar] [CrossRef]

| Lifetime Prevalence of Low Back Pain | ||||
|---|---|---|---|---|
| Total n | Yes | No | p-Value | |
| Age, years | 797 | 11.3 (0.69) | 11.2 (0.67) | 0.038 |
| Women, n (%) | 443 (52.9) | 231 (59.8) | 212 (47.0) | <0.001 |
| Men, n (%) | 394 (47.1) | 155 (40.2) | 239 (53.0) | <0.001 |
| Anthropometric measures | ||||
| Weight (kg) | 770 | 43.0 (10.4) | 41.6 (9.24) | 0.051 |
| Height (cm) | 749 | 151 (9.19) | 149 (8.70) | 0.017 |
| BMI (kg/m2) | 708 | 18.9 (3.61) | 18.7 (3.56) | 0.392 |
| Physical Activity Habits | ||||
| PAQ-A-Score | 837 | 2.98 (0.63) | 3.08 (0.64) | 0.019 |
| Physical Fitness | ||||
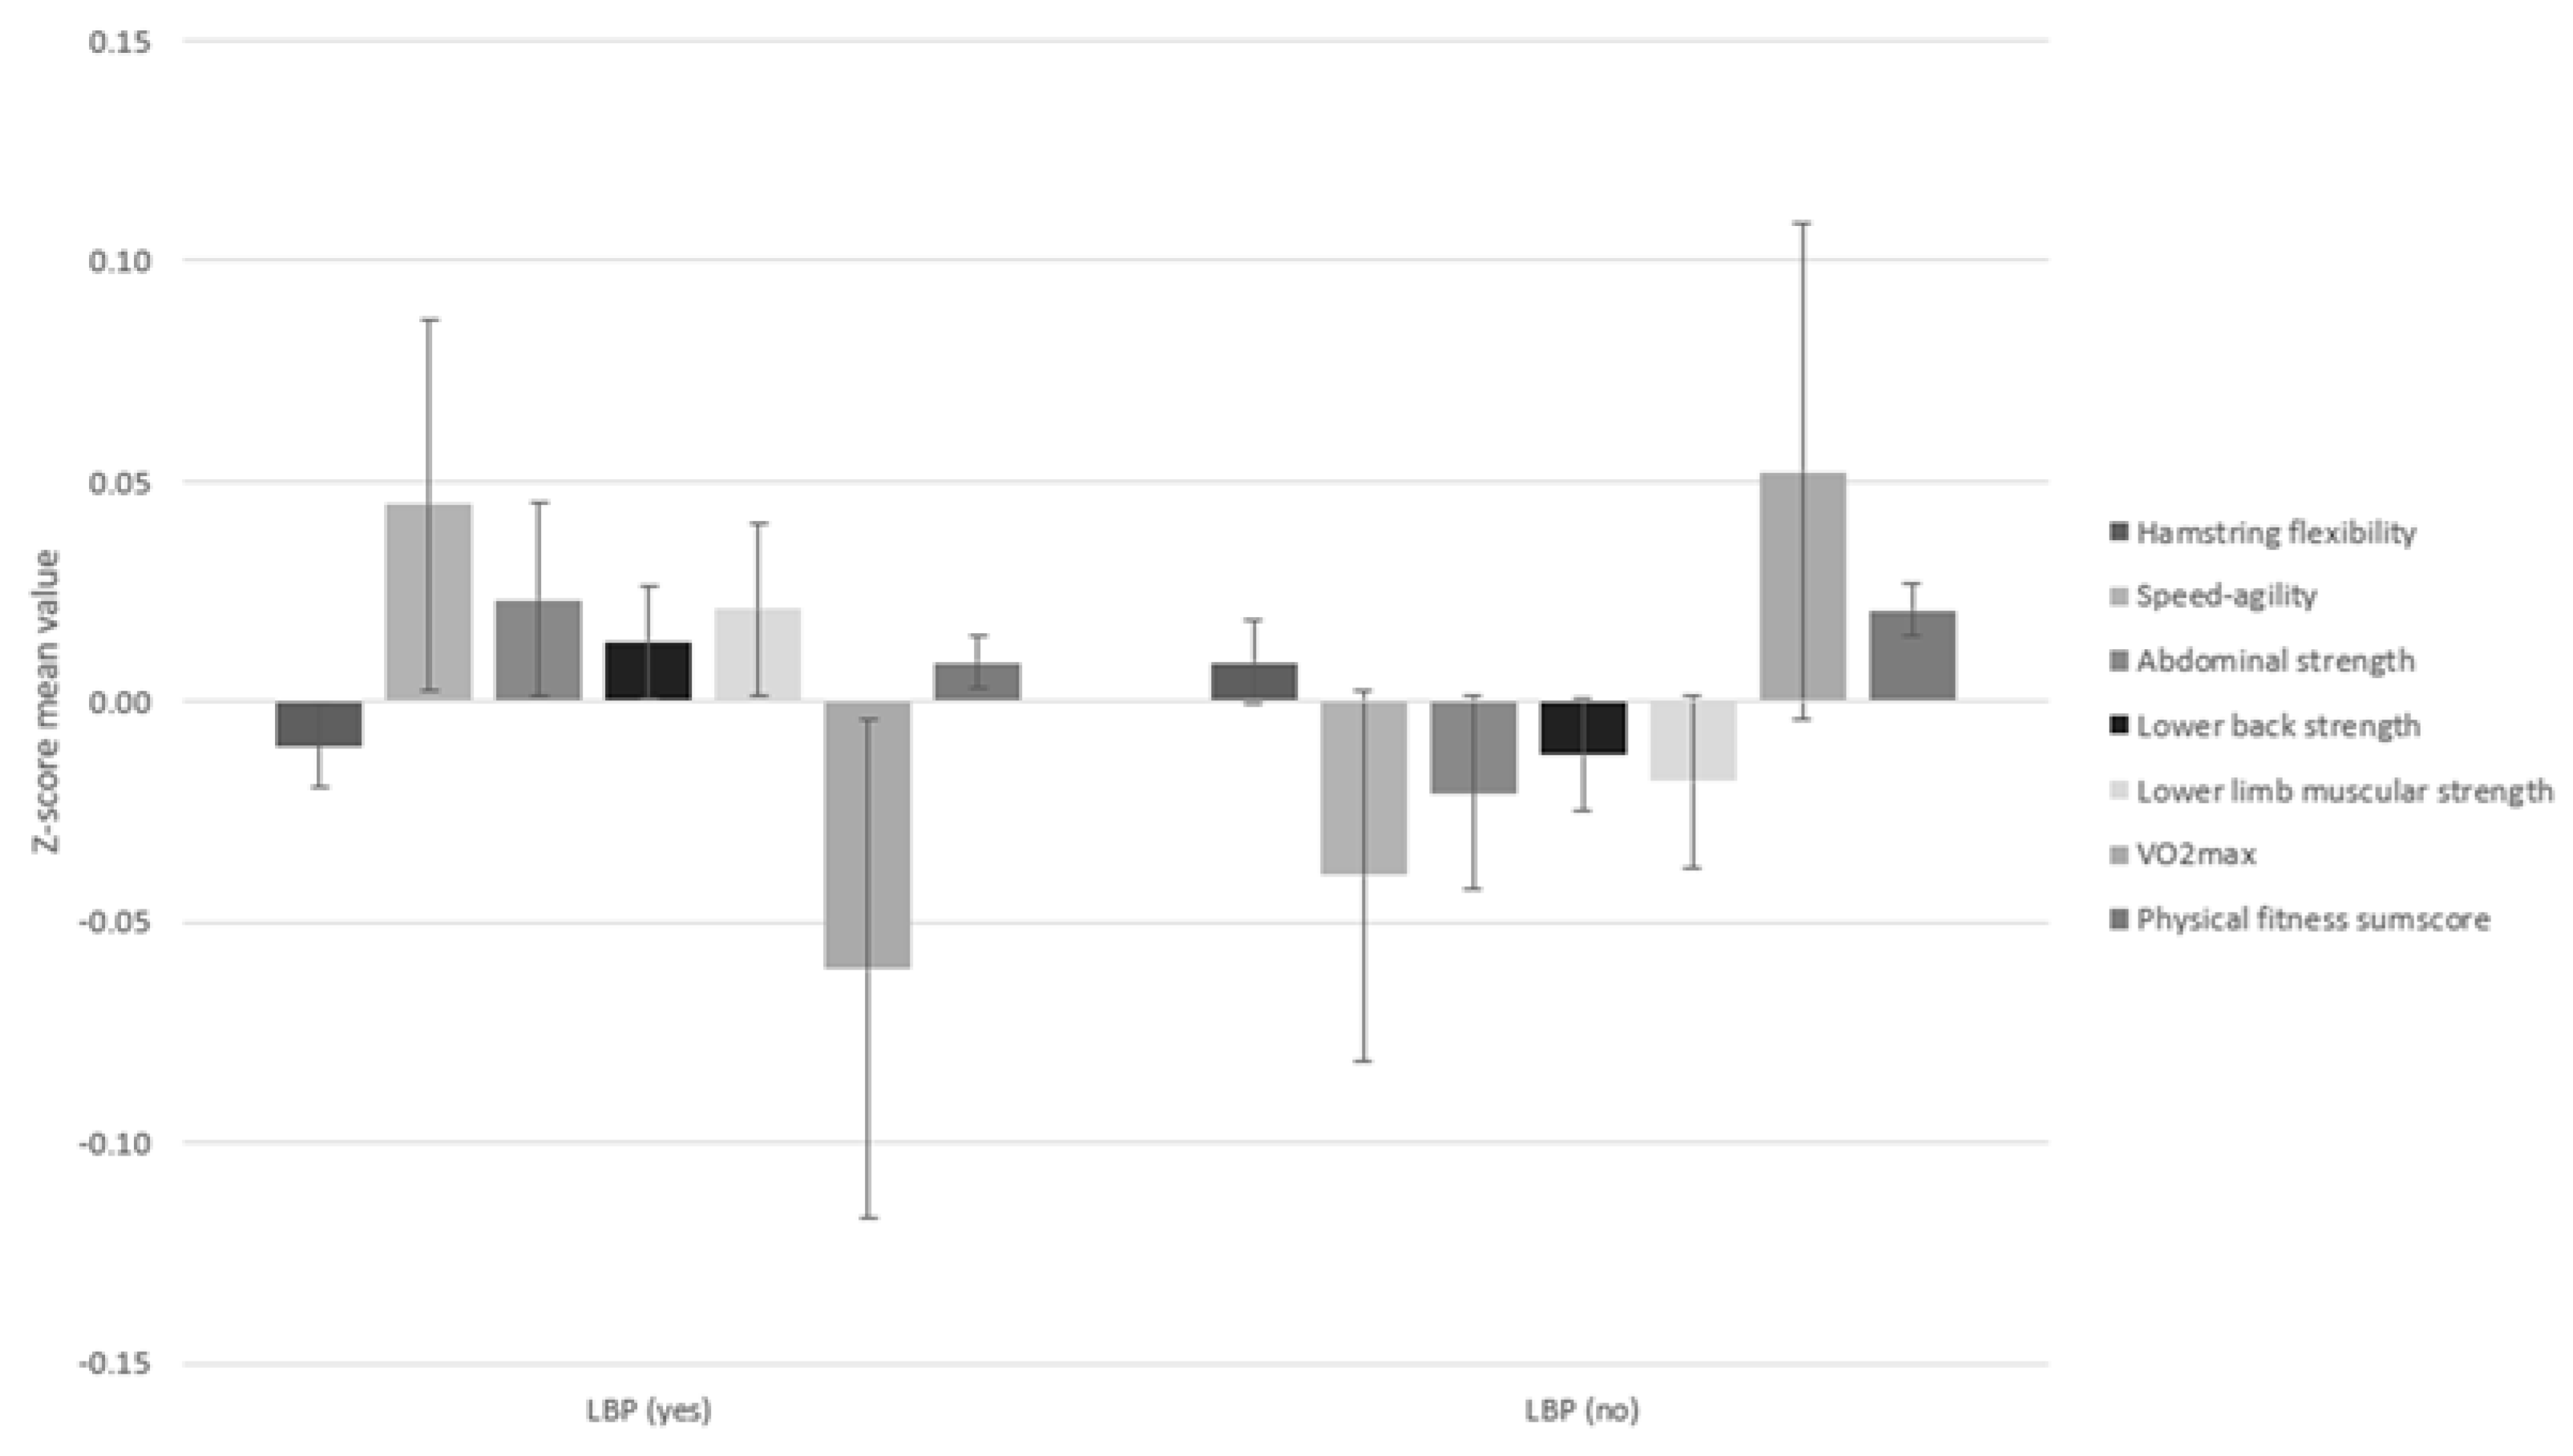
| Hamstring flexibility 1 | 706 | −1.40 (9.09) | −1.22 (9.68) | 0.801 |
| Speed-agility 2 | 713 | 22.9 (102) | 16.1 (56.3) | 0.262 |
| Abdominal strength 3 | 706 | 107 (78.7) | 103 (76.6) | 0.561 |
| Lower back strength 4 | 713 | 103 (67.5) | 101 (71.6) | 0.733 |
| Lower limb muscular strength 5 | 673 | 140 (26.8) | 139 (26.1) | 0.614 |
| VO2 Max 6 | 832 | 42.1 (6.23) | 42.8 (7.26) | 0.104 |
| Exposures | Outcome (Intensity of Low Back Pain) | Outcome (Low Back Pain Prevalence) | ||
|---|---|---|---|---|
| SC β (95% CI) | p-Value | SC β (95% CI) | p-Value | |
| Anthropometric measures | ||||
| Weight (kg) | −0.00 (−0.02; 0.02) | 0.961 | 0.03 (−0.00; 0.01) | 0.404 |
| Height (cm) | 0.00 (−0.02; 0.02) | 0.977 | 0.07 (0.00; 0.02) | 0.065 |
| BMI (kg/m2) | 0.00 (−0.05; 0.05) | 0.937 | −0.00 (−0.02; 0.02) | 0.930 |
| Physical Activity Habits | ||||
| PAQ-A-score | −0.04 (−0.43; 0.11) | 0.246 | −0.06 (−0.20; 0.01) | 0.078 |
| Physical Fitness | ||||
| Hamstring flexibility | −0.02 (−0.23; 0.14) | 0.635 | −0.00 (−0.08; 0.07) | 0.911 |
| Speed-agility | 0.06 (−0.04; 0.30) | 0.135 | 0.06 (−0.02; 0.12) | 0.151 |
| Abdominal strength | −0.01 (−0.20; 0.17) | 0.880 | 0.02 (−0.05; 0.09) | 0.571 |
| Lower Back strength | −0.03 (−0.25; −0.12) | 0.495 | 0.04 (−0.04; 0.10) | 0.359 |
| Lower limb muscular strength | −0.04 (−0.30; 0.10) | 0.311 | 0.01 (−0.06; 0.09) | 0.747 |
| VO2Max | −0.09 (−0.47; −0.04) | 0.022 | −0.05 (−0.15; 0.02) | 0.142 |
| Fitness Score 1 | −0.04 (−0.69; 0.27) | 0.394 | −0.01 (−0.19; 0.17) | 0.889 |
| Outcome Pain Frequency | ||||||||
|---|---|---|---|---|---|---|---|---|
| Exposures | LBP Ever (No) | p For Tend | LBP in the Last 7 Days (no) | p For Trend | LBP Today (no) | p for Trend | LBP in Bed (No) | p for Trend |
| Physical Activity Habits | ||||||||
| PAQ-A-score | 0.65 (0.49; 0.87) | 0.004 | 1.33 (0.94; 1.88) | 0.105 | 1.42 (0.87; 2.32) | 0.161 | 1.39 (0.91; 2.11) | 0.125 |
| Physical Fitness | ||||||||
| Hamstring flexibility | 0.84 (0.61; 1.17) | 0.300 | 1.03 (0.69; 1.52) | 0.900 | 1.31 (0.75; 2.27) | 0.342 | 1.77 (1.09; 2.86) | 0.020 |
| Speed-agility | 1.23 (0.87; 1.74) | 0.251 | 1.02 (0.67; 1.55) | 0.921 | 0.89 (0.50; 1.59) | 0.659 | 0.91 (0.54; 1.51) | 0.706 |
| Abdominal strength | 1.00 (0.71; 1.39) | 0.989 | 1.21 (0.81; 1.81) | 0.351 | 1.46 (0.84; 2.54) | 0.178 | 1.38 (0.85; 2.23) | 0.189 |
| Lower Back strength | 1.11 (0.78; 1.57) | 0.559 | 1.13 (0.75; 1.71) | 0.563 | 1.21 (0.69; 2.14) | 0.508 | 1.09 (0.67; 1.78) | 0.736 |
| Lower limb muscular strength | 0.98 (0.70; 1.38) | 0.906 | 1.35 (0.89; 2.06) | 0.155 | 1.36 (0.74; 2.48) | 0.322 | 1.30 (0.79; 2.14) | 0.305 |
| VO2Max | 0.89 (0.66; 1.20) | 0.434 | 1.25 (0.87; 1.80) | 0.228 | 1.12 (0.67; 1.87) | 0.656 | 1.56 (1.00; 2.42) | 0.049 |
Publisher’s Note: MDPI stays neutral with regard to jurisdictional claims in published maps and institutional affiliations. |
© 2022 by the authors. Licensee MDPI, Basel, Switzerland. This article is an open access article distributed under the terms and conditions of the Creative Commons Attribution (CC BY) license (https://creativecommons.org/licenses/by/4.0/).
Share and Cite
Galmés-Panadés, A.M.; Vidal-Conti, J. Association between Physical Fitness and Low Back Pain: The Pepe Cross-Sectional Study. Children 2022, 9, 1350. https://doi.org/10.3390/children9091350
Galmés-Panadés AM, Vidal-Conti J. Association between Physical Fitness and Low Back Pain: The Pepe Cross-Sectional Study. Children. 2022; 9(9):1350. https://doi.org/10.3390/children9091350
Chicago/Turabian StyleGalmés-Panadés, Aina M., and Josep Vidal-Conti. 2022. "Association between Physical Fitness and Low Back Pain: The Pepe Cross-Sectional Study" Children 9, no. 9: 1350. https://doi.org/10.3390/children9091350
APA StyleGalmés-Panadés, A. M., & Vidal-Conti, J. (2022). Association between Physical Fitness and Low Back Pain: The Pepe Cross-Sectional Study. Children, 9(9), 1350. https://doi.org/10.3390/children9091350