
Bicycle Injury Prevention Education Using 360° Virtual Reality Experiences of Accidents and Computer-Based Activity

Abstract
1. Introduction
2. Materials and Methods
2.1. Study Design
2.2. Participants
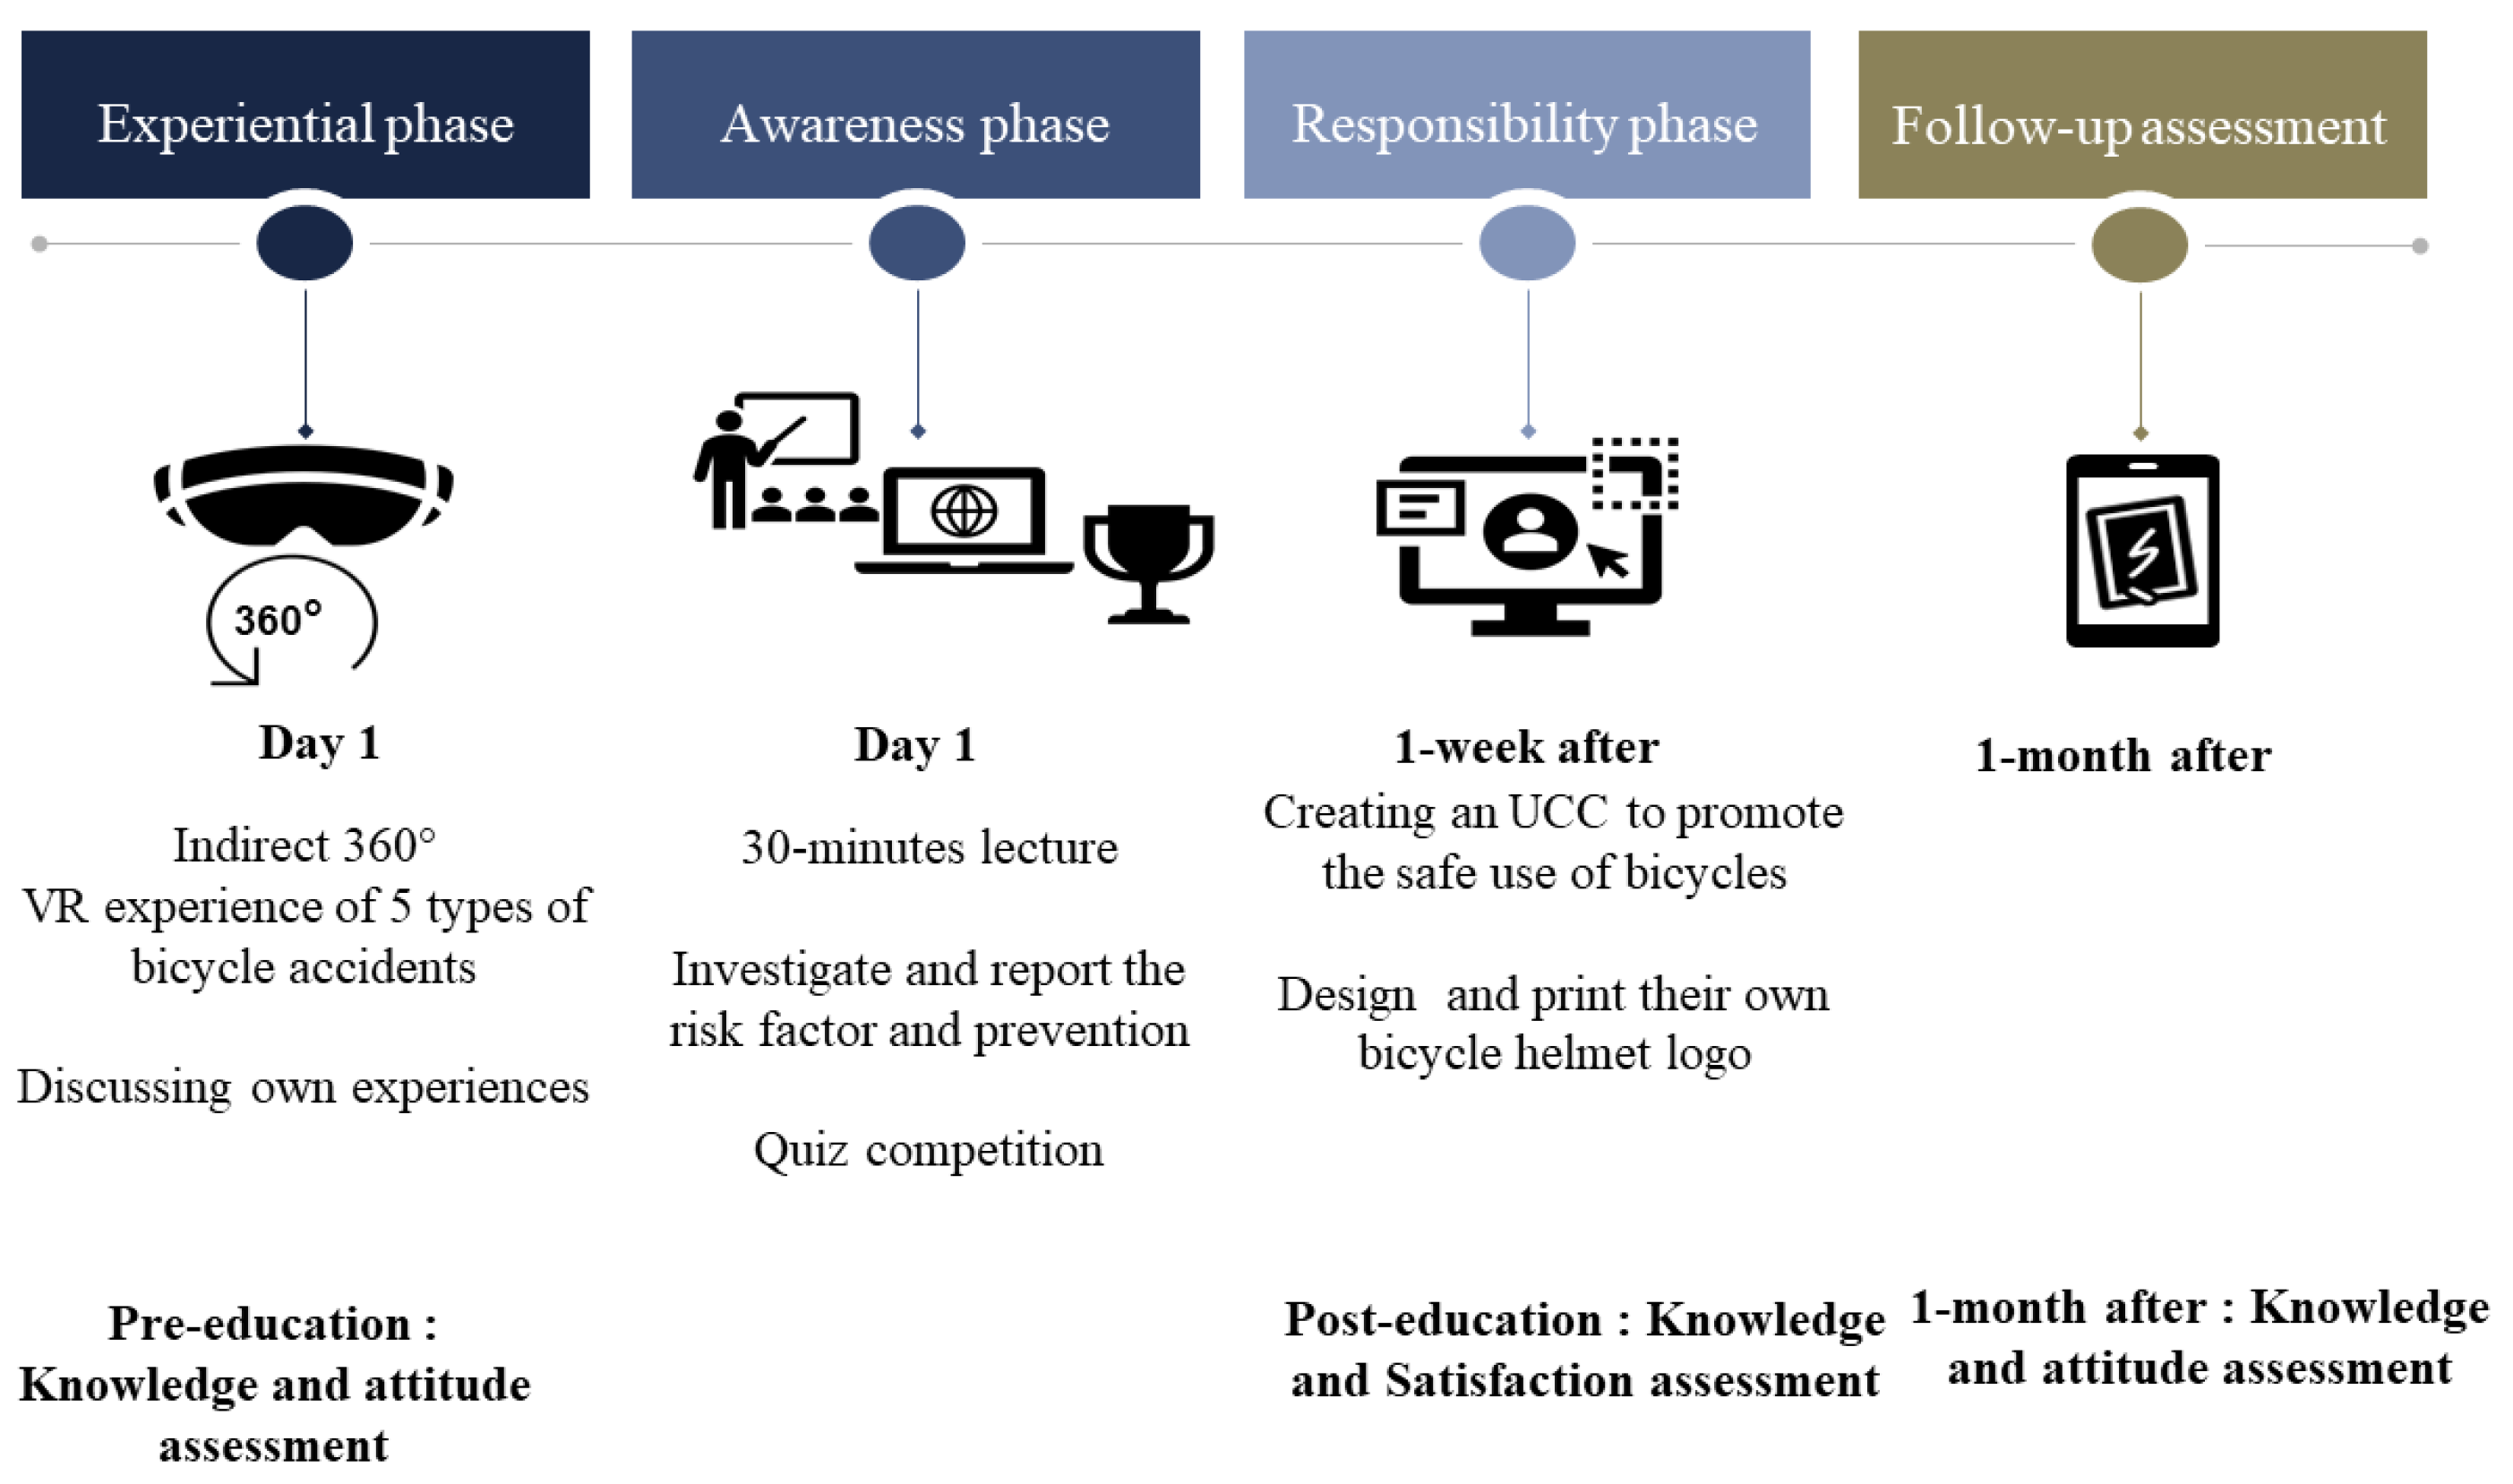
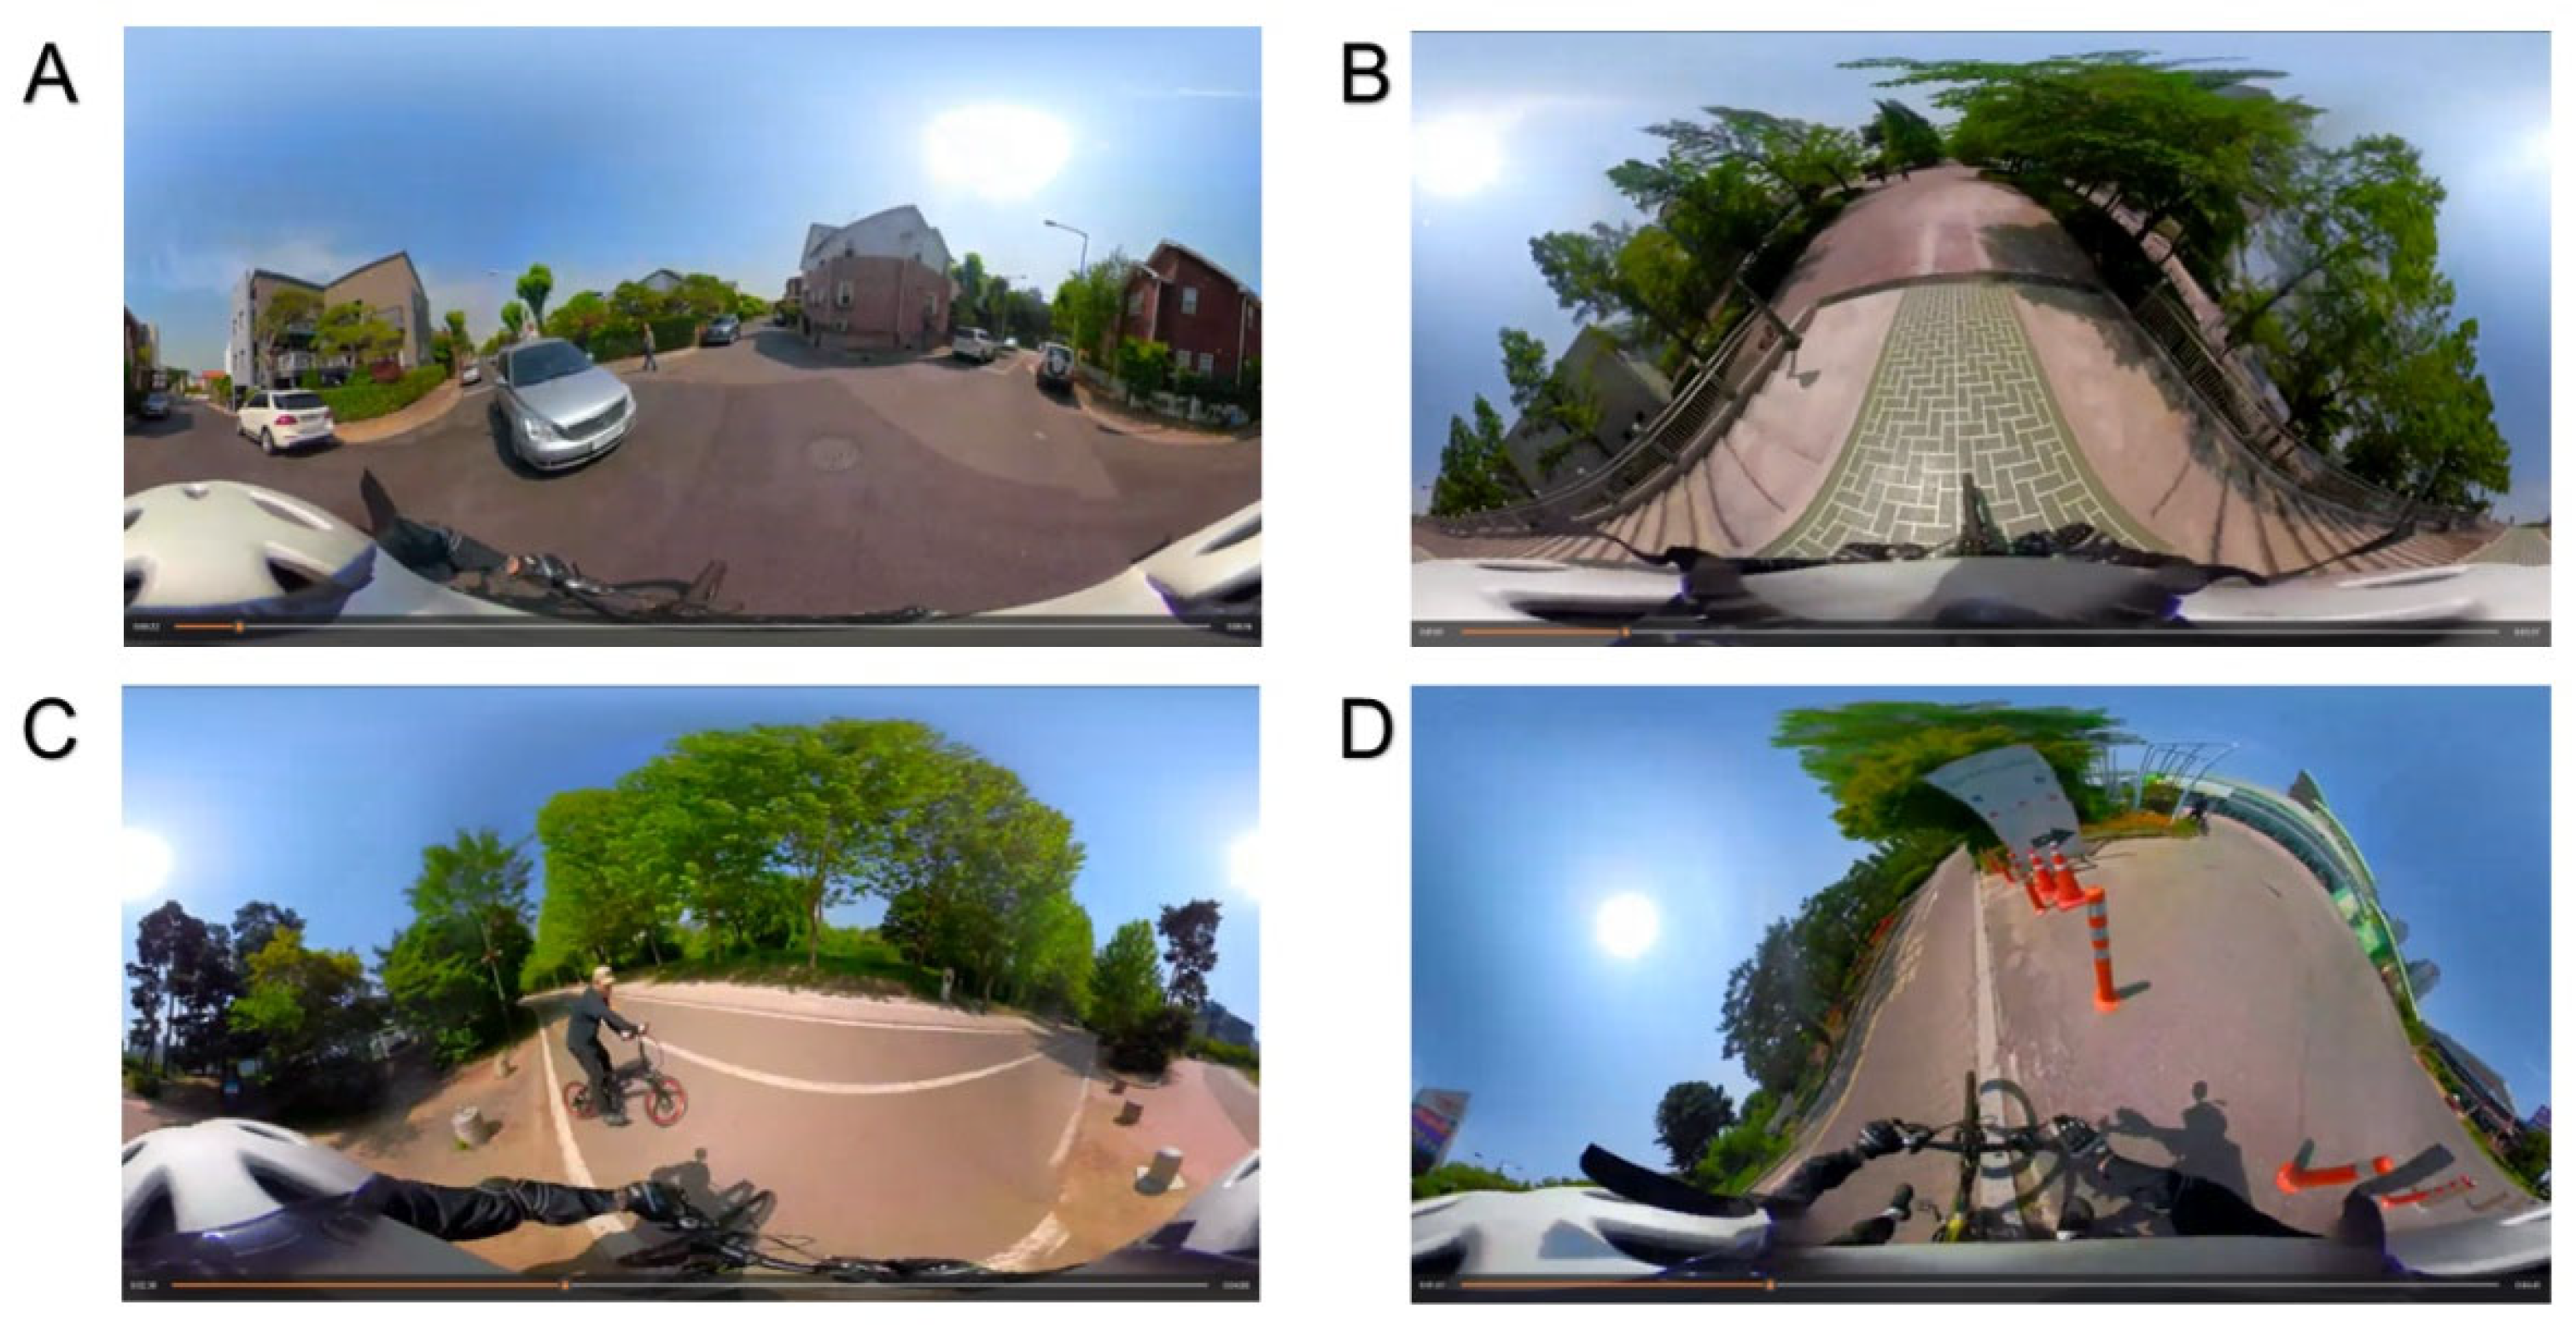
2.3. Procedures
2.4. Data Collection
2.5. Data Analysis
3. Results
4. Discussion
5. Conclusions
Author Contributions
Funding
Institutional Review Board Statement
Informed Consent Statement
Data Availability Statement
Conflicts of Interest
Appendix A

| Categories | Items | VR1: Pedestrian Accident | VR2: Other Bicycle Accident | VR3: Other Vehicles Accident | VR4: Curbside | VR5: Downhill Road |
|---|---|---|---|---|---|---|
| Simulator appropriateness | Scenarios in this video are a common occurrence. a | 4.4 (0.72) | 3.7 (1.10) | 3.9 (1.01) | 3.6 (1.33) | 4.0 (1.07) |
| I actually experienced an accident like this video. b | 6 (24.0) | 4 (16.0) | 23 (92.0) | 5 (20.0) | 8 (32.0) | |
| Simulator reality | The surrounding environment of this video feels realistic. a | 3.7 (1.08) | 4.0 (0.93) | 3.9 (0.97) | 3.7 (1.20) | 3.7 (0.99) |
| The sound of this video feels real. a | 3.4 (1.10) | 3.5 (1.22) | 3.8 (1.00) | 3.8 (1.19) | 3.8 (1.11) | |
| The screen of this video feels like it is actually falling. a | 3.4 (1.14) | 3.7 (1.11) | 3.3 (1.18) | 3.6 (1.14) | 3.9 (1.08) | |
| Simulator sickness | I felt nauseous while watching or after watching this video. a | 2.9 (1.57) | 2.8 (1.57) | 2.1 (1.06) | 2.3 (1.24) | 2.4 (1.22) |
| I felt dizzy while watching or after watching this video. a | 2.5 (1.35) | 2.3 (1.19) | 2.1 (1.10) | 2.0 (1.05) | 2.1 (1.13) | |
| I felt a visual disturbance while watching or after watching this video. a | 1.8 (1.07) | 2.1 (1.39) | 1.8 (1.19) | 1.9 (1.25) | 2.0 (1.36) |
References
- World Health Organization. Global Status Report On Road Safety 2018; World Health Organization: Geneva, Switzerland, 2019; p. 419. ISBN 978-92-4-156568-4. [Google Scholar]
- International Transport Forum. Cycling Safety: Summary and Conclusions; ITF Roundtable Reports; OECD: Paris, France, 2018; ISBN 9789282191620. [Google Scholar]
- International Transport Forum. Road Safety Annual Report 2021: The Impact of COVID-10; OECD Publishing: Paris, France, 2021; ISBN 9789282144831. [Google Scholar]
- Sarmiento, K.; Haileyesus, T.; Waltzman, D.; Daugherty, J. Emergency Department Visits for Bicycle-Related Traumatic Brain Injuries Among Children and Adults—United States, 2009-2018. MMWR Morb. Mortal Wkly. Rep. 2021, 70, 693–697. [Google Scholar] [CrossRef] [PubMed]
- Axelsson, A.; Stigson, H. Characteristics of bicycle crashes among children and the effect of bicycle helmets. Traffic Inj. Prev. 2019, 20, 21–26. [Google Scholar] [CrossRef] [PubMed]
- Coronado, V.G.; Haileyesus, T.; Cheng, T.A.; Bell, J.M.; Haarbauer-Krupa, J.; Lionbarger, M.R.; Flores-Herrera, J.; McGuire, L.C.; Gilchrist, J. Trends in Sports- and Recreation-Related Traumatic Brain Injuries Treated in US Emergency Departments: The National Electronic Injury Surveillance System-All Injury Program (NEISS-AIP) 2001-2012. J. Head Trauma. Rehabil. 2015, 30, 185–197. [Google Scholar] [CrossRef] [PubMed]
- Thompson, D.C.; Rivara, F.P.; Thompson, R. Helmets for preventing head and facial injuries in bicyclists. Cochrane Database Syst. Rev. 2000, 1992(2), CD001855. [Google Scholar] [CrossRef] [PubMed]
- Rivara, F.P.; Thompson, D.C.; Thompson, R.S. Epidemiology of bicycle injuries and risk factors for serious injury. Inj. Prev. 2015, 21, 47–51. [Google Scholar] [CrossRef]
- Sosin, D.M.; Sacks, J.J.; Webb, K.W. Pediatric head injuries and deaths from bicycling in the United States. Pediatrics 1996, 98, 868–870. [Google Scholar] [CrossRef]
- Olivier, J.; Creighton, P. Bicycle injuries and helmet use: A systematic review and meta-analysis. Int. J. Epidemiol. 2017, 46, 372. [Google Scholar] [CrossRef]
- Bambach, M.R.; Mitchell, R.J.; Grzebieta, R.H.; Olivier, J. The effectiveness of helmets in bicycle collisions with motor vehicles: A case-control study. Accid. Anal. Prev. 2013, 53, 78–88. [Google Scholar] [CrossRef]
- Royal, S.; Kendrick, D.; Coleman, T. Promoting bicycle helmet wearing by children using non-legislative interventions: Systematic review and meta-analysis. Inj. Prev. 2007, 13, 162–167. [Google Scholar] [CrossRef]
- Grimard, G.; Nolan, T.; Carlin, J.B. Head injuries in helmeted child bicyclists. Inj. Prev. 1995, 1, 21–25. [Google Scholar] [CrossRef]
- Finch, C.F. Teenagers’ attitudes towards bicycle helmets three years after the introduction of mandatory wearing. Inj. Prev. 1996, 2, 126–130. [Google Scholar] [CrossRef]
- Lajunen, T.; Räsänen, M. Can social psychological models be used to promote bicycle helmet use among teenagers? A comparison of the Health Belief Model, Theory of Planned Behavior and the Locus of Control. J. Saf. Res. 2004, 35, 115–123. [Google Scholar] [CrossRef]
- McLaughlin, K.A.; Glang, A. The effectiveness of a bicycle safety program for improving safety-related knowledge and behavior in young elementary students. J. Pediatr. Psychol. 2010, 35, 343–353. [Google Scholar] [CrossRef] [PubMed]
- Rivara, F.; Sattin, R.W. Preventing bicycle-related injuries: Next steps. Inj. Prev. 2011, 17, 215. [Google Scholar] [CrossRef]
- O’Callaghan, F.V.; Nausbaum, S. Predicting bicycle helmet wearing intentions and behavior among adolescents. J. Saf. Res. 2006, 37, 425–431. [Google Scholar] [CrossRef]
- Macknin, M.L.; Medendorp, S.V. Association between bicycle helmet legislation, bicycle safety education, and use of bicycle helmets in children. Arch. Pediatr. Adolesc. Med. 1994, 148, 255–259. [Google Scholar] [CrossRef]
- Rivara, F.P.; Thompson, D.C.; Patterson, M.Q.; Thompson, R.S. Prevention of bicycle-related injuries: Helmets, education, and legislation. Annu. Rev. Public Health 1998, 19, 293–318. [Google Scholar] [CrossRef]
- Huybers, S.; Fenerty, L.; Kureshi, N.; Thibault-Halman, G.; LeBlanc, J.C.; Clarke, D.B.; Walling, S. Long-Term Effects of Education and Legislation Enforcement on All-Age Bicycle Helmet Use: A Longitudinal Study. J. Community Health 2017, 42, 83–89. [Google Scholar] [CrossRef]
- Owen, R.; Kendrick, D.; Mulvaney, C.; Coleman, T.; Royal, S. Non-legislative interventions for the promotion of cycle helmet wearing by children. Cochrane Database Syst. Rev. 2011, 2011(11), CD003985. [Google Scholar] [CrossRef]
- Lachapelle, U.; Noland, R.B.; Von Hagen, L.A. Teaching children about bicycle safety: An evaluation of the New Jersey Bike School program. Accid. Anal. Prev. 2013, 52, 237–249. [Google Scholar] [CrossRef]
- Richmond, S.A.; Zhang, Y.J.; Stover, A.; Howard, A.; Macarthur, C. Prevention of bicycle-related injuries in children and youth: A systematic review of bicycle skills training interventions. Inj. Prev. 2014, 20, 191–195. [Google Scholar] [CrossRef] [PubMed]
- Mitic, W. Health Education: Theoretical Concepts, Effective Strategies and Core Competencies; World Health Organization: Geneva, Switzerland; Regional Office for the Eastern Mediterranean: Cairo, Egypt, 2012; p. 79. ISBN 978-92-9021-829-6. [Google Scholar]
- Dennison, D.; Golaszewski, T. The Activated Health Education model: Refinement and implications for school health education. J. Sch. Health 2002, 72, 23–26. [Google Scholar] [CrossRef] [PubMed]
- Morgan, C.; Stager, L.; Shen, J.; Schwebel, D. 053 Virtual reality as a tool to teach children pedestrian safety: A systematic literature review. Inj Prev. 2022, 28, A18. [Google Scholar] [CrossRef]
- McComas, J.; MacKay, M.; Pivik, J. Effectiveness of virtual reality for teaching pedestrian safety. Cyberpsychol. Behav. 2002, 5, 185–190. [Google Scholar] [CrossRef]
- Schwebel, D.C.; McClure, L.A. Using virtual reality to train children in safe street-crossing skills. Inj. Prev. 2010, 16, e1–e5. [Google Scholar] [CrossRef]
- Morrongiello, B.A.; Corbett, M.; Beer, J.; Koutsoulianos, S. A pilot randomized controlled trial testing the effectiveness of a pedestrian training program that teaches children where and how to cross the street safely. J. Pediatr. Psychol. 2018, 43, 1147–1159. [Google Scholar] [CrossRef]
- Schwebel, D.C.; Combs, T.; Rodriguez, D.; Severson, J.; Sisiopiku, V. Community-based pedestrian safety training in virtual reality: A pragmatic trial. Accid. Anal. Prev. 2016, 86, 9–15. [Google Scholar] [CrossRef]
- Schwebel, D.C.; Gaines, J.; Severson, J. Validation of virtual reality as a tool to understand and prevent child pedestrian injury. Accid. Anal. Prev. 2008, 40, 1394–1400. [Google Scholar] [CrossRef]
- Wang, H.; Gao, Z.; Shen, T.; Li, F.; Xu, J.; Schwebel, D.C. Roles of individual differences and traffic environment factors on children’s street-crossing behaviour in a VR environment. Inj. Prev. 2020, 26, 417–423. [Google Scholar] [CrossRef]
- Omaki, E.; Rizzutti, N.; Shields, W.; Zhu, J.; McDonald, E.; Stevens, M.W.; Gielen, A. A systematic review of technology-based interventions for unintentional injury prevention education and behaviour change. Inj. Prev. 2017, 23, 138–146. [Google Scholar] [CrossRef]
- Ren, J.; Ren, W.; Huang, C.; Liu, Y. The application of digital technology in community health education. Digit. Med. 2015, 1, 3–6. [Google Scholar] [CrossRef]
- Ashmore, J.; Di Pietro, J.; Williams, K.; Stokes, E.; Symons, A.; Smith, M.; Clegg, L.; McGrath, C. A Free Virtual Reality Experience to Prepare Pediatric Patients for Magnetic Resonance Imaging: Cross-Sectional Questionnaire Study. JMIR Pediatr. Parent. 2019, 2, e11684. [Google Scholar] [CrossRef]
- Morrongiello, B.A.; Corbett, M.; Milanovic, M.; Pyne, S.; Vierich, R. Innovations in using virtual reality to study how children cross streets in traffic: Evidence for evasive action skills. Inj. Prev. 2015, 21, 266–270. [Google Scholar] [CrossRef]
- Liller, K.D.; Morissette, B.; Noland, V.; McDermott, R.J. Middle school students and bicycle helmet use: Knowledge, attitudes, beliefs, and behaviors. J. Sch. Health 1998, 68, 325–328. [Google Scholar] [CrossRef]
- Schwebel, D.C.; McClure, L.A. Training children in pedestrian safety: Distinguishing gains in knowledge from gains in safe behavior. J. Prim. Prev. 2014, 35, 151–162. [Google Scholar] [CrossRef]


| Categories | Questions | Choices or Score | Pre-Program | Post-Program | One Month Later |
|---|---|---|---|---|---|
| General | Q1. Do you have a bicycle? | Yes/No | A | NA | NA |
| Q2. Do you have a bicycle helmet? | Yes/No | A | NA | NA | |
| Q3. Have you ever suffered more than a bruise or abrasion in a bicycle accident in the past month? | Yes/No | A | NA | A | |
| Attitude | Q4. Do you know where there is a bicycle lane near your house? | Yes, I know/No, I do not know | A | NA | A |
| Q5. How often have you used your helmet in the past month? | Never or not often/Often or always | A | NA | A | |
| Knowledge | Q6. What does this traffic sign mean? (MCQ with picture) | A | A | A | |
| Q7. Which lane of the multi-lane driving roadcan be used for cycling in this picture? (MCQ with picture) | A | A | A | ||
| Q8. Which of the following is not on a bicycle checklist for safe driving? (MCQ) | (1) To make sure both brakes are working | A | A | A | |
| (2) To ensure maximum visibility by raising the saddle as high as possible. (Correct answer) | |||||
| (3) To check that the bicycle tire pressure is adequate | |||||
| (4) To lubricate the chain to operate smoothly and prevent rust | |||||
| Q9. Which of the following is the best way to use a pedestrian crosswalk by bike? (MCQ) | (1) To get off and drag your bike. (Correct answer) | A | A | A | |
| (2) To slow down but just ride the bike | |||||
| (3) While riding a bicycle, cross the road next to the pedestrian crossing. | |||||
| (4) Bicycles cannot be used in the crosswalk. | |||||
| Satisfaction with the program | Q10. Was this program fun? | 1 point (dissatisfied) - 10 points (satisfied) | NA | A | NA |
| Q11. Did you learn anything new about bicycle safety through this training? | 1 point (dissatisfied) - 10 points (satisfied) | NA | A | NA | |
| Q12. Are you willing to recommend this program to your friends? | 1 point (dissatisfied) - 10 points (satisfied) | NA | A | NA |
| Categories | Questions/Answers | Pre-Program | Post-Program | One Month Later | ||||||
|---|---|---|---|---|---|---|---|---|---|---|
| Elementary | Middle | Total | Elementary | Middle | Total | Elementary | Middle | Total | ||
| N = 37 | N = 40 | N = 77 | N = 35 | N = 33 | N = 68 | N = 27 | N = 13 | N = 40 | ||
| General a | Q1/Yes | 31 (83.8) | 32 (80.0) | 63 (81.8) | - | - | - | - | - | - |
| Q2/Yes | 25 (67.6) | 16 (40.0) | 41 (53.3) | - | - | - | - | - | - | |
| Q3/Yes | 8 (21.6) | 3 (7.5) | 11 (14.3) | - | - | - | 1 (3.7) | 1 (7.7) | 2 (5.0) | |
| Attitude a | Q4/Yes, I know | 30 (81.1) | 28 (70.0) | 58 (75.3) | - | - | - | 25 (92.6) | 12 (92.3) | 37 (92.5) |
| Q5/Often or always | 8 (21.6) | 3 (7.5) | 11 (14.3) | - | - | - | 9 (33.3) | 4 (30.8) | 13 (32.5) | |
| Knowledge a | Q6/Correct answer | 3 (8.1) | 6 (15.0) | 9 (11.7) | 11 (31.4) | 16 (48.5) | 27 (39.7) | 8 (29.6) | 4 (30.8) | 12 (30.0) |
| Q7/Correct answer | 32 (86.5) | 36 (90.0) | 68 (88.3) | 32 (91.4) | 29 (87.9) | 61 (89.7) | 25 (92.6) | 11 (84.6) | 36 (90.0) | |
| Q8/Correct answer | 26 (70.3) | 27 (67.5) | 53 (68.8) | 28 (80.0) | 31 (93.9) | 59 (86.8) | 26 (96.3) | 12 (92.3) | 38 (95.0) | |
| Q9/Correct answer | 36 (97.3) | 39 (97.5) | 75 (97.4) | 33 (94.3) | 32 (97.0) | 65 (95.6) | 27 (100.0) | 13 (100.0) | 40 (100.0) | |
| Evaluating this program b | Q10 | - | - | - | 9.2 ± 1.43 | 7.8 ± 1.58 | 8.5 ± 1.65 | - | - | - |
| Q11 | - | - | - | 8.0 ± 1.90 | 7.3 ± 1.85 | 7.7 ± 1.89 | - | - | - | |
| Q12 | - | - | - | 8.5 ± 1.90 | 7.8 ± 1.94 | 8.1 ± 1.94 | - | - | - | |
| Total | 37 (100) | 40 (100) | 77 (100) | 35 (100) | 33 (100) | 68 (100) | 27 (100) | 13 (100) | 40 (100) | |
| Pre-program | ||||||
| Often or always | Not often | Total | p-value | |||
| Helmet wearing | One month later | Often or always | 2 | 11 | 13 | 0.0225 |
| Not often | 2 | 20 | 22 | |||
| Total | 4 | 31 | 35 | |||
| Odds ratio (1 month later vs. pre-program) | 5.5 (95% CI: 1.20, 51.07) | |||||
| Risk difference | 0.26 (95% CI: 0.046, 0.469) | |||||
| NNT | 4 | |||||
| Pre-program | ||||||
| Yes, I know. | No, I do not know. | Total | p-value | |||
| Recognition of bicycle lanes near house | One month later | Yes, I know. | 27 | 8 | 35 | 0.0391 |
| No, I do not know. | 1 | 1 | 2 | |||
| Total | 28 | 9 | 37 | |||
| Odds ratio (one month later vs. pre-program) | 8.0 (95% CI: 1.07, 354.98) | |||||
| Risk difference | 0.19 (95% CI: 0.015, 0.363) | |||||
| NNT | 5 | |||||
Publisher’s Note: MDPI stays neutral with regard to jurisdictional claims in published maps and institutional affiliations. |
© 2022 by the authors. Licensee MDPI, Basel, Switzerland. This article is an open access article distributed under the terms and conditions of the Creative Commons Attribution (CC BY) license (https://creativecommons.org/licenses/by/4.0/).
Share and Cite
Lee, W.; Park, J.O.; Hong, S.O.; Kim, Y. Bicycle Injury Prevention Education Using 360° Virtual Reality Experiences of Accidents and Computer-Based Activity. Children 2022, 9, 1623. https://doi.org/10.3390/children9111623
Lee W, Park JO, Hong SO, Kim Y. Bicycle Injury Prevention Education Using 360° Virtual Reality Experiences of Accidents and Computer-Based Activity. Children. 2022; 9(11):1623. https://doi.org/10.3390/children9111623
Chicago/Turabian StyleLee, Woosup, Ju Ok Park, Sung Ok Hong, and Youngtaek Kim. 2022. "Bicycle Injury Prevention Education Using 360° Virtual Reality Experiences of Accidents and Computer-Based Activity" Children 9, no. 11: 1623. https://doi.org/10.3390/children9111623
APA StyleLee, W., Park, J. O., Hong, S. O., & Kim, Y. (2022). Bicycle Injury Prevention Education Using 360° Virtual Reality Experiences of Accidents and Computer-Based Activity. Children, 9(11), 1623. https://doi.org/10.3390/children9111623