2.1. Translation and Adaptation
Following established guidelines for the cross-cultural adaptation of self-report measures [
10], the original English version of the FLI-P was translated into Japanese by a team of three in-house professionals with experience in auditory-verbal therapy and early intervention; two were bilingual (Japanese–English) and produced the initial translation, while the third, a native Japanese speaker, reviewed and refined the resulting Japanese text for naturalness, clarity, and contextual accuracy. Following a forward-translation process, feedback was collected from three Japanese clinicians in Shizuoka General Hospital and two volunteer caregivers of children with hearing impairment to ensure clarity, naturalness, and conceptual equivalence of each item. Revisions were made iteratively based on their feedback to improve comprehension and cultural relevance. No formal cognitive testing (e.g., structured think-aloud protocols) was undertaken; however, clinicians and caregivers were directly asked about item comprehension and naturalness during the review. Minor adjustments were made to item wording and examples to reflect common Japanese expressions and environmental contexts, without changing the core construct being measured. Finally, an independent back-translation into English was conducted and reviewed against the original items by a team of early intervention experts at The Shepherd Centre, including one of the original FLI-P developers (A.D.), to verify the accuracy and conceptual fidelity of the Japanese version.
To illustrate the developmental progression assessed, representative items from the canonical English FLI-P are provided for each phase. Phase 1 (Sound Awareness): “Jumps or startles to loud sounds” (1.1) and “Hears all of the ‘Ling 6’ sounds when presented with emphasis” (1.5). Phase 2 (Associating Meaning): “Knows the voices of 2 family members” (2.3) and “Knows what is going to happen next in familiar songs” (2.8). Phase 3 (Simple Language): “Understands a word or phrase without any actions or gestures” (3.2) and “Knows their own name and will look at me when I say it” (3.4). Phase 4 (Different Conditions): “Follows short directions that are unpredictable or silly” (4.1) and “Repeats all of the ‘Ling 6’ sounds accurately” (4.7). Phase 5 (Discourse): “Recognises a familiar person on the phone” (5.1) and “Follows 3 instructions in the same sentence” (5.10). Phase 6 (Advanced): “Remembers 4 things that happened in a story in the right order after reading a book” (6.3) and “Is able to follow a long, complicated instruction that has more than 5 components” (6.6).
2.2. Survey Design and Distribution
The translated FLI-P(J) was administered as part of a larger online survey conducted, all in Japanese, via the commercial market research company ASMARQ Co., Ltd. (Tokyo, Japan), which maintains a large panel of family caregivers in Japan. This study was approved by the institutional review board of NTT Communication Science Laboratories (Approval No. R02-011) prior to data collection. All caregivers provided electronic informed consent before accessing the questionnaire, and participation was entirely voluntary. Survey data were stored on encrypted servers with access restricted to the research team, and no identifying personal information was collected. Panel members receive modest financial incentives for completing surveys. Caregivers of children between 2 and 73 months of age were invited to participate in the survey and only one response per child was permitted. The version of the FLI-P(J) used for this survey was a pre-final Japanese version that differs only stylistically from the version currently available from The Shepherd Centre online (e.g., minor wording and formatting adjustments) and does not change the intended meaning or developmental ordering of any item. The complete Japanese translation of the survey instrument (FLI-P(J)) used in this study is available online in the accompanying Mendeley Data repository [
https://doi.org/10.17632/jcvw93k8kj.1].
The FLI-P(J) items were embedded within a broader questionnaire that collected detailed information about the child and family context. Demographic items included, for example, the child’s sex, age and date of birth, health-related diagnoses (e.g., hearing or language development concerns), language(s) spoken in the home, the respondent’s relationship to the child (e.g., mother, father), presence and birth order of siblings, total number of household members, preschool or daycare attendance, history of newborn hearing screening, prefecture of residence, annual income of the primary earner, parents’ ages, employment status (full-time, part-time, or none), and highest level of schooling for both mother and father.
Respondents were geographically distributed across all 47 prefectures of Japan, with the largest single-prefecture contributions from Tokyo (10.5%), Aichi (8.4%), Osaka (8.0%), and Kanagawa (6.7%); no prefecture accounted for fewer than nine responses. Reported annual household income spanned the full range surveyed, from under ¥2 million (3.5%) to ¥15 million or more (1.8%), with the largest single bracket (16.2%) falling at ¥5–6 million, indicating a broad cross-section of household income levels rather than a narrow or skewed subset.
Following the FLI-P(J) section, additional items probed the child’s home literacy and activity environment. Caregivers were asked about how often someone in the family reads to the child, at what age shared reading began, the approximate number of picture books and other reading materials in the home, familiarity with and ownership of specific children’s books, recent play themes and songs the child enjoys, participation in structured activities (e.g., parent-child classes, swimming, dance, Kumon, piano, etc.), the child’s expressive vocabulary using a list of provided words, and the frequency of library use. Although these variables provide rich contextual information, the present analysis focuses exclusively on responses to the FLI-P(J) items. Associations with demographic and home-environment measures will be examined in separate reports.
The survey was distributed with the goal of obtaining responses representing each month of age from 2 months to 73 months (6 years, 1 month). Specifically, the target was 20 males and 20 females per month age group (40 per group). Once 20 children of each gender were recorded for a given month bin, the system automatically stopped accepting additional responses for that group. However, in a few cases, slightly more than 20 were accepted due to near-simultaneous submissions, while in others the total number of submissions was lower due to an automatic global survey closing date.
2.3. Administration and Scoring of FLI-P(J) Items
Within the survey, the 64 FLI-P(J) items were presented in their standard developmental order. Items are grouped into phase units, progressing from Phase 1 (Sound Awareness) through Phase 6 (Advanced Open Set Listening), reflecting increasing complexity of functional listening and spoken language skills. Each item describes an everyday listening or language-related behavior (e.g., “jumps or startles to loud sounds”), and caregivers were asked to indicate how often their child currently demonstrates that behavior by selecting either “Mostly” or “Rarely.” The full instrument is available for reference via the HearHub platform operated by The Shepherd Centre in Australia [
2].
In typical clinical administration of the FLI-P, item presentation is discontinued once a child receives six consecutive lower-frequency responses (e.g., “Rarely”). Because this survey was completed independently by caregivers in an online format, it was not practical to expect respondents to keep track of these ceiling and basal rules and discontinue the questionnaire themselves. For this reason, all caregivers were asked to respond to every FLI-P(J) item, regardless of their child’s performance.
Total FLI-P(J) scores were then derived post hoc using a rule designed to approximate the original stop protocol. Responses were coded dichotomously, with “Mostly” treated as indicating that the behavior was present and “Rarely” as indicating that it was not yet consistently observed. For each child, the FLI-P(J) total score was calculated as the number of “Mostly” responses counted up to the point at which six consecutive “Rarely” responses occurred; any “Mostly” responses after this run of six “Rarely” responses were not included in the total. This procedure yields a single total score per child that is comparable in interpretation to scores obtained under standard FLI-P administration, while accommodating the constraints of self-administered online data collection.
2.4. Participant Characteristics and Data Cleaning
A total of 2976 responses were collected across all age groups. Eligibility for the normative analysis was restricted to children without reported hearing, language, or related developmental concerns based on screening questions. Data cleaning was performed in three sequential steps:
Screening for caregiver-reported suspected developmental concerns:
Responses were excluded if the caregiver selected any response other than “None in particular” (Original—特になし) for the question:
“Please tell us if your child has ever been identified as having any concerns related to sensory functioning or behavior during health checkups or visits to medical institutions.”
Original—「健診や医療機関などでお子様の感覚機能や行動面などでこれまでに指摘された点があれば教えて下さい。」
The options, with number of responses removed for each, were:
No concerns reported (特になし) = All retained
Auditory function/hearing (耳の聞こえ/聴覚機能) = 9
Visual function (視覚機能) = 1
Language development (ことばの発達) = 32
Social functioning (社会性) = 6
Attention and behavioral regulation (注意/落ち着き) = 0
Other (その他) = 0
This screening removed 48 responses that reported prior concerns related to hearing, vision, speech development, social behavior, attention, or other domains. These classifications were based solely on caregiver reports in response to this screening question; no independent clinical verification or detailed diagnostic information was obtained as part of the survey.
- 2.
Exclusion of implausible total scores:
A total of an additional 263 response sets with a score of 0 were removed. In the FLI-P, a total score of 0 indicates that the caregiver reported “Rarely” for all of the early items, including very basic behaviors such as startling to loud sounds or responding to familiar voices. Given the simplicity of the earliest items, such a pattern was deemed implausible for any child regardless of age, and these responses were interpreted as likely indicating non-serious participation, possibly submitted solely for remuneration.
- 3.
Outlier removal using the Interquartile Range (IQR) method:
Finally, to reduce the impact of extreme under- or over-reporting, the Interquartile Range (IQR) method was used to identify and remove outliers based on total score distributions within six-month age bands. Because the youngest children in the dataset were 2 months old and the oldest were 73 months, twelve bands of equal width: 2–7, 8–13, 14–19, 20–25, 26–31, 32–37, 38–43, 44–49, 50–55, 56–61, 62–67, and 68–73 months (corresponding to the age bands shown in
Table 1) were defined. For each age band, the first quartile (Q1), third quartile (Q3), and the IQR (Q3–Q1) for total FLI-P(J) scores were calculated. Observations with scores below Q1 − 1.5 × IQR or above Q3 + 1.5 × IQR were treated as outliers and excluded from further analysis. The IQR-based approach is widely used in applied research because it relies on medians and quartiles rather than means and standard deviations and is therefore robust to skewed or non-normal distributions—conditions that are typical in developmental data where floor and ceiling effects are expected. In addition, recent work has recommended IQR-based trimming as a practical and effective strategy for outlier detection in large-scale empirical datasets, where extreme values can distort model estimates if left unaddressed [
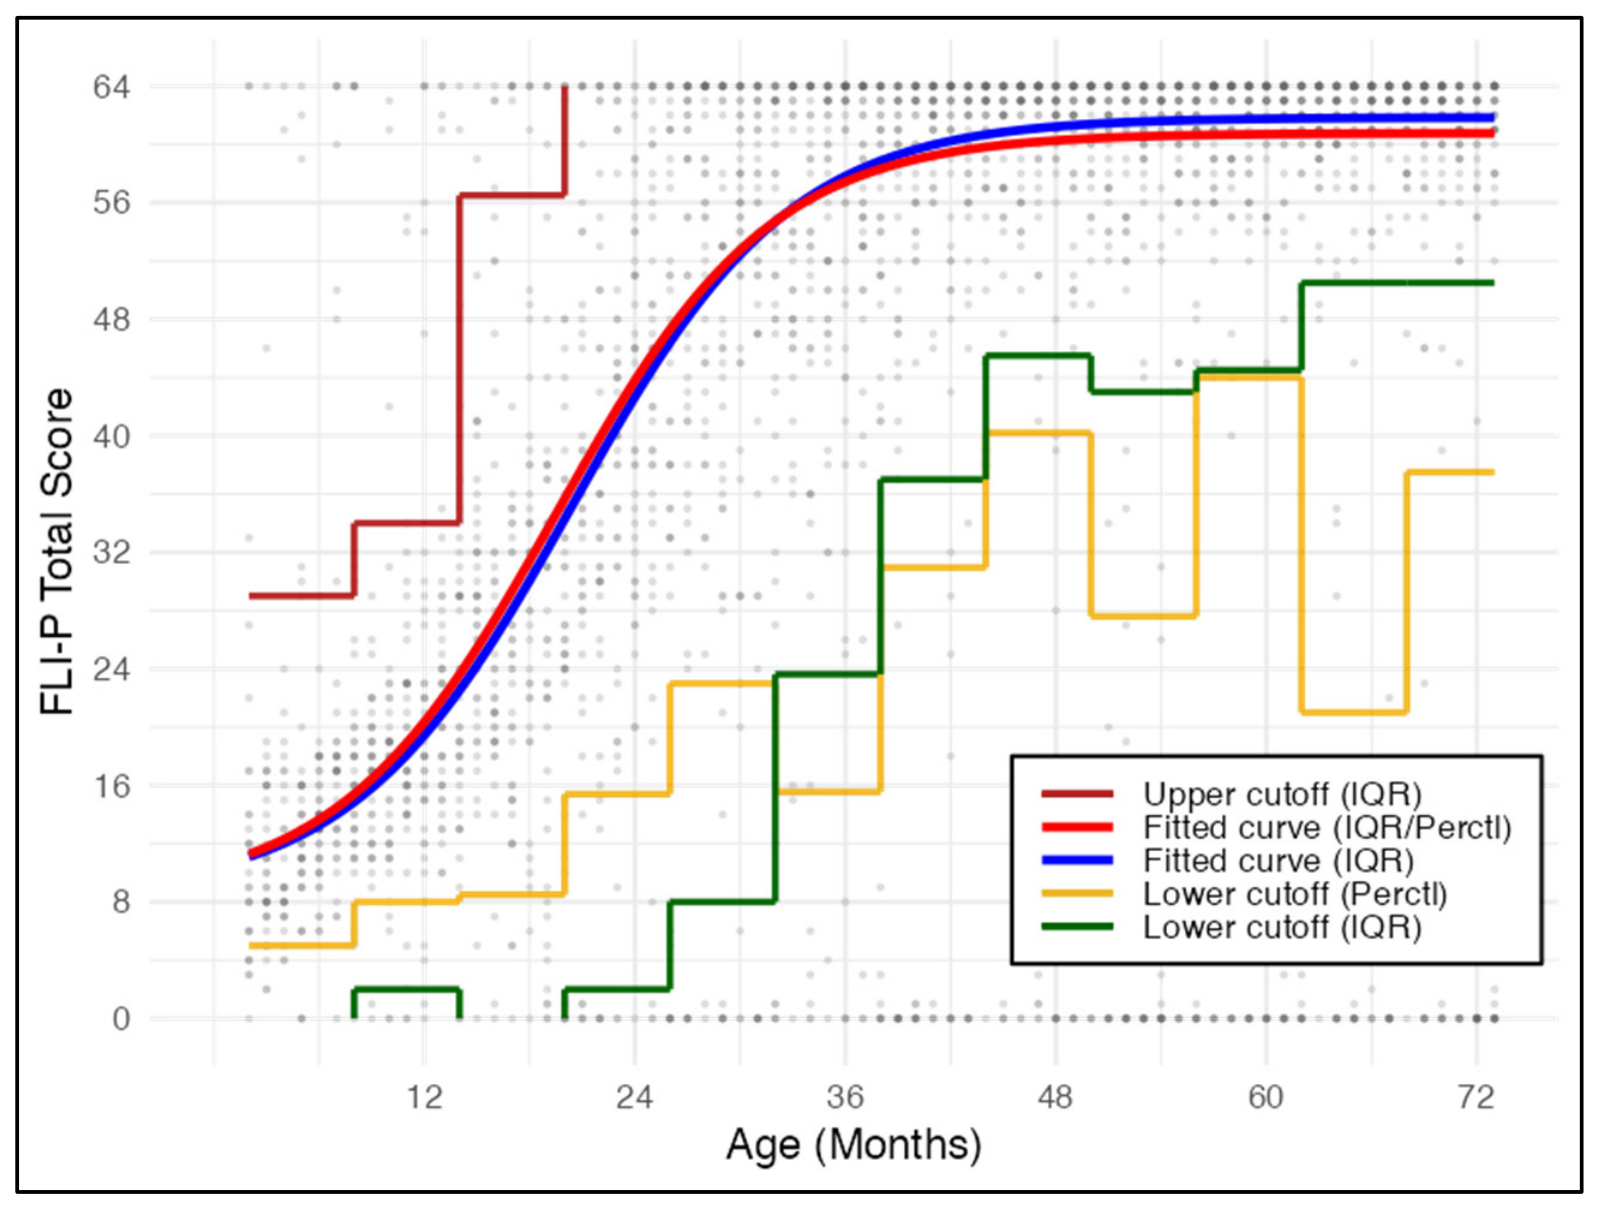
11]. The symmetric IQR method was selected because it treats both tails equally, applying the same principled, distribution-based criterion at each end regardless of the direction of response bias (e.g., over-reporting vs. under-reporting), rather than relying on a fixed percentile cutoff at one end only. As detailed below, this approach was compared against an alternative that combined a fixed 5th-percentile cutoff at the low end with an IQR-based fence at the high end; the two methods yielded nearly identical developmental trajectories, and the symmetric IQR heuristic was retained as the primary approach for its methodological consistency and transparency. This step excluded an additional 153 response sets from the analysis.
As a robustness check, an alternative outlier removal method was also explored, in which scores below the 5th percentile were excluded at the low end and the IQR method was applied only at the high end to detect extreme scores. This approach removed 164 responses rather than 153. As described in the Results, the developmental trajectories obtained under the two cleaning strategies were highly similar, indicating that the specific choice of exclusion threshold did not materially affect the observed pattern of age-related change. On this basis, the standard symmetric IQR-based method was adopted for the final analyses reported in this paper, resulting in a final normative sample of N = 2512 caregiver reports.
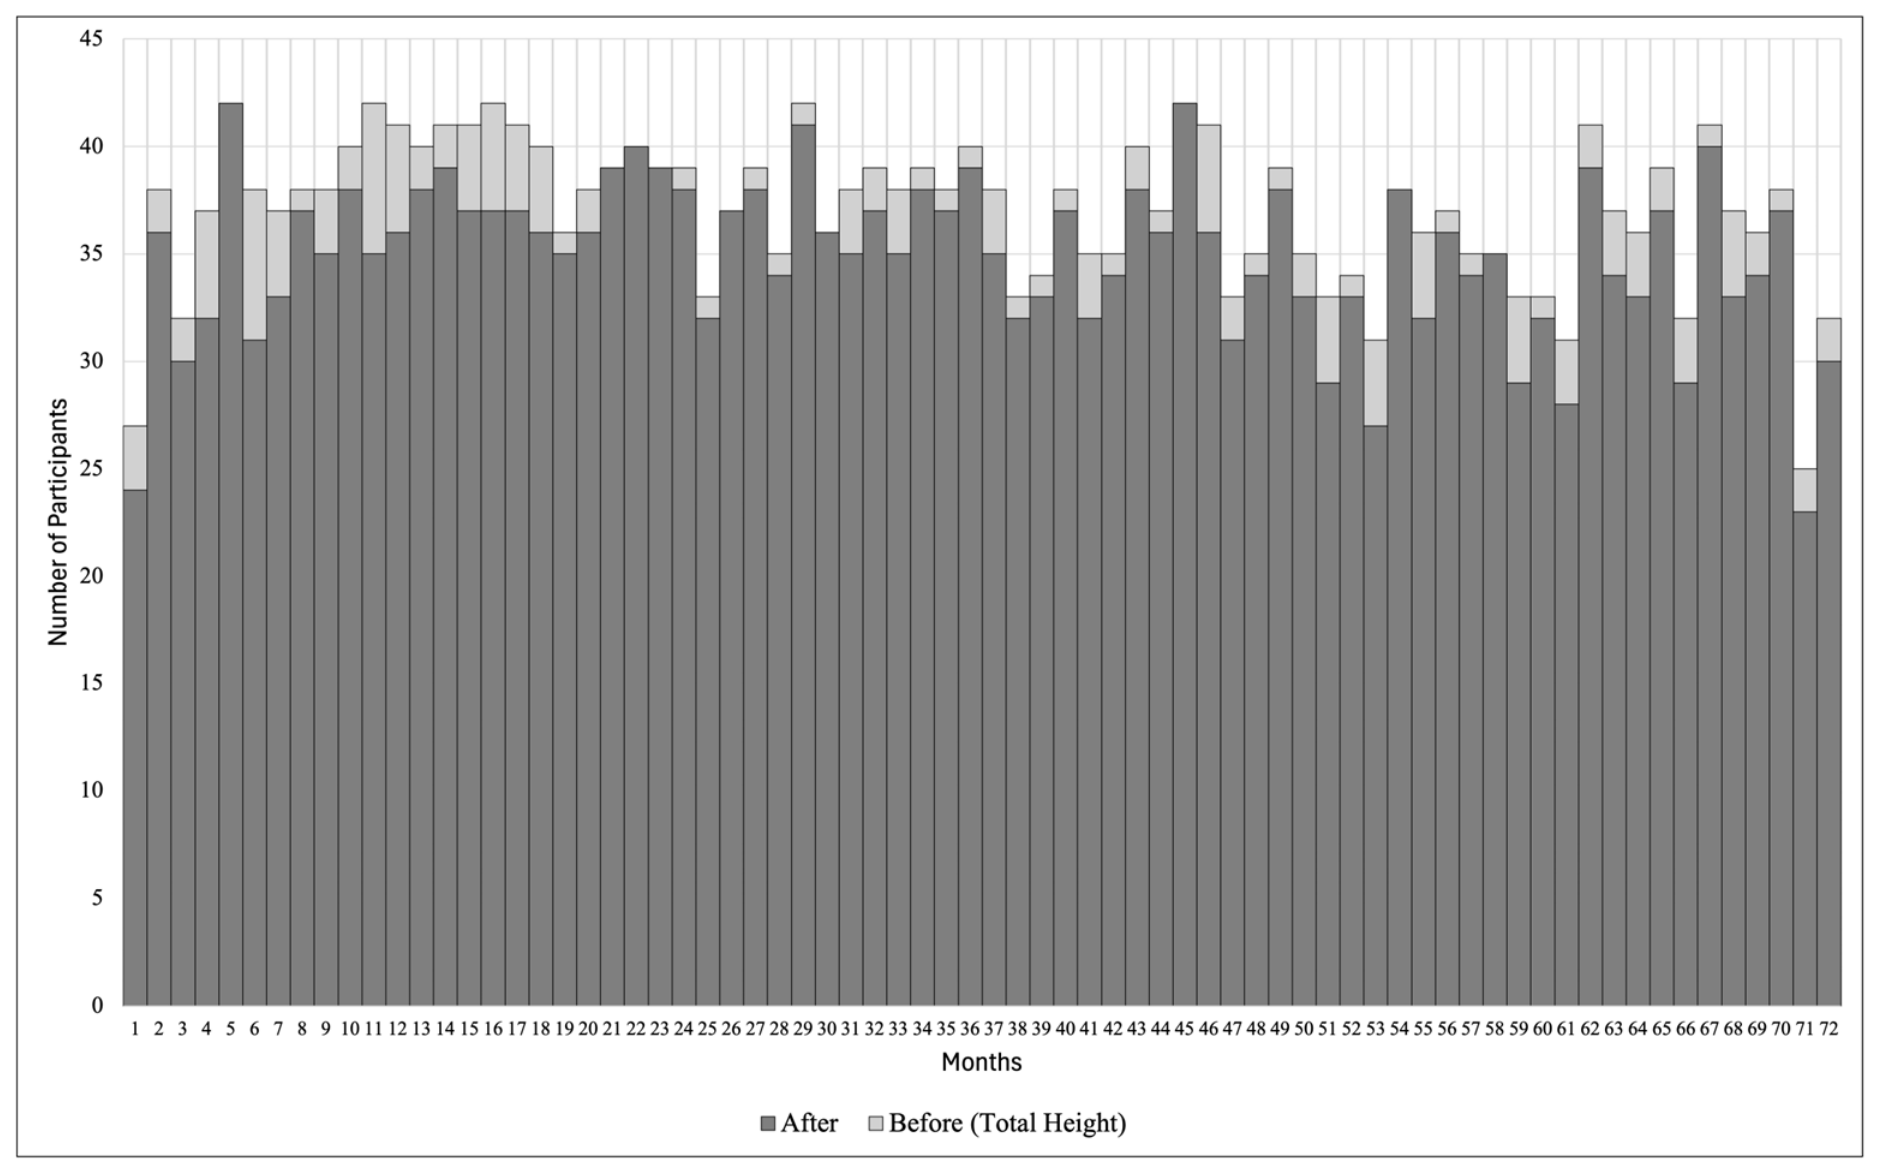
To illustrate how the cleaning steps affected the usable sample at each age, the number of caregiver responses per six-month age band before and after the final IQR-based outlier removal were summarized (
Table 1). The first numeric column shows the total number of responses collected in each band; the second shows the number of cases retained for the normative analysis after medical screening, exclusion of zero scores, and removal of outliers using the IQR criterion; and the third reports the corresponding percentage retained. As a complementary view, for each individual month of age, the number of caregiver responses before and after data cleaning, were also plotted (
Figure 1). The specific purpose of
Figure 1 is to allow verification of sampling fidelity to the target design (20 males and 20 females per month); the monthly resolution confirms that recruitment remained balanced across the age range without significant monthly gaps. This month-by-month display highlights local fluctuations in both the volume of data and the number of excluded cases, while confirming that the retained sample remains substantial at each age and that outlier exclusion did not disproportionately reduce the number of usable cases at any particular age.
2.5. Statistical Analysis
Initial data screening, calculation of age-band indicators, and implementation of outlier-removal rules (IQR- and percentile-based thresholds) were conducted in Microsoft Excel. These steps included computing age bins, identifying zero scores, and applying the interquartile range (IQR) fences and alternative 5th-percentile thresholds at the age-band level.
All subsequent descriptive and graphical analyses were carried out using jamovi, an open-source statistical platform built on the R language [
12]. Jamovi 2.7 was used to generate descriptive statistics (means, medians, and selected percentiles) for FLI-P(J) total scores by age in months and by age bands, and to produce scatterplots and smoothed developmental trajectories.
To model the age-related trajectories, we evaluated several smoothing approaches, consistent with established methods for constructing age-based percentile reference curves [
13]. A four-parameter logistic function was selected for all curve fitting because it ensures methodological consistency with the original English-language study [
4] and provides biologically plausible asymptotes at the floor and ceiling of development. We also assessed a locally weighted scatterplot smoothing (LOWESS) approach as a non-parametric alternative; however, the logistic function was retained for the final models because it is more parsimonious and directly comparable to the Cowan et al. norms.
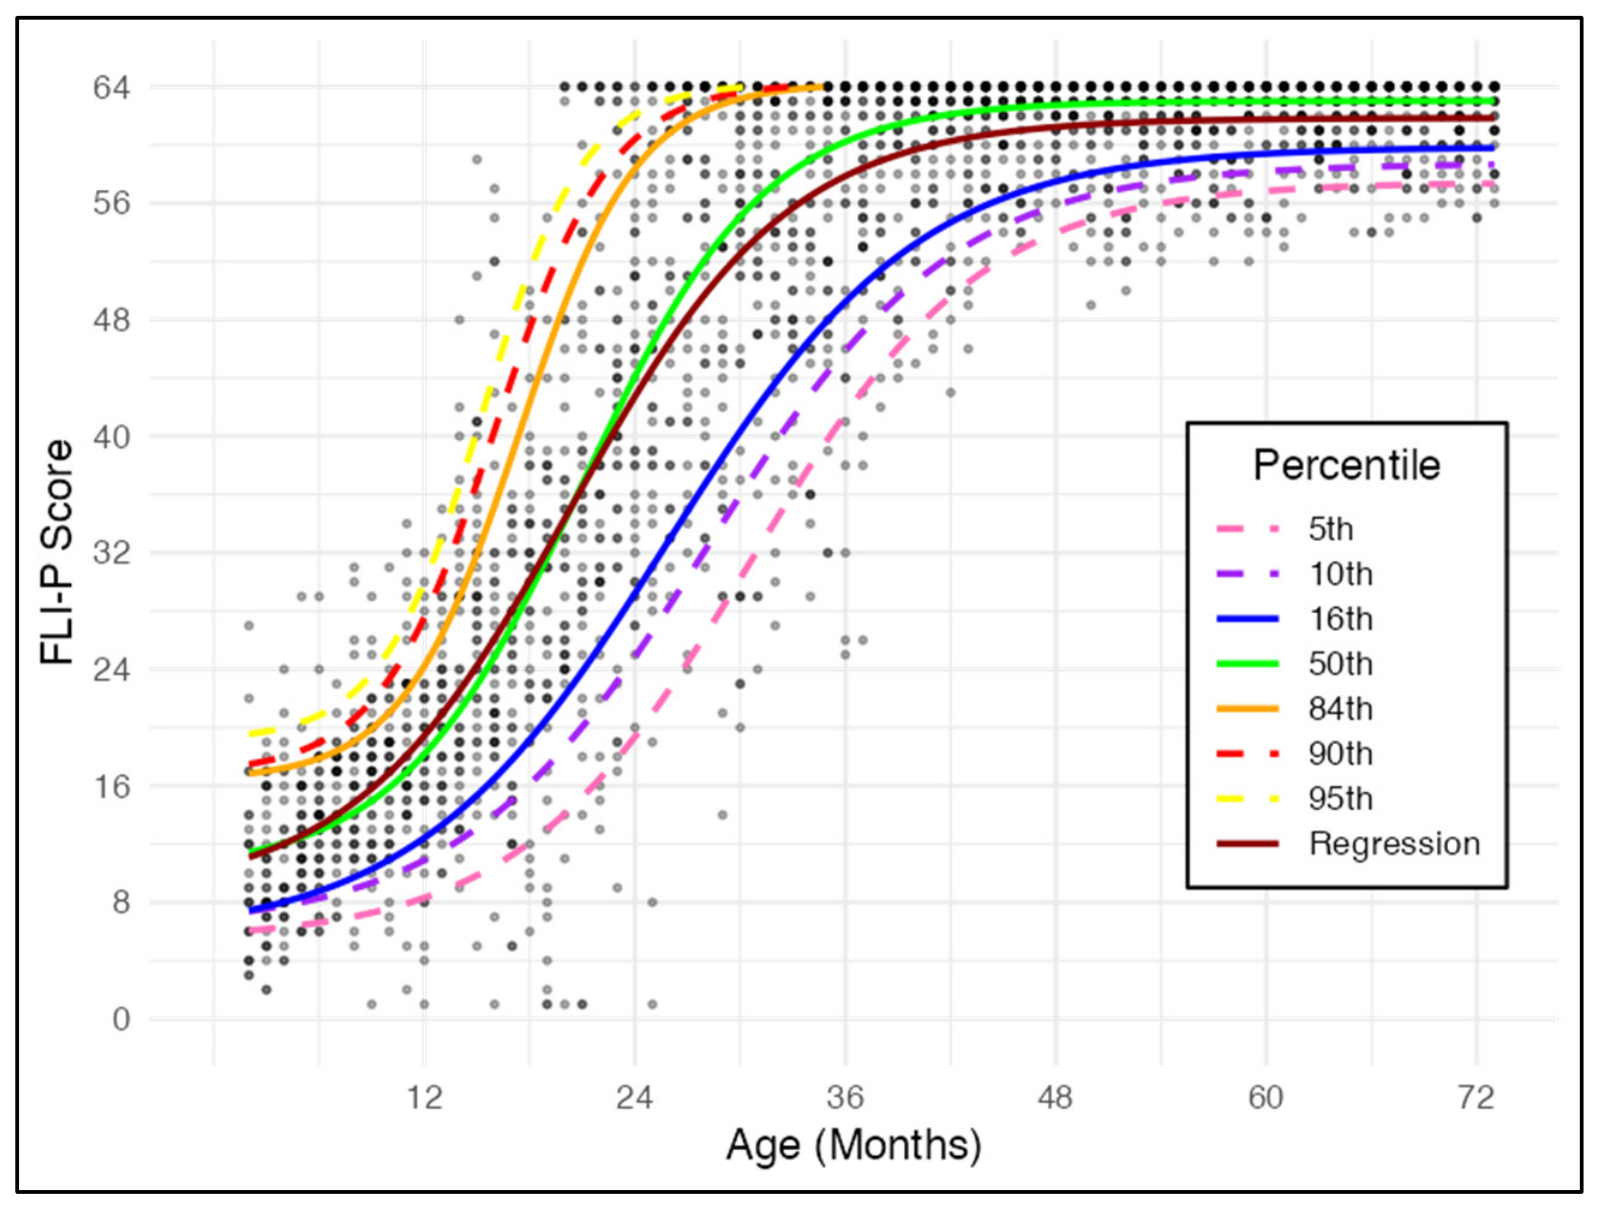
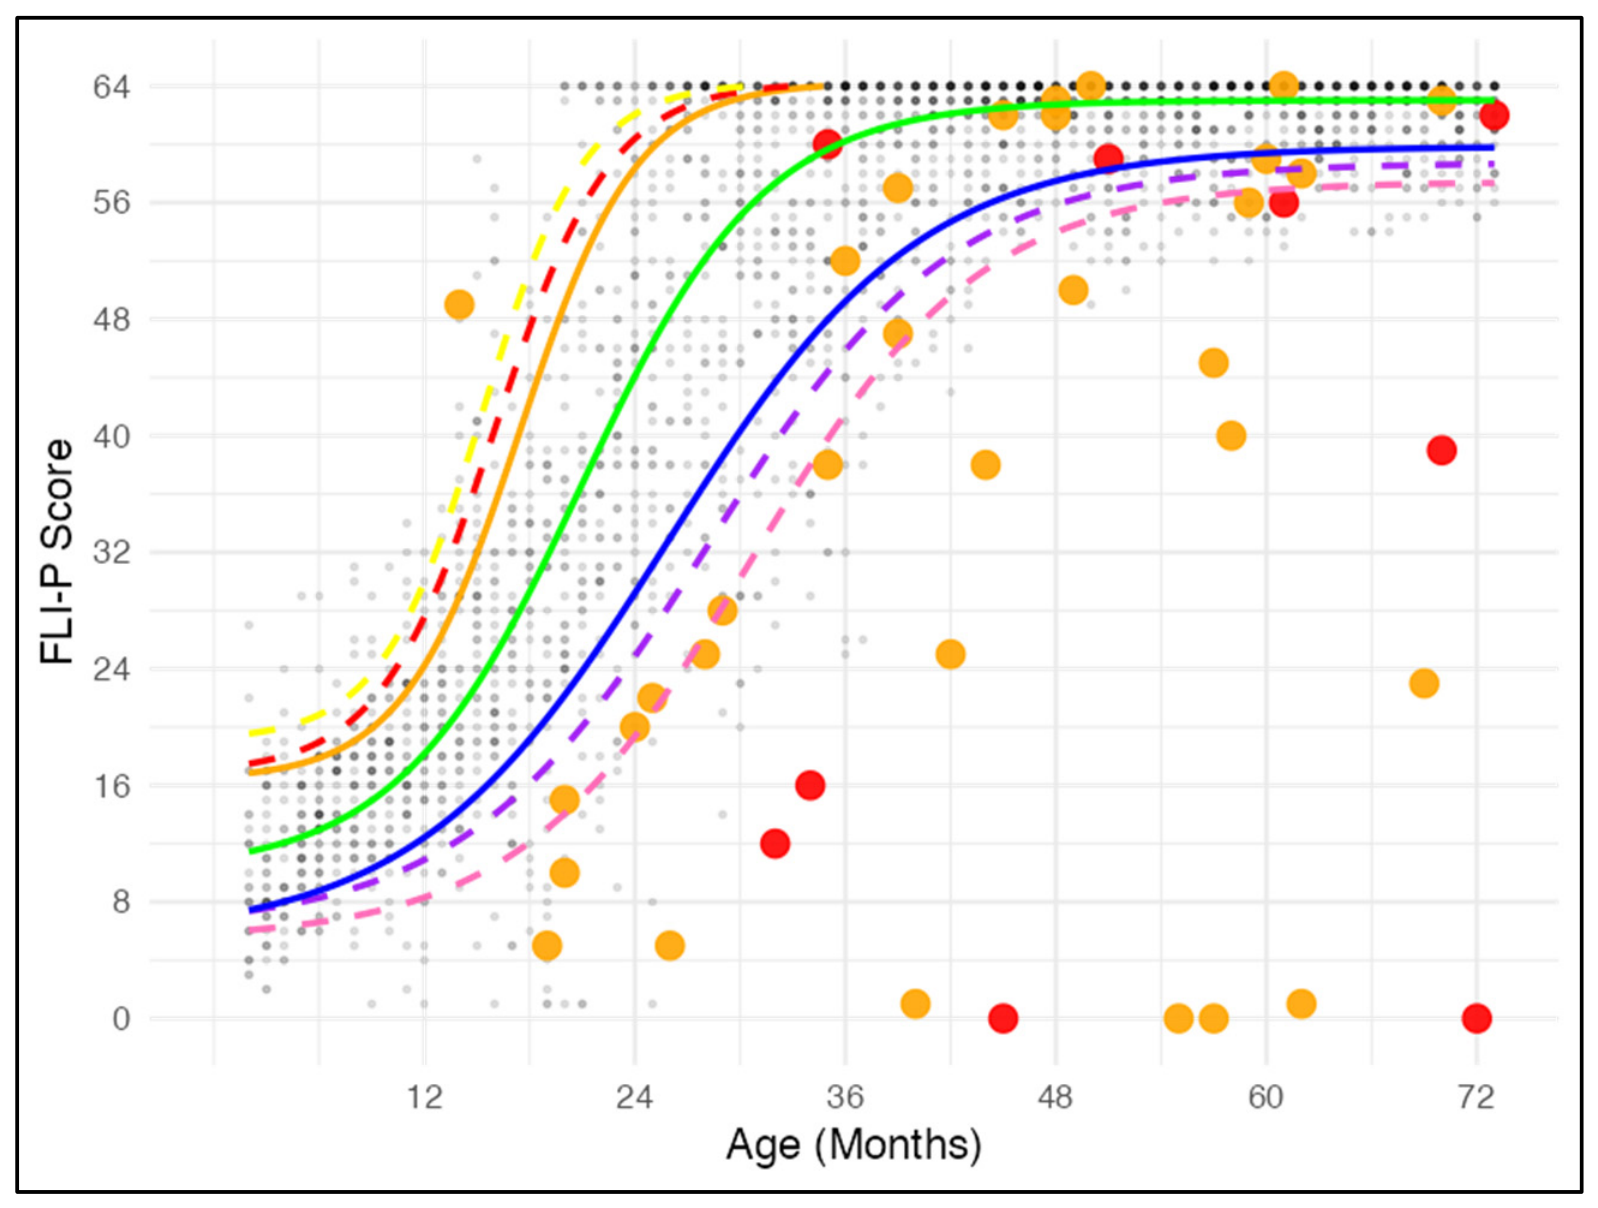
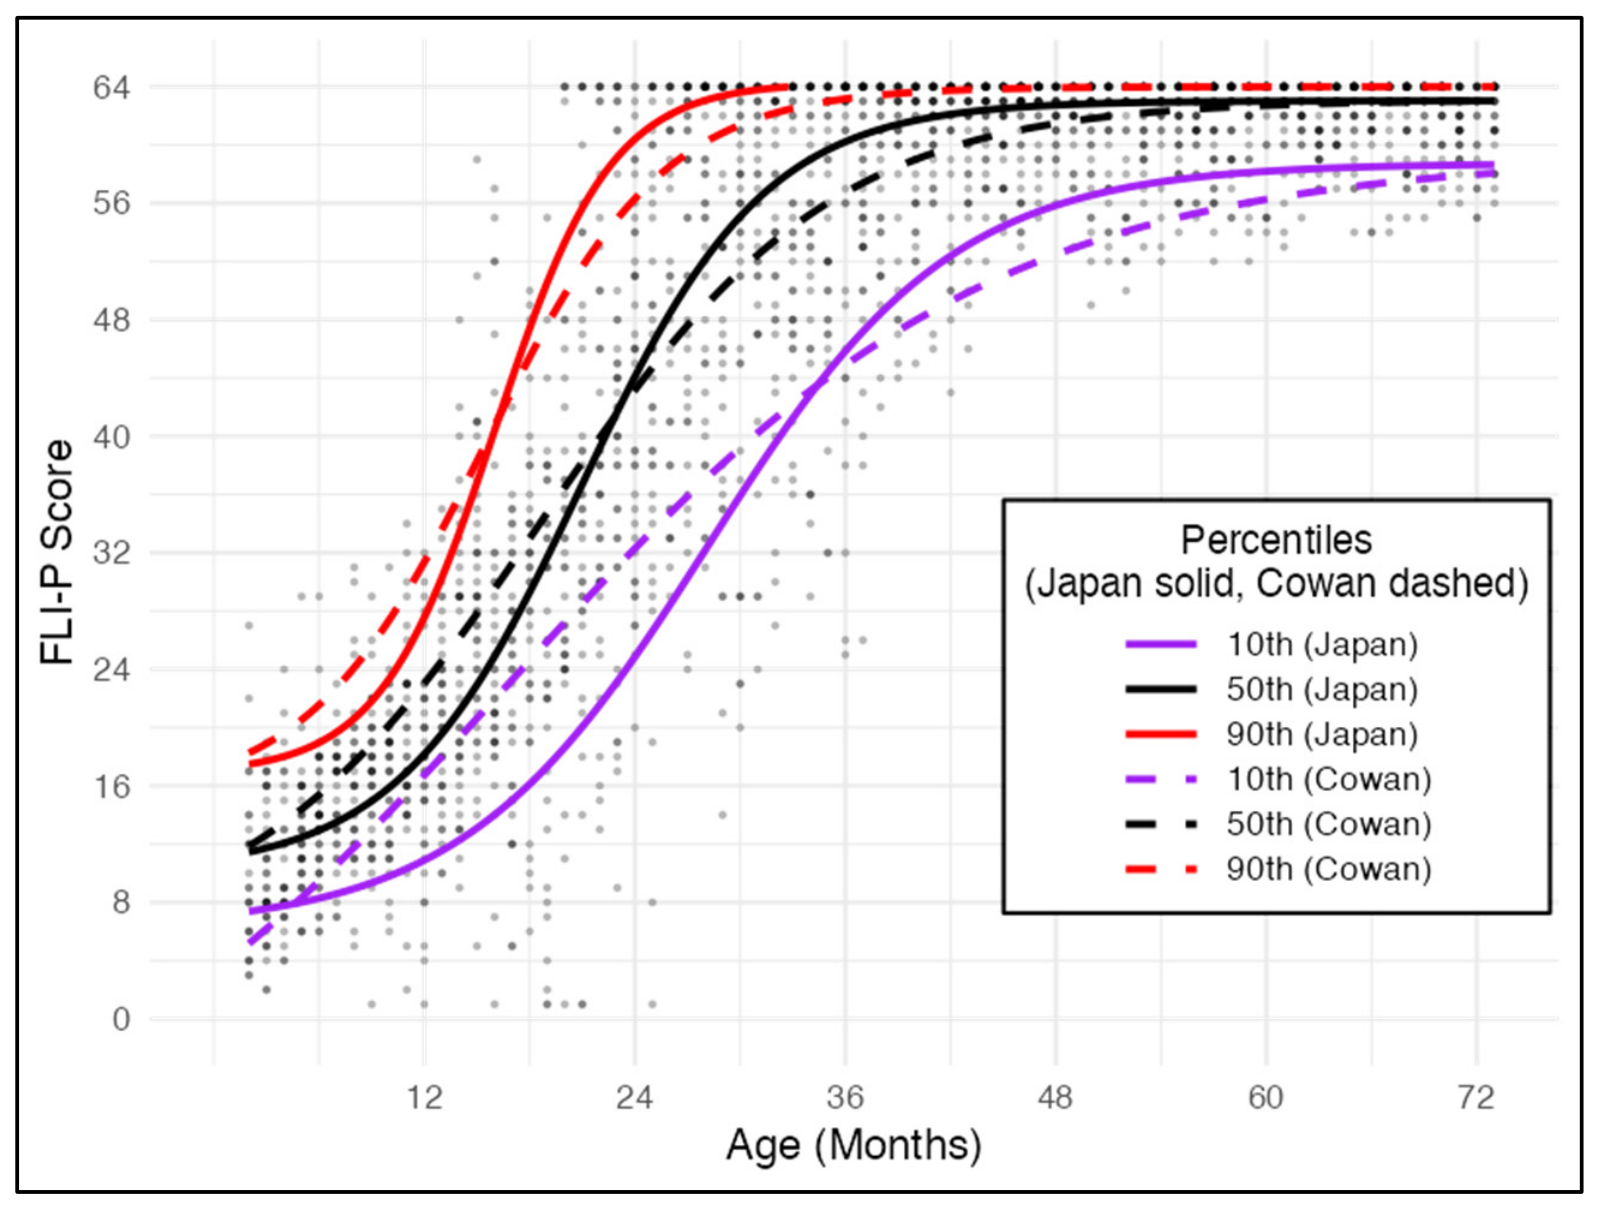
The 5th, 10th, 16th, 50th, 84th, 90th, and 95th percentiles were selected for analysis. The 16th and 84th percentiles correspond approximately to ±1 standard deviation from the mean in a normal distribution, defining the range of typical development. The 5th and 10th percentiles are included as progressively stringent clinical risk indicators often used in developmental screening, and the 90th and 95th percentiles mark the upper extreme. This selection mirrors those reported by Cowan et al. [
4], thereby facilitating direct visual comparison between the English-language and Japanese norms.
The primary outcome variable for analysis was the child’s total FLI-P(J) score after data cleaning, with age in months treated as a continuous predictor. To visualize developmental change across early childhood, individual data points were fitted and plotted using the four-parameter logistic curves from the Cowan study to model the trajectory of functional listening development over time [
4]. In addition, for each month of age empirical percentiles were calculated (5th, 10th, 16th, 50th, 84th, 90th, 95th) and then fitted using four-parameter logistic functions to the age profiles of these percentiles, yielding a set of logistic percentile curves that illustrate the spread of scores around the central trajectory.
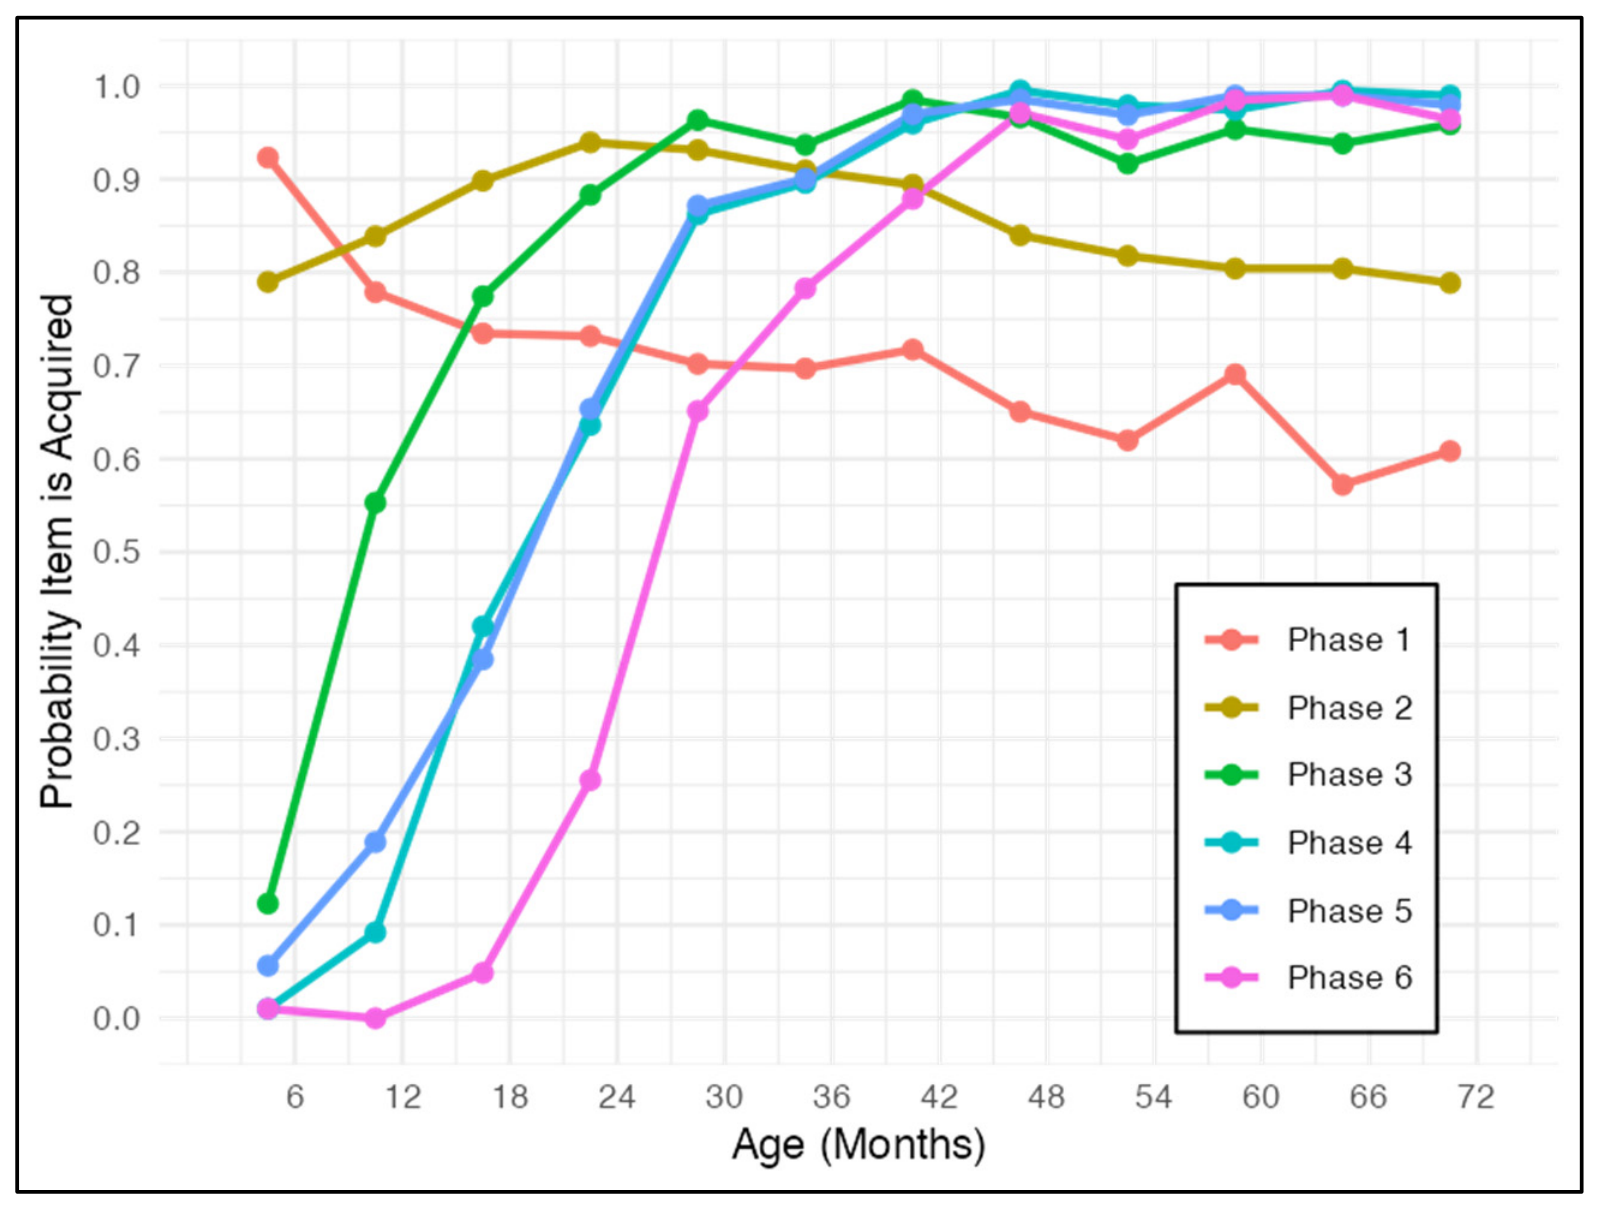
In an additional item-level analysis, acquisition probabilities were calculated for selected items and for phase-level item averages within each six-month age band, defining acquisition as caregiver endorsement of an item as “Mostly”.