
Global Burden of Pediatric Rheumatic Heart Disease, 1990–2021: Analysis of the GBD 2021 Study

Abstract
1. Introduction
2. Methods
2.1. Overview
2.2. Data Sources
2.3. Disease Burden Metrics
2.4. Distribution and Trends Analysis
2.5. Socio-Demographic Index (SDI)
2.6. AAPC Analysis
2.7. Age–Period–Cohort (APC) Analysis
2.8. Health Inequality Analysis
2.9. Statistical Software and Significance
2.10. Ethical Approval and Reporting Standards
3. Results
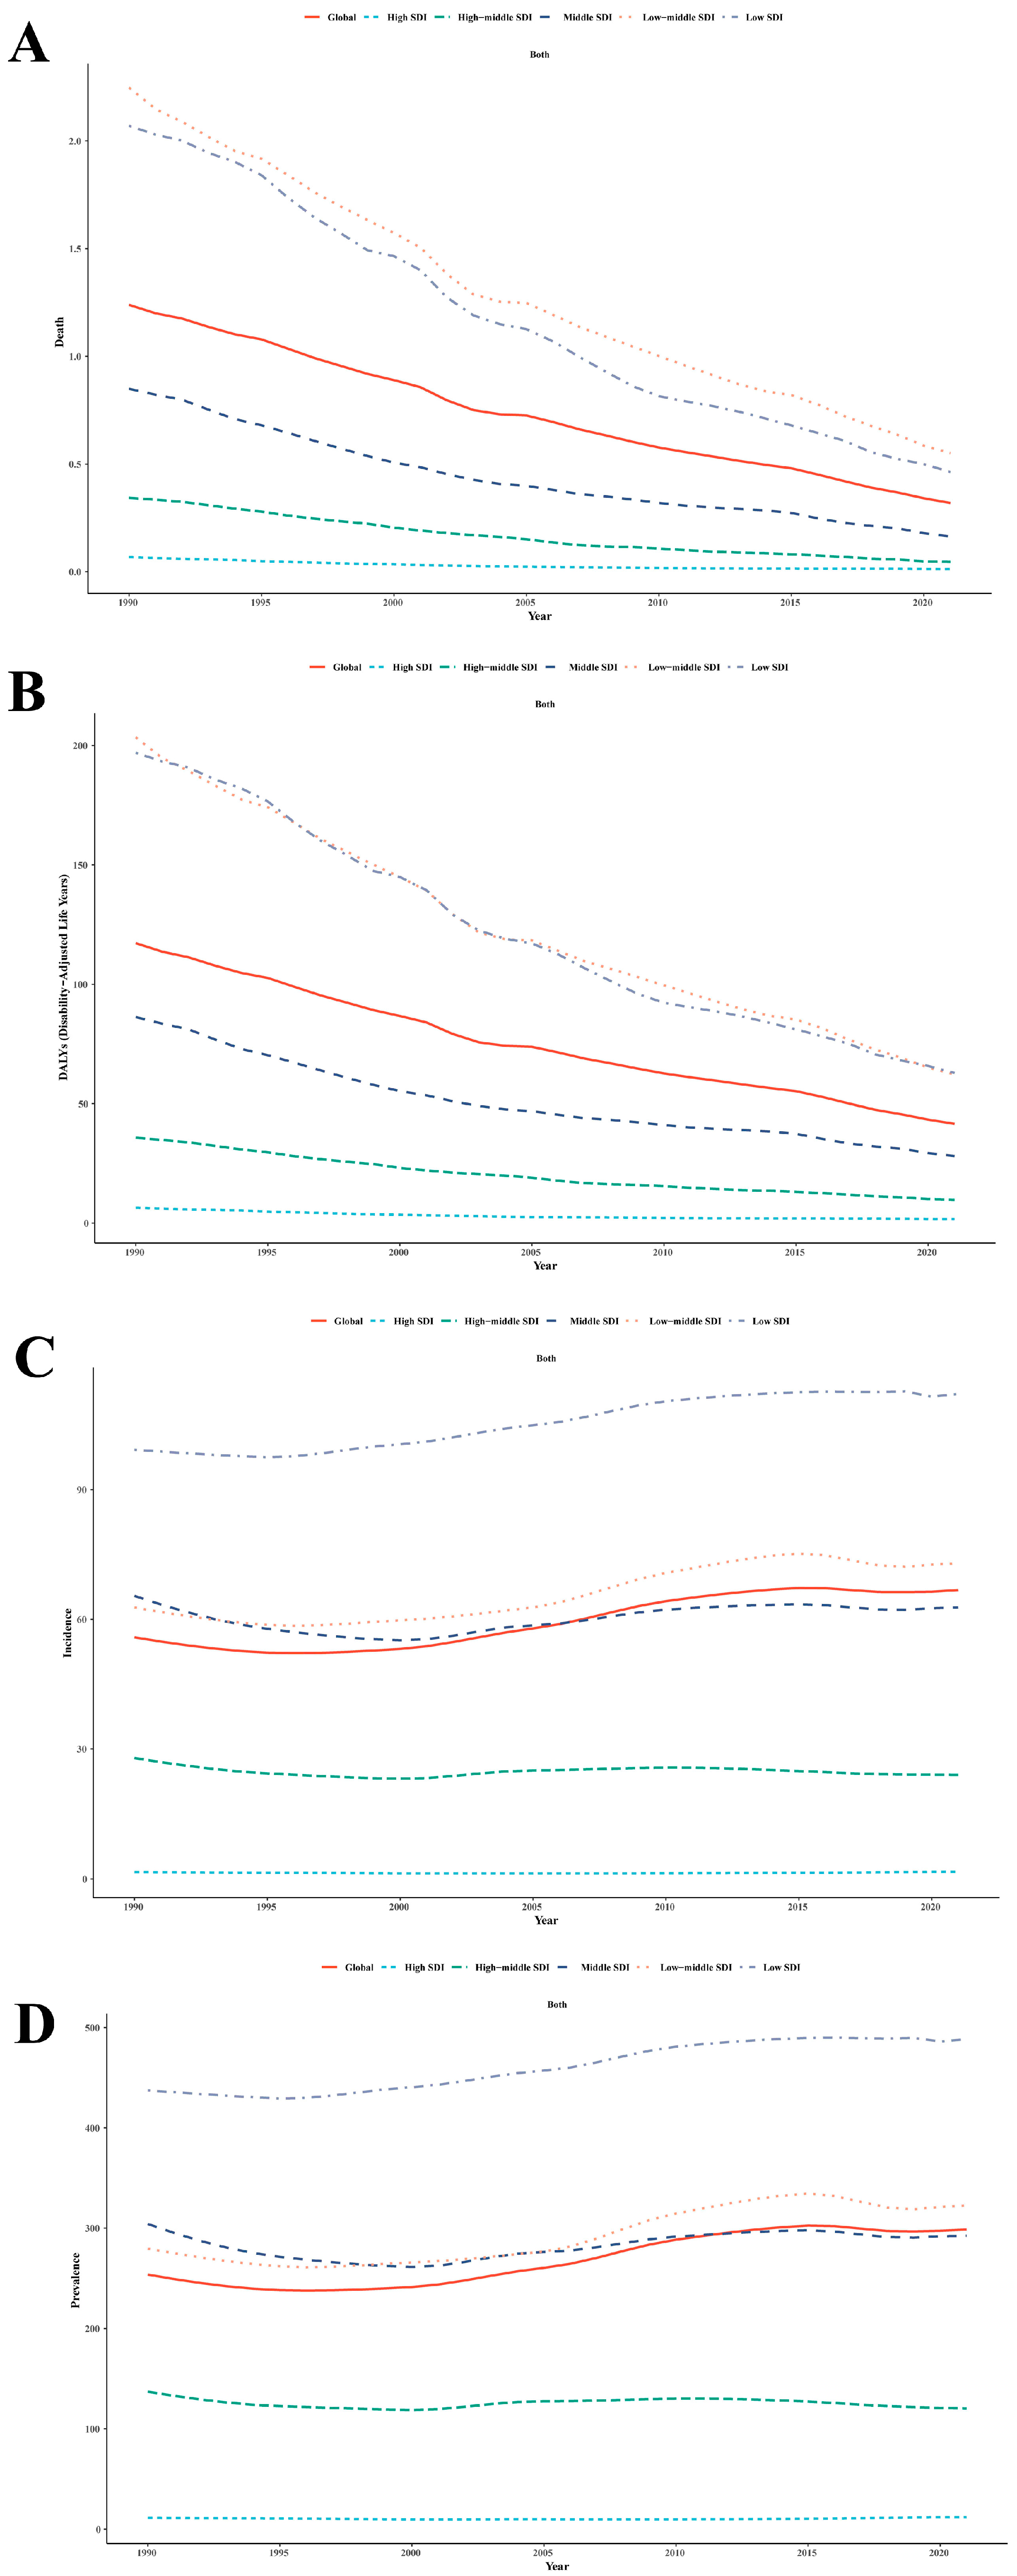
3.1. Global Trend
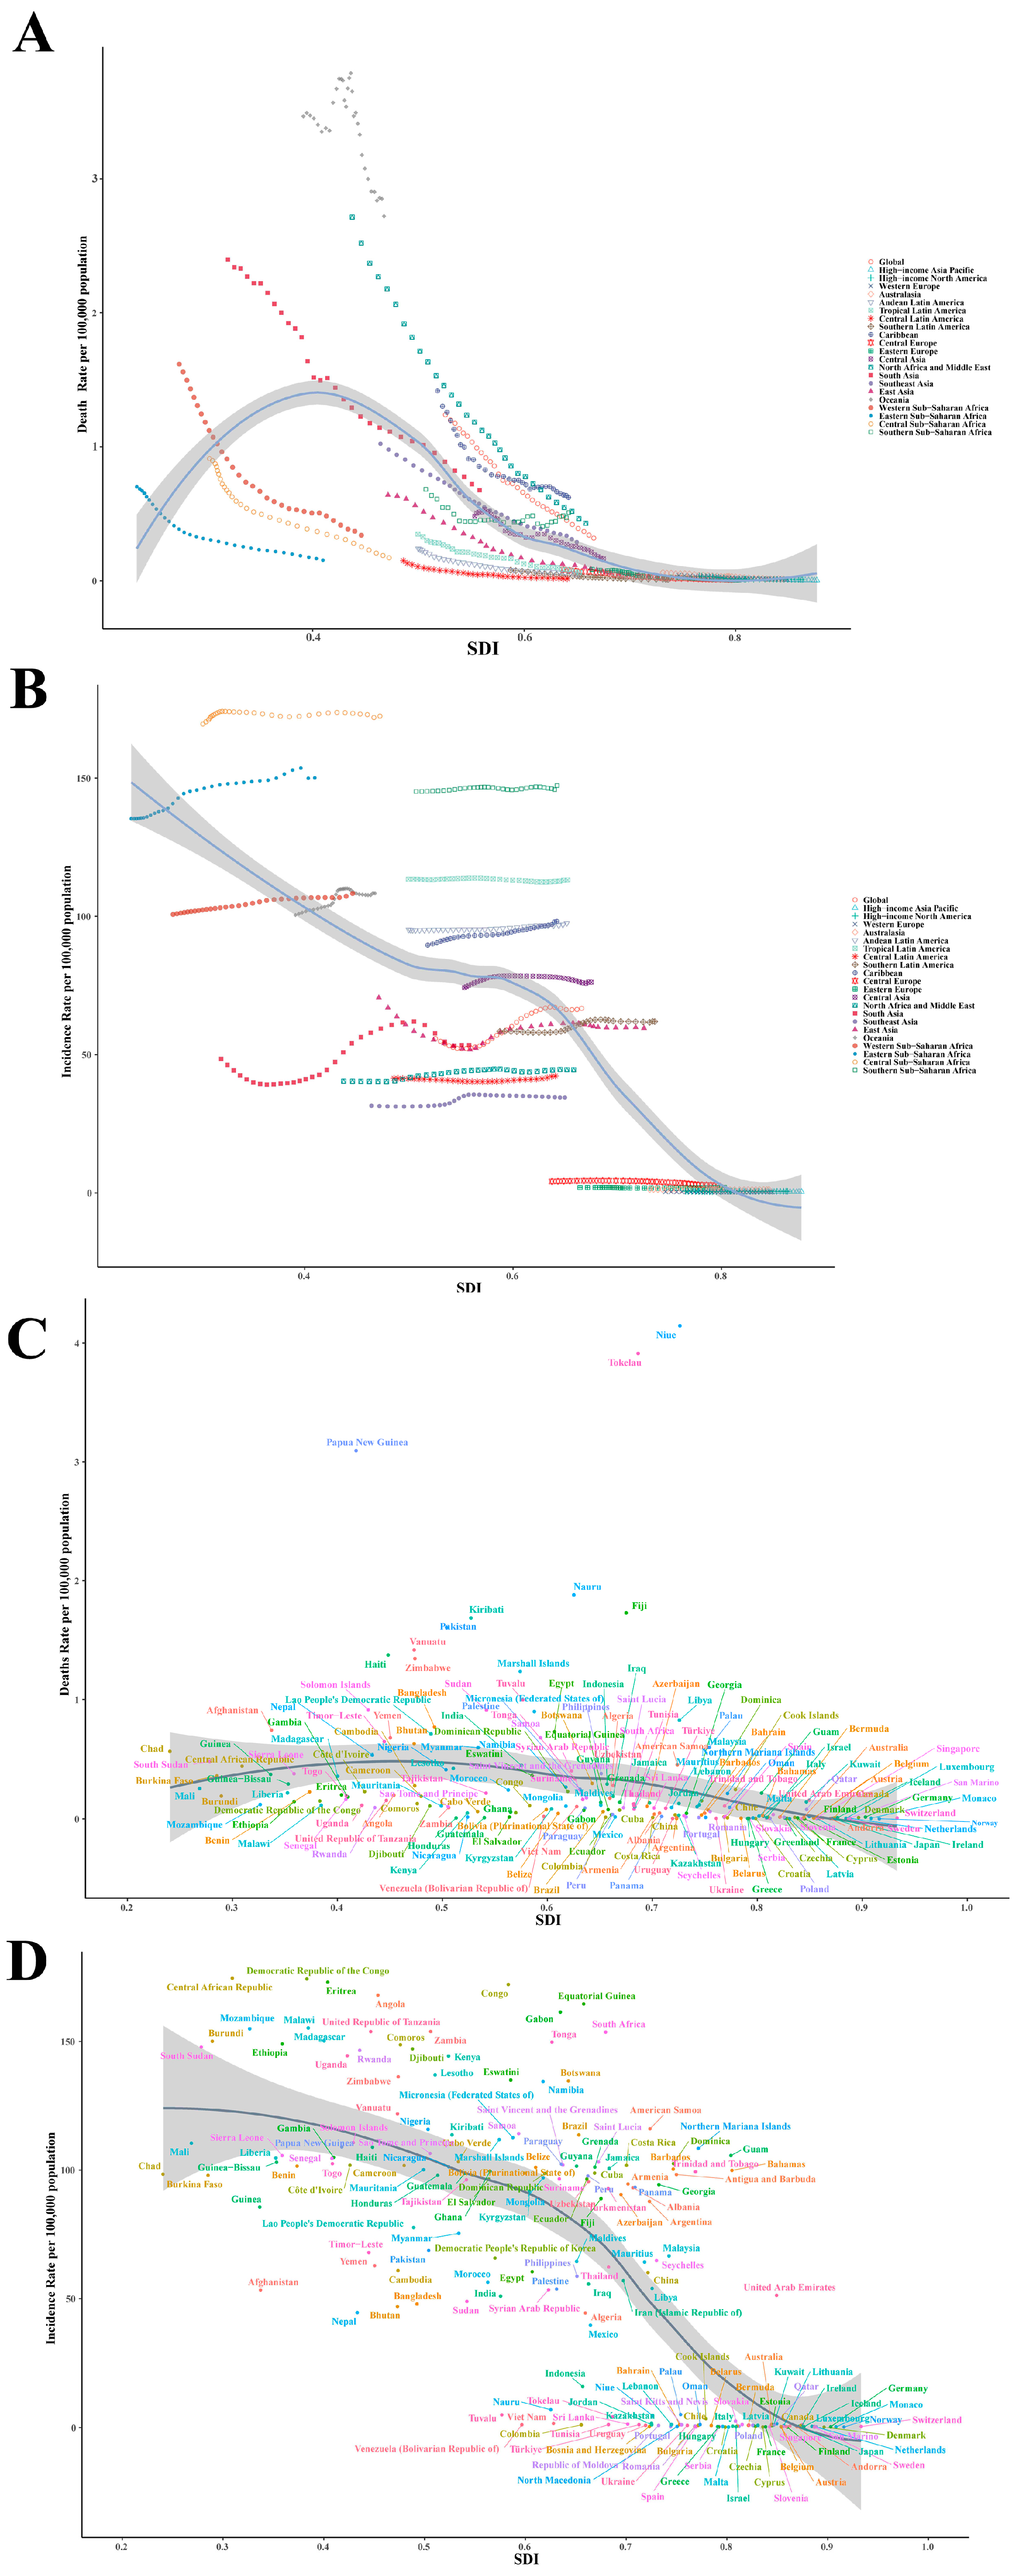
3.2. SDI Trend
3.2.1. Mortality
3.2.2. DALYs
3.2.3. Incidence
3.2.4. Prevalence
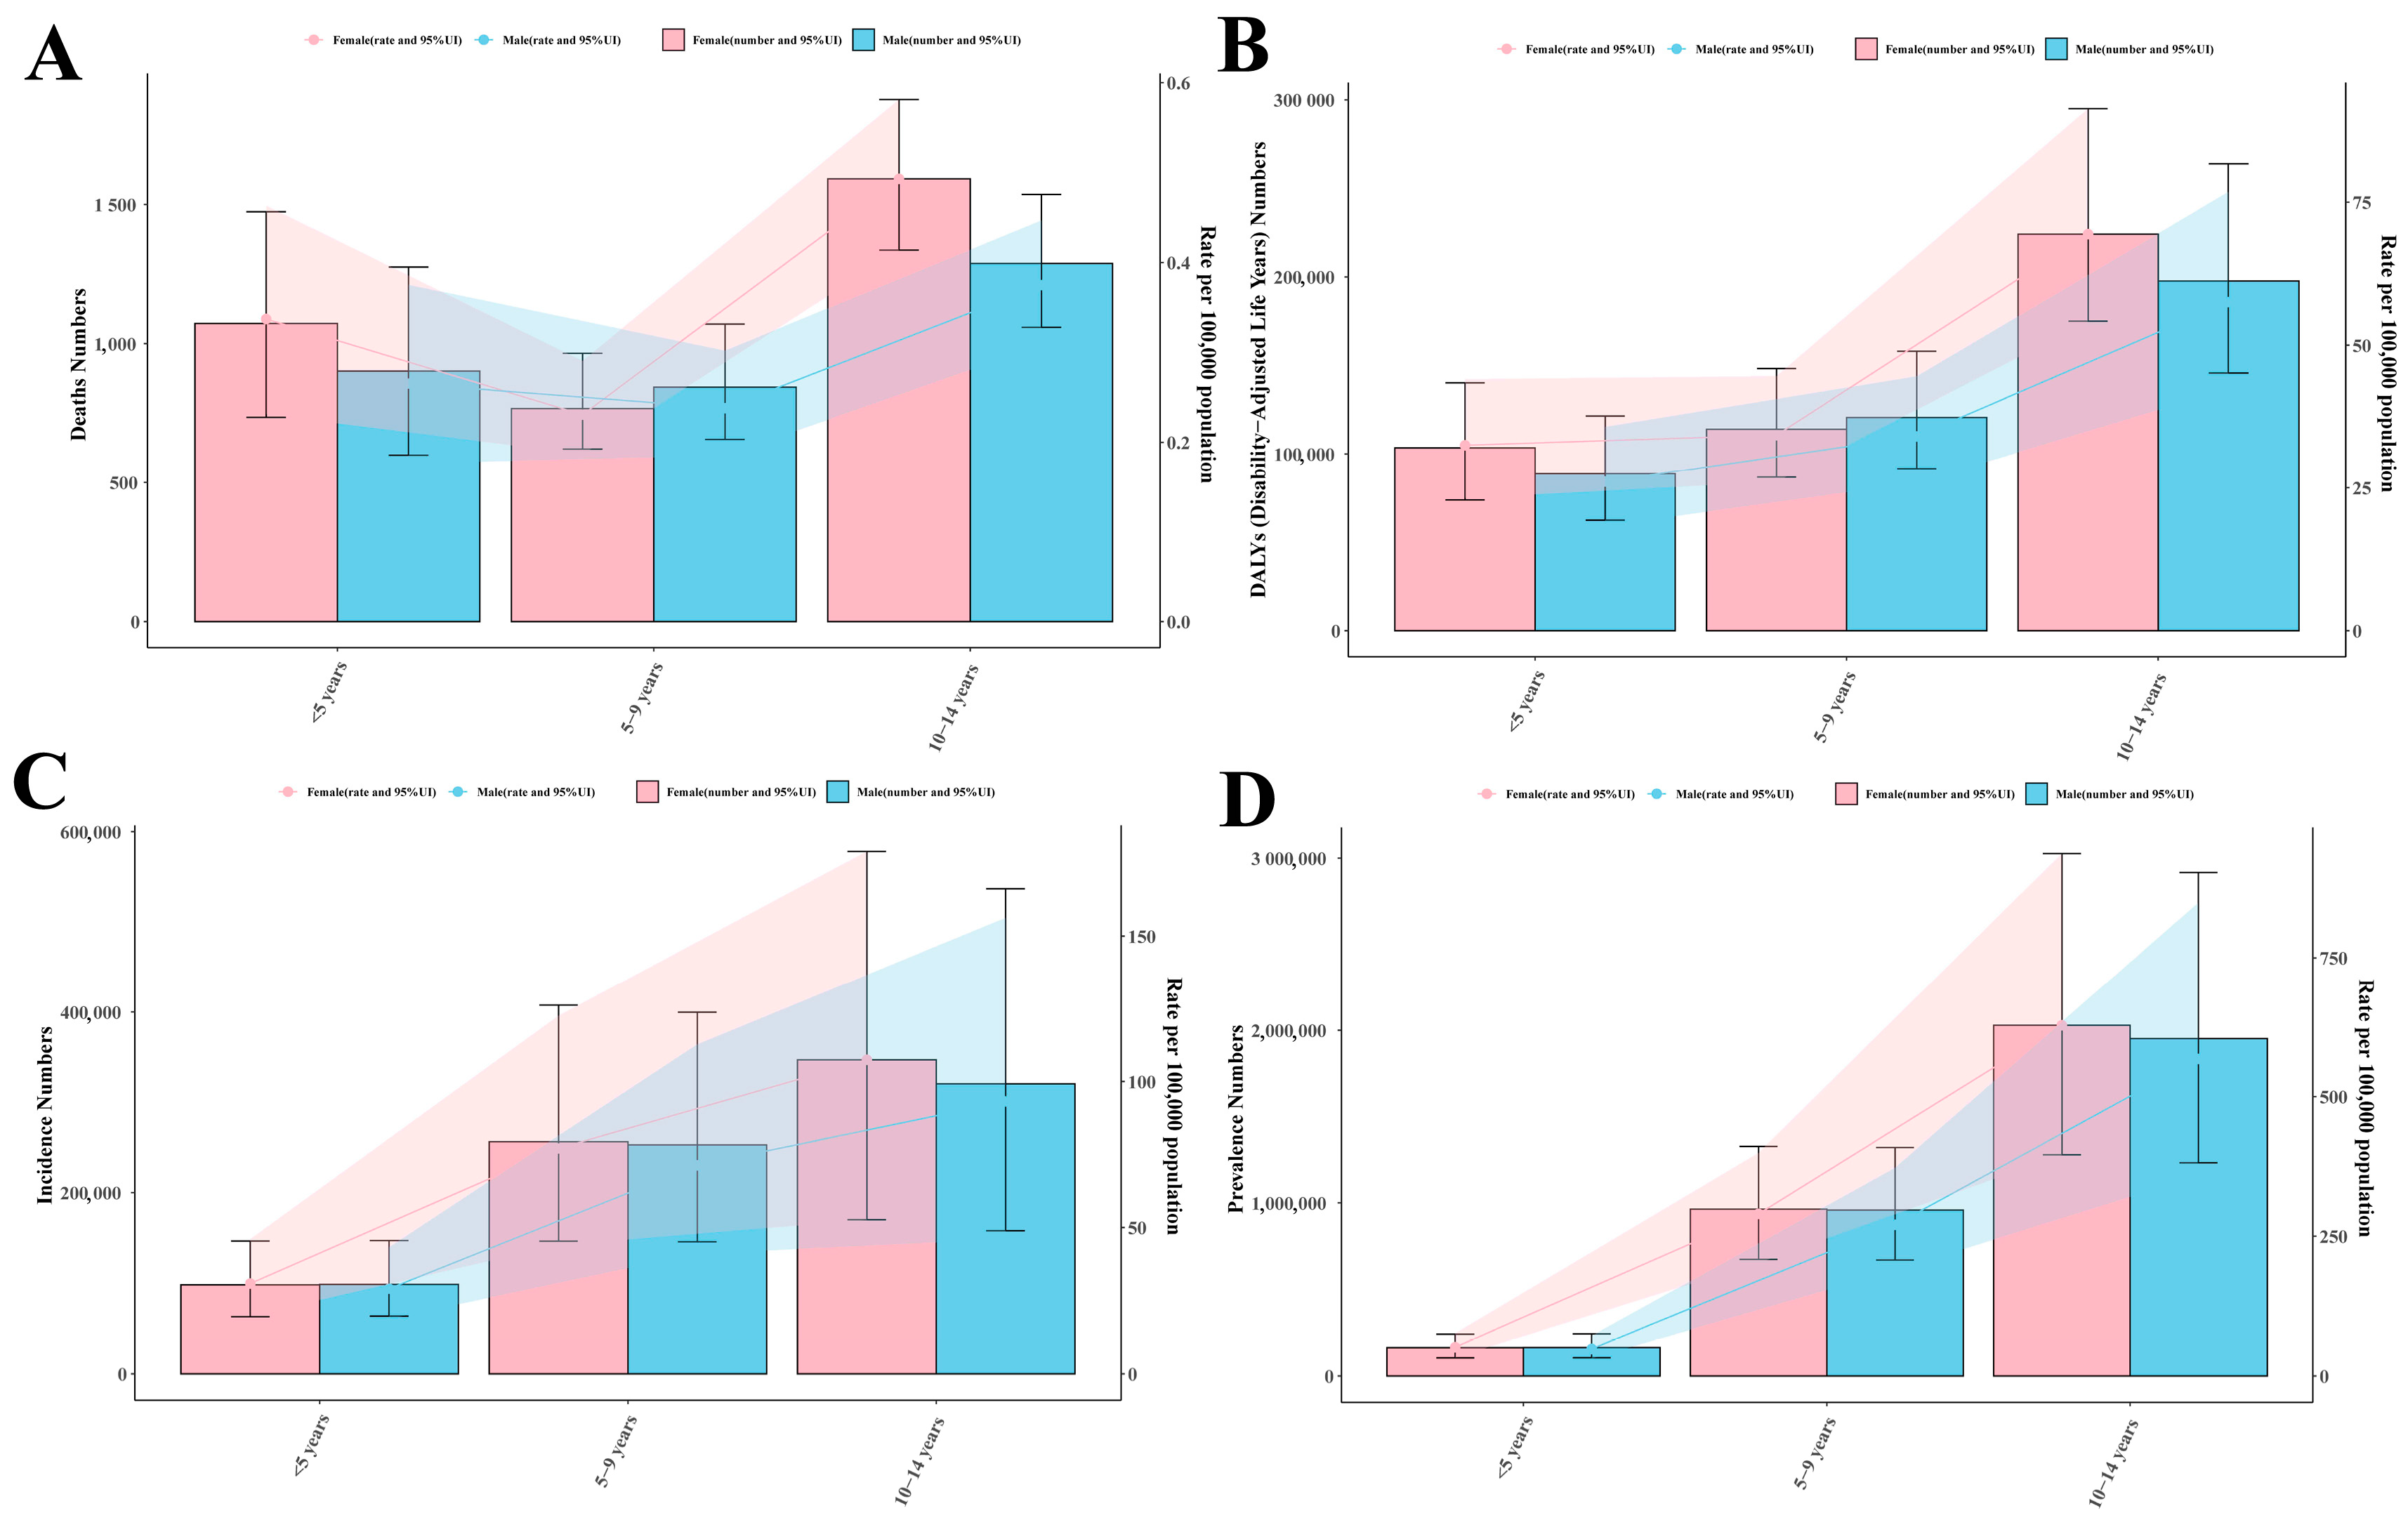
3.3. Sex and Region
Crowd Analysis
3.4. Regional Trends
3.4.1. Mortality

| Location | 1990 Cases | 1990 ASDR (per 100,000, 95% UI) | 2021 Cases | 2021 ASDR (per 100,000, 95% UI) | AAPC (%, 95% CI) |
|---|---|---|---|---|---|
| Global | 21,636.42 (17,028.38, 27,998.59) | 1.24 (0.95, 1.64) | 6465.27 (5289.96, 7791.63) | 0.32 (0.25, 0.39) | −4.27 (−4.45, −4.09) |
| High SDI | 125.77 (106.41, 152.88) | 0.07 (0.06, 0.08) | 20.19 (18.24, 22.40) | 0.01 (0.01, 0.01) | −5.59 (−5.89, −5.29) |
| High-middle SDI | 937.39 (810.46, 1123.91) | 0.34 (0.29, 0.42) | 106.88 (90.13, 125.67) | 0.05 (0.04, 0.06) | −6.42 (−6.68, −6.16) |
| Middle SDI | 4903.49 (4198.41, 5654.46) | 0.85 (0.71, 1.00) | 963.63 (807.55, 1113.94) | 0.16 (0.13, 0.19) | −5.12 (−5.31, −4.92) |
| Low-middle SDI | 10,699.14 (8312.89, 14051.33) | 2.25 (1.67, 3.06) | 3227.40 (2608.62, 3932.28) | 0.55 (0.43, 0.69) | −4.40 (−4.60, −4.21) |
| Low SDI | 4953.63 (3435.90, 7137.75) | 2.07 (1.39, 3.00) | 2136.88 (1546.24, 2877.39) | 0.46 (0.32, 0.64) | −4.70 (−5.06, −4.35) |
| Andean Latin America | 35.69 (28.37, 46.27) | 0.24 (0.18, 0.33) | 8.25 (6.51, 10.55) | 0.04 (0.03, 0.06) | −5.36 (−5.84, −4.88) |
| Australasia | 2.88 (2.58, 3.22) | 0.06 (0.05, 0.07) | 0.84 (0.72, 0.96) | 0.01 (0.01, 0.02) | −4.53 (−5.40, −3.67) |
| Caribbean | 162.75 (121.21, 215.74) | 1.42 (0.94, 2.00) | 72.21 (48.60, 96.22) | 0.62 (0.38, 0.93) | −2.55 (−2.77, −2.33) |
| Central Asia | 119.28 (108.18, 131.32) | 0.48 (0.43, 0.55) | 45.17 (38.33, 52.95) | 0.16 (0.13, 0.20) | −3.35 (−3.86, −2.84) |
| Central Europe | 25.26 (23.78, 26.84) | 0.08 (0.08, 0.09) | 1.53 (1.30, 1.73) | 0.01 (0.01, 0.01) | −6.86 (−7.49, −6.23) |
| Central Latin America | 96.67 (91.56, 102.78) | 0.15 (0.14, 0.16) | 10.35 (8.59, 12.00) | 0.02 (0.01, 0.02) | −6.74 (−7.34, −6.14) |
| Central Sub-Saharan Africa | 245.63 (145.05, 381.16) | 0.91 (0.43, 1.48) | 100.53 (64.12, 149.38) | 0.17 (0.10, 0.28) | −5.24 (−5.36, −5.12) |
| East Asia | 2118.96 (1755.79, 2532.71) | 0.64 (0.52, 0.78) | 93.34 (76.29, 116.63) | 0.03 (0.03, 0.04) | −9.06 (−9.51, −8.62) |
| Eastern Europe | 44.35 (43.18, 45.72) | 0.09 (0.08, 0.09) | 2.35 (2.16, 2.51) | 0.01 (0.01, 0.01) | −8.10 (−8.74, −7.46) |
| Eastern Sub-Saharan Africa | 662.13 (418.26, 952.56) | 0.70 (0.44, 1.02) | 275.02 (178.88, 433.77) | 0.15 (0.10, 0.25) | −4.76 (−4.86, −4.65) |
| High-income Asia Pacific | 8.81 (7.66, 10.14) | 0.02 (0.02, 0.03) | 1.00 (0.93, 1.09) | 0.00 (0.00, 0.00) | −5.54 (−5.93, −5.16) |
| High-income North America | 22.19 (21.54, 22.89) | 0.04 (0.03, 0.04) | 5.97 (5.41, 6.49) | 0.01 (0.01, 0.01) | −4.00 (−4.55, −3.45) |
| North Africa and Middle East | 3854.88 (2649.11, 5276.88) | 2.72 (1.76, 3.83) | 784.80 (576.34, 1112.06) | 0.43 (0.31, 0.64) | −5.73 (−5.89, −5.58) |
| Oceania | 92.14 (54.21, 135.66) | 3.47 (1.94, 5.40) | 136.21 (90.11, 196.92) | 2.72 (1.69, 4.12) | −0.73 (−1.09, −0.37) |
| South Asia | 10,457.83 (7480.77, 14,546.73) | 2.40 (1.64, 3.39) | 3496.39 (2710.85, 4474.48) | 0.68 (0.50, 0.89) | −3.99 (−4.29, −3.69) |
| Southeast Asia | 1758.27 (1366.44, 2170.03) | 1.02 (0.70, 1.30) | 519.71 (379.38, 636.76) | 0.29 (0.21, 0.37) | −3.94 (−4.11, −3.76) |
| Southern Latin America | 12.03 (10.80, 13.33) | 0.08 (0.07, 0.09) | 1.52 (1.30, 1.71) | 0.01 (0.01, 0.01) | −6.53 (−7.00, −6.05) |
| Southern Sub-Saharan Africa | 140.84 (108.48, 171.66) | 0.68 (0.48, 0.89) | 125.37 (97.35, 154.70) | 0.51 (0.37, 0.66) | −0.91 (−1.79, −0.04) |
| Tropical Latin America | 193.80 (175.92, 210.48) | 0.35 (0.31, 0.38) | 32.09 (26.88, 36.87) | 0.06 (0.05, 0.07) | −5.15 (−5.83, −4.47) |
| Western Europe | 28.99 (27.81, 30.36) | 0.04 (0.04, 0.04) | 7.72 (7.11, 8.35) | 0.01 (0.01, 0.01) | −4.14 (−4.64, −3.65) |
| Western Sub-Saharan Africa | 1553.03 (969.97, 2310.12) | 1.62 (0.97, 2.44) | 744.88 (418.53, 1043.30) | 0.34 (0.19, 0.50) | −4.92 (−5.07, −4.77) |
3.4.2. DALYs
3.4.3. Incidence
| Location | 1990 Cases | 1990 ASIR (per 100,000, 95% UI) | 2021 Cases | 2021 ASIR (per 100,000, 95% UI) | AAPC (%, 95% CI) |
|---|---|---|---|---|---|
| Global | 964,906.53 (612,864.83, 1,401,949.65) | 55.84 (30.74, 89.59) | 1,372,813.44 (855,165.80, 2,015,082.43) | 66.76 (36.40, 107.60) | 0.58 (0.51, 0.65) |
| High SDI | 2999.24 (2280.29, 3800.35) | 1.61 (1.07, 2.23) | 2913.40 (2158.15, 3815.08) | 1.68 (1.10, 2.34) | 0.16 (0.06, 0.25) |
| High-middle SDI | 77,049.13 (50,504.18, 110,713.83) | 27.88 (16.05, 43.56) | 57,333.11 (37,006.69, 83,380.04) | 24.00 (13.61, 37.99) | −0.49 (−0.60, −0.37) |
| Middle SDI | 378,595.58 (242,863.98, 551,449.88) | 65.38 (36.20, 104.59) | 368,120.29 (230,967.04, 538,617.54) | 62.75 (34.64, 100.51) | −0.13 (−0.20, −0.06) |
| Low-middle SDI | 290,038.70 (181,810.10, 422,916.15) | 62.73 (33.84, 101.46) | 432,380.50 (266,411.89, 638,413.08) | 72.97 (39.22, 117.42) | 0.47 (0.37, 0.57) |
| Low SDI | 215,495.28 (135,914.11, 311,256.28) | 99.21 (53.37, 159.11) | 511,030.60 (319,158.12, 744,664.27) | 112.14 (60.73, 180.56) | 0.40 (0.36, 0.45) |
| Andean Latin America | 14,067.94 (8792.05, 20,592.41) | 95.16 (52.46, 154.03) | 17,837.81 (11,138.45, 25,999.95) | 97.57 (53.56, 156.43) | 0.07 (0.05, 0.09) |
| Australasia | 58.20 (36.42, 87.27) | 1.28 (0.69, 2.11) | 68.47 (44.75, 100.30) | 1.22 (0.69, 1.95) | −0.13 (−0.18, −0.07) |
| Caribbean | 10,133.55 (6372.12, 14,705.63) | 89.56 (49.02, 143.98) | 11,466.74 (7043.67, 16,614.70) | 98.17 (53.04, 157.68) | 0.30 (0.27, 0.32) |
| Central Asia | 18,016.55 (11,650.95, 26,003.95) | 74.28 (41.11, 119.02) | 20,808.29 (13,221.22, 29,951.09) | 76.19 (41.90, 121.97) | 0.09 (0.07, 0.10) |
| Central Europe | 1261.07 (876.60, 1730.24) | 4.17 (2.51, 6.26) | 507.48 (351.59, 689.23) | 2.80 (1.70, 4.15) | −1.30 (−1.39, −1.21) |
| Central Latin America | 26,536.81 (16,685.35, 38,481.34) | 41.43 (23.08, 66.18) | 27,795.24 (17,333.39, 40,694.21) | 42.28 (23.37, 67.49) | 0.06 (0.02, 0.10) |
| Central Sub-Saharan Africa | 40,045.23 (26,112.58, 58,300.59) | 169.56 (93.45, 270.70) | 99,974.38 (63,171.12, 148,297.82) | 172.43 (94.78, 279.76) | 0.04 (0.02, 0.06) |
| East Asia | 233,315.59 (152,549.16, 337,600.98) | 70.63 (39.75, 110.98) | 165,066.52 (106,616.69, 238,929.23) | 59.60 (33.29, 94.08) | −0.50 (−0.64, −0.37) |
| Eastern Europe | 999.73 (767.37, 1292.24) | 1.93 (1.27, 2.73) | 725.50 (535.18, 941.00) | 2.00 (1.30, 2.85) | 0.11 (0.06, 0.17) |
| Eastern Sub-Saharan Africa | 116,098.77 (73,495.34, 166,583.75) | 135.31 (73.33, 215.63) | 265,831.73 (166,730.30, 387,394.78) | 150.11 (80.85, 240.75) | 0.34 (0.27, 0.40) |
| High-income Asia Pacific | 196.04 (132.44, 291.71) | 0.59 (0.34, 0.97) | 87.44 (63.82, 118.99) | 0.43 (0.27, 0.66) | −0.96 (−1.07, −0.86) |
| High-income North America | 373.39 (259.06, 538.37) | 0.60 (0.33, 0.98) | 365.32 (263.59, 487.45) | 0.57 (0.35, 0.88) | −0.10 (−0.25, 0.04) |
| North Africa and Middle East | 56,012.11 (36,577.32, 80,344.35) | 40.40 (22.44, 64.52) | 82,627.50 (52,206.73, 120,413.64) | 44.54 (24.00, 71.30) | 0.33 (0.24, 0.42) |
| Oceania | 2662.37 (1822.07, 3723.85) | 100.48 (58.94, 154.22) | 5421.94 (3657.68, 7504.45) | 108.34 (62.27, 166.66) | 0.24 (0.19, 0.30) |
| South Asia | 206,098.45 (125,421.57, 303,887.98) | 48.48 (25.34, 79.16) | 283,144.94 (168,573.24, 424,659.77) | 53.45 (27.90, 87.25) | 0.33 (0.04, 0.63) |
| Southeast Asia | 54,216.47 (34,649.23, 78,379.32) | 31.53 (17.47, 50.30) | 60,808.88 (38,560.46, 88,396.19) | 34.46 (19.12, 55.20) | 0.31 (0.26, 0.36) |
| Southern Latin America | 8767.66 (5607.76, 12581.11) | 58.42 (32.57, 92.74) | 9401.80 (5899.63, 13,696.28) | 61.97 (34.82, 98.49) | 0.19 (0.17, 0.22) |
| Southern Sub-Saharan Africa | 29,675.76 (18,789.85, 43,305.38) | 145.15 (80.47, 233.94) | 36,100.65 (22,949.18, 53,310.74) | 147.30 (80.69, 237.49) | 0.04 (0.01, 0.08) |
| Tropical Latin America | 62,749.35 (39,463.29, 92,309.10) | 113.44 (61.83, 181.79) | 57,405.02 (36,170.54, 83,858.05) | 113.20 (61.89, 181.94) | −0.01 (−0.01, −0.00) |
| Western Europe | 295.88 (199.42, 435.06) | 0.43 (0.23, 0.72) | 209.32 (140.09, 304.04) | 0.32 (0.17, 0.53) | −0.78 (−1.01, −0.55) |
| Western Sub-Saharan Africa | 83,325.58 (53,319.15, 120,663.67) | 100.69 (55.03, 162.25) | 227,158.48 (143,526.47, 329,674.35) | 108.28 (59.32, 174.54) | 0.21 (0.17, 0.25) |
3.4.4. Prevalence
3.5. National Variation
3.5.1. Mortality
3.5.2. DALYs
3.5.3. Incidence
3.5.4. Prevalence
3.5.5. AAPC Changes
3.5.6. APC Analysis
3.5.7. Inequality Analysis
4. Discussion
5. Conclusions and Perspectives
Supplementary Materials
Author Contributions
Funding
Institutional Review Board Statement
Informed Consent Statement
Data Availability Statement
Conflicts of Interest
References
- Kumar, R.K.; Antunes, M.J.; Beaton, A.; Mirabel, M.; Nkomo, V.T.; Okello, E.; Regmi, P.R.; Reményi, B.; Sliwa-Hähnle, K.; Zühlke, L.J.J.C. Contemporary diagnosis and management of rheumatic heart disease: Implications for closing the gap: A scientific statement from the American Heart Association. Circulation 2020, 142, e337–e357. [Google Scholar] [CrossRef] [PubMed]
- Marijon, E.; Mocumbi, A.; Narayanan, K.; Jouven, X.; Celermajer, D.S. Persisting burden and challenges of rheumatic heart disease. Eur. Heart J. 2021, 42, 3338–3348. [Google Scholar] [CrossRef]
- Noubiap, J.J.; Agbor, V.N.; Bigna, J.J.; Kaze, A.D.; Nyaga, U.F.; Mayosi, B.M. Prevalence and progression of rheumatic heart disease: A global systematic review and meta-analysis of population-based echocardiographic studies. Sci. Rep. 2019, 9, 17022. [Google Scholar] [CrossRef]
- Watkins, D.A.; Johnson, C.O.; Colquhoun, S.M.; Karthikeyan, G.; Beaton, A.; Bukhman, G.; Forouzanfar, M.H.; Longenecker, C.T.; Mayosi, B.M.; Mensah, G.A.; et al. Global, Regional, and National Burden of Rheumatic Heart Disease, 1990–2015. N. Engl. J. Med. 2017, 377, 713–722. [Google Scholar] [CrossRef]
- Ruan, R.; Liu, X.; Zhang, Y.; Tang, M.; He, B.; Zhang, Q.W.; Shu, T. Global, regional, and national advances toward the management of rheumatic heart disease based on the Global Burden of Disease Study 2019. J. Am. Heart Assoc. 2023, 12, e028921. [Google Scholar] [CrossRef]
- Laudari, S.; Tiwari, K.K.; Pazdernik, M.; Sharma, S.K. Rheumatic heart disease screening among school children in Central Nepal. JACC Case Rep. 2019, 1, 218–220. [Google Scholar] [CrossRef] [PubMed]
- Remenyi, B.; Carapetis, J.; Wyber, R.; Taubert, K.; Mayosi, B.M. Position statement of the World Heart Federation on the prevention and control of rheumatic heart disease. Nat. Rev. Cardiol. 2013, 10, 284–292. [Google Scholar] [CrossRef] [PubMed]
- Wyber, R.; Noonan, K.; Halkon, C.; Enkel, S.; Cannon, J.; Haynes, E.; Mitchell, A.G.; Bessarab, D.C.; Katzenellenbogen, J.M.; Bond-Smith, D. Ending rheumatic heart disease in Australia: The evidence for a new approach. Med. J. Aust. 2020, 213, S3–S31. [Google Scholar] [CrossRef]
- Abouzeid, M.; Wyber, R.; La Vincente, S.; Sliwa, K.; Zühlke, L.; Mayosi, B.; Carapetis, J. Time to tackle rheumatic heart disease: Data needed to drive global policy dialogues. Glob. Public Health 2019, 14, 456–468. [Google Scholar] [CrossRef]
- Milutinovic, S.; Petrovic, M.; Ziq, A.; Sanchez, C.; Hammami, A.S.; Escarcega, R.O.; Begosh-Mayne, D.; Wood, M.J.; Chazal, R.A.; Lopez-Mattei, J. Rheumatic Heart Disease Burden: A Comparative Analysis between the United States and the European Union. JACC Adv. 2024, 3, 101393. [Google Scholar] [CrossRef]
- IHME. Global Burden of Disease Study 2021 (GBD 2021); IHME, University of Washington: Seattle, WA, USA, 2024; Available online: https://vizhub.healthdata.org/gbd-results/ (accessed on 9 April 2025).
- Deng, J.; Zhang, H.; Wang, Y.; Liu, Q.; Du, M.; Yan, W.; Qin, C.; Zhang, S.; Chen, W.; Zhou, L.; et al. Global, regional, and national burden of dengue infection in children and adolescents: An analysis of the Global Burden of Disease Study 2021. eClinicalMedicine 2024, 78, 102943. [Google Scholar] [CrossRef] [PubMed]
- GBD 2021 Risk Factors Collaborators. Global burden and strength of evidence for 88 risk factors in 204 countries and 811 subnational locations, 1990–2021: A systematic analysis for the Global Burden of Disease Study 2021. Lancet 2024, 403, 2162–2203. [Google Scholar] [CrossRef]
- GBD 2021 Urolithiasis Collaborators. The global, regional, and national burden of urolithiasis in 204 countries and territories, 2000–2021: A systematic analysis for the Global Burden of Disease Study 2021. eClinicalMedicine 2024, 78, 102924. [Google Scholar]
- World Health Organization. Global Health Observatory Data Repository; WHO: Geneva, Switzerland, 2024; Available online: https://www.who.int/data/gho/ (accessed on 9 April 2025).
- Kim, H.J.; Fay, M.P.; Feuer, E.J.; Midthune, D.N. Permutation tests for joinpoint regression with applications to cancer rates. Stat. Med. 2000, 19, 335–351. [Google Scholar] [CrossRef]
- Clegg, L.X.; Hankey, B.F.; Tiwari, R.; Feuer, E.J.; Edwards, B.K. Estimating average annual per cent change in trend analysis. Stat. Med. 2009, 28, 3670–3682. [Google Scholar] [CrossRef] [PubMed]
- Muggeo, V.M. Comment on ‘Estimating average annual per cent change in trend analysis’ by Clegg LX, Hankey BF, Tiwari R, Feuer EJ, Edwards BK, Statistics in Medicine 2009; 28: 3670–3682. Stat. Med. 2010, 29, 1958–1960. [Google Scholar] [CrossRef]
- Zou, Z.; Cini, K.; Dong, B.; Ma, Y.; Ma, J.; Burgner, D.P.; Patton, G.C. Time Trends in Cardiovascular Disease Mortality Across the BRICS: An Age-Period-Cohort Analysis of Key Nations With Emerging Economies Using the Global Burden of Disease Study 2017. Circulation 2020, 141, 790–799. [Google Scholar] [CrossRef]
- Yaya, S.; Uthman, O.A.; Amouzou, A.; Ekholuenetale, M.; Bishwajit, G. Inequalities in maternal health care utilization in Benin: A population based cross-sectional study. Childbirth 2018, 18, 1–9. [Google Scholar] [CrossRef]
- Jiang, C.Y.; Han, K.; Yang, F.; Yin, S.Y.; Zhang, L.; Liang, B.Y.; Wang, T.B.; Jiang, T.; Chen, Y.R.; Shi, T.Y.; et al. Global, regional, and national prevalence of hearing loss from 1990 to 2019: A trend and health inequality analyses based on the Global Burden of Disease Study 2019. Ageing Res. Rev. 2023, 92, 102124. [Google Scholar] [CrossRef]
- Carapetis, J.R.; Steer, A.C.; Mulholland, E.K.; Weber, M. The global burden of group A streptococcal diseases. Lancet Infect. Dis. 2005, 5, 685–694. [Google Scholar] [CrossRef]
- Reményi, B.; Wilson, N.; Steer, A.; Ferreira, B.; Kado, J.; Kumar, K.; Lawrenson, J.; Maguire, G.; Marijon, E.; Mirabel, M.; et al. World Heart Federation criteria for echocardiographic diagnosis of rheumatic heart disease—An evidence-based guideline. Nat. Rev. Cardiol. 2012, 9, 297–309. [Google Scholar] [CrossRef] [PubMed]
- Ralph, A.P.; Fittock, M.; Schultz, R.; Thompson, D.; Dowden, M.; Clemens, T.; Parnaby, M.G.; Clark, M.; McDonald, M.I.; Edwards, K.N. Improvement in rheumatic fever and rheumatic heart disease management and prevention using a health centre-based continuous quality improvement approach. BMC Health Serv. Res. 2013, 13, 525. [Google Scholar] [CrossRef] [PubMed]
- Rwebembera, J.; Nascimento, B.R.; Minja, N.W.; de Loizaga, S.; Aliku, T.; Dos Santos, L.P.A.; Galdino, B.F.; Corte, L.S.; Silva, V.R.; Chang, A.Y. Recent advances in the rheumatic fever and rheumatic heart disease continuum. Pathogens 2022, 11, 179. [Google Scholar] [CrossRef]
- Palafox, B.; Mocumbi, A.O.; Kumar, R.K.; Ali, S.K.; Kennedy, E.; Haileamlak, A.; Watkins, D.; Petricca, K.; Wyber, R.; Timeon, P. The WHF roadmap for reducing CV morbidity and mortality through prevention and control of RHD. Glob. Heart 2017, 12, 47–62. [Google Scholar] [CrossRef] [PubMed]
- Rothenbühler, M.; O’Sullivan, C.J.; Stortecky, S.; Stefanini, G.G.; Spitzer, E.; Estill, J.; Shrestha, N.R.; Keiser, O.; Jüni, P.; Pilgrim, T. Active surveillance for rheumatic heart disease in endemic regions: A systematic review and meta-analysis of prevalence among children and adolescents. Lancet Glob. Health 2014, 2, e717–e726. [Google Scholar] [CrossRef]
- Alhuneafat, L.; Ta’ani, O.A.; Tarawneh, T.; ElHamdani, A.; Al-Adayleh, R.; Al-Ajlouni, Y.; Naser, A.; Al-Abdouh, A.; Amoateng, R.; Taffe, K.; et al. Burden of cardiovascular disease in Sub-Saharan Africa, 1990–2019: An analysis of the Global Burden of Disease Study. Curr. Probl. Cardiol. 2024, 49, 102557. [Google Scholar] [CrossRef]
- Ali, S.; Misganaw, A.; Worku, A.; Destaw, Z.; Negash, L.; Bekele, A.; Briant, P.S.; Johnson, C.O.; Alam, T.; Odell, C.; et al. The burden of cardiovascular diseases in Ethiopia from 1990 to 2017: Evidence from the Global Burden of Disease Study. Int. Health 2021, 13, 318–326. [Google Scholar] [CrossRef]


Disclaimer/Publisher’s Note: The statements, opinions and data contained in all publications are solely those of the individual author(s) and contributor(s) and not of MDPI and/or the editor(s). MDPI and/or the editor(s) disclaim responsibility for any injury to people or property resulting from any ideas, methods, instructions or products referred to in the content. |
© 2025 by the authors. Licensee MDPI, Basel, Switzerland. This article is an open access article distributed under the terms and conditions of the Creative Commons Attribution (CC BY) license (https://creativecommons.org/licenses/by/4.0/).
Share and Cite
Tang, Z.; Wang, Z.; Wang, X. Global Burden of Pediatric Rheumatic Heart Disease, 1990–2021: Analysis of the GBD 2021 Study. Children 2025, 12, 843. https://doi.org/10.3390/children12070843
Tang Z, Wang Z, Wang X. Global Burden of Pediatric Rheumatic Heart Disease, 1990–2021: Analysis of the GBD 2021 Study. Children. 2025; 12(7):843. https://doi.org/10.3390/children12070843
Chicago/Turabian StyleTang, Ze, Ziwei Wang, and Xinbao Wang. 2025. "Global Burden of Pediatric Rheumatic Heart Disease, 1990–2021: Analysis of the GBD 2021 Study" Children 12, no. 7: 843. https://doi.org/10.3390/children12070843
APA StyleTang, Z., Wang, Z., & Wang, X. (2025). Global Burden of Pediatric Rheumatic Heart Disease, 1990–2021: Analysis of the GBD 2021 Study. Children, 12(7), 843. https://doi.org/10.3390/children12070843