
Associations of Morphological Changes in Skeletal Muscles of Preschool Children in China Following Physical Activity

 and
and 
Abstract
:1. Background
- (1)
- Evaluate the skeletal muscle thickness and objectively measure PA;
- (2)
- Assess whether associations exist between site-specific muscle thickness and level of PA with regard to sex and weight status in preschool children aged 3 to 4 years.
2. Methods
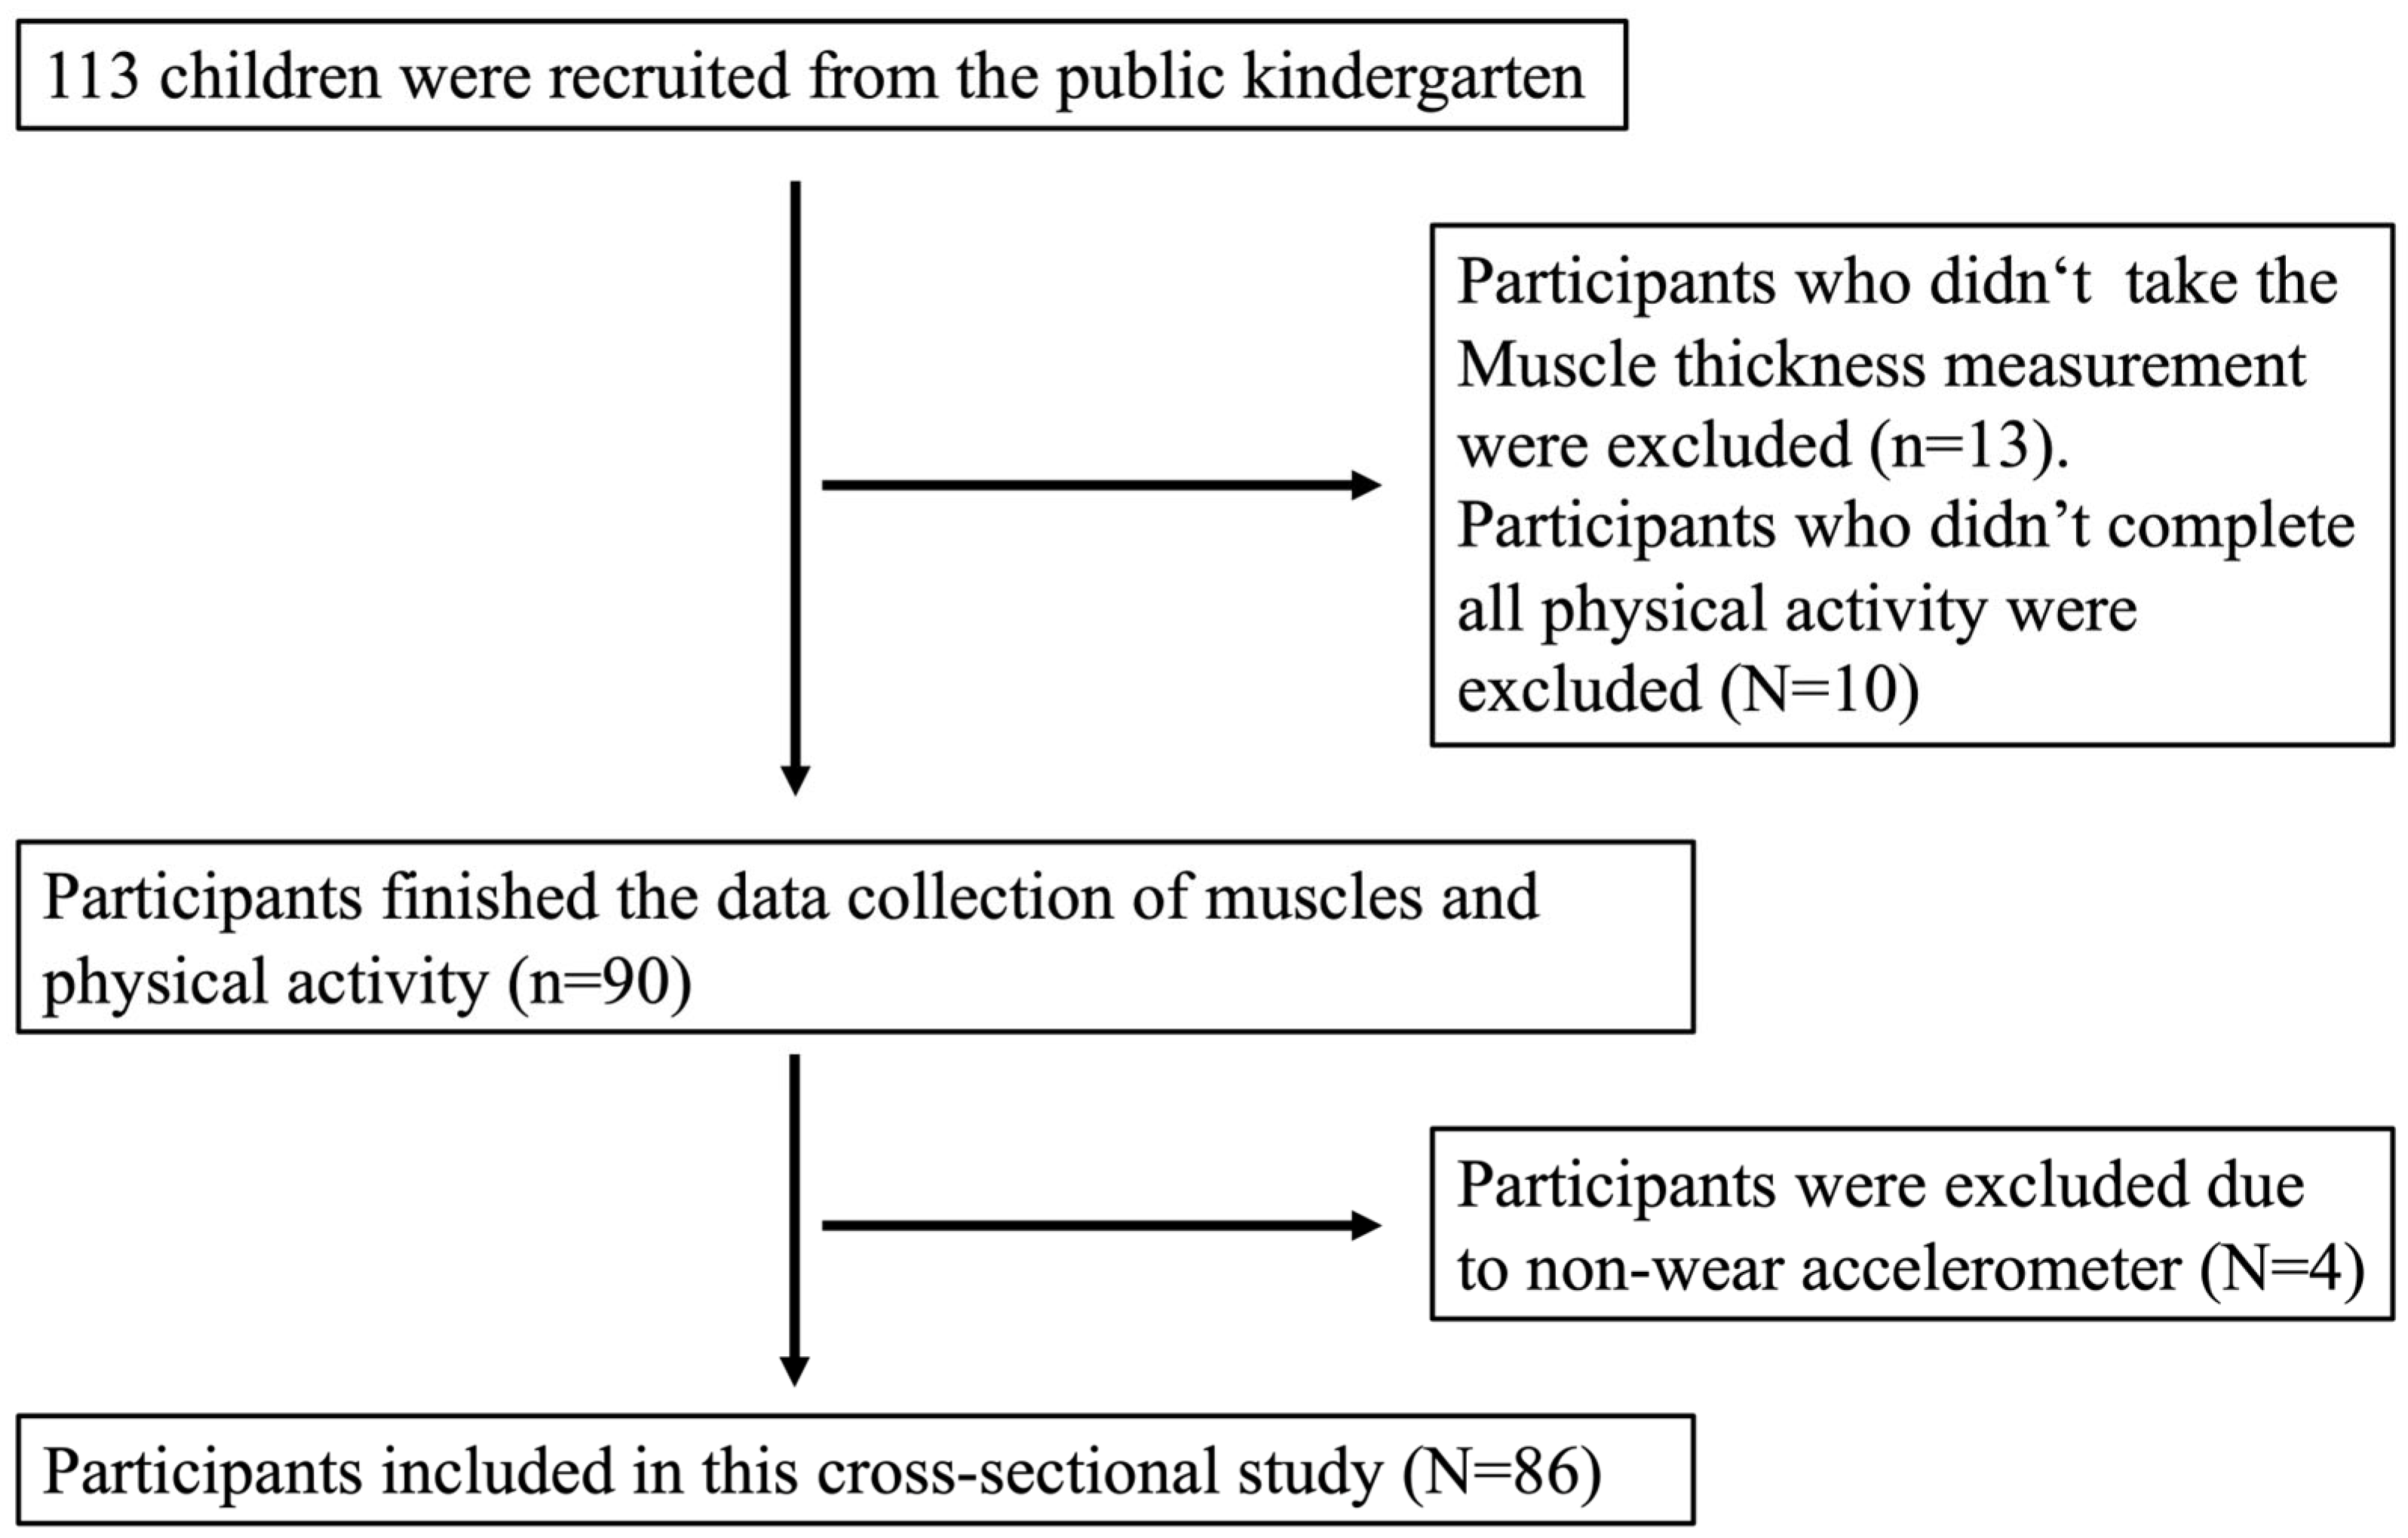
2.1. Participants
2.2. Anthropometrics Data
2.3. Muscle Thickness
2.4. Physical Activity
2.5. Data Analysis
3. Results
3.1. Participant Characteristics
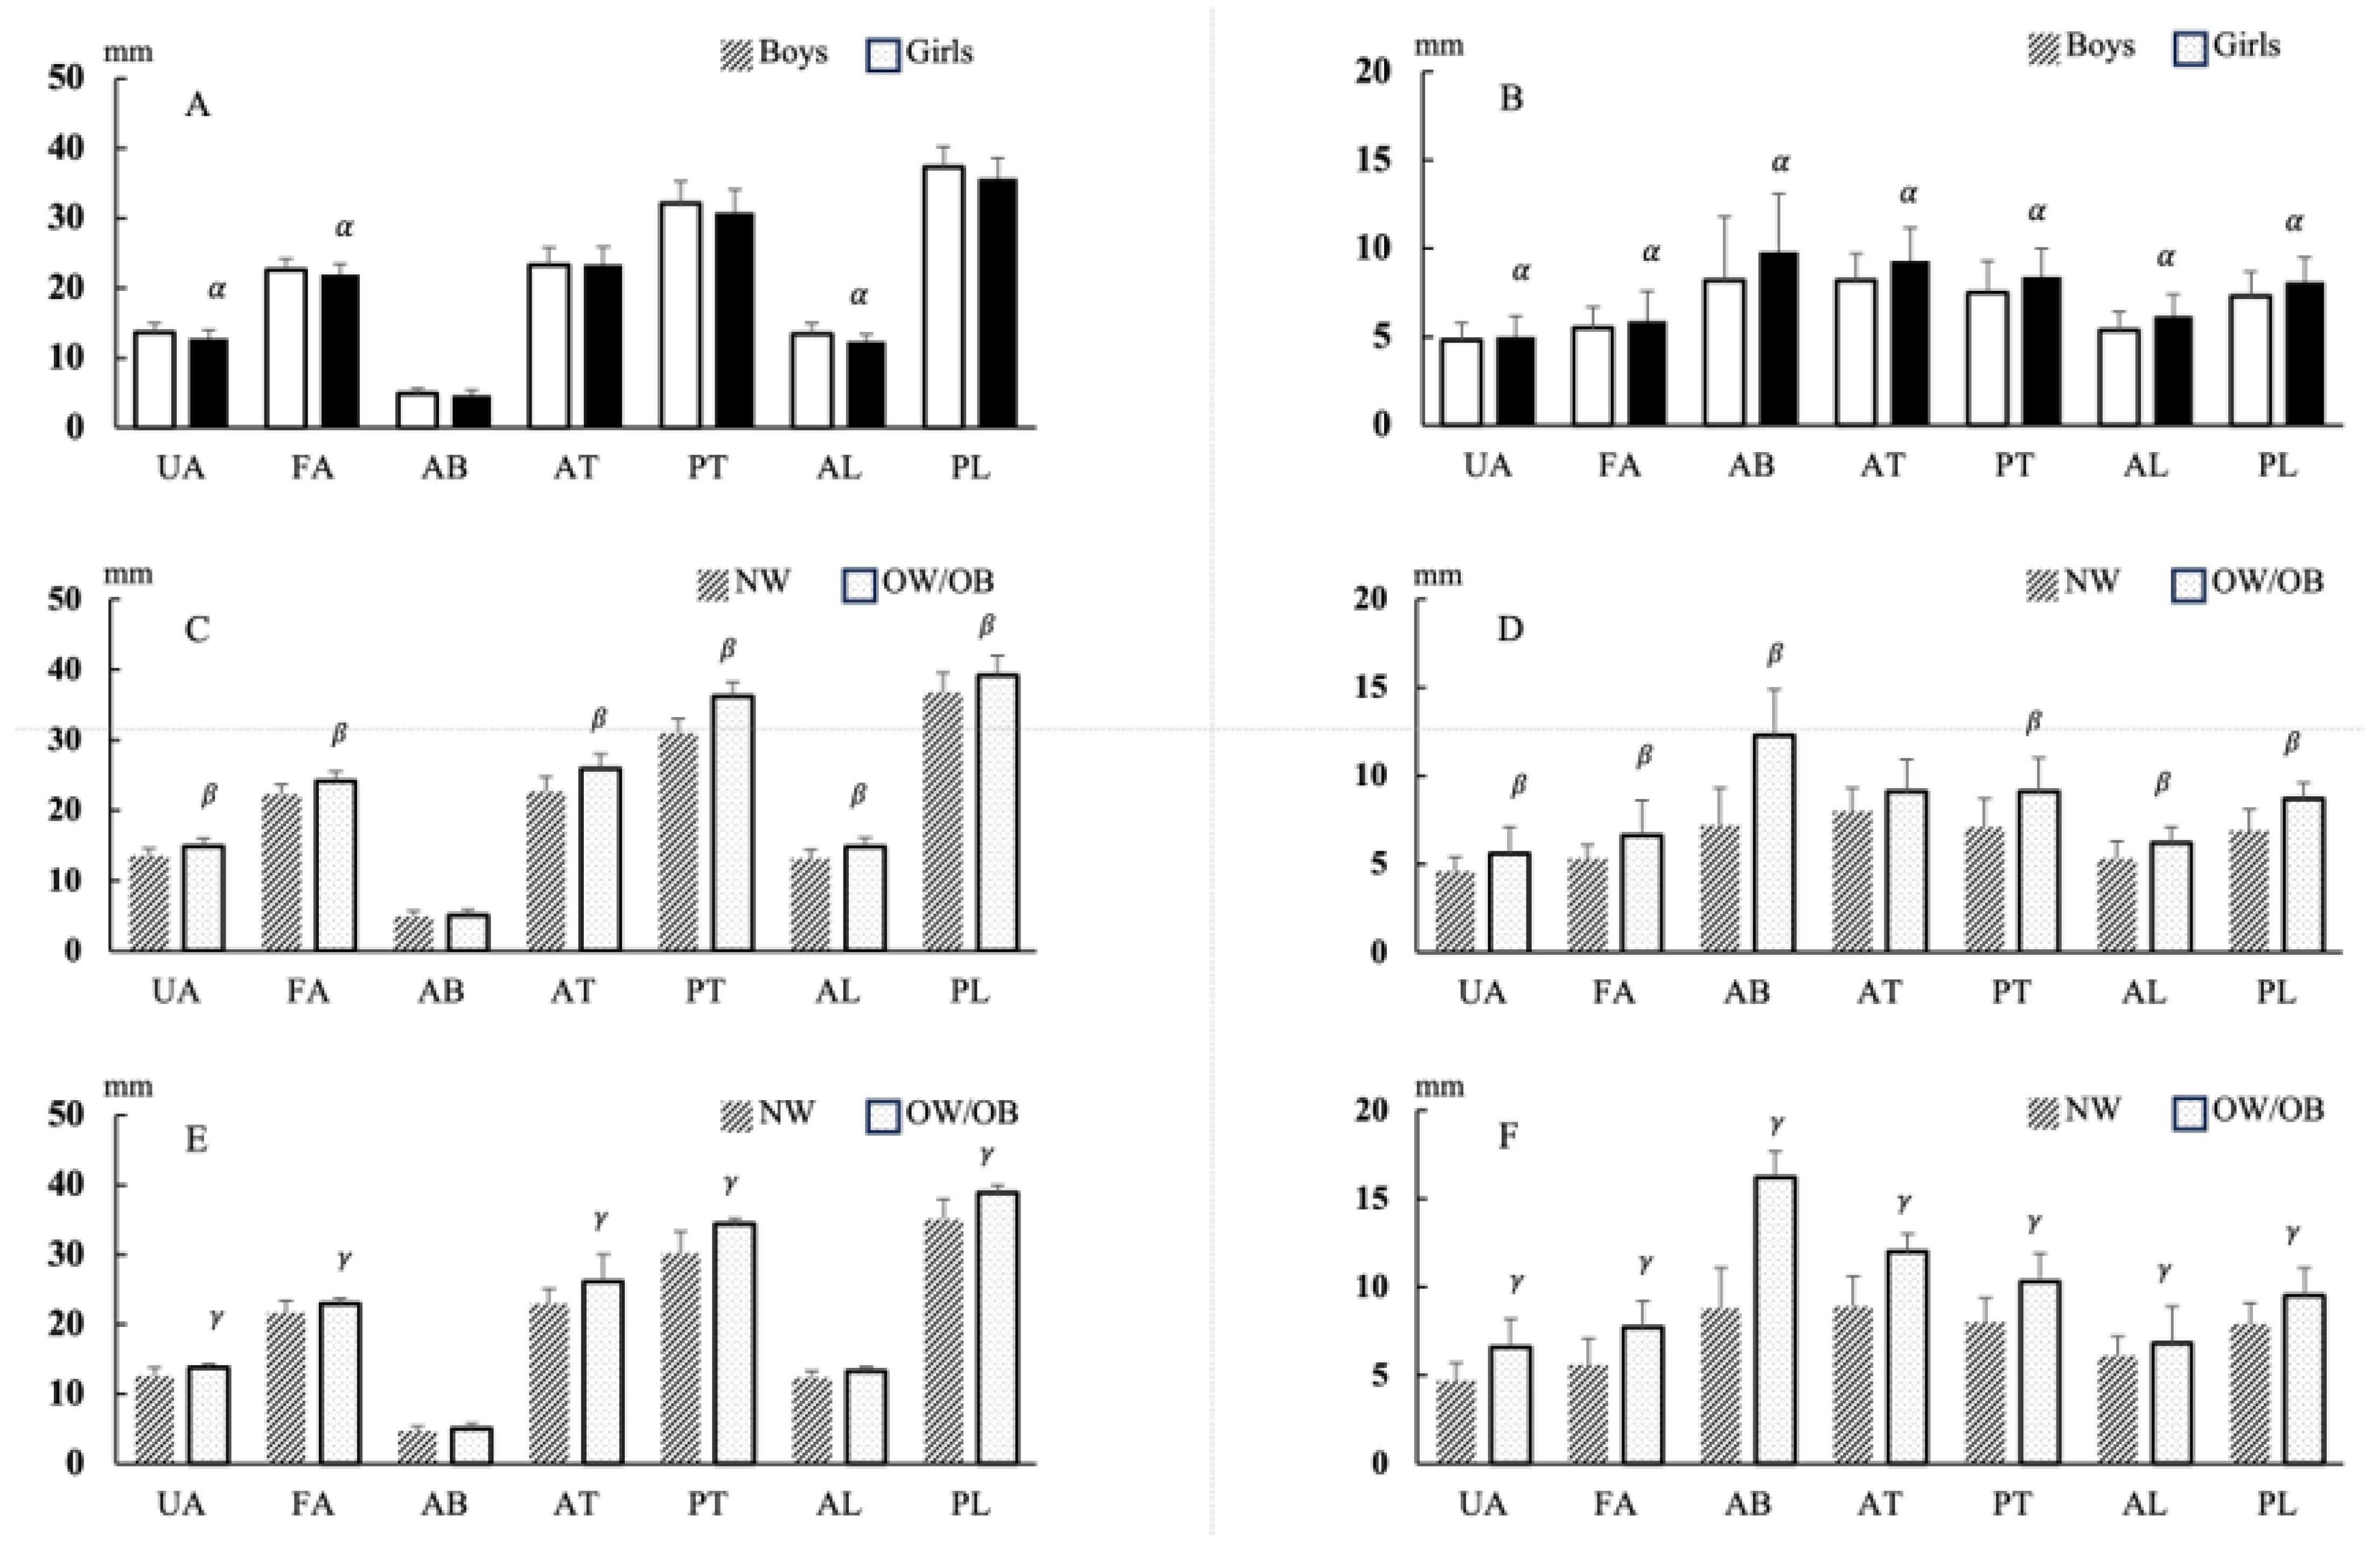
3.2. Muscle Thickness and Fat Thickness Values
3.3. Daily Physical Activity Outcomes
3.4. Association between Muscle Thickness and Fat Thickness Values in Line with Physical Activity
4. Discussion
5. Conclusions
Supplementary Materials
Author Contributions
Funding
Institutional Review Board Statement
Informed Consent Statement
Data Availability Statement
Acknowledgments
Conflicts of Interest
Abbreviations
Appendix A

| Boys | Girls | |||
|---|---|---|---|---|
| Overweight | Obese | Overweight | Obese | |
| 3.0 years old | 16.8 | 18.1 | 16.9 | 18.3 |
| 3.5 years old | 16.6 | 17.9 | 16.8 | 18.2 |
| 4.0 years old | 16.5 | 17.8 | 16.7 | 18.1 |
| 4.5 years old | 16.4 | 17.8 | 16.6 | 18.1 |
| 5.0 years old | 16.5 | 17.9 | 16.6 | 18.2 |
| 5.5 years old | 16.6 | 18.1 | 16.7 | 18.3 |
| 6.0 years old | 16.8 | 18.4 | 16.7 | 18.4 |
| Boys | ||||
|---|---|---|---|---|
| NW | OW/OB | Body Shape Difference | Daily Difference | |
| Weekday: | ||||
| Daily steps (steps/day) | 12,159 ± 2487 | 12,292 ± 2955 | 0.861 | 0.406 |
| MVPA (min/day) | 40.4 ± 11.1 | 37.5 ± 11.8 | 0.638 | 0.518 |
| TPA (min/day) | 123.0 ± 23.6 | 128.0 ± 28.7 | 0.621 | 0.649 |
| Weekend: | ||||
| Daily steps (steps/day) | 11,823 ± 3943 | 10,829 ± 4411 | 0.664 | |
| MVPA (min/day) | 40.3 ± 19.0 | 36.2 ± 14.0 | 0.750 | |
| TPA (min/day) | 117.1 ± 37.0 | 110.9 ± 48.9 | 0.781 | |
| Girls | ||||
| NW | OW/OB | Body Shape Difference | Daily difference | |
| Weekday: | ||||
| Daily steps (steps/day) | 10,845 ± 2526 | 10,561 ± 1584 | 0.768 | 0.552 |
| MVPA (min/day) | 36.9 ± 12.4 | 34.2 ± 9.1 | 0.625 | 0.428 |
| TPA (min/day) | 108.0 ± 23.7 | 106.9 ± 12.5 | 0.836 | 0.697 |
| Weekend: | ||||
| Daily steps (steps/day) | 10281 ± 5155 | 10589 ± 1425 | 0.122 | |
| MVPA (min/day) | 35.2 ± 25.3 | 36.7 ± 9.0 | 0.454 | |
| TPA (min/day) | 101.8 ± 46.3 | 100.1 ± 13.1 | 0.062 |
References
- Ellis, K.J.; Shypailo, R.J.; Abrams, S.A.; Wong, W.W. The reference child and adolescent models of body composition—A contemporary comparison. Ann. N. Y. Acad. Sci. 2000, 904, 374–382. [Google Scholar] [CrossRef] [PubMed]
- Ruff, C. Growth in bone strength, body size, and muscle size in a juvenile longitudinal sample. Bone 2003, 33, 317–329. [Google Scholar] [CrossRef] [PubMed]
- Veldhuis, J.D.; Roemmich, J.N.; Richmond, E.J.; Rogol, A.D.; Lovejoy, J.C.; Sheffield-Moore, M.; Mauras, N.; Bowers, C.Y. Endocrine control of body composition in infancy, childhood, and puberty. Endocrinol. Rev. 2005, 26, 114–146. [Google Scholar] [CrossRef] [PubMed]
- Baughan, B.; Brault-Dubuc, M.; Demirjian, A.; Gagnon, G. Sexual dimorphism in body composition changes during the pubertal period: As shown by French-Canadian children. Am. J. Phys. Anthropol. 1980, 52, 85–94. [Google Scholar] [CrossRef]
- Corbin, C.B.; Pangrazi, R.P.; Franks, B.D. Definitions: Health, Fitness, and Physical Activity. President’s Council on Physical Fitness and Sports Research Digest. 2000. Available online: http://www.fitness.gov/digest_mar2000.htm (accessed on 9 March 2000).
- Schaap, L.A.; Pluijm, S.M.; Deeg, D.J.; Visser, M. Inflammatory markers and loss of muscle mass (sarcopenia) and strength. Am. J. Med. 2006, 119, 526.e9–526.e17. [Google Scholar] [CrossRef]
- Abe, T.; Sakamaki, M.; Yasuda, T.; Bemben, M.G.; Kondo, M.; Kawakami, Y.; Fukunaga, T. Age-related, site-specific muscle loss in 1507 Japanese men and women aged 20 to 95 years. J. Sports Sci. Med. 2011, 10, 145–150. [Google Scholar]
- Skaggs, D.L.; Loro, M.L.; Pitukcheewanont, P.; Tolo, V.; Gilsanz, V. Increased body weight and decreased radial cross-sectional dimensions in girls with forearm fractures. J. Bone Miner. Res. 2001, 16, 1337–1342. [Google Scholar] [CrossRef]
- Goulding, A.; Grant, A.M.; Williams, S.M. Bone and body composition of children and adolescents with repeated forearm fractures. J. Bone Miner. Res. 2005, 20, 2090–2096. [Google Scholar] [CrossRef]
- Herrmann, D.; Buck, C.; Sioen, I.; Kouride, Y.; Marild, S.; Molnar, D.; Mouratidou, T.; Pitsiladis, Y.; Russo, P.; Veidebaum, T.; et al. Impact of physical activity, sedentary behaviour and muscle strength on bone stiffness in 2–10-year-old children-cross-sectional results from the IDEFICS study. Int. J. Behav. Nutr. Phys. Act. 2015, 12, 112. [Google Scholar] [CrossRef]
- Hasselstrom, H.; Hansen, S.E.; Froberg, K.; Andersen, L.B. Physical fitness and physical activity during adolescence as predictors of cardiovascular disease risk in young adulthood. Danish Youth and Sports study. An eight-year follow-up study. Int. J. Sports Med. 2002, 23, S27–S31. [Google Scholar] [CrossRef]
- Neef, M.; Weise, S.; Adler, M.; Sergeyev, E.; Dittrich, K.; Korner, A.; Kiess, W. Health impact in children and adolescents. Best Pract. Res. Clin. Endocrinol. Metab. 2013, 27, 229–238. [Google Scholar] [CrossRef] [PubMed]
- Singh, A.S.; Mulder, C.; Twisk, J.W.; van Mechelen, W.; Chinapaw, M.J. Tracking of childhood overweight into adulthood: A systematic review of the literature. Obes. Rev. 2008, 9, 474–488. [Google Scholar] [CrossRef] [PubMed]
- Ruiz, J.R.; Sui, X.; Lobelo, F.; Morrow, J.R.; Jackson, A.W. Association between muscular strength and mortality in men: Prospective cohort study. Br. Med. J. 2008, 337, a439. [Google Scholar] [CrossRef] [PubMed]
- Jurca, R.; Lamonte, M.J.; Barlow, C.E.; Kampert, J.B.; Church, T.S.; Blair, S.N. Association of muscular strength with incidence of metabolic syndrome in men. Med. Sci. Sports Eexerc 2005, 37, 1849–1855. [Google Scholar] [CrossRef]
- Wijndaele, K.; Duvigneaud, N.; Matton, L.; Duquet, W.; Thomis, M.; Beunen, G.; Lefevre, J.; Philippaerts, R.M. Muscular strength, aerobic fitness, and metabolic syndrome risk in Flemish adults. Med. Sci. Sports Exerc. 2007, 39, 233–240. [Google Scholar] [CrossRef]
- Janssen, I.; Heymsfield, S.B.; Wang, Z.M.; Ross, R. Skeletal muscle mass and distribution in 468 men and women aged 18–88 yr. J. Appl. Physiol. 2000, 89, 81–88. [Google Scholar] [CrossRef]
- Koster, A.; Ding, J.Z.; Stenholm, S.; Caserotti, P.; Houston, D.K.; Nicklas, B.J.; You, T.J.; Lee, J.S.; Visser, M.; Newman, A.B.; et al. Does the Amount of Fat Mass Predict Age-Related Loss of Lean Mass, Muscle Strength, and Muscle Quality in Older Adults? J. Gerontol. Ser. A Biomed. Sci. Med. Sci. 2011, 66, 888–895. [Google Scholar] [CrossRef]
- Goodpaster, B.H.; Carlson, C.L.; Visser, M.; Kelley, D.E.; Scherzinger, A.; Harris, T.B.; Stamm, E.; Newman, A.B. Attenuation of skeletal muscle and strength in the elderly: The Health ABC Study. J. Appl. Physiol. 2001, 90, 2157–2165. [Google Scholar] [CrossRef]
- Telford, R.D.; Cunningham, R.B.; Telford, R.M.; Riley, M.; Abhayaratna, W.P. Determinants of childhood adiposity: Evidence from the Australian LOOK study. PLoS ONE 2012, 7, e50014. [Google Scholar] [CrossRef]
- Jensen, G.L.; Friedmann, J.M. Obesity is associated with functional decline in community-dwelling rural older persons. J. Am. Geriatr. Soc. 2002, 50, 918–923. [Google Scholar] [CrossRef]
- Pengyu, D.; Noriko, I.S.; Liangfu, Z.; Hisashi, N. Changes in physical activity and weight status of Chinese children: A retrospective longitudinal study. Jpn. J. Phys. Fit. Sports Med. 2016, 5, 247–256. [Google Scholar]
- Li, H.; Ji, C.Y.; Song, X.N.; Zhang, Y.Q. Body mass index growth curves for Chinese children and adolescents aged 0 to 18 years. Chin. J. Pediatr. 2009, 47, 493. [Google Scholar]
- Hadda, V.; Khilnani, G.C.; Kumar, R.; Dhunguna, A.; Mittal, S.; Khan, M.A.; Madan, K.; Mohan, A.; Guleria, R. Intra- and Inter-observer Reliability of Quadriceps Muscle Thickness Measured with Bedside Ultrasonography by Critical Care Physicians. Indian J. Crit. Care Med. 2017, 21, 448–452. [Google Scholar] [PubMed]
- Sasayama, K.; Adachi, M. Association between activity level assessed by a uniaxial accelerometer and metabolic equivalents during walking and running in male youths. Jpn. J. Phys. Fit. Sports Med. 2016, 65, 265–272. [Google Scholar]
- Adachi, M.; Sasayama, K.; Hikihara, Y.; Okishima, K.; Mizuuchi, H.; Sunanmi, Y.; Shiomi, M.; Nishimuta, M. Assessing daily physical activity in elementary school students used by accelerometer: A validation study against doubly labeled water method. Jpn. J. Phys. Fit. Sports Med. 2007, 56, 347–355. [Google Scholar]
- Jimenez-Pavon, D.; Kelly, J.; Reilly, J.J. Associations between objectively measured habitual physical activity and adiposity in children and adolescents: Systematic review. Int. J. Pediatr. Obes. 2010, 5, 3–18. [Google Scholar] [CrossRef]
- Hikihara, Y.; Sasayama, K.; Okishima, K.; Mizuuchi, H.; Yoshitake, Y.; Adachi, M.; Takamatsu, K. The difference of relationships between physical activity variables and physical fitness in children and adolescents: With special reference to amount and intensity of physical activity. Jpn. J. Phys. Fit. Sports Med. 2007, 56, 327–339. [Google Scholar]
- Adachi, M.; Sasayama, K.; Ando, R.; Tanaka, Y.; Okishima, K.; Mizuuchi, H. Relationship between walking or running speed and exercise intensity measured by Accelerometer on Japanese school children and adolescens. Bull. Fac. Eudc. Okayama Univ. 2005, 128, 141–145. (In Japanese) [Google Scholar]
- Trost, S.G.; Loprinzi, P.D.; Moore, R.; Pfeiffer, K.A. Comparison of accelerometer cut points for predicting activity intensity in youth. Med. Sci. Sports Eexerc 2011, 43, 1360–1368. [Google Scholar] [CrossRef] [PubMed]
- Aoyagi, Y.; Shephard, R.J. Steps per day: The road to senior health? Sports Med. 2009, 39, 423–438. [Google Scholar] [CrossRef]
- Lindström, P.J.; Suni, J.H.; Nygård, C.H. Associations of leisure-time physical activity with balance and lower extremity strength: A validation of the neuromuscular part of the Physical Activity Pie. J. Phys. Act. Health 2009, 6, 493–502. [Google Scholar] [CrossRef] [PubMed]
- Ekelund, U.; Luan, J.; Nygard, C.H. Moderate to vigorous physical activity and sedentary time and cardiometabolic risk factors in children and adolescents. JAMA 2012, 307, 704–712. [Google Scholar] [CrossRef] [PubMed]
- Garnett, S.P.; Hogler, W.; Blades, B.; Baur, L.A.; Peat, J.; Lee, J.; Cowell, C.T. Relation between hormones and body composition, including bone, in prepubertal children. Am. J. Clin. Nutr. 2004, 80, 966–972. [Google Scholar] [CrossRef]
- Sakai, T.; Demura, S.; Fujii, K. Age-related changes of body composition structure based on differences in morphological qualities of Japanese preschool children. J. Physiol. Anthropol. 2011, 30, 213–221. [Google Scholar] [CrossRef]
- Vale, S.M.; Santos, R.M.; da Cruz Soares-Miranda, L.M.; Moreira, C.M.; Ruiz, J.R.; Mota, J.A. Objectively measured physical activity and body mass index in preschool children. Int. J. Pediatr. 2010, 2010, 479439. [Google Scholar] [CrossRef] [PubMed]
- Dorsey, K.B.; Herrin, J.; Krumholz, H.M. Patterns of moderate and vigorous physical activity in obese and overweight compared with non-overweight children. Int. J. Pediatr. Obes. 2011, 6, e547–e555. [Google Scholar] [CrossRef]
- Bluher, S.; Markert, J.; Herget, S.; Yates, T.; Davis, M.; Muller, G.; Waldow, T.; Schwarz, P.E. Who should we target for diabetes prevention and diabetes risk reduction? Curr. Diabetes Rev. 2012, 12, 147–156. [Google Scholar] [CrossRef]
- Taylor, R.W.; Murdoch, L.; Carter, P.; Gerrard, D.F.; Williams, S.M.; Taylor, B.J. Longitudinal study of physical activity and inactivity in preschoolers: The FLAME study. Med. Sci. Sports Eexerc. 2009, 41, 96–102. [Google Scholar] [CrossRef]
- Verbestel, V.; Van Cauwenberghe, E.; De Coen, V.; Maes, L.; De Bourdeaudhuij, I.; Cardon, G. Within- and Between-Day Variability of Objectively Measured Physical Activity in Preschoolers. Pediatr. Exerc. Sci. 2011, 23, 366–378. [Google Scholar] [CrossRef]
- Schmutz, E.A.; Leeger-Aschmann, C.S.; Radtke, T.; Muff, S.; Kakebeeke, T.H.; Zysset, A.E.; Messerli-Burgy, N.; Stulb, K.; Arhab, A.; Meyer, A.H.; et al. Correlates of preschool children’s objectively measured physical activity and sedentary behavior: A cross-sectional analysis of the SPLASHY study. Int. J. Behav. Nutr. Phys. Act. 2017, 14, 1. [Google Scholar] [CrossRef]
- Cardon, G.M.; De Bourdeaudhuij, I.M. Are preschool children active enough? Objectively measured physical activity levels. Res. Q. Exerc. Sport. 2008, 79, 326–332. [Google Scholar] [CrossRef] [PubMed]
- Rowlands, A.V.; Pilgrim, E.L.; Eston, R.G. Patterns of habitual activity across weekdays and weekend days in 9–11-year-old children. Prev. Med. 2008, 46, 317–324. [Google Scholar] [CrossRef] [PubMed]
- Dowda, M.; Pfeiffer, K.A.; Brown, W.H.; Mitchell, J.A.; Byun, W.; Pate, R.R. Parental and environmental correlates of physical activity of children attending preschool. Arch. Pediatr. Adolesc. Med. 2011, 165, 939–944. [Google Scholar] [CrossRef]
- Edwardson, C.L.; Gorely, T. Epoch length and its effect on physical activity intensity. Med. Sci. Sport. Eexerc 2010, 42, 928–934. [Google Scholar] [CrossRef] [PubMed]

| ALL a | |||
|---|---|---|---|
| Boys | Girls | Sex difference | |
| N = 47 | N = 39 | ||
| Age (month) | 49 ± 6 | 49 ± 6 | |
| Height (cm) | 106.6 ± 5.0 | 103.9 ± 5.3 | 0.257 |
| Weight (kg) | 17.9 ± 2.5 | 16.7 ± 2.3 | 0.370 |
| BMI | 15.7 ± 1.4 | 15.4 ± 1.3 | 0.837 |
| Boys a | |||
| NW | OW/OB | Body type difference | |
| N = 38 | N = 9 | ||
| Age (month) | 50 ± 6 | 51 ± 6 | |
| Height (cm) | 106.2 ± 5.0 | 108.4 ± 4.6 | 0.249 |
| Weight (kg) | 17.3 ± 1.8 | 20.7 ± 3.1 | p < 0.05 |
| BMI | 15.3 ± 1.0 | 17.5 ± 1.3 | p < 0.05 |
| Girls a | |||
| NW | OW/OB | Body type difference | |
| N = 34 | N = 5 | ||
| Age (month) | 49 ± 7 | 50 ± 3 | |
| Height (cm) | 103.4 ± 5.4 | 107.7 ± 2.9 | 0.072 |
| Weight (kg) | 16.1 ± 1.8 | 20.7 ± 0.7 | p < 0.05 |
| BMI | 15.0 ± 0.9 | 17.9 ± 0.8 | p < 0.05 |
| Boys | Girls | Sex Difference | Daily Difference | |
|---|---|---|---|---|
| Weekday | ||||
| Daily steps (steps/day) | 12,185 ± 2549 | 10,808 ± 2411 | 0.058 | 0.359 |
| MVPA (min/day) | 39.8 ± 11.2 | 36.5 ± 12.0 | 0.482 | 0.418 |
| TPA (min/day) | 124.0 ± 24.4 | 107.8 ± 22.4 | p < 0.05 | 0.535 |
| Weekend | ||||
| Daily steps (steps/day) | 11,632 ± 4006 | 10,848 ± 5038 | 0.465 | |
| MVPA (min/day) | 39.5 ± 18.1 | 36.7 ± 24.0 | 0.651 | |
| TPA (min/day) | 115.9 ± 39.0 | 108.2 ± 46.3 | 0.418 |
| Boys | Girls | ||||||||||||
|---|---|---|---|---|---|---|---|---|---|---|---|---|---|
| Weekday | Weekend | Weekday | Weekend | ||||||||||
| Daily Steps | MVPA | TPA | Daily Steps | MVPA | TPA | Daily Steps | MVPA | TPA | Daily Steps | MVPA | TPA | ||
| Muscle Thickness | UA | 0.13 | 0.02 | 0.15 | 0.07 | 0.04 | 0.13 | −0.18 | −0.04 | −0.20 | 0.15 | 0.20 | 0.13 |
| FA | 0.12 | 0.01 | 0.14 | −0.04 | 0.01 | 0.208 | −0.12 | −0.09 | −0.08 | 0.19 | 0.21 | 0.19 | |
| AB | 0.32 * | 0.37 * | 0.32 | 0.15 | 0.21 | 0.14 | 0.28 | 0.19 | 0.31 | 0.27 | 0.31 | 0.25 | |
| AT | 0.24 | 0.16 | 0.27 | 0.11 | 0.06 | 0.16 | 0.10 | 0.02 | 0.14 | 0.22 | 0.15 | 0.22 | |
| PT | 0.32 * | 0.20 | 0.35 | 0.17 | 0.12 | 0.23 | 0.10 | 0.08 | 0.12 | 0.38 * | 0.35 * | 0.39 * | |
| AL | −0.08 | −0.13 | −0.03 | −0.14 | −0.05 | −0.13 | −0.01 | 0.09 | −0.02 | 0.18 | 0.23 | 0.16 | |
| PL | 0.09 | 0.02 | 0.14 | 0.02 | 0.02 | 0.06 | 0.18 | 0.22 | 0.16 | 0.43 * | 0.44 * | 0.43 * | |
| Fat Thickness | UA | −0.13 | −0.20 | −0.12 | −0.06 | −0.03 | −0.06 | −0.01 | −0.17 | 0.04 | −0.01 | −0.11 | 0.03 |
| FA | −0.18 | −0.28 * | −0.14 | −0.19 | −0.12 | −0.18 | −0.09 | −0.11 | −0.09 | 0.22 | 0.18 | 0.24 | |
| AB | 0.04 | −0.09 | 0.09 | 0.01 | −0.06 | 0.05 | −0.07 | −0.17 | −0.02 | 0.16 | 0.06 | 0.20 | |
| AT | −0.14 | −0.20 | −0.11 | −0.09 | −0.06 | −0.07 | −0.27 | −0.25 | −0.23 | 0.06 | 0.02 | 0.10 | |
| PT | −0.05 | −0.22 | 0.01 | −0.12 | −0.07 | −0.11 | −0.35 * | −0.41 * | 0.30 | −0.03 | −0.10 | 0.03 | |
| AL | 0.09 | 0.01 | 0.14 | 0.07 | 0.08 | 0.08 | −0.28 | −0.23 | −0.27 | −0.02 | −0.03 | −0.01 | |
| PL | −0.15 | −0.26 | −0.07 | −0.14 | −0.09 | −0.13 | −0.31 | −0.36 * | −0.28 | −0.02 | −0.10 | 0.03 | |
| Boys | Girls | ||||||||||||
|---|---|---|---|---|---|---|---|---|---|---|---|---|---|
| Weekday | Weekend | Weekday | Weekend | ||||||||||
| Daily Steps | MVPA | TPA | Daily Steps | MVPA | TPA | Daily Steps | MVPA | TPA | Daily Steps | MVPA | TPA | ||
| Muscle Thickness | UA | 0.07 | 0.05 | 0.04 | 0.15 | 0.16 | 0.17 | −0.14 | −0.01 | −0.20 | 0.14 | 0.19 | 0.11 |
| FA | 0.09 | 0.03 | 0.05 | 0.04 | 0.11 | 0.05 | −0.05 | −0.02 | −0.06 | 0.16 | 0.17 | 0.14 | |
| AB | 0.16 | 0.27 | 0.18 | 0.07 | 0.20 | 0.01 | 0.50 * | 0.41 * | 0.48 * | 0.41 * | 0.46 * | 0.39 * | |
| AT | 0.10 | 0.10 | 0.09 | 0.18 | 0.16 | 0.19 | 0.21 | 0.23 | 0.20 | 0.28 | 0.27 | 0.27 | |
| PT | 0.39 * | 0.34 * | 0.35 * | 0.28 | 0.26 | 0.31 * | 0.41 * | 0.36 * | 0.40 | 0.34 | 0.37 * | 0.29 | |
| AL | −0.17 | −0.09 | −0.18 | −0.12 | 0.04 | −0.17 | 0.06 | 0.23 | −0.01 | 0.08 | 0.19 | 0.02 | |
| PL | −0.18 | −0.08 | −0.01 | 0.06 | 0.01 | −0.06 | 0.50 * | 0.57 * | 0.44 * | 0.39 * | 0.49 * | 0.33 | |
| Fat Thickness | UA | −0.33 * | −0.38 * | −0.35 * | −0.12 | −0.08 | −0.14 | −0.03 | −0.05 | −0.01 | −0.20 | −0.18 | −0.18 |
| FA | −0.33 * | −0.35 * | −0.34 * | −0.22 | −0.09 | −0.26 | −0.09 | −0.13 | −0.09 | 0.28 | 0.28 | 0.29 | |
| AB | −0.10 | −0.13 | −0.12 | 0.01 | −0.05 | 0.02 | 0.01 | −0.11 | 0.04 | 0.08 | −0.01 | 0.12 | |
| AT | −0.22 | −0.23 | −0.22 | −0.12 | −0.08 | −0.12 | −0.26 | −0.31 | −0.22 | −0.01 | −0.05 | 0.02 | |
| PT | −0.15 | −0.03 | −0.13 | 0.13 | −0.04 | −0.16 | −0.48 * | −0.49 * | −0.45 * | −0.09 | −0.14 | −0.05 | |
| AL | 0.12 | 0.06 | 0.16 | 0.04 | 0.05 | 0.05 | −0.26 | −0.30 | −0.23 | 0.06 | −0.01 | 0.08 | |
| PL | −0.21 | −0.26 | −0.17 | −0.11 | −0.05 | −0.13 | −0.39 * | −0.43 * | −0.35 | −0.07 | −0.15 | −0.03 | |
Disclaimer/Publisher’s Note: The statements, opinions and data contained in all publications are solely those of the individual author(s) and contributor(s) and not of MDPI and/or the editor(s). MDPI and/or the editor(s) disclaim responsibility for any injury to people or property resulting from any ideas, methods, instructions or products referred to in the content. |
© 2023 by the authors. Licensee MDPI, Basel, Switzerland. This article is an open access article distributed under the terms and conditions of the Creative Commons Attribution (CC BY) license (https://creativecommons.org/licenses/by/4.0/).
Share and Cite
Deng, P.; Ozaki, H.; Natsume, T.; Ke, D.; Lu, D.; Suzuki, K.; Naito, H. Associations of Morphological Changes in Skeletal Muscles of Preschool Children in China Following Physical Activity. Children 2023, 10, 1538. https://doi.org/10.3390/children10091538
Deng P, Ozaki H, Natsume T, Ke D, Lu D, Suzuki K, Naito H. Associations of Morphological Changes in Skeletal Muscles of Preschool Children in China Following Physical Activity. Children. 2023; 10(9):1538. https://doi.org/10.3390/children10091538
Chicago/Turabian StyleDeng, Pengyu, Hayao Ozaki, Toshiharu Natsume, Dandan Ke, Dajiang Lu, Koya Suzuki, and Hisashi Naito. 2023. "Associations of Morphological Changes in Skeletal Muscles of Preschool Children in China Following Physical Activity" Children 10, no. 9: 1538. https://doi.org/10.3390/children10091538
APA StyleDeng, P., Ozaki, H., Natsume, T., Ke, D., Lu, D., Suzuki, K., & Naito, H. (2023). Associations of Morphological Changes in Skeletal Muscles of Preschool Children in China Following Physical Activity. Children, 10(9), 1538. https://doi.org/10.3390/children10091538