
Lace Up and Mindfulness: A Randomized Controlled Trial Intervention to Reduce Emotional Eating, Anxiety, and Sleep Disturbances in Latinx and Black Youth


Abstract
1. Introduction
2. Materials and Methods
2.1. Participants
2.2. Procedures
2.3. Intervention Description
2.3.1. Experimental Group (EG)
2.3.2. Control Group (CG)
2.3.3. Setting and Safety
2.4. Measures
2.4.1. Demographic Characteristics and Acculturation
2.4.2. Weight Status and Percent Body Fat
2.4.3. Emotional Eating
2.4.4. Multidimensional Anxiety Scale for Children, 2nd Edition (MASC-2™)
2.4.5. Pittsburg Sleep Quality Index (PSQI)
2.4.6. Physical Activity
2.4.7. Food Frequency Questionnaire (FFQ)
2.5. Data Analysis
3. Results
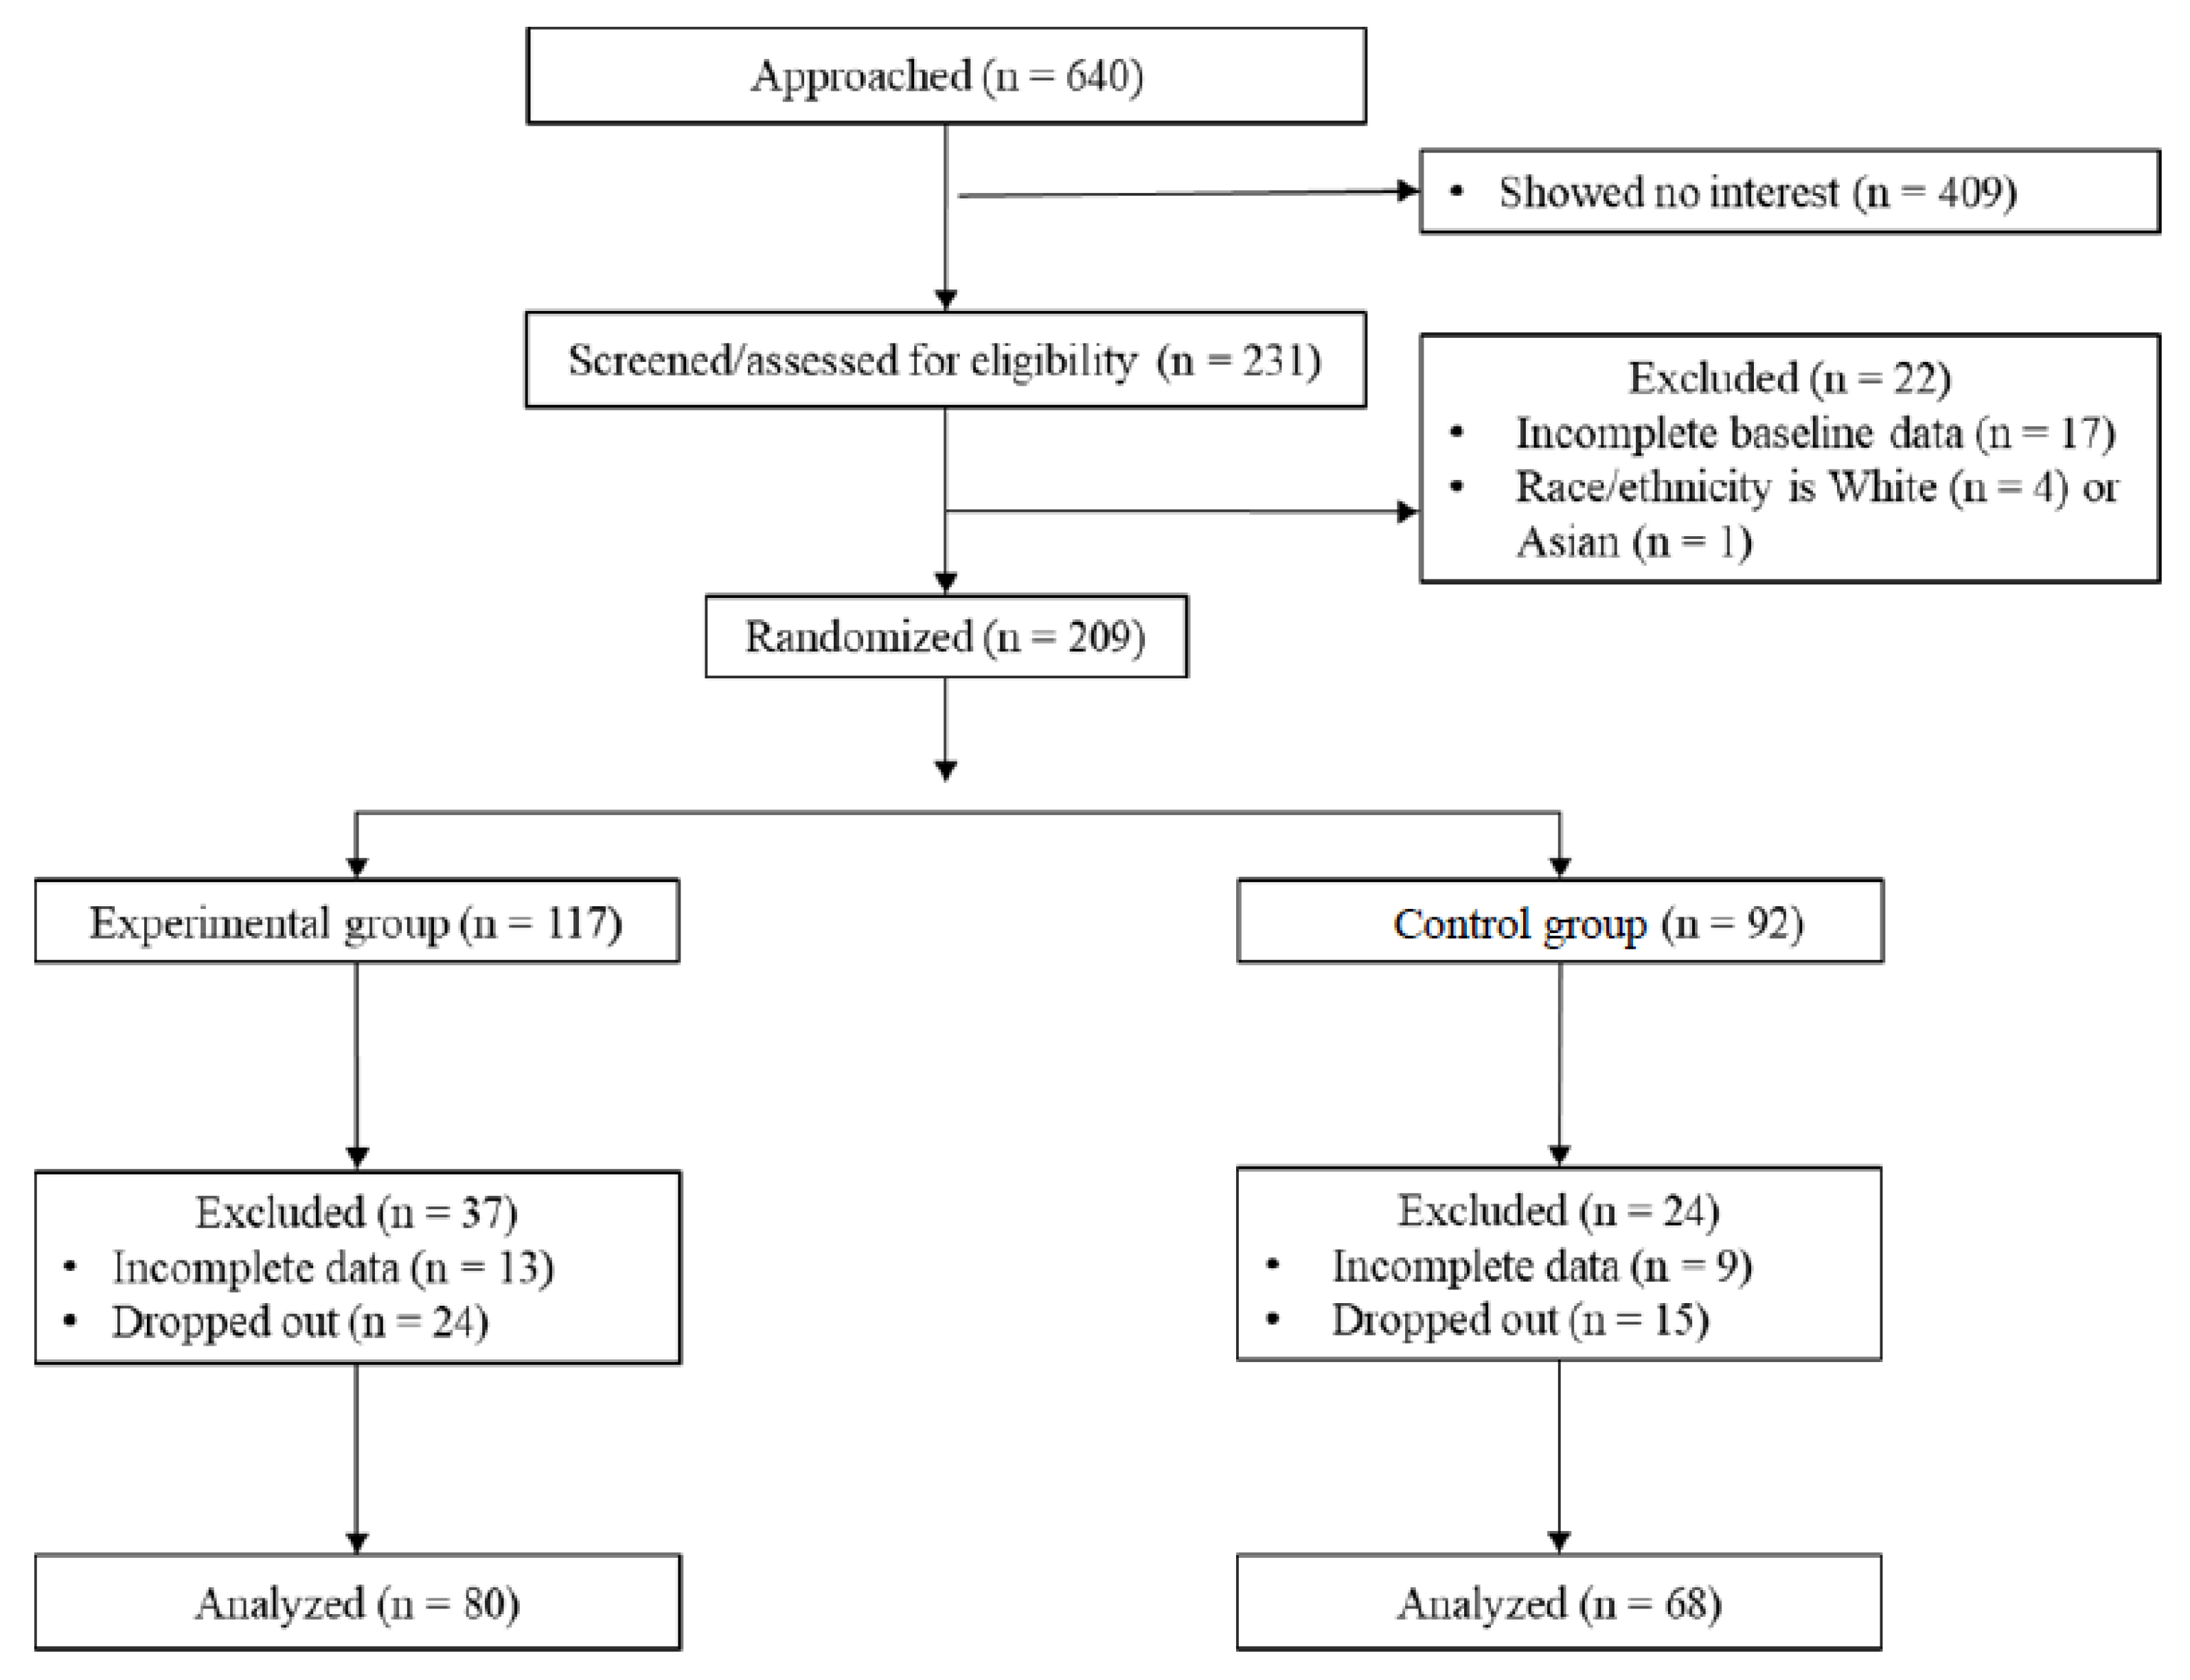
3.1. Sample Size
3.2. Baseline Sample Descriptive Characteristics
3.2.1. Demographic and Acculturation Characteristics
3.2.2. Weight Status and Percent Body Fat
3.2.3. Emotional Eating, Anxiety, and Sleep Scores
3.2.4. Physical Activity and Dietary Intake
3.3. Intervention Effects on Emotional Eating, Anxiety, and Sleep Quality
3.3.1. Emotional Eating, Anxiety, and Sleep Scores
3.3.2. Physical Activity and Dietary Intake
3.4. Intervention Dosage-Response Effects
4. Discussion
Limitations
5. Conclusions
Supplementary Materials
Author Contributions
Funding
Institutional Review Board Statement
Informed Consent Statement
Data Availability Statement
Acknowledgments
Conflicts of Interest
References
- Ogden, C.L.; Fryar, C.D.; Martin, C.B.; Freedman, D.S.; Carroll, M.D.; Gu, Q.; Hales, C.M. Trends in obesity prevalence by race and Hispanic origin—1999–2000 to 2017–2018. JAMA 2020, 324, 1208–1210. [Google Scholar] [CrossRef] [PubMed]
- Jalo, E.; Konttinen, H.; Vepsäläinen, H.; Chaput, J.P.; Hu, G.; Maher, C.; Maia, J.; Sarmiento, O.L.; Standage, M.; Tudor-Locke, C.; et al. Emotional eating, healthy behaviours, and obesity in children: A 12-country cross-sectional study. Nutrients 2019, 11, 351. [Google Scholar] [CrossRef] [PubMed]
- Egbert, A.H.; Wilfley, D.E.; Eddy, K.T.; Boutelle, K.N.; Zucker, N.; Peterson, C.B.; Doyle, A.C.; Grange, D.L.; Goldschmidt, A.B. Attention-deficit/hyperactivity disorder symptoms are associated with overeating with and without loss of control in youth with overweight/obesity. Child. Obes. 2018, 14, 50–57. [Google Scholar] [CrossRef] [PubMed]
- Sahoo, K.; Sahoo, B.; Choudhury, A.K.; Sofi, N.Y.; Kumar, R.; Bhadoria, A.S. Childhood obesity: Causes and consequences. J. Fam. Med. Prim. Care 2015, 4, 187–192. [Google Scholar] [CrossRef]
- Hussein, R.; Mohammed, R.A.E.; Ahmed, I.H. Psychological impact of obesity in children. Sci. J. Al-Azhar Med. Fac. Girls 2020, 4, 17–21. [Google Scholar] [CrossRef]
- Gohil, A.; Hannon, T.S. Poor sleep and obesity: Concurrent epidemics in adolescent youth. Front. Endocrinol. 2018, 9, 364. [Google Scholar] [CrossRef]
- Brown, A.G.; Esposito, L.E.; Fisher, R.A.; Nicastro, H.L.; Tabor, D.C.; Walker, J.R. Food insecurity and obesity: Research gaps, opportunities, and challenges. Transl. Behav. Med. 2019, 9, 980–987. [Google Scholar] [CrossRef]
- Kornet-van der Aa, D.A.; Altenburg, T.M.; van Randeraad-van der Zee, C.H.; Chinapaw, M.J.M. The effectiveness and promising strategies of obesity prevention and treatment programmes among adolescents from disadvantaged backgrounds: A systematic review. Obes. Rev. 2017, 18, 581–593. [Google Scholar] [CrossRef]
- Mead, E.; Brown, T.; Rees, K.; Azevedo, L.B.; Whittaker, V.; Jones, D.; Olajide, J.; Mainardi, G.M.; Corpeleijn, E.; O’Malley, C.; et al. Diet, physical activity and behavioural interventions for the treatment of overweight or obese children from the age of 6 to 11 years. Cochrane Database Syst. Rev. 2017, 6, CD012651. [Google Scholar] [CrossRef]
- Marks, D.F. Homeostatic theory of obesity. Health Psychol. Open 2015, 2, 1–30. [Google Scholar] [CrossRef]
- Rosenbaum, D.L.; White, K.S. Understanding the complexity of biopsychosocial factors in the public health epidemic of overweight and obesity. Health Psychol. 2016, 3, 1–4. [Google Scholar] [CrossRef]
- Aparicio, E.; Canals, J.; Arija, V.; De Henauw, S.; Michels, N. The role of emotion regulation in childhood obesity: Implications for prevention and treatment. Nutr. Res. Rev. 2016, 29, 17–29. [Google Scholar] [CrossRef]
- Boutelle, K.N.; Braden, A.; Knatz-Peck, S.; Anderson, L.K.; Rhee, K.E. An open trial targeting emotional eating among adolescents with overweight or obesity. Eat. Disord. 2018, 26, 79–91. [Google Scholar] [CrossRef]
- Harrist, A.W.; Hubbs-Tait, L.; Topham, G.L.; Shriver, L.H.; Page, M.C. Emotion regulation is related to children’s emotional and external eating. J. Dev. Behav. Pediatr. 2013, 34, 557–565. [Google Scholar] [CrossRef] [PubMed]
- Olvera, N.; Dempsey, A.; Gonzalez, E.; Abrahamson, C. Weight-related teasing, emotional eating, and weight control behaviors in Hispanic and African American girls. Eat. Behav. 2013, 14, 513–517. [Google Scholar] [CrossRef]
- Tak, S.R.; Hendrieckx, C.; Nefs, G.; Nyklíček, I.; Speight, J.; Pouwer, F. The association between types of eating behaviour and dispositional mindfulness in adults with diabetes. Results from Diabetes MILES. The Netherlands. Appetite 2015, 87, 288–295. [Google Scholar] [CrossRef]
- Evers, C.; Stok, F.M.; de Ridder, D.T.D. Feeding your feelings: Emotion regulation strategies and emotional eating. Pers. Soc. Psychol. B 2010, 36, 792–804. [Google Scholar] [CrossRef]
- Kabat-Zinn, J. Wherever You Go, There You Are; Hyperion: New York, NY, USA, 1994. [Google Scholar]
- Chiesi, F.; Dellagiulia, A.; Lionetti, F.; Bianchi, G.; Primi, C. Using item response theory to explore the psychometric properties of the Italian version of the Child and Adolescent Mindfulness Measure (CAMM). Mindfulness 2017, 8, 351–360. [Google Scholar] [CrossRef]
- Creswell, J.D. Mindfulness interventions. Annu. Rev. Psychol. 2017, 68, 491–516. [Google Scholar] [CrossRef]
- Mantzios, M.; Egan, H.; Hussain, M.; Keyte, R.; Bahia, H. Mindfulness, self-compassion, and mindful eating in relation to fat and sugar consumption: An exploratory investigation. Eat. Weight Disord. 2018, 23, 833–840. [Google Scholar] [CrossRef]
- Alberts, H.J.E.M.; Thewissen, R.; Raes, L. Dealing with problematic eating behaviour. The effects of a mindfulness-based intervention on eating behaviour, food cravings, dichotomous thinking and body image concern. Appetite 2012, 58, 847–851. [Google Scholar] [CrossRef] [PubMed]
- Johnson, F.; Pratt, M.; Wardle, J. Dietary restraint and self-regulation in eating behavior. Int. J. Obes. 2012, 36, 665–674. [Google Scholar] [CrossRef] [PubMed]
- Katterman, S.N.; Kleinman, B.M.; Hood, M.M.; Nackers, L.M.; Corsica, J.A. Mindfulness meditation as an intervention for binge eating, emotional eating, and weight loss: A systematic review. Eat. Behav. 2014, 15, 197–204. [Google Scholar] [CrossRef] [PubMed]
- Mason, A.E.; Jhaveri, K.; Cohn, M.; Brewer, J.A. Testing a mobile mindful eating intervention targeting craving-related eating: Feasibility and proof of concept. J. Behav. Med. 2018, 41, 160–173. [Google Scholar] [CrossRef] [PubMed]
- Eberth, J.; Sedlmeier, P. The effects of mindfulness meditation: A meta-analysis. Mindfulness 2012, 3, 174–189. [Google Scholar] [CrossRef]
- Dunning, D.L.; Griffiths, K.; Kuyken, W.; Crane, C.; Foulkes, L.; Parker, J.; Dalgleish, T. Research review: The effects of mindfulness-based interventions on cognition and mental health in children and adolescents—A meta-analysis of randomized controlled trials. J. Child Psychol. Psychiatry 2018, 60, 244–258. [Google Scholar] [CrossRef]
- Ma, X.; Yue, Z.Q.; Gong, Z.Q.; Zhang, H.; Duan, N.Y.; Shi, Y.T.; Wei, G.X.; Li, Y.F. The effect of diaphragmatic breathing on attention, negative affect and stress in healthy adults. Front. Psychol. 2017, 8, 874. [Google Scholar] [CrossRef]
- Kennedy, A.B.; Resnick, P.B. Mindfulness and physical activity. Am. J. Lifestyle Med. 2015, 9, 221–223. [Google Scholar] [CrossRef]
- Eggleston, B. The benefits of yoga for children in schools. Int. J. Health Well Soc. 2015, 5, 1–7. [Google Scholar] [CrossRef]
- Nanthakumar, C. The benefits of yoga in children. J. Integr. Med. 2018, 16, 14–19. [Google Scholar] [CrossRef]
- Telles, S.; Gupta, R.K.; Gandharva, K.; Vishwakarma, B.; Kala, N.; Balkrishna, A. Immediate effect of a yoga breathing practice on attention and anxiety in pre-teen children. Children 2019, 6, 84. [Google Scholar] [CrossRef]
- James-Palmer, A.; Anderson, E.Z.; Zucker, L.; Kofman, Y.; Daneault, J.F. Yoga as an intervention for the reduction of symptoms of anxiety and depression in children and adolescents: A systematic review. Front. Pediat. 2020, 8, 78. [Google Scholar] [CrossRef]
- Hall, A.; Ofei-Tenkorang, N.A.; Machan, J.T.; Gordon, C.M. Use of yoga in outpatient eating disorder treatment: A pilot study. J. Eat. Disord. 2016, 4, 38. [Google Scholar] [CrossRef]
- Velásquez, A.M.; López, M.A.; Quiñonez, N.; Paba, D.P. Yoga for the prevention of depression, anxiety, and aggression and the promotion of socio-emotional competencies in school-aged children. Educ. Res. Eval. 2015, 21, 407–421. [Google Scholar] [CrossRef]
- Rung, A.L.; Oral, E.; Berghammer, L.; Peters, E.S. Feasibility and acceptability of a mobile mindfulness meditation intervention among women: Intervention study. JMIR mHealth uHealth 2020, 8, e15943. [Google Scholar] [CrossRef]
- Blake, M.; Waloszek, J.M.; Schwartz, O.; Raniti, M.; Simmons, J.G.; Blake, L.; Murray, G.; Dahl, R.E.; Bootzin, R.; Dudgeon, P.; et al. The SENSE study: Post intervention effects of a randomized controlled trial of a cognitive–behavioral and mindfulness-based group sleep improvement intervention among at-risk adolescents. J. Consult. Clin. Psychol. 2016, 84, 1039–1051. [Google Scholar] [CrossRef]
- Bei, B.; Byrne, M.L.; Ivens, C.; Waloszek, J.; Woods, M.J.; Dudgeon, P.; Murray, G.; Nicholas, C.L.; Trinder, J.; Allen, N.B. Pilot study of a mindfulness-based, multi-component, in-school group sleep intervention in adolescent girls. Early Interv. Psychiatry 2013, 7, 213–220. [Google Scholar] [CrossRef]
- Sibinga, E.M.A.; Perry-Parrish, C.; Chung, S.; Johnson, S.B.; Smith, M.; Ellen, J.E. School-based mindfulness instruction for urban male youth: A small randomized controlled trial. Prev. Med. 2013, 57, 799–801. [Google Scholar] [CrossRef]
- Chu, Z. Effects of kickboxing on body composition of adolescents with obesity. Exerc. Biochem. Rev. 2018, 1, PO-001–PO-100. [Google Scholar] [CrossRef]
- Chavarrias, M.; Carlos-Vivas, J.; Collado-Mateo, D.; Pérez-Gómez, J. Health benefits of indoor cycling: A systematic review. Medicina 2019, 55, 452. [Google Scholar] [CrossRef]
- Nayek, B.; Chatterjee, K. Effect of 6-weeks yoga and aerobic exercise on muscular strength and flexibility of pre-adolescence students. Int. J. Yogic Hum. Mov. Sport. Sci. 2016, 1, 12–16. [Google Scholar]
- Mindfulness for Teens. Available online: http://mindfulnessforteens.com/guided-meditations (accessed on 2 February 2022).
- Barona, A.; Miller, J.A. Short acculturation scale for Hispanic youth (SASH-Y): A preliminary report. Hisp. J. Behav. Sci. 1994, 16, 155–162. [Google Scholar] [CrossRef]
- Centers for Disease Control and Prevention. BMI Percentile Calculator for Child and Teen. Available online: https://www.cdc.gov/healthyweight/bmi/calculator.html (accessed on 25 June 2021).
- McKnight Investigators. Risk factors for the onset of eating disorders in adolescent girls: Results of the McKnight longitudinal risk factor study. Am. J. Psychiatry 2003, 160, 248–254. [Google Scholar] [CrossRef] [PubMed]
- March, J.S. The Multidimensional Anxiety Scale for Children (MASC2), 2nd ed.; HHS: New York, NY, USA, 2013. [Google Scholar]
- Fraccaro, R.L.; Stelnicki, A.M.; Nordstokke, D.W. Test review: Multidimensional anxiety scale for children by J. S. March. Can. J. Sch. Psychol. 2015, 30, 70–77. [Google Scholar] [CrossRef]
- Buysse, D.J.; Reynolds III, C.F.; Monk, T.H.; Berman, S.R.; Kupfer, D.J. The Pittsburgh Sleep Quality Index: A new instrument for psychiatric practice and research. Psychiatry Res. 1989, 28, 193–213. [Google Scholar] [CrossRef]
- Kredlow, M.A.; Capozzoli, M.C.; Hearon, B.A.; Calkins, A.W.; Otto, M.W. The effects of physical activity on sleep: A meta-analytic review. J. Behav. Med. 2015, 38, 427–449. [Google Scholar] [CrossRef]
- Ranit, M.B.; Waloszek, J.M.; Schwartz, O.; Allen, N.B.; Trinder, J. Factor structure and psychometric properties of the Pittsburgh Sleep Quality Index in community-based adolescents. Sleep 2018, 41, zsy066. [Google Scholar] [CrossRef]
- Evenson, K.; Catellier, D.; Gill, K.; Ondrak, K.; McMurray, R. Calibration of two objective measures of physical activity for children. J. Sport Sci. 2008, 26, 1557–1565. [Google Scholar] [CrossRef]
- Matt, G.E.; Rock, C.L.; Johnson-Kozlow, M. Using recall cues to improve measurement of dietary intakes with a food frequency questionnaire in an ethnically diverse population: An exploratory study. J. Am. Diet. Assoc. 2006, 106, 1209–1217. [Google Scholar] [CrossRef]
- Hair, J.F.; Black, W.C.; Babin, B.J.; Anderson, R.E. Multivariate Data Analysis, 8th ed.; Cengage Learning EMEA: Andover, UK, 2018. [Google Scholar]
- Byrne, B.M. Structural Equation Modeling with AMOS: Basic Concepts, Applications, and Programming; Routledge: New York, NY, USA, 2010. [Google Scholar]
- Stevens, J. Applied Multivariate Statistics for the Social Sciences, 4th ed.; Erlbaum: Mahwah, NJ, USA, 2002. [Google Scholar]
- Cohen, J. Statistical Power Analysis for the Behavioural Sciences; Academic Press: New York, NY, USA, 1969. [Google Scholar]
- Laurson, K.R.; Eisenmann, J.C.; Welk, G.J. Body fat percentile curves for US children and adolescents. Am. J. Prev. Med. 2011, 41, 87–92. [Google Scholar] [CrossRef]
- Gouveia, M.J.; Canavarro, M.C.; Moreira, H. Associations between mindfulness, self-compassion, difficulties in emotion regulation, and emotional eating among adolescents with overweight/obesity. J. Child. Fam. Stud. 2018, 28, 273–285. [Google Scholar] [CrossRef]
- De Mello, M.T.; de Aquino Lemos, V.; Antunes, H.K.; Bittencourt, L.; Santos-Silva, R.; Tufik, S. Relationship between physical activity and depression and anxiety symptoms: A population study. J. Affect. Disord. 2013, 149, 241–246. [Google Scholar] [CrossRef]
- Hegberg, N.J.; Tone, E.B. Physical activity and stress resilience: Considering those at-risk for developing mental health problems. Ment. Health Phys. Act. 2015, 8, 1–7. [Google Scholar] [CrossRef]
- Wang, H.; Fu, J.; Lu, Q.; Tao, F.; Hao, J. Physical activity, body mass index and mental health in Chinese adolescents: A population based study. J. Sports Med. Phys. Fit. 2014, 54, 518–525. [Google Scholar]
- Lovato, N.; Gradisar, M. A meta-analysis and model of the relationship between sleep and depression in adolescents: Recommendations for future research and clinical practice. Sleep Med. Rev. 2014, 18, 521–529. [Google Scholar] [CrossRef]
- McMakin, D.L.; Alfano, C.A. Sleep and anxiety in late childhood and early adolescence. Curr. Opin. Psychiatry 2015, 28, 483. [Google Scholar] [CrossRef]
- Ridgers, N.D.; Timperio, A.; Cerin, E.; Salmon, J. Compensation of physical activity and sedentary time in primary school children. Med. Sci. Sport. Exerc. 2014, 46, 1564–1569. [Google Scholar] [CrossRef]
- Allport, L.; Song, M.; Leung, C.W.; McGlumphy, K.C.; Hasson, R.E. Influence of parent stressors on adolescent obesity in African American youth. J. Obes. 2019, 2019, 1316765. [Google Scholar] [CrossRef]


| Comparison of Experimental and Control Groups | |||||||||
|---|---|---|---|---|---|---|---|---|---|
| Variables | Total Sample | Experimental Group | Control Group | df | t | χ2 | p | d a | Cramer’s V |
| Age in years, M (SD) | 10.11 (1.3) | 9.93 (1.2) | 10.34 (1.4) | 146 | 1.90 | 0.06 | 0.31 | ||
| N (%) | |||||||||
| Gender | 1 | 0.21 | 0.65 | 0.04 | |||||
| Boy | 71 (48.0) | 37 (46.3) | 34 (50.0) | ||||||
| Girl | 77 (52.0) | 43 (53.7) | 34 (50.0) | ||||||
| Ethnicity | 2 | 8.83 | 0.01 | 0.24 | |||||
| Latinx | 107 (72.3) | 63 (78.8) | 44 (64.7) | ||||||
| Black | 28 (18.9) | 15 (18.8) | 13 (19.1) | ||||||
| Multiracial/Other | 13 (8.8) | 2 (2.4) | 11 (16.2) | ||||||
| Place of birth | 3 | 4.02 | 0.26 | 0.17 | |||||
| U.S. | 134 (90.5) | 74 (92.4) | 60 (88.2) | ||||||
| Mexico | 8 (5.4) | 3 (3.8) | 5 (7.4) | ||||||
| Central America | 2 (1.4) | 0 (0.0) | 2 (2.9) | ||||||
| Other | 4 (2.7) | 3 (3.8) | 1 (1.5) | ||||||
| Acculturation | 1 | 0.28 | 0.60 | 0.05 | |||||
| High | 78 (74.3) | 45 (76.3) | 33 (71.7) | ||||||
| Low | 27 (25.7) | 14 (23.7) | 13 (28.3) | ||||||
| Obesity status | 3 | 0.66 | 0.88 | 0.07 | |||||
| Underweight | 5 (3.4) | 3 (3.8) | 2 (2.9) | ||||||
| Normal weight | 58 (39.2) | 31 (38.8) | 27 (39.7) | ||||||
| Overweight | 24 (16.2) | 11 (13.8) | 13 (19.1) | ||||||
| Obese | 53 (35.8) | 29 (36.2) | 24 (35.3) | ||||||
| Missing | 8 (5.4) | 6 (7.5) | 2 (2.9) | ||||||
| Percent body fat | 27.55 (10.5) | 27.31 (11.0) | 27.81 (10.0) | 138 | 0.28 | 0.78 | 0.05 | ||
| Percent attendance, M (SD) | 84.83 (14.3) | 86.22 (11.9) | 83.22 (16.7) | 145 | 1.27 | 0.21 | 0.21 | ||
| Total Sample | Experimental Group | Control Group | ||||||
|---|---|---|---|---|---|---|---|---|
| Variables | N | M (SD) | N | M (SD) | N | M (SD) | t-Test | d b |
| Emotional eating score | 142 | 1.69 (0.82) | 78 | 1.71 (0.80) | 64 | 1.65 (0.86) | 0.43 | 0.07 |
| Total anxiety T-score | 141 | 51.43 (12.89) | 77 | 51.95 (13.14) | 64 | 50.80 (12.64) | 0.53 | 0.09 |
| Separation anxiety/phobia | 141 | 53.04 (11.35) | 77 | 53.40 (11.07) | 64 | 52.61 (11.75) | 0.41 | 0.07 |
| Generalized anxiety disorder | 141 | 49.89 (12.87) | 77 | 50.04 (12.39) | 64 | 49.72 (13.52) | 0.15 | 0.02 |
| Social anxiety | 141 | 48.67 (11.69) | 77 | 49.45 (11.80) | 64 | 47.73 (11.59) | 0.87 | 0.15 |
| Humiliation/rejection | 141 | 48.12 (11.16) | 77 | 49.17 (11.19) | 64 | 46.86 (11.08) | 1.23 | 0.21 |
| Performance fears | 141 | 49.91 (12.41) | 77 | 50.16 (12.73) | 64 | 49.61 (12.11) | 0.26 | 0.04 |
| Obsessions and compulsions | 141 | 55.02 (11.70) | 77 | 55.49 (11.94) | 64 | 54.47 (11.48) | 0.51 | 0.08 |
| Physical symptoms | 141 | 52.40 (11.83) | 77 | 52.62 (11.14) | 64 | 52.14 (12.68) | 0.24 | 0.04 |
| Panic | 141 | 53.13 (12.72) | 77 | 53.35 (12.04) | 64 | 52.86 (13.59) | 0.23 | 0.04 |
| Tense and restless | 141 | 51.30 (10.78) | 77 | 51.52 (10.36) | 64 | 51.03 (11.35) | 0.27 | 0.04 |
| Harm avoidance | 141 | 44.55 (12.22) | 77 | 43.99 (12.28) | 64 | 45.23 (12.21) | −0.60 | 0.10 |
| Global sleep quality | 148 | 3.86 (3.38) | 80 | 4.09 (3.18) | 68 | 3.60 (3.61) | 0.87 | 0.14 |
| Sleep duration (hours) | 136 | 8.61 (2.10) | 74 | 8.57 (1.99) | 62 | 8.67 (2.23) | −0.28 | 0.05 |
| Sleep efficiency (%) | 99 | 88.24 (14.28) | 52 | 85.20 (15.75) | 47 | 91.61 (11.73) | −2.31 * | 0.46 |
| Sleep latency | 140 | 0.71 (0.85) | 76 | 0.79 (0.93) | 64 | 0.61 (0.75) | 1.25 | 0.21 |
| Daily minutes MVPA a | 73 | 26.34 (21.87) | 39 | 24.10 (17.44) | 34 | 28.90 (26.09) | −0.94 | 0.22 |
| Dietary intake (servings/day) | ||||||||
| Fruits | 92 | 4.85 (5.19) | 53 | 5.35 (4.92) | 39 | 4.18 (5.53) | 1.07 | 0.23 |
| Vegetables | 92 | 2.76 (4.41) | 53 | 2.16 (2.33) | 39 | 3.57 (6.17) | −1.35 | 0.32 |
| Sweets | 92 | 2.00 (3.18) | 53 | 2.27 (3.34) | 39 | 1.64 (2.94) | 0.94 | 0.20 |
| Sweetened beverages | 142 | 0.77 (1.09) | 78 | 0.70 (1.06) | 64 | 0.86 (1.14) | −0.87 | 0.15 |
| Experimental Group | Control Group | Time-by-Group Interaction | ||||||
|---|---|---|---|---|---|---|---|---|
| Variables | N | Pre (M, SD) | Post (M, SD) | N | Pre (M, SD) | Post (M, SD) | F | Partial η2 |
| Emotional eating score | 71 | 1.70 (0.81) | 1.49 (0.65) | 55 | 1.59 (0.84) | 1.88 (0.93) | 5.41 * | 0.04 |
| Total anxiety T-score | 69 | 52.70 (13.42) | 47.33 (11.82) | 54 | 49.96 (12.86) | 49.83 (13.02) | 5.09 * | 0.04 |
| Separation anxiety/phobia | 69 | 54.14 (10.93) | 48.62 (11.15) | 53 | 52.38 (12.06) | 53.79 (12.41) | 12.53 ** | 0.10 |
| Generalized anxiety disorder | 69 | 50.36 (12.64) | 46.33 (10.84) | 54 | 48.67 (13.81) | 48.56 (13.70) | 2.54 | 0.02 |
| Social anxiety | 69 | 49.67 (12.13) | 44.77 (9.89) | 54 | 46.69 (11.65) | 45.91 (12.00) | 3.27 | 0.03 |
| Humiliation/rejection | 69 | 49.51 (11.26) | 44.23 (9.86) | 54 | 45.62 (11.22) | 45.20 (11.50) | 5.83 * | 0.05 |
| Performance fears | 70 | 50.26 (13.07) | 47.31 (10.42) | 54 | 49.02 (12.17) | 48.17 (11.62) | 0.17 | 0.00 |
| Obsessions and compulsions | 70 | 56.50 (11.84) | 53.61 (11.57) | 54 | 53.81 (11.85) | 54.41 (13.17) | 1.43 | 0.01 |
| Physical symptoms | 69 | 53.29 (11.28) | 51.12 (10.00) | 54 | 51.41 (12.68) | 51.98 (12.42) | 0.97 | 0.01 |
| Panic | 69 | 53.93 (12.31) | 51.55 (11.57) | 54 | 51.89 (13.71) | 52.26 (12.43) | 0.82 | 0.01 |
| Tense and restless | 69 | 52.22 (10.40) | 50.43 (9.13) | 54 | 50.70 (11.33) | 51.69 (12.25) | 1.05 | 0.01 |
| Harm avoidance | 69 | 43.96 (11.91) | 39.55 (14.20) | 54 | 45.56 (12.47) | 41.78 (15.92) | 0.51 | 0.00 |
| Sleep quality | ||||||||
| Sleep duration (hours) | 62 | 8.60 (1.93) | 8.37 (2.03) | 47 | 8.51 (1.83) | 8.63 (1.48) | 1.71 | 0.02 |
| Sleep efficiency (%) | 36 | 86.12 (16.63) | 89.39 (18.80) | 29 | 93.16 (11.80) | 91.72 (11.80) | 0.11 | 0.00 |
| Sleep latency | 69 | 0.81 (0.91) | 0.70 (0.86) | 54 | 0.50 (0.67) | 0.67 (0.78) | 4.98 * | 0.04 |
| Daily minutes MVPA a | 31 | 22.67 (16.03) | 22.41 (13.89) | 33 | 29.44 (26.30) | 21.49 (12.45) | 1.72 | 0.03 |
| Dietary intake (servings/day) | ||||||||
| Fruits | 53 | 5.35 (4.92) | 4.78 (5.50) | 36 | 3.99 (5.49) | 3.94 (4.81) | 0.31 | 0.00 |
| Vegetables | 53 | 2.16 (2.33) | 2.96 (4.50) | 36 | 2.75 (4.81) | 2.41 (3.87) | 1.56 | 0.02 |
| Sweets | 53 | 2.27 (3.34) | 1.55 (1.97) | 36 | 1.37 (2.20) | 1.90 (2.99) | 3.29 | 0.04 |
| Sweetened beverages | 71 | 0.67 (1.08) | 0.71 (0.89) | 56 | 0.79 (1.09) | 0.83 (1.15) | 0.09 | 0.00 |
| M (SD) | Time-by-Attendance Interaction | ||||
|---|---|---|---|---|---|
| Variables | N | Pre | Post | F | Partial η2 |
| Emotional eating score | 70 | 1.71 (0.81) | 1.48 (0.65) | 0.51 | 0.19 |
| Anxiety total T-score | 68 | 52.62 (13.50) | 47.13 (11.78) | 1.05 | 0.32 |
| Separation anxiety/phobia | 68 | 54.13 (11.01) | 48.68 (11.22) | 0.75 | 0.25 |
| Generalized anxiety disorder | 68 | 50.41 (12.72) | 46.01 (10.59) | 1.20 | 0.35 |
| Social anxiety | 68 | 49.59 (12.20) | 44.59 (9.85) | 1.49 | 0.40 |
| Humiliation/rejection | 68 | 49.41 (11.31) | 44.06 (9.82) | 0.99 | 0.31 |
| Performance fears | 69 | 50.23 (13.17) | 47.19 (10.44) | 1.74 | 0.45 |
| Obsessions and compulsions | 69 | 56.29 (11.80) | 53.38 (11.49) | 1.53 | 0.42 |
| Physical symptoms | 68 | 53.18 (11.33) | 50.97 (10.00) | 0.45 | 0.17 |
| Panic | 68 | 53.76 (12.33) | 51.28 (11.33) | 0.46 | 0.17 |
| Tense and restless | 68 | 52.19 (10.47) | 50.47 (9.19) | 0.69 | 0.24 |
| Harm avoidance | 68 | 44.09 (11.94) | 39.32 (14.17) | 0.76 | 0.26 |
| Sleep quality | |||||
| Sleep duration (hours) | 62 | 8.60 (1.93) | 8.37 (2.03) | 0.96 | 0.34 |
| Sleep efficiency (%) | 36 | 86.12 (16.63) | 89.39 (18.80) | 2.61 * | 0.67 |
| Sleep latency | 69 | 0.81 (0.91) | 0.70 (0.86) | 0.75 | 0.26 |
| Daily minutes MVPA a | 30 | 22.70 (16.31) | 22.52 (14.11) | 0.90 | 0.36 |
| Daily dietary intake (servings/day) | |||||
| Fruits | 52 | 5.18(4.80) | 4.67 (5.50) | 1.71 | 0.46 |
| Vegetables | 52 | 2.09 (2.28) | 3.01 (4.53) | 0.92 | 0.32 |
| Sweets | 52 | 2.15 (3.26) | 1.51 (1.97) | 0.65 | 0.24 |
Disclaimer/Publisher’s Note: The statements, opinions and data contained in all publications are solely those of the individual author(s) and contributor(s) and not of MDPI and/or the editor(s). MDPI and/or the editor(s) disclaim responsibility for any injury to people or property resulting from any ideas, methods, instructions or products referred to in the content. |
© 2023 by the authors. Licensee MDPI, Basel, Switzerland. This article is an open access article distributed under the terms and conditions of the Creative Commons Attribution (CC BY) license (https://creativecommons.org/licenses/by/4.0/).
Share and Cite
Olvera, N.; Hein, S.; Matthews-Ewald, M.; Zhang, R.; Scherer, R. Lace Up and Mindfulness: A Randomized Controlled Trial Intervention to Reduce Emotional Eating, Anxiety, and Sleep Disturbances in Latinx and Black Youth. Children 2023, 10, 538. https://doi.org/10.3390/children10030538
Olvera N, Hein S, Matthews-Ewald M, Zhang R, Scherer R. Lace Up and Mindfulness: A Randomized Controlled Trial Intervention to Reduce Emotional Eating, Anxiety, and Sleep Disturbances in Latinx and Black Youth. Children. 2023; 10(3):538. https://doi.org/10.3390/children10030538
Chicago/Turabian StyleOlvera, Norma, Sascha Hein, Molly Matthews-Ewald, Rongfang Zhang, and Rhonda Scherer. 2023. "Lace Up and Mindfulness: A Randomized Controlled Trial Intervention to Reduce Emotional Eating, Anxiety, and Sleep Disturbances in Latinx and Black Youth" Children 10, no. 3: 538. https://doi.org/10.3390/children10030538
APA StyleOlvera, N., Hein, S., Matthews-Ewald, M., Zhang, R., & Scherer, R. (2023). Lace Up and Mindfulness: A Randomized Controlled Trial Intervention to Reduce Emotional Eating, Anxiety, and Sleep Disturbances in Latinx and Black Youth. Children, 10(3), 538. https://doi.org/10.3390/children10030538