
Secular Trend of Self-Concept in the Context of Childhood Obesity—Data from the CHILT III Programme, Cologne
 , , ,
, , ,
Abstract
1. Introduction
2. Materials and Methods
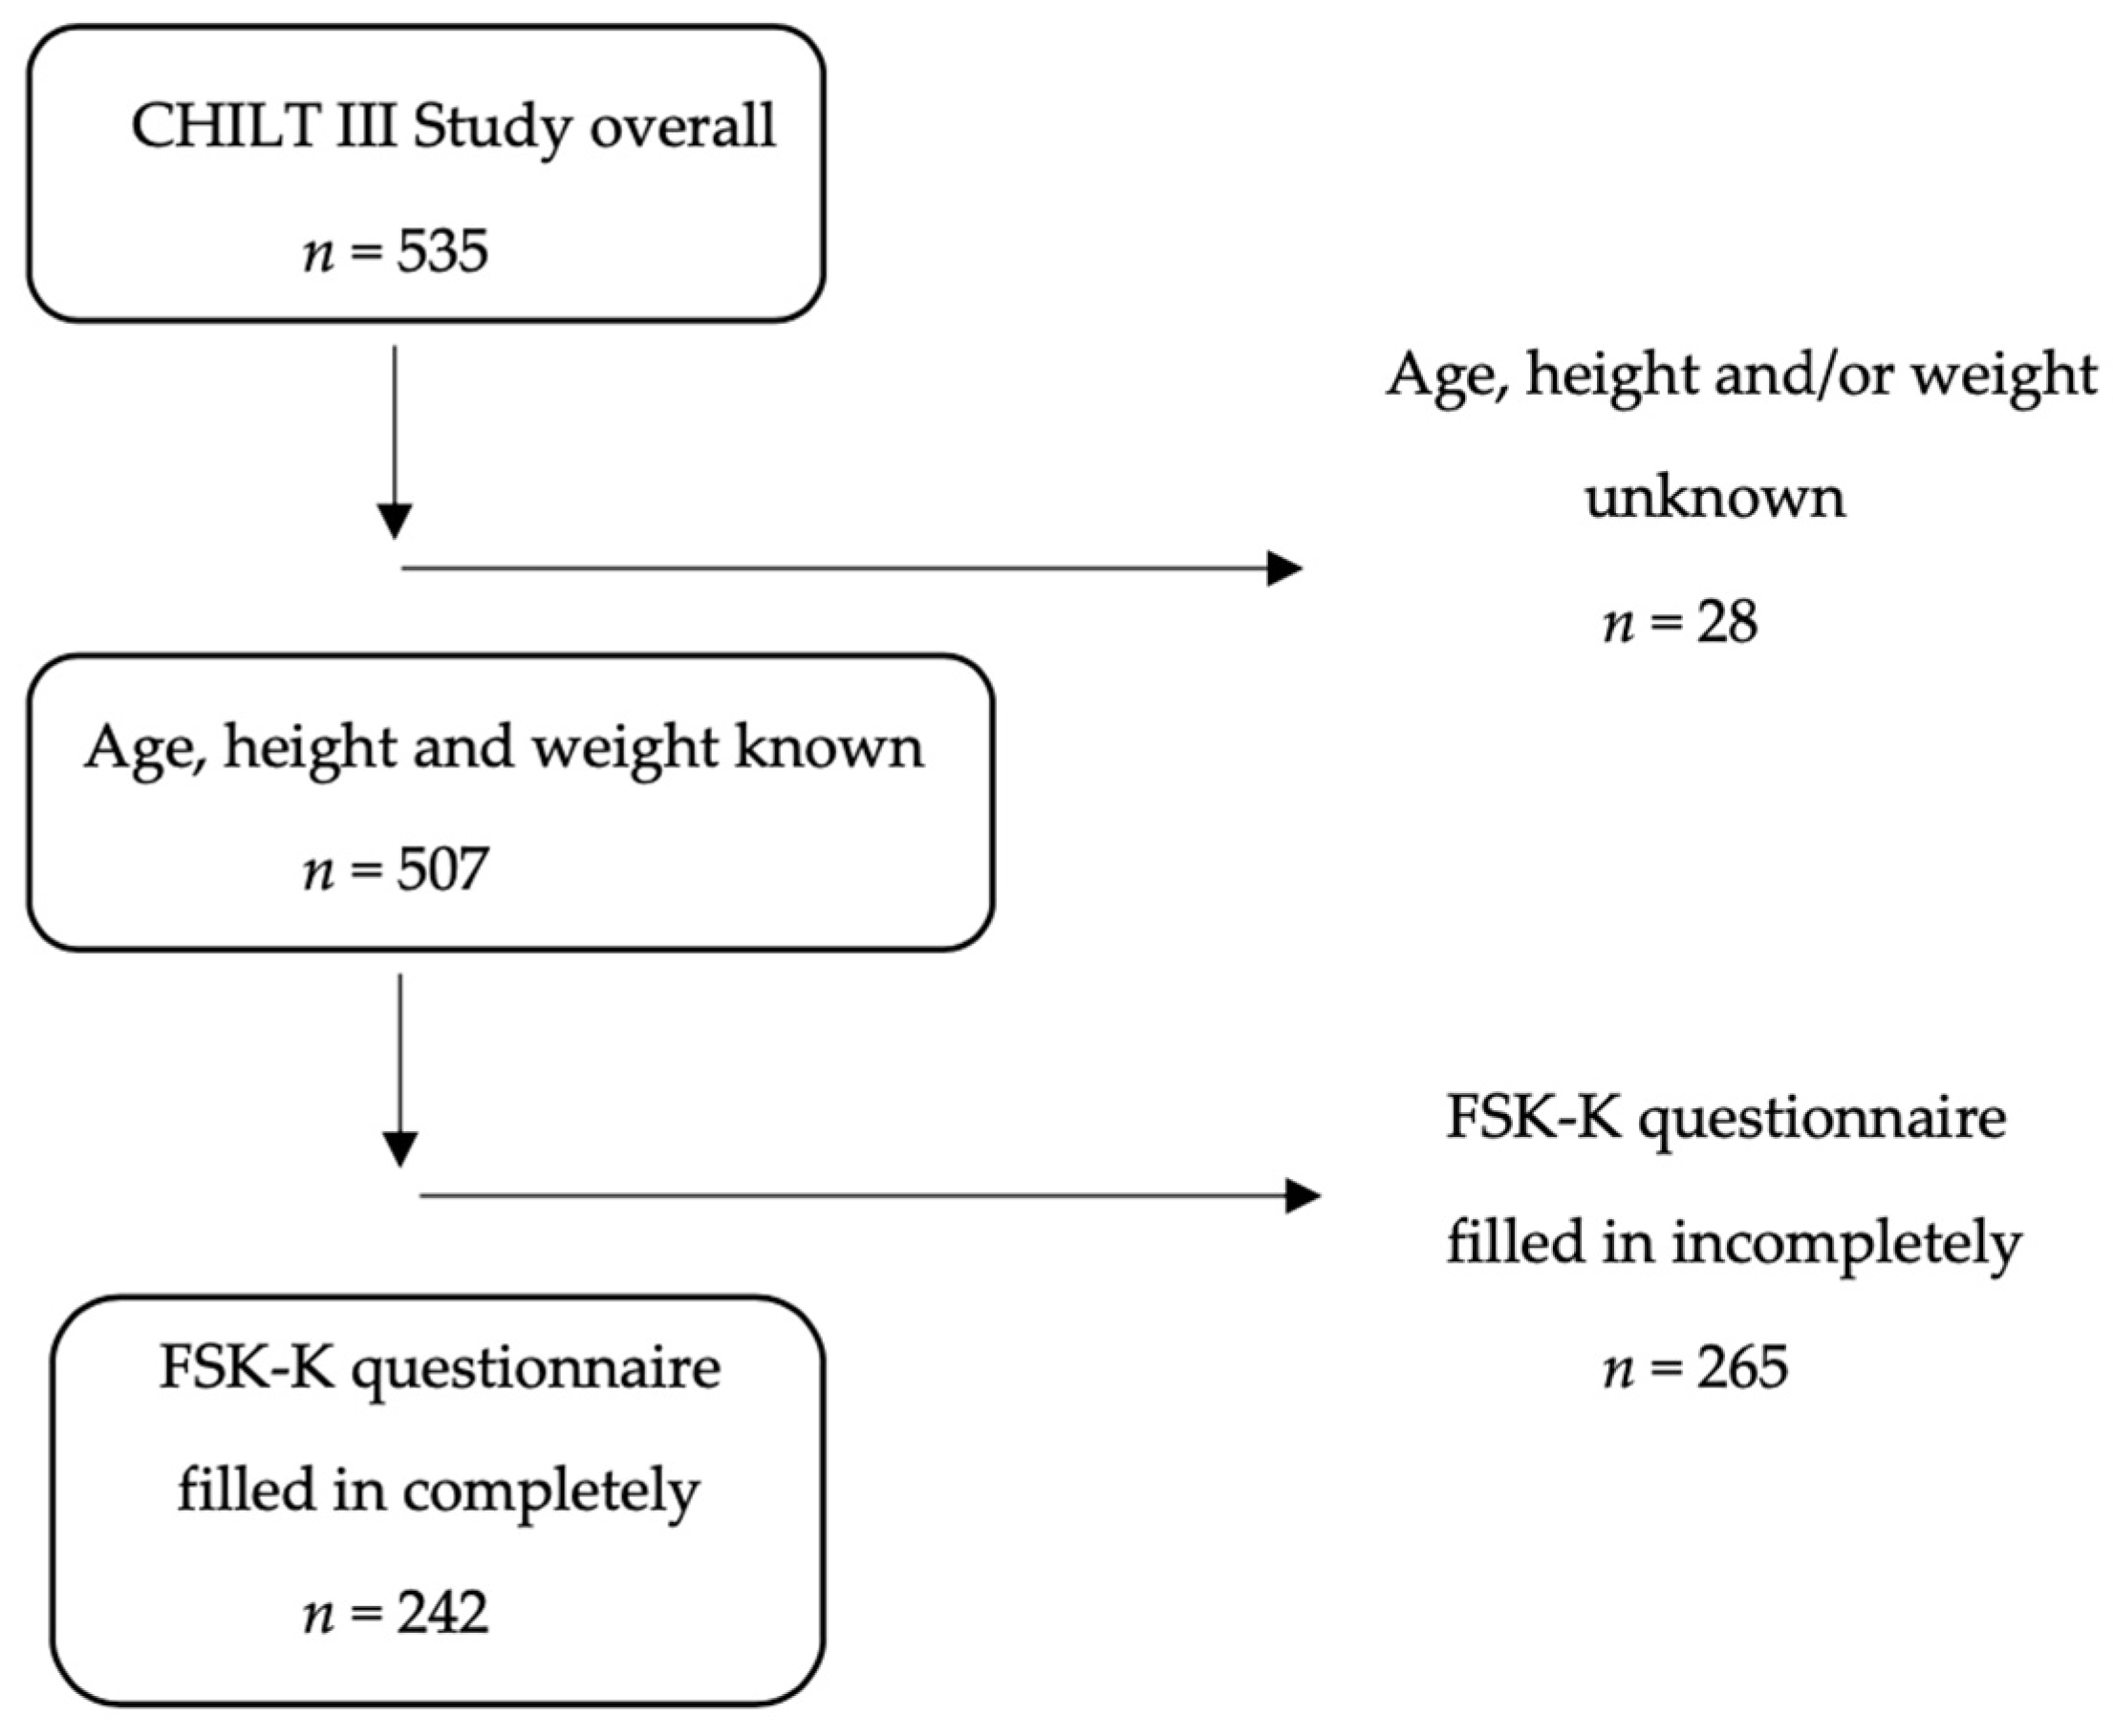
2.1. Population Sample/Study Design
2.2. Anthropometric Data
2.3. Demographics and Media Consumption
2.4. Self-Concept
2.5. Physical Fitness
2.6. Statistical Analysis
3. Results
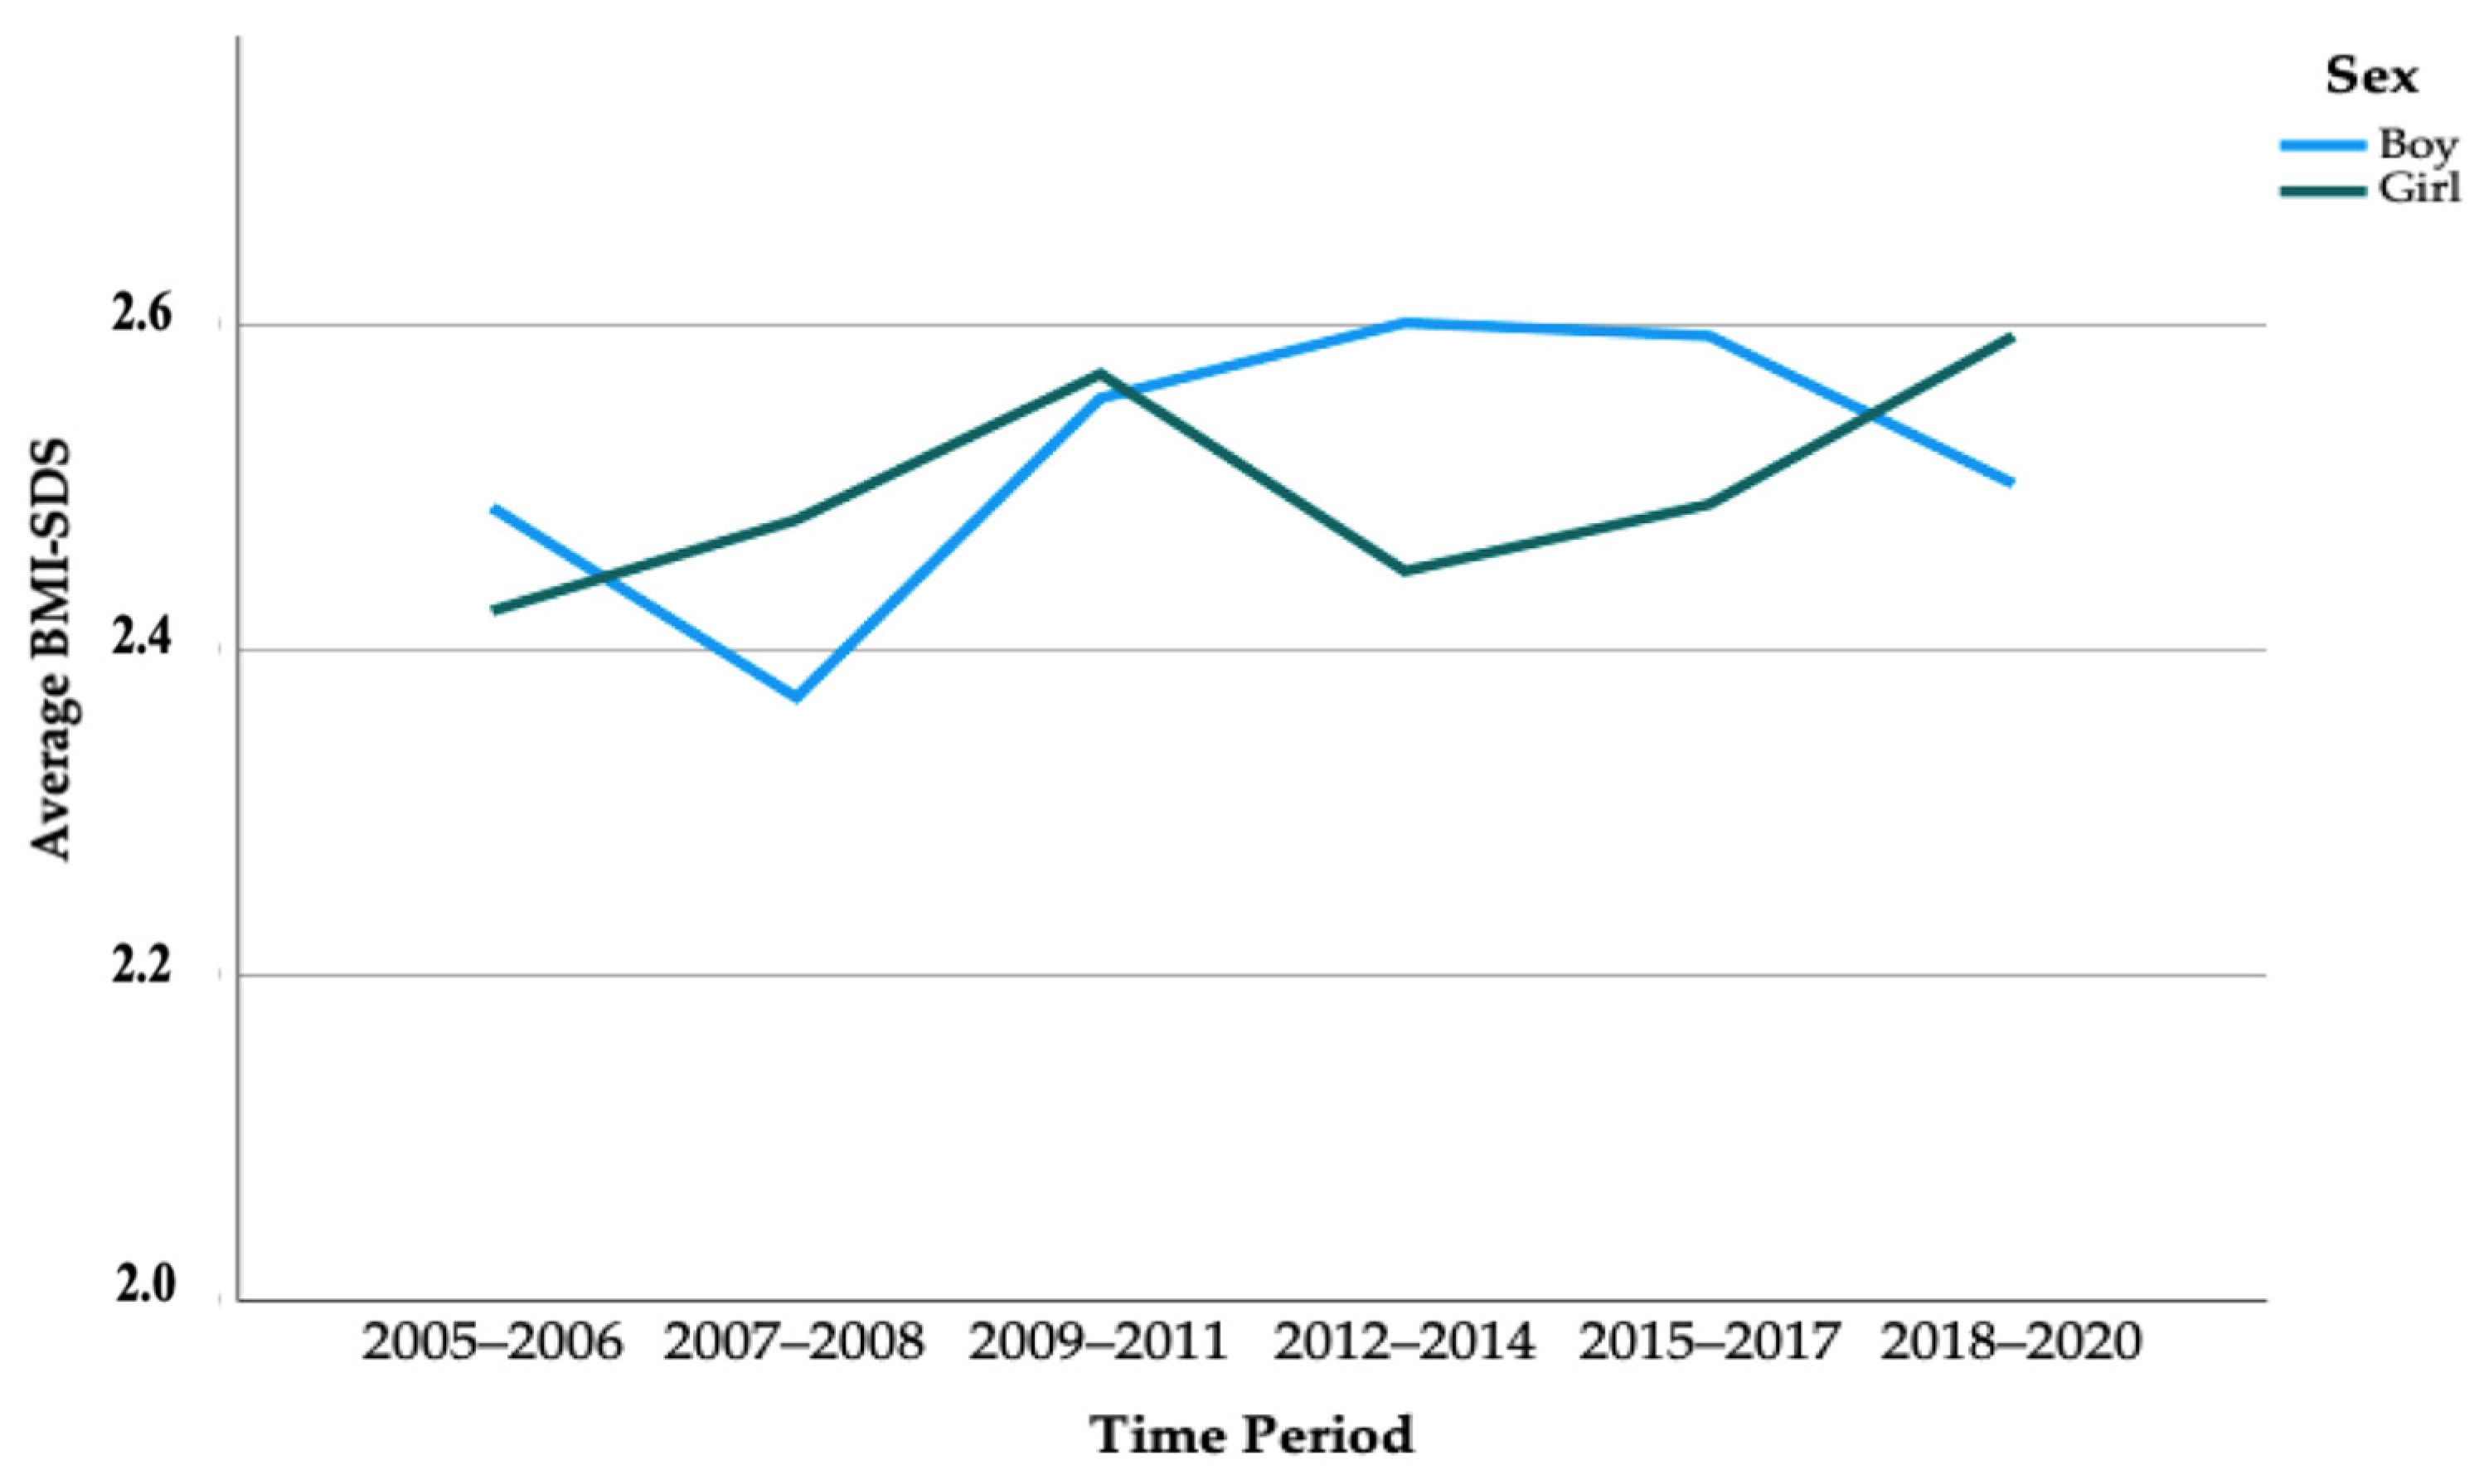
3.1. Secular Trends in Anthropometric Data
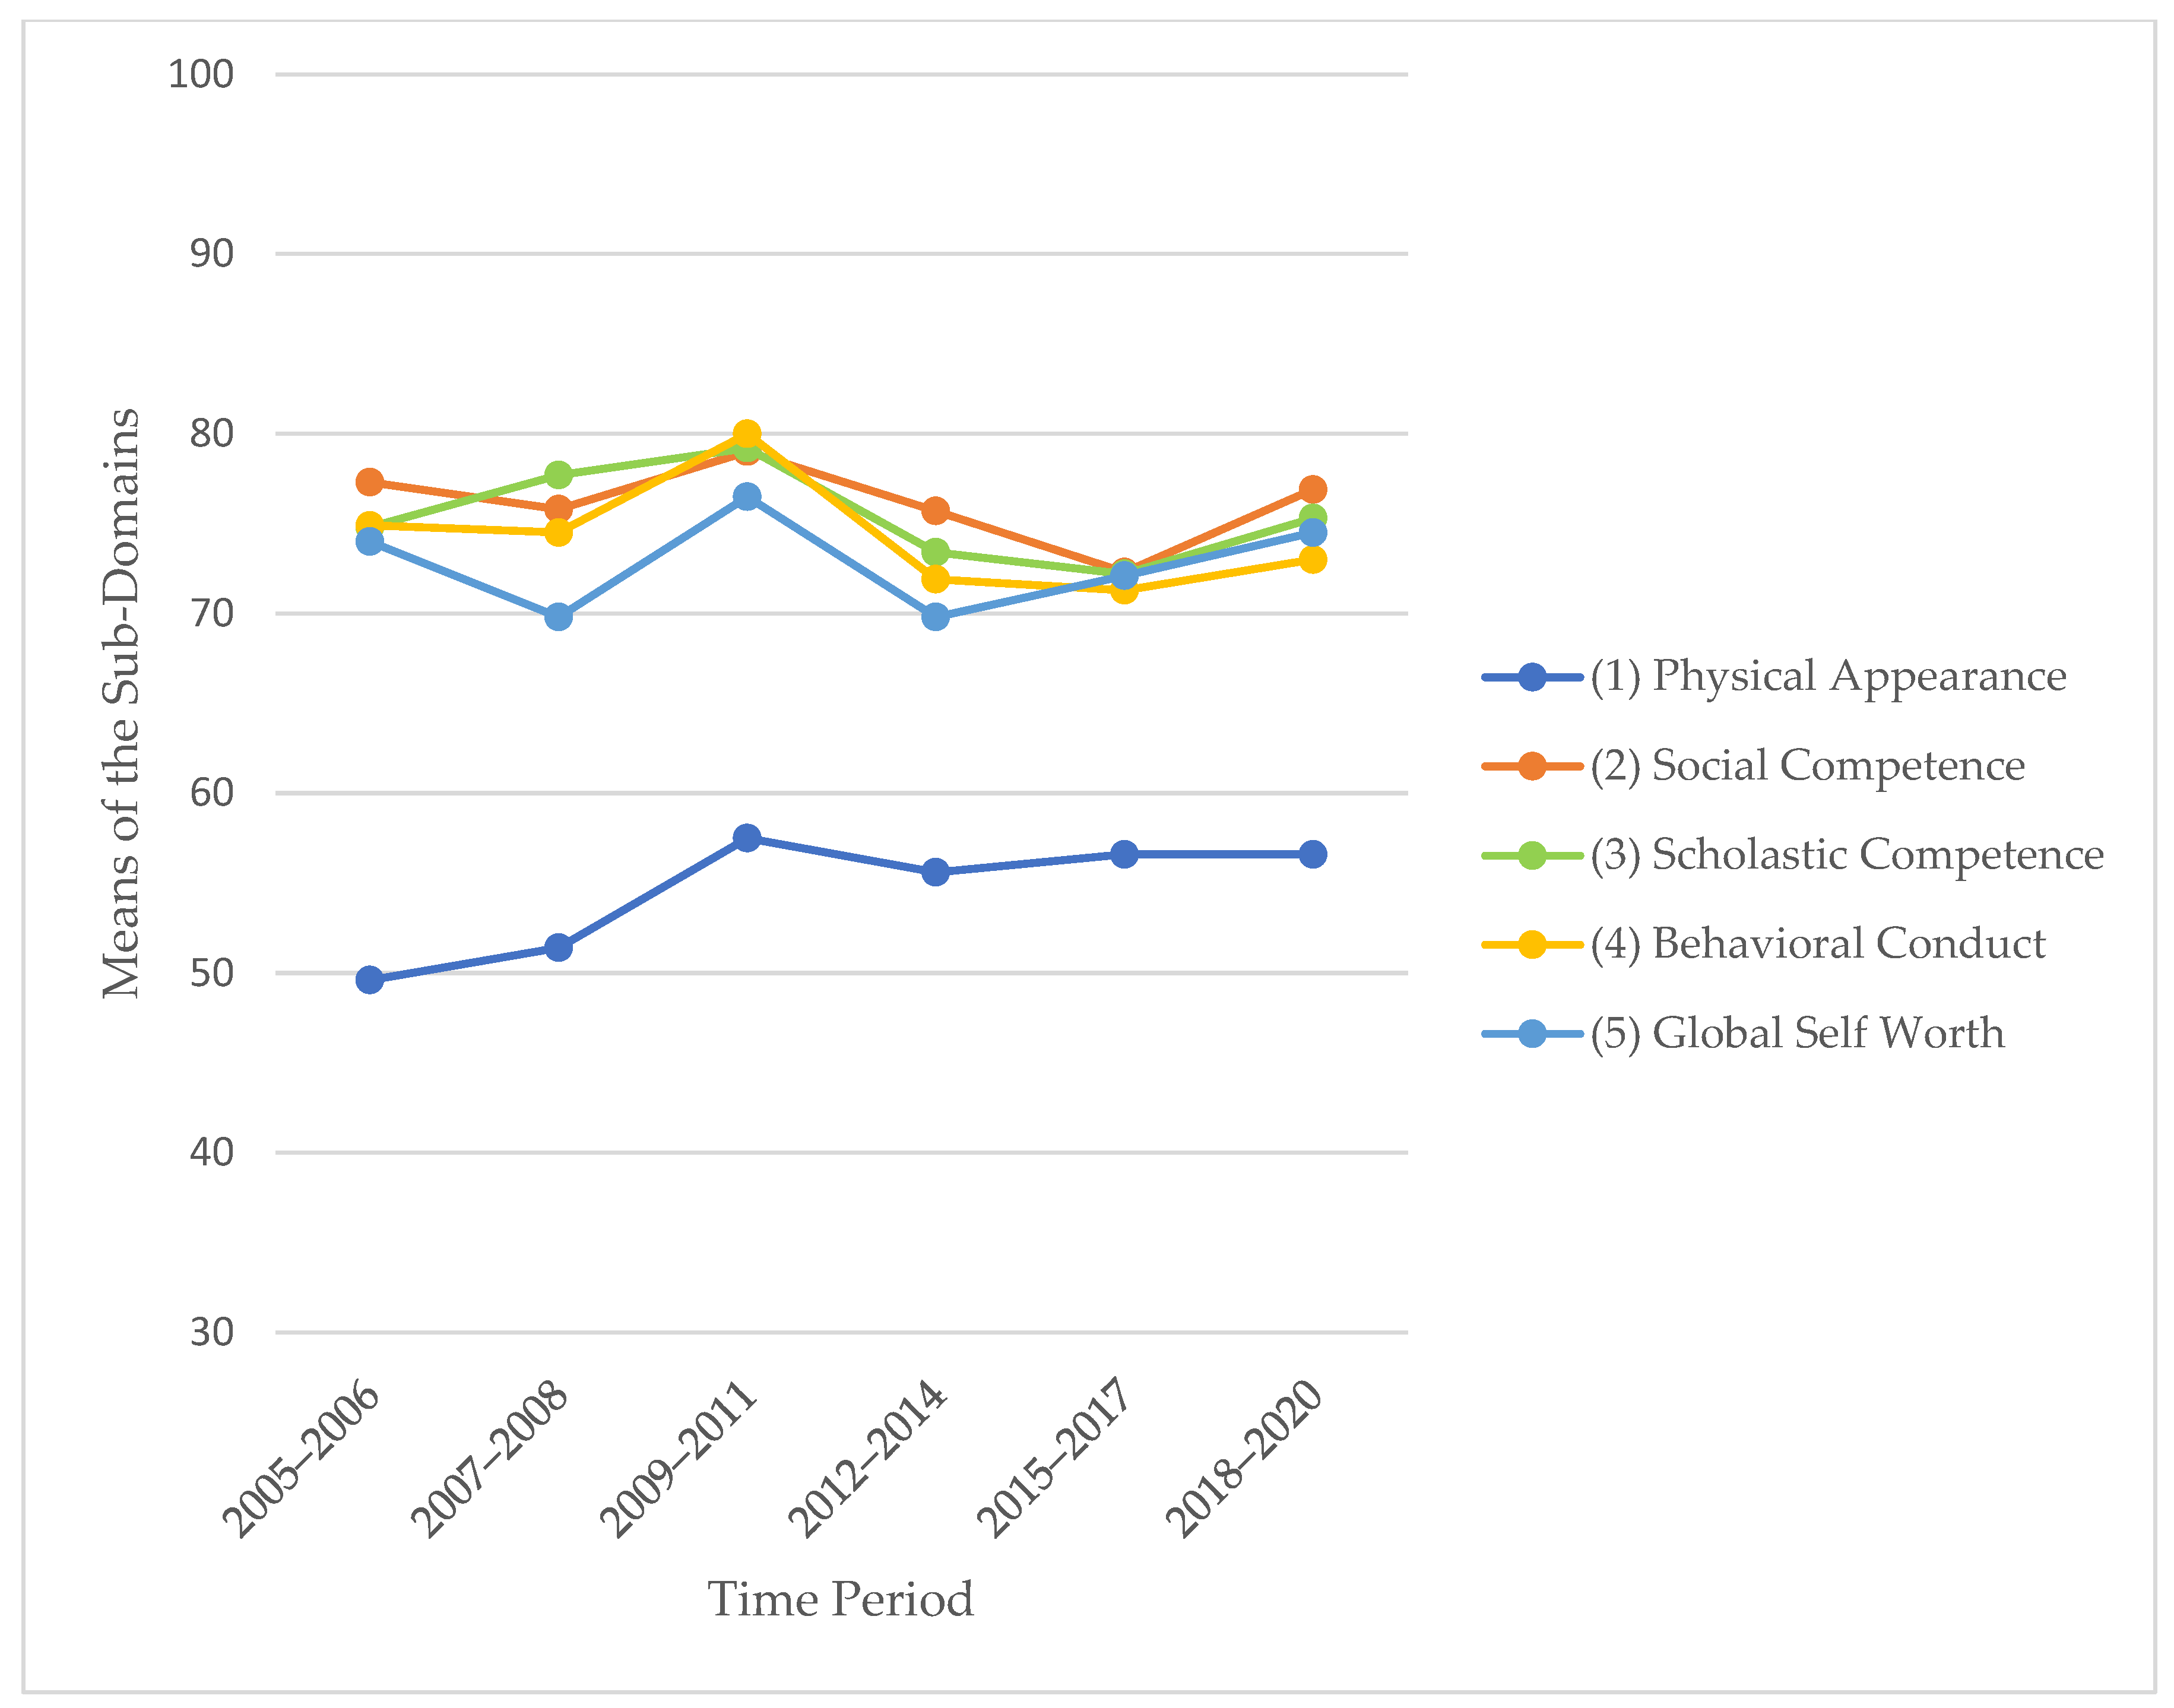
3.2. Secular Trends in Self-Concept
3.3. Consistent Predictors of Self-Concept across Time Spans
4. Discussion
5. Strengths and Limitations
6. Conclusions
Supplementary Materials
Author Contributions
Funding
Institutional Review Board Statement
Informed Consent Statement
Data Availability Statement
Acknowledgments
Conflicts of Interest
References
- Abarca-Gómez, L.; Abdeen, Z.A.; Hamid, Z.A.; Abu-Rmeileh, N.M.; Acosta-Cazares, B.; Acuin, C.; Adams, R.J.; Aekplakorn, W.; Afsana, K.; Aguilar-Salinas, C.A.; et al. Worldwide trends in body-mass index, underweight, overweight, and obesity from 1975 to 2016: A pooled analysis of 2416 population-based measurement studies in 128·9 million children, adolescents, and adults. Lancet 2017, 390, 2627–2642. [Google Scholar] [CrossRef] [PubMed]
- Schienkiewitz, A.; Brettschneider, A.-K.; Damerow, S.; Schaffrath Rosario, A. Übergewicht und Adipositas im Kindes- und Jugendalter in Deutschland—Querschnittergebnisse aus KiGGS Welle 2 und Trends. J. Health Monit. 2018, 3. [Google Scholar] [CrossRef]
- Vogel, M.; Geserick, M.; Gausche, R.; Beger, C.; Poulain, T.; Meigen, C.; Körner, A.; Keller, E.; Kiess, W.; Pfäffle, R. Age- and weight group-specific weight gain patterns in children and adolescents during the 15 years before and during the COVID-19 pandemic. Int. J. Obes. 2022, 46, 144–152. [Google Scholar] [CrossRef] [PubMed]
- Weihrauch-Blüher, S.; Huizinga, O.; Joisten, C.; Pflanz, J.; Torbahn, G.; Wiegand, S.; Holzapfel, C.; Hauner, H. Changes in lifestyle and body weight in children and adolescents during the COVID-19 pandemic: A representative survey of parents in Germany. Obes. Facts 2022. [Google Scholar]
- Flechtner-Mors, M.; Thamm, M.; Rosario, A.S.; Goldapp, C.; Hoffmeister, U.; Mann, R.; Bullinger, M.; van Egmond-Fröhlich, A.; Ravens-Sieberer, U.; Reinehr, T.; et al. Hypertension, dyslipoproteinemia and BMI-category characterise the cardiovascular risk in overweight or obese children and adolescents: Data of the BZgA-observational study (EvAKu-J-project) and the KiGGS-study. Klin. Padiatr. 2011, 223, 445–449. [Google Scholar] [CrossRef] [PubMed]
- Flechtner-Mors, M.; Neuhauser, H.; Reinehr, T.; Roost, H.P.; Wiegand, S.; Siegfried, W.; Zwiauer, K.; Molz, E.; Holl, R.W. Blood pressure in 57,915 pediatric patients who are overweight or obese based on five reference systems. Am. J. Cardiol. 2015, 115, 1587–1594. [Google Scholar] [CrossRef] [PubMed]
- Hoffmeister, U.; Bullinger, M.; Egmond-Fröhlich, A.; Goldapp, C.; Mann, R.; Ravens-Sieberer, U.; Reinehr, T.; Westenhöfer, J.; Holl, R.W. Treatment of obesity in pediatric patients in Germany: Anthropometry, comorbidity and socioeconomic gradients based on the BZgA Observational Study. Klin. Padiatr. 2010, 222, 274–278. [Google Scholar] [CrossRef]
- Kelsey, M.M.; Zaepfel, A.; Bjornstad, P.; Nadeau, K.J. Age-related consequences of childhood obesity. Gerontology 2014, 60, 222–228. [Google Scholar] [CrossRef]
- Britz, B.; Siegfried, W.; Ziegler, A.; Lamertz, C.; Herpertz-Dahlmann, B.M.; Remschmidt, H.; Wittchen, H.U.; Hebebrand, J. Rates of psychiatric disorders in a clinical study group of adolescents with extreme obesity and in obese adolescents ascertained via a population based study. Int. J. Obes. 2000, 24, 1707–1714. [Google Scholar] [CrossRef]
- Griffiths, L.J.; Parsons, T.; Hill, A. Self-esteem and quality of life in obese children and adolescents: A systematic review. Int. J. Pediatr. Obes. 2010, 5, 282–304. [Google Scholar] [CrossRef]
- Helfert, S.; Warschburger, P. The face of appearance-related social pressure: Gender, age and body mass variations in peer and parental pressure during adolescence. Child Adolesc. Psychiatry Ment. Health 2013, 7, 16. [Google Scholar] [CrossRef]
- Harrist, A.; Swindle, T.; Hubbs-Tait, L.; Topham, G.; Shriver, L.; Page, M. The Social and Emotional Lives of Overweight, Obese, and Severely Obese Children. Child Dev. 2016, 87, 1564–1580. [Google Scholar] [CrossRef]
- Wabitsch, M.; Schnurbein, J.v.; Vollbach, H.; Lennerz, B.; Weyhreter, H.; Wiegand, S.; Kiess, W.; Hebebrand, J.; Brandt, S. Innovative medizinische Betreuungskonzepte für Jugendliche mit extremer Adipositas. Bundesgesundheitsblatt-Gesundh. Gesundh. 2020, 63, 831–838. [Google Scholar] [CrossRef]
- Janicke, D.M.; Marciel, K.K.; Ingerski, L.M.; Novoa, W.; Lowry, K.W.; Sallinen, B.J.; Silverstein, J.H. Impact of psychosocial factors on quality of life in overweight youth. Obesity 2007, 15, 1799–1807. [Google Scholar] [CrossRef] [PubMed]
- Puhl, R.M.; Latner, J.D. Stigma, obesity, and the health of the nation’s children. Psychol. Bull. 2007, 133, 557. [Google Scholar] [CrossRef]
- Topçu, S.; Şimşek Orhon, F.; Ulukol, B.; Başkan, S. Anxiety, depression and self-esteem levels in obese children: A case-control study. J. Pediatr. Endocrinol. Metab. 2016, 29, 357–361. [Google Scholar] [CrossRef] [PubMed]
- Buttitta, M.; Rousseau, A.; Guerrien, A. A New Understanding of Quality of Life in Children and Adolescents with Obesity: Contribution of the Self-determination Theory. Curr. Obes. Rep. 2017, 6, 432–437. [Google Scholar] [CrossRef] [PubMed]
- Morrison, K.M.; Shin, S.; Tarnopolsky, M.; Taylor, V.H. Association of depression & health related quality of life with body composition in children and youth with obesity. J. Affect. Disord. 2015, 172, 18–23. [Google Scholar]
- Sutaria, S.; Devakumar, D.; Yasuda, S.S.; Das, S.; Saxena, S. Is obesity associated with depression in children? Systematic review and meta-analysis. Arch. Dis. Child. 2019, 104, 64–74. [Google Scholar] [CrossRef]
- Murray, M.; Dordevic, A.L.; Bonham, M.P. Systematic Review and Meta-Analysis: The Impact of Multicomponent Weight Management Interventions on Self-Esteem in Overweight and Obese Adolescents. J. Pediatr. Psychol. 2017, 42, 379–394. [Google Scholar] [CrossRef] [PubMed]
- Lier, L.M.; Breuer, C.; Ferrari, N.; Friesen, D.; Maisonave, F.; Schmidt, N.; Graf, C. Individual Physical Activity Behaviour and Group Composition as Determinants of the Effectiveness of a Childhood Obesity Intervention Program. Obes. Facts 2021, 14, 100–107. [Google Scholar] [CrossRef]
- Arbeitsgemeinschaft Adipositas im Kindes und Jugendalter (AGA), D.A.G.D. Therapie und Prävention der Adipositas im Kindes- und Jugendalter, in Evidenzbasierte (S3-) Leitlinie der Arbeitsgemeinschaft Adipositas im Kindes- und Jugendalter (AGA) der Deutschen Adipositas-Gesellschaft (DAG) und der Deutschen Gesellschaft für Kinder-und Jugendmedizin (DGKJ). D.A.G.D. Arbeitsgemeinschaft Adipositas im Kindes und Jugendalter (AGA). 2019. Available online: https://register.awmf.org/assets/guidelines/050-002l_S3_Therapie-Praevention-Adipositas-Kinder-Jugendliche_2019-11.pdf (accessed on 18 March 2020).
- Kromeyer-Hauschild, K.; Wabitsch, M.; Kunze, D.; Geller, F.; Geiß, H.C.; Hesse, V.; von Hippel, A.; Jaeger, U.; Johnsen, D.; Korte, W.; et al. Perzentile für den Body-mass-Index für das Kindes- und Jugendalter unter Heranziehung verschiedener deutscher Stichproben. Mon. Kinderheilkd. 2001, 149, 807–818. [Google Scholar] [CrossRef]
- Kliegman, R.N.W.E. Nelson Textbook of Pediatrics, 19th ed.; Elsevier/Saunders: Philadelphia, PA, USA, 2011. [Google Scholar]
- Graf, C. Rolle der körperlichen Aktivität und Inaktivität für die Entstehung und Therapie der juvenilen Adipositas. Bundesgesundheitsblatt-Gesundh. Gesundh. 2010, 53, 699–706. [Google Scholar] [CrossRef] [PubMed]
- Graf, C. Übergewicht im Kindes- und Jugendalter: Ein ganzheitliches Betreuungskonzept; Graf, C., Dordel, S., Koch, B., Eds.; Verl. Modernes Lernen: Dortmund, Germany, 2009. [Google Scholar]
- Bau, A.M.; Sannemann, J.; Ernert, A.; Babitsch, B. Association between health-related quality of life and selected indicators for 10- to 15-year-old girls in Berlin. Gesundheitswesen 2011, 73, 273–279. [Google Scholar] [CrossRef] [PubMed]
- Reinehr, T.; Kersting, M.; Wollenhaupt, A.; Alexy, U.; Kling, B.; Strobele, K.; Andler, W. Evaluation of the training program “OBELDICKS” for obese children and adolescents. Klin. Padiatr. 2005, 217, 1–8. [Google Scholar] [CrossRef] [PubMed]
- Warschburger, P.; Kröller, K. Adipositas im Kindes- und Jugendalter. Z. Für. Gesundh. 2005, 13, 69–78. [Google Scholar] [CrossRef]
- Trappe, H.-J.; Löllgen, H. Leitlinien zur Ergometrie. Z. Kardiol. 2000, 89, 821–837. [Google Scholar]
- Menrath, I.; Graf, C.; Granacher, U.; Kriemler, S. Pädiatrische Sportmedizin: Kompendium für Kinder- und Jugendärzte, Hausärzte und Sportärzte; Springer: Berlin/Heidelberg, Germany, 2021. [Google Scholar]
- Faul, F.; Erdfelder, E.; Lang, A.-G.; Buchner, A. G*Power 3: A flexible statistical power analysis program for the social, behavioral, and biomedical sciences. Behav. Res. Methods 2007, 39, 175–191. [Google Scholar] [CrossRef]
- Gausche, R.; Beger, C.; Spielau, U.; Pfaeffle, R.; Körner, A.; Siekmeyer, W. Epidemiologische Aspekte zum säkularen Trend bei Übergewicht und Adipositas bei Kindern und Jugendlichen. Adipositas-Ursachen Folgeerkrankungen Ther. 2018, 12, 4–9. [Google Scholar]
- Loth, K.; Wall, M.; Larson, N.; Neumark-Sztainer, D. Disordered eating and psychological well-being in overweight and nonoverweight adolescents: Secular trends from 1999 to 2010. Int. J. Eat. Disord. 2015, 48, 323–327. [Google Scholar] [CrossRef]
- Roth, B.; Munsch, S.; Meyer, A.; Metzke, C.; Isler, E.; Steinhausen, H.-C.; Schneider, S. Die psychische Befindlichkeit übergewichtiger Kinder. Z. Kinder Jugendpsychiatrie Psychother. 2008, 36, 163–176. [Google Scholar] [CrossRef]
- Ottova, V.; Erhart, M.; Rajmil, L.; Dettenborn-Betz, L.; Ravens-Sieberer, U. Overweight and its impact on the health-related quality of life in children and adolescents: Results from the European KIDSCREEN survey. Qual. Life Res. 2012, 21, 59–69. [Google Scholar] [CrossRef]
- Mäkinen, M.; Puukko-Viertomies, L.-R.; Lindberg, N.; Siimes, M.A.; Aalberg, V. Body dissatisfaction and body mass in girls and boys transitioning from early to mid-adolescence: Additional role of self-esteem and eating habits. BMC Psychiatry 2012, 12, 35. [Google Scholar] [CrossRef] [PubMed]
- Sánchez-Miguel, P.A.; León-Guereño, P.; Tapia-Serrano, M.A.; Hortigüela-Alcalá, D.; López-Gajardo, M.A.; Vaquero-Solís, M. The Mediating Role of the Self-Concept between the Relationship of the Body Satisfaction and the Intention to Be Physically Active in Primary School Students. Front. Public Health 2020, 8, 113. [Google Scholar] [CrossRef]
- Molina-García, J.; Castillo, I.; Queralt, A.; Alvarez, O. Precursors of body dissatisfaction and its implication for psychological well-being in young adults. Univ. Psychol. 2019, 18, 1–11. [Google Scholar] [CrossRef]
- Babic, M.J.; Morgan, P.J.; Plotnikoff, R.C.; Lonsdale, C.; White, R.L.; Lubans, D.R. Physical activity and physical self-concept in youth: Systematic review and meta-analysis. Sport. Med. 2014, 44, 1589–1601. [Google Scholar] [CrossRef] [PubMed]
- Vedul-Kjelsås, V.; Sigmundsson, H.; Stensdotter, A.K.; Haga, M. The relationship between motor competence, physical fitness and self-perception in children. Child Care Health Dev. 2012, 38, 394–402. [Google Scholar] [CrossRef] [PubMed]
- Perez-Sousa, M.A.; Olivares, P.R.; Escobar-Alvarez, J.A.; Parraça, J.A.; Gusi, N. Fitness as mediator between weight status and dimensions of health-related quality of life. Health Qual. Life Outcomes 2018, 16, 155. [Google Scholar] [CrossRef]
- Eisenburger, N.; Friesen, D.; Haas, F.; Klaudius, M.; Schmidt, L.; Vandeven, S.; Joisten, C. Predicting Psychosocial Health of Children and Adolescents with Obesity in Germany: The Underappreciated Role of Physical Fitness. Int. J. Environ. Res. Public Health 2021, 18, 11188. [Google Scholar] [CrossRef]
- Silva, D.F.O.; Sena-Evangelista, K.C.M.; Lyra, C.O.; Pedrosa, L.F.C.; Arrais, R.F.; Lima, S. Motivations for weight loss in adolescents with overweight and obesity: A systematic review. BMC Pediatr. 2018, 18, 364. [Google Scholar] [CrossRef]


| Total (n = 242) | Boys (n = 113) | Girls (n = 129) | p-Value | |
|---|---|---|---|---|
| (1) Sex n (%) | 113 (46.7%) | 129 (53.3%) | ||
| (2) Age (in years) | 12.5 ± 2.1 (242) | 12.7 ± 2.1 (113) | 12.3 ± 2.2 (129) | 0.110 † |
| (3) Height (in m) | 1.59 ± 0.11 (242) | 1.62 ± 0.12 (113) | 1.56 ± 0.10 (129) | <0.001 † |
| (4) Weight (in kg) | 76.4 ± 19.6 (242) | 81.3 ± 22.3 (113) | 72.1 ± 15.8 (129) | <0.001 † |
| (5) BMI (in kg/m2) | 30.0 ± 4.8 (242) | 30.7 ± 5.4 (113) | 29.4 ± 4.2 (129) | 0.038 † |
| (6) BMI-SDS | 2.45 ± 0.46 (242) | 2.45 ± 0.47 (113) | 2.45 ± 0.45 (129) | 0.974 † |
| (7) Adolescent status | ||||
| <13 years old | 135 (55.8%) | 57 (50.44%) | 78 (60.47%) | |
| ≥13 years old | 107 (44.2%) | 56 (49.56%) | 51 (39.53%) | 0.117 ‡ |
| Overall (n = 205) | Boys (n = 97) | Girls (n = 108) | ||
| (8) Migration background (yes) | 23 (11.2%) | 10 (10.3%) | 13 (12.0%) | 0.696 ‡ |
| (9) Media consumption (h/day) | 3.23 ± 3.27 (205) | 3.45 ± 3.82 (97) | 3.02 ± 2.69 (108) | 0.349 † |
| Overall (n = 242) | 2005–2006 (n = 40) | 2007–2008 (n = 38) | 2009–2011 (n = 34) | 2012–2014 (n = 42) | 2015–2017 (n = 45) | 2018–2020 (n = 43) | p-Value |
|---|---|---|---|---|---|---|---|
| (1) Sex n (%) | |||||||
| male | 15 (37.5%) | 19 (50.0%) | 14 (41.2%) | 22 (52.4%) | 20 (44.4%) | 23 (53.5%) | 0.642 ‡ |
| female | 25 (62.5%) | 19 (50.0%) | 20 (58.8%) | 20 (47.6%) | 25 (55.6%) | 20 (46.5%) | |
| (2) Age (in years) | 12.3 ± 2.1 | 12.9 ± 2.0 | 12.6 ± 1.6 | 12.4 ± 2.5 | 12.4 ± 2.2 | 12.4 ± 1.9 | 0.835 † |
| (3) Height (in m) | 1.58 ± 0.11 | 1.62 ± 0.13 | 1.57 ± 0.09 | 1.59 ± 0.12 | 1.56 ± 0.12 | 1.60 ± 0.11 | 0.233 † |
| (4) Weight (in kg) | 74.4 ± 19.3 | 78.2 ± 20.5 | 73.7 ± 15.0 | 77.8 ± 18.6 | 74.4 ± 22.0 | 79.7 ± 21.2 | 0.670 † |
| (5) BMI (in kg/m2) | 29.5 ± 4.9 | 29.4 ± 4.3 | 29.7 ± 4.1 | 30.4 ± 4.5 | 30.1 ± 6.1 | 30.5 ± 4.7 | 0.867 † |
| (6) BMI-SDS | 2.41 ± 0.51 | 2.37 ± 0.40 | 2.41 ± 0.46 | 2.52 ± 0.49 | 2.46 ± 0.46 | 2.51 ± 0.44 | 0.631 † |
| (7) Adolescent status | |||||||
| <13 years old | 24 (60.0%) | 20 (52.6%) | 17 (50.0%) | 21 (50.0%) | 26 (57.8%) | 27 (62.8%) | 0.791 ‡ |
| ≥13 years old | 16 (40.0%) | 18 (47.4%) | 17 (50.0%) | 21 (50.0%) | 19 (42.2%) | 16 (37.2%) | |
| Overall (n = 205) | 2005–2006 (n = 31) | 2007–2008 (n = 36) | 2009–2011 (n = 29) | 2012–2014 (n = 30) | 2015–2017 (n = 39) | 2018–2020 (n = 40) | |
| (8) Migration background (yes) | 2 (6.4%) | 3 (8.3%) | 1 (3.4%) | 6 (20%) | 3 (7.7%) | 8 (20%) | 0.616 ‡ |
| (9) Media consumption (in h/day) | 1.90 ± 1.11 | 1.67 ± 0.96 | 1.35 ± 0.95 | 1.44 ± 0.89 | 5.25 ± 3.65 | 6.38 ± 4.11 | <0.001 † |
| Periods of Analysis | ||||||||
|---|---|---|---|---|---|---|---|---|
| Overall (n = 242) | 2005–2006 (n = 40) | 2007–2008 (n = 38) | 2009–2011 (n = 34) | 2012–2014 (n = 42) | 2015–2017 (n = 45) | 2018–2020 (n = 43) | p-Value | |
| (1) Physical appearance | 54.6 ± 15.7 | 49.6 ± 14.5 | 51.4 ± 15.9 | 57.5 ± 12.3 | 55.6 ± 15.7 | 56.6 ± 17.1 | 56.6 ± 16.9 | 0.063 † |
| (2) Social competence | 76.0 ± 18.5 | 77.3 ± 19.2 | 75.8 ± 21.7 | 79.0 ± 18.5 | 75.7 ± 15.4 | 72.3 ± 19.2 | 76.9 ± 17.4 | 0.713 † |
| (3) Scholastic competence | 75.2 ± 16.6 | 74.8 ± 19.5 | 77.7 ± 14.8 | 79.2 ± 14.5 | 73.4 ± 15.8 | 72.2 ± 15.9 | 75.3 ± 18.2 | 0.466 † |
| (4) Behavioural conduct | 74.0 ± 16.3 | 74.9 ± 17.1 | 74.5 ± 16.8 | 80.0 ± 15.5 | 71.9 ± 17.6 | 71.3 ± 13.8 | 73.0 ± 16.2 | 0.269 † |
| (5) Global self-worth | 72.7 ± 16.0 | 74.0 ± 16.8 | 69.8 ± 16.9 | 76.5 ± 12.8 | 69.8 ± 14.0 | 72.1 ± 18.1 | 74.5 ± 16.2 | 0.377 † |
| Domain | Periods of Analysis of Final Model | Unstandardized Coefficients | Standardized Coefficients | T | p-Value | 95.0% Confidence Interval for B | Adjusted R2 | |||
|---|---|---|---|---|---|---|---|---|---|---|
| B | std. error | ß | lower limit | upper limit | ||||||
| Physical appearance | 2005–2006 | media consumption | −6.510 | 2.204 | −0.481 | −2.954 | 0.006 * | −11.02 | −2.00 | 0.205 |
| 2007–2008 | age | −3.728 | 1.186 | −0.466 | −3.143 | 0.004 * | −6.14 | −1.32 | 0.423 | |
| BMI-SDS | −15.173 | 4.992 | −0.420 | −3.040 | 0.005 * | −25.33 | −5.02 | |||
| media consumption | 6.150 | 2.408 | 0.357 | 2.553 | 0.015 * | 1.25 | 11.05 | |||
| 2009–2011 | BMI-SDS | −17.225 | 5.840 | −0.605 | −2.950 | 0.007 * | −29.23 | −5.22 | 0.226 | |
| physical fitness | −27.541 | 10.140 | −0.557 | −2.716 | 0.012 * | −48.39 | −6.70 | |||
| 2012–2014 | age | −6.791 | 1.972 | −0.988 | −3.443 | 0.002 * | −10.85 | −2.74 | 0.343 | |
| adolescent status | 22.076 | 9.294 | 0.648 | 2.375 | 0.025 * | 2.97 | 41.18 | |||
| BMI-SDS | −23.201 | 6.178 | −0.651 | −3.756 | 0.001 * | −35.90 | −10.50 | |||
| 2015–2017 | BMI-SDS | −13.787 | 5.334 | −0.391 | −2.585 | 0.014 * | −24.59 | −2.98 | 0.130 | |
| 2018–2020 | physical fitness | −7.611 | 3.937 | −0.299 | −1.933 | 0.061 | −15.58 | 0.36 | 0.066 | |
| Domain | Periods of Analysis of Final Model | Unstandardized Coefficients | Standardized Coefficients | T | p-Value | 95.0% Confidence Interval for B | Adjusted R2 | |||
|---|---|---|---|---|---|---|---|---|---|---|
| B | std. error | ß | lower limit | upper limit | ||||||
| Scholastic competence | 2005–2006 | sex | −10.928 | 5.147 | −0.315 | −2.123 | 0.043 * | −21.49 | −0.37 | 0.350 |
| adolescent status | −10.386 | 5.283 | −0.296 | −1.966 | 0.060 | −21.23 | 0.45 | |||
| physical fitness | 23.025 | 7.274 | 0.474 | 3.165 | 0.004 * | 8.10 | 37.95 | |||
| 2007–2008 | BMI-SDS | 13.381 | 7.482 | 0.398 | 1.788 | 0.083 | −1.83 | 28.59 | 0.086 | |
| physical fitness | 19.616 | 8.512 | 0.512 | 2.305 | 0.027 * | 2.32 | 36.91 | |||
| 2009–2011 | age | −6.088 | 2.614 | −0.654 | −2.329 | 0.028 * | −11.47 | −0.70 | 0.294 | |
| adolescent status | 22.953 | 8.128 | 0.801 | 2.824 | 0.009 * | 6.21 | 39.69 | |||
| migration background | −26.634 | 12.689 | −0.341 | −2.099 | 0.046 * | −52.77 | −0.50 | |||
| 2012–2014 | adolescent status | −14.536 | 5.189 | −0.456 | −2.801 | 0.009 * | −25.18 | −3.89 | 0.236 | |
| migration background | 12.496 | 6.428 | 0.316 | 1.944 | 0.062 | −0.69 | 25.69 | |||
| 2015–2017 | BMI-SDS | −6.879 | 5.124 | −0.216 | −1.343 | 0.188 | −17.26 | 3.50 | 0.021 | |
| 2018–2020 | age | 1.317 | 1.479 | 0.143 | 0.891 | 0.379 | −1.68 | 4.31 | −0.005 | |
| Domain | Periods of Analysis of Final Model | Unstandardized Coefficients | Standardized Coefficients | T | p-Value | 95.0% Confidence Interval for B | Adjusted R2 | |||
|---|---|---|---|---|---|---|---|---|---|---|
| B | std. error | ß | lower limit | upper limit | ||||||
| Social competence | 2005–2006 | media consumption | −4.315 | 2.863 | −0.269 | −1.507 | 0.143 | −10.17 | 1.54 | 0.041 |
| 2007–2008 | physical fitness | 19.640 | 9.314 | 0.340 | 2.109 | 0.042 * | 0.71 | 38.57 | 0.090 | |
| 2009–2011 | BMI-SDS | 13.887 | 7.460 | 0.337 | 1.862 | 0.074 | −1.42 | 29.19 | 0.081 | |
| 2012–2014 | age | −3.797 | 1.572 | −0.617 | −2.415 | 0.023 * | −7.04 | −0.56 | 0.329 | |
| adolescent status | 17.552 | 7.731 | 0.575 | 2.270 | 0.032 * | 1.63 | 33.47 | |||
| physical fitness | 12.211 | 5.378 | 0.347 | 2.271 | 0.032 * | 1.14 | 23.29 | |||
| media consumption | 8.313 | 2.684 | 0.480 | 3.097 | 0.005 * | 2.79 | 13.84 | |||
| 2015–2017 | adolescent status | −11.492 | 6.633 | −0.284 | −1.733 | 0.092 | −24.96 | 1.97 | 0.271 | |
| physical fitness | 31.041 | 8.147 | 0.536 | 3.810 | 0.001 * | 14.50 | 47.58 | |||
| media consumption | 1.793 | 0.917 | 0.325 | 1.955 | 0.059 | −0.07 | 3.65 | |||
| 2018–2020 | BMI-SDS | −12.029 | 6.762 | −0.317 | −1.779 | 0.083 | −25.73 | 1.67 | 0.122 | |
| physical fitness | −12.031 | 4.458 | −0.481 | −2.698 | 0.010 * | −21.06 | −3.00 | |||
| Domain | Periods of Analysis of Final Model | Unstandardized Coefficients | Standardized Coefficients | T | p-Value | 95.0% Confidence Interval for B | Adjusted R2 | |||
|---|---|---|---|---|---|---|---|---|---|---|
| B | std. error | ß | lower limit | upper limit | ||||||
| Global self-worth | 2005–2006 | media consumption | −6.380 | 2.498 | −0.428 | −2.554 | 0.016 * | −11.49 | −1.27 | 0.155 |
| 2007–2008 | BMI-SDS | −9.828 | 6.516 | −0.247 | −1.508 | 0.140 | −23.06 | 3.40 | 0.034 | |
| 2009–2011 | adolescent status | 7.532 | 4.779 | 0.290 | 1.576 | 0.127 | −2.27 | 17.34 | 0.050 | |
| 2012–2014 | sex | −8.326 | 4.857 | −0.272 | −1.714 | 0.100 | −18.37 | 1.72 | 0.493 | |
| age | −9.238 | 1.826 | −1.482 | −5.060 | <0.001 * | −13.02 | −5.46 | |||
| adolescent status | 33.217 | 7.893 | 1.075 | 4.209 | <0.001 * | 16.89 | 49.54 | |||
| BMI-SDS | −23.491 | 5.799 | −0.727 | −4.051 | <0.001 * | −35.50 | −11.50 | |||
| migration background | −21.038 | 6.180 | −0.549 | −3.404 | 0.002 * | −33.82 | −8.25 | |||
| media consumption | 8.509 | 2.747 | 0.484 | 3.098 | 0.005 * | 2.83 | 14.19 | |||
| 2015–2017 | BMI-SDS | −17.232 | 5.891 | −0.433 | −2.925 | 0.006 * | −29.17 | −5.30 | 0.166 | |
| 2018–2020 | migration background | 5.534 | 6.452 | 0.138 | 0.858 | 0.396 | −7.53 | 18.60 | −0.007 | |
| Domain | Periods of Analysis of Final Model | Unstandardized Coefficients | Standardized Coefficients | T | p-Value | 95.0% Confidence Interval for B | Adjusted R2 | |||
|---|---|---|---|---|---|---|---|---|---|---|
| B | std. error | ß | lower limit | upper limit | ||||||
| Behavioural conduct | 2005–2006 | adolescent status | −10.512 | 4.556 | −0.328 | −2.307 | 0.029 * | −19.85 | −1.18 | 0.413 |
| physical fitness | 23.668 | 6.312 | 0.533 | 3.750 | 0.001 * | 10.74 | 36.60 | |||
| 2007–2008 | age | −1.160 | 1.437 | −0.135 | −0.808 | 0.425 | −4.08 | 1.76 | −0.010 | |
| 2009–2011 | adolescent status | 8.297 | 5.166 | 0.295 | 1.606 | 0.120 | −2.30 | 18.90 | 0.053 | |
| 2012–2014 | sex | −16.685 | 5.841 | −0.478 | −2.856 | 0.009 * | −28.77 | −4.60 | 0.435 | |
| age | −9.977 | 2.196 | −1.405 | −4.544 | <0.001 * | −14.52 | −5.44 | |||
| adolescent status | 31.483 | 9.493 | 0.894 | 3.317 | 0.003 * | 11.85 | 51.12 | |||
| BMI-SDS | −13.831 | 6.975 | −0.376 | −1.983 | 0.059 | −28.26 | 0.60 | |||
| migration background | −17.257 | 7.433 | −0.396 | −2.322 | 0.029 * | −32.63 | −1.88 | |||
| media consumption | 10.595 | 3.304 | 0.529 | 3.207 | 0.004 * | 3.76 | 17.43 | |||
| 2015–2017 | migration background | −20.648 | 7.727 | −0.402 | −2.672 | 0.011 * | −36.31 | −4.99 | 0.139 | |
| 2018–2020 | migration background | −10.326 | 6.436 | −0.252 | −1.604 | 0.117 | −23.35 | 2.70 | 0.039 | |
Disclaimer/Publisher’s Note: The statements, opinions and data contained in all publications are solely those of the individual author(s) and contributor(s) and not of MDPI and/or the editor(s). MDPI and/or the editor(s) disclaim responsibility for any injury to people or property resulting from any ideas, methods, instructions or products referred to in the content. |
© 2023 by the authors. Licensee MDPI, Basel, Switzerland. This article is an open access article distributed under the terms and conditions of the Creative Commons Attribution (CC BY) license (https://creativecommons.org/licenses/by/4.0/).
Share and Cite
Grünberg, L.; Eisenburger, N.; Ferrari, N.; Friesen, D.; Haas, F.; Klaudius, M.; Schmidt, L.; Joisten, C. Secular Trend of Self-Concept in the Context of Childhood Obesity—Data from the CHILT III Programme, Cologne. Children 2023, 10, 127. https://doi.org/10.3390/children10010127
Grünberg L, Eisenburger N, Ferrari N, Friesen D, Haas F, Klaudius M, Schmidt L, Joisten C. Secular Trend of Self-Concept in the Context of Childhood Obesity—Data from the CHILT III Programme, Cologne. Children. 2023; 10(1):127. https://doi.org/10.3390/children10010127
Chicago/Turabian StyleGrünberg, Lisa, Nina Eisenburger, Nina Ferrari, David Friesen, Fabiola Haas, Marlen Klaudius, Lisa Schmidt, and Christine Joisten. 2023. "Secular Trend of Self-Concept in the Context of Childhood Obesity—Data from the CHILT III Programme, Cologne" Children 10, no. 1: 127. https://doi.org/10.3390/children10010127
APA StyleGrünberg, L., Eisenburger, N., Ferrari, N., Friesen, D., Haas, F., Klaudius, M., Schmidt, L., & Joisten, C. (2023). Secular Trend of Self-Concept in the Context of Childhood Obesity—Data from the CHILT III Programme, Cologne. Children, 10(1), 127. https://doi.org/10.3390/children10010127