
Dynamic Changes of the Neutrophil-to-Lymphocyte Ratio, Systemic Inflammation Index, and Derived Neutrophil-to-Lymphocyte Ratio Independently Predict Invasive Mechanical Ventilation Need and Death in Critically Ill COVID-19 Patients

 ,
,
Abstract
:1. Introduction
2. Materials and Methods
2.1. Study Population
2.2. Clinical, Hematological, and Biochemical Examinations
2.3. Data Analysis
2.4. Statistical Analysis
3. Results
3.1. Baseline Characteristics of the Study Population
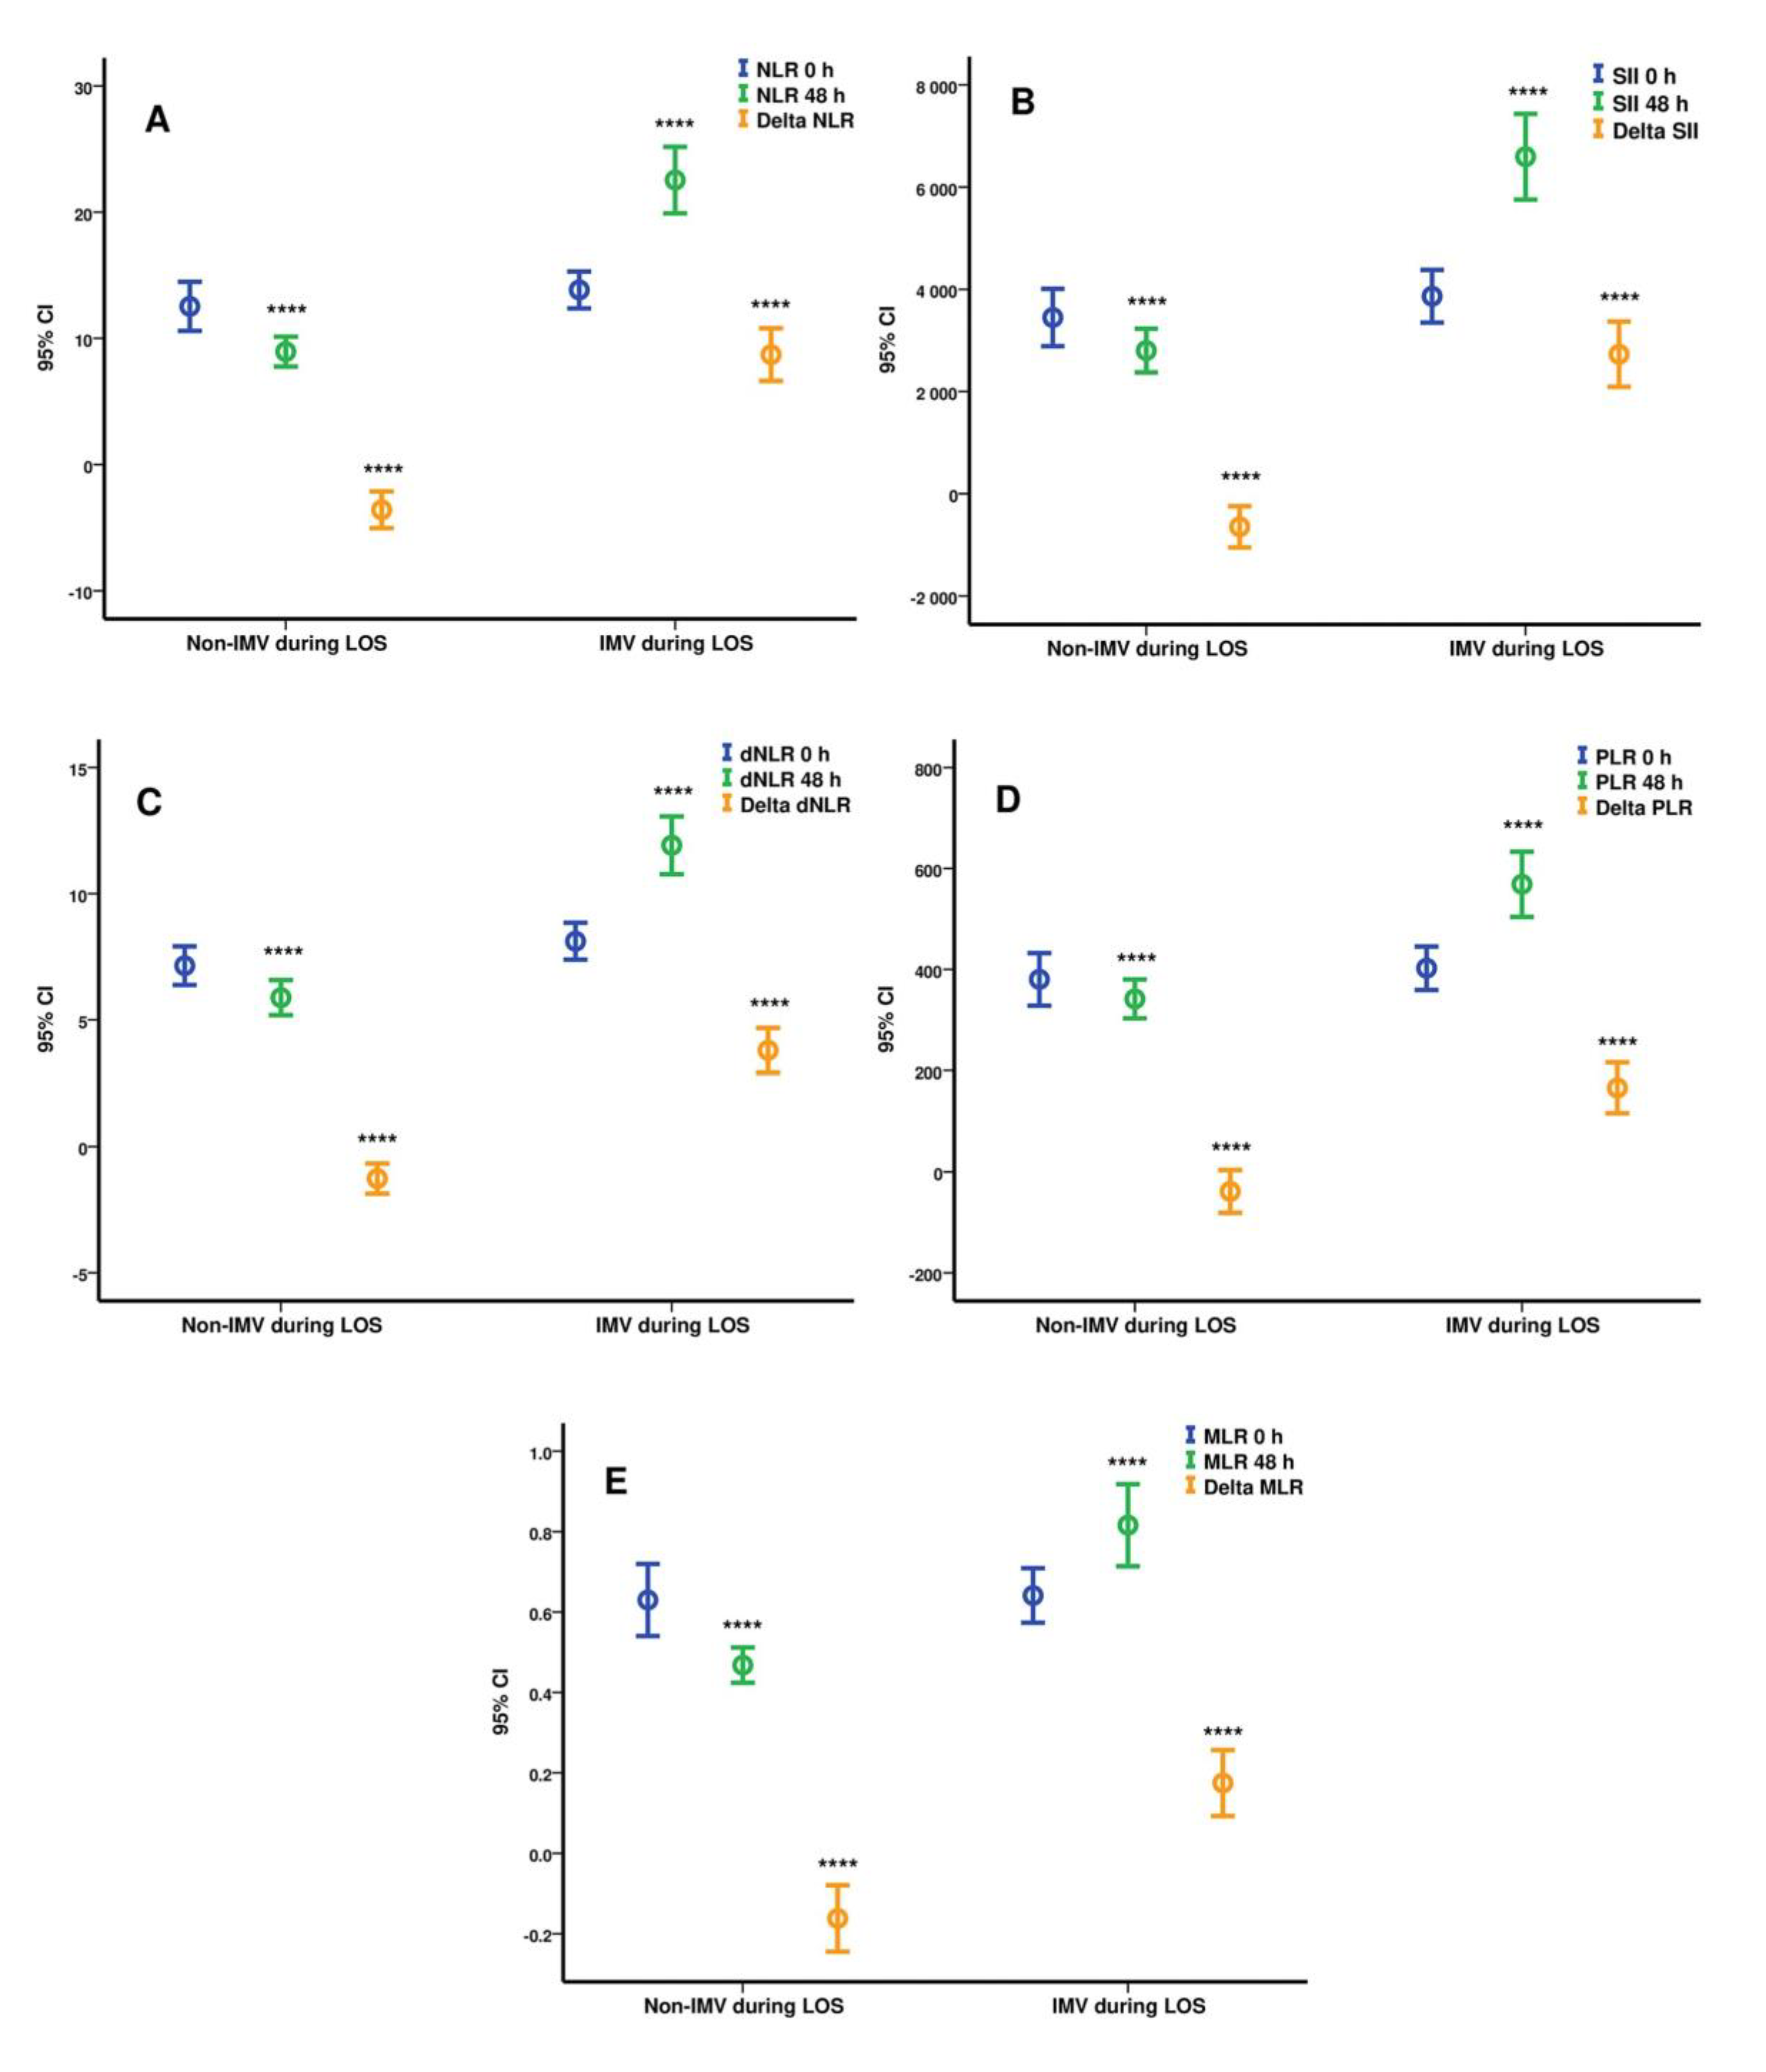
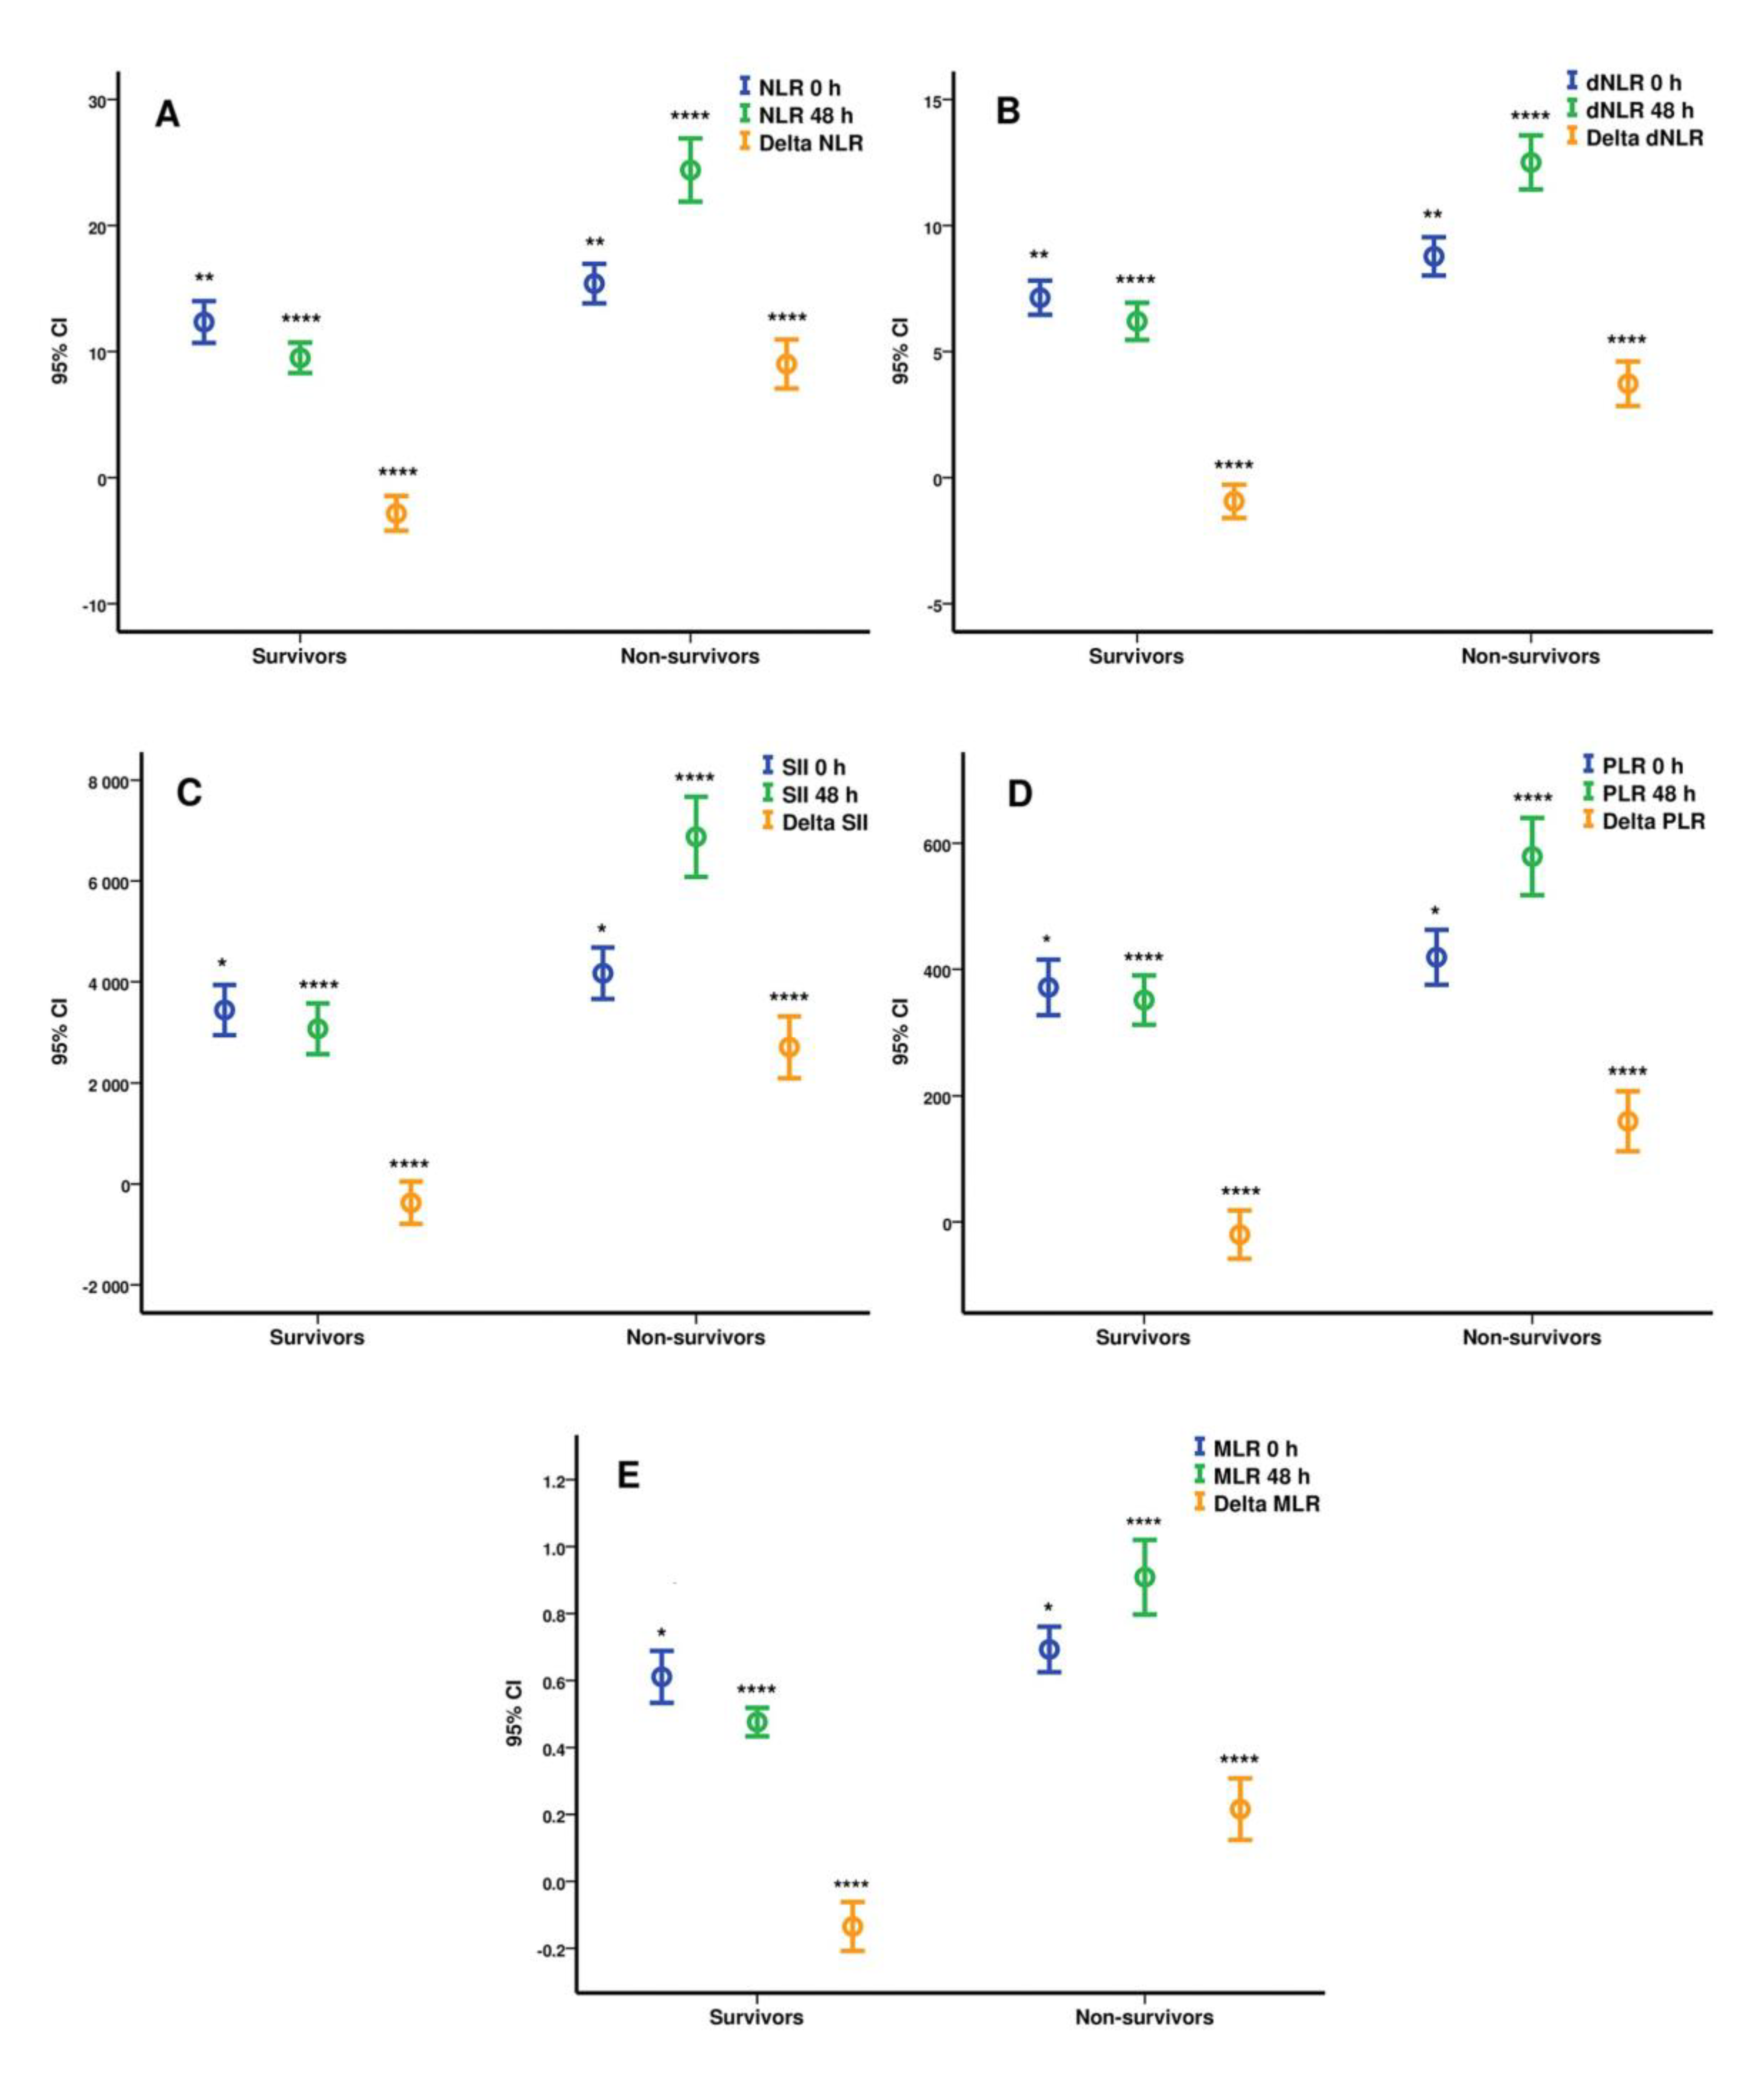
3.2. Hematological and Biochemical Parameters Analysis at ICU Admission and 48 h
3.3. Prediction Analysis and Cut-Off Values Identification Using ROC Curves for the Studied Hematological Indices
3.4. Independent Predictive Value of Hematological Indices after Multivariate Analysis
4. Discussion
5. Conclusions
Author Contributions
Funding
Institutional Review Board Statement
Informed Consent Statement
Data Availability Statement
Conflicts of Interest
References
- Weinreich, D.M.; Sivapalasingam, S.; Norton, T.; Ali, S.; Gao, H.; Bhore, R.; Xiao, J.; Hooper, A.T.; Hamilton, J.D.; Musser, B.J.; et al. REGEN-COV Antibody Combination and Outcomes in Outpatients with Covid-19. N. Engl. J. Med. 2021. [Google Scholar] [CrossRef]
- Moline, H.L.; Whitaker, M.; Deng, L.; Rhodes, J.C.; Milucky, J.; Pham, H.; Patel, K.; Anglin, O.; Reingold, A.; Chai, S.J.; et al. Effectiveness of COVID-19 Vaccines in Preventing Hospitalization Among Adults Aged ≥65 Years—COVID-NET, 13 States, February–April 2021. MMWR Morb. Mortal. Wkly. Rep. 2021, 70, 1088–1093. [Google Scholar] [CrossRef]
- Guan, W.-J.; Ni, Z.-Y.; Hu, Y.; Liang, W.-H.; Ou, C.-Q.; He, J.-X.; Liu, L.; Shan, H.; Lei, C.-L.; Hui, D.S.; et al. Clinical Characteristics of Coronavirus Disease 2019 in China. N. Engl. J. Med. 2020, 382, 1708–1720. [Google Scholar] [CrossRef]
- Alhazzani, W.; Evans, L.; Alshamsi, F.; Møller, M.H.; Ostermann, M.; Prescott, H.C.; Arabi, Y.M.; Loeb, M.; Gong, M.N.; Fan, E.; et al. Surviving Sepsis Campaign Guidelines on the Management of Adults With Coronavirus Disease 2019 (COVID-19) in the ICU: First Update. Crit. Care Med. 2021, 49, e219–e234. [Google Scholar] [CrossRef]
- López-Collazo, E.; Avendaño-Ortiz, J.; Martín-Quirós, A.; Aguirre, L.A. Immune Response and COVID-19: A mirror image of Sepsis. Int. J. Biol. Sci. 2020, 16, 2479–2489. [Google Scholar] [CrossRef] [PubMed]
- Singer, A.J.; Morley, E.J.; Meyers, K.; Fernandes, R.; Rowe, A.L.; Viccellio, P.; Thode, H.C.; Bracey, A.; Henry, M.C. Cohort of Four Thousand Four Hundred Four Persons Under Investigation for COVID-19 in a New York Hospital and Predictors of ICU Care and Ventilation. Ann. Emerg. Med. 2020, 76, 394–404. [Google Scholar] [CrossRef] [PubMed]
- Abate, S.M.; Ali, S.A.; Mantfardo, B.; Basu, B. Rate of Intensive Care Unit admission and outcomes among patients with coronavirus: A systematic review and Meta-analysis. PLoS ONE 2020, 15, e0235653. [Google Scholar] [CrossRef] [PubMed]
- Liu, X.; Zhang, R.; He, G. Hematological findings in coronavirus disease 2019: Indications of progression of disease. Ann. Hematol. 2020, 99, 1421–1428. [Google Scholar] [CrossRef]
- Terpos, E.; Ntanasis-Stathopoulos, I.; Elalamy, I.; Kastritis, E.; Sergentanis, T.N.; Politou, M.; Psaltopoulou, T.; Gerotziafas, G.; Dimopoulos, M.A. Hematological findings and complications of COVID -19. Am. J. Hematol. 2020, 95, 834–847. [Google Scholar] [CrossRef] [Green Version]
- Yang, H.; Xu, Y.; Li, Z.; Yan, L.; Wang, J.; Liao, P. The Clinical Implication of Dynamic Hematological Parameters in COVID-19: A Retrospective Study in Chongqing, China. Int. J. Gen. Med. 2021, 14, 4073–4080. [Google Scholar] [CrossRef] [PubMed]
- Huang, W.; Berube, J.; McNamara, M.; Saksena, S.; Hartman, M.; Arshad, T.; Bornheimer, S.J.; O’Gorman, M. Lymphocyte Subset Counts in COVID -19 Patients: A Meta-Analysis. Cytom. Part A 2020, 97, 772–776. [Google Scholar] [CrossRef] [PubMed]
- Yang, A.-P.; Liu, J.-P.; Tao, W.-Q.; Li, H.-M. The diagnostic and predictive role of NLR, d-NLR and PLR in COVID-19 patients. Int. Immunopharmacol. 2020, 84, 106504. [Google Scholar] [CrossRef]
- Liu, Y.; Du, X.; Chen, J.; Jin, Y.; Peng, L.; Wang, H.H.; Luo, M.; Chen, L.; Zhao, Y. Neutrophil-to-lymphocyte ratio as an independent risk factor for mortality in hospitalized patients with COVID-19. J. Infect. 2020, 81, e6–e12. [Google Scholar] [CrossRef] [PubMed]
- Seyit, M.; Avci, E.; Nar, R.; Senol, H.; Yilmaz, A.; Ozen, M.; Oskay, A.; Aybek, H. Neutrophil to lymphocyte ratio, lymphocyte to monocyte ratio and platelet to lymphocyte ratio to predict the severity of COVID-19. Am. J. Emerg. Med. 2021, 40, 110–114. [Google Scholar] [CrossRef]
- Fois, A.G.; Paliogiannis, P.; Scano, V.; Cau, S.; Babudieri, S.; Perra, R.; Ruzzittu, G.; Zinellu, E.; Pirina, P.; Carru, C.; et al. The Systemic Inflammation Index on Admission Predicts In-Hospital Mortality in COVID-19 Patients. Molecules 2020, 25, 5725. [Google Scholar] [CrossRef] [PubMed]
- Grasselli, G.; Greco, M.; Zanella, A.; Albano, G.; Antonelli, M.; Bellani, G.; Bonanomi, E.; Cabrini, L.; Carlesso, E.; Castelli, G.; et al. Risk Factors Associated With Mortality Among Patients With COVID-19 in Intensive Care Units in Lombardy, Italy. JAMA Intern. Med. 2020, 180, 1345. [Google Scholar] [CrossRef]
- Santus, P.; Radovanovic, D.; Saderi, L.; Marino, P.; Cogliati, C.; De Filippis, G.; Rizzi, M.; Franceschi, E.; Pini, S.; Giuliani, F.; et al. Severity of respiratory failure at admission and in-hospital mortality in patients with COVID-19: A prospective observational multicentre study. BMJ Open 2020, 10, e043651. [Google Scholar] [CrossRef]
- Poly, T.N.; Islam, M.M.; Yang, H.C.; Lin, M.C.; Jian, W.-S.; Hsu, M.-H.; Li, Y.-C.J. Obesity and Mortality Among Patients Diagnosed With COVID-19: A Systematic Review and Meta-Analysis. Front. Med. 2021, 8, 620044. [Google Scholar] [CrossRef]
- Khalid, A.; Ali Jaffar, M.; Khan, T.; Abbas Lail, R.; Ali, S.; Aktas, G.; Waris, A.; Javaid, A.; Ijaz, N.; Muhammad, N. Hemato-logical and Biochemical Parameters as Diagnostic and Prognostic Markers in SARS-COV-2 Infected Patients of Pakistan: A Retrospective Comparative Analysis. Hematology 2021, 26, 529–542. [Google Scholar] [CrossRef]
- Bolondi, G.; Russo, E.; Gamberini, E.; Circelli, A.; Meca, M.C.C.; Brogi, E.; Viola, L.; Bissoni, L.; Poletti, V.; Agnoletti, V. Iron metabolism and lymphocyte characterisation during Covid-19 infection in ICU patients: An observational cohort study. World J. Emerg. Surg. 2020, 15, 41. [Google Scholar] [CrossRef]
- Liu, Y.; Yang, Y.; Zhang, C.; Huang, F.; Wang, F.; Yuan, J.; Wang, Z.; Li, J.; Li, J.; Feng, C.; et al. Clinical and biochemical indexes from 2019-nCoV infected patients linked to viral loads and lung injury. Sci. China Life Sci. 2020, 63, 364–374. [Google Scholar] [CrossRef] [Green Version]
- Metzemaekers, M.; Cambier, S.; Blanter, M.; Vandooren, J.; de Carvalho, A.C.; Malengier-Devlies, B.; Vanderbeke, L.; Jacobs, C.; Coenen, S.; Martens, E.; et al. Kinetics of peripheral blood neutrophils in severe coronavirus disease 2019. Clin. Transl. Immunol. 2021, 10, e1271. [Google Scholar] [CrossRef] [PubMed]
- Topp, G.; Bouyea, M.; Cochran-Caggiano, N.; Ata, A.; Torres, P.; Jacob, J.; Wales, D. Biomarkers Predictive of Extubation and Survival of COVID-19 Patients. Cureus 2021, 13, e15462. [Google Scholar] [CrossRef] [PubMed]
- Simadibrata, D.M.; Calvin, J.; Wijaya, A.D.; Ibrahim, N.A.A. Neutrophil-to-lymphocyte ratio on admission to predict the severity and mortality of COVID-19 patients: A meta-analysis. Am. J. Emerg. Med. 2021, 42, 60–69. [Google Scholar] [CrossRef] [PubMed]
- Shang, W.; Dong, J.; Ren, Y.; Tian, M.; Li, W.; Hu, J.; Li, Y. The value of clinical parameters in predicting the severity of COVID-19. J. Med. Virol. 2020, 92, 2188–2192. [Google Scholar] [CrossRef]
- Moradi, E.V.; Teimouri, A.; Rezaee, R.; Morovatdar, N.; Foroughian, M.; Layegh, P.; Kakhki, B.R.; Koupaei, S.R.A.; Ghorani, V. Increased age, neutrophil-to-lymphocyte ratio (NLR) and white blood cells count are associated with higher COVID-19 mortality. Am. J. Emerg. Med. 2021, 40, 11–14. [Google Scholar] [CrossRef] [PubMed]
- Cai, J.; Li, H.; Zhang, C.; Chen, Z.; Liu, H.; Lei, F.; Qin, J.-J.; Liu, Y.-M.; Zhou, F.; Song, X.; et al. The Neutrophil-to-Lymphocyte Ratio Determines Clinical Efficacy of Corticosteroid Therapy in Patients with COVID-19. Cell Metab. 2021, 33, 258–269.e3. [Google Scholar] [CrossRef]
- Velazquez, S.; Madurga, R.; Castellano, J.M.; Rodriguez-Pascual, J.; Obregon, S.R.D.A.D.; Jimeno, S.; Montero, J.I.; Wichner, P.S.V.; López-Escobar, A. Hemogram-derived ratios as prognostic markers of ICU admission in COVID-19. BMC Emerg. Med. 2021, 21, 89. [Google Scholar] [CrossRef]
- Ding, X.; Yu, Y.; Lu, B.; Huo, J.; Chen, M.; Kang, Y.; Lou, J.; Liu, Z. Dynamic profile and clinical implications of hematological parameters in hospitalized patients with coronavirus disease 2019. Clin. Chem. Lab. Med. 2020, 58, 1365–1371. [Google Scholar] [CrossRef]
- Huang, S.; Liu, M.; Li, X.; Shang, Z.; Zhang, T.; Lu, H. Significance of Neutrophil-To-Lymphocyte Ratio, Plate-let-To-Lymphocyte Ratio for Predicting Clinical Outcomes in COVID-19. medRxiv 2020. [Google Scholar] [CrossRef]
- Huang, Z.; Fu, Z.; Huang, W.; Huang, K. Prognostic value of neutrophil-to-lymphocyte ratio in sepsis: A meta-analysis. Am. J. Emerg. Med. 2020, 38, 641–647. [Google Scholar] [CrossRef]
- Yildiz, H.; Castanares-Zapatero, D.; Pierman, G.; Pothen, L.; De Greef, J.; Nana, F.A.; Rodriguez-Villalobos, H.; Belkhir, L.; Yombi, J.C. Validation of Neutrophil-to-Lymphocyte Ratio Cut-off Value Associated with High In-Hospital Mortality in COVID-19 Patients. Int. J. Gen. Med. 2021, 14, 5111–5117. [Google Scholar] [CrossRef]
- Petrak, R.M.; Van Hise, N.W.; Skorodin, N.C.; Fliegelman, R.M.; Chundi, V.; Didwania, V.; Han, A.; Harting, B.P.; Hines, D.W. Early Tocilizumab Dosing Is Associated With Improved Survival in Critically Ill Patients Infected With Severe Acute Respiratory Syndrome Coronavirus-2. Crit. Care Explor. 2021, 3, e0395. [Google Scholar] [CrossRef] [PubMed]
- Lou, M.; Luo, P.; Tang, R.; Peng, Y.; Yu, S.; Huang, W.; He, L. Relationship between neutrophil-lymphocyte ratio and insulin resistance in newly diagnosed type 2 diabetes mellitus patients. BMC Endocr. Disord. 2015, 15, 9. [Google Scholar] [CrossRef] [PubMed] [Green Version]
- Bhat, T.; Teli, S.; Rijal, J.; Bhat, H.; Raza, M.; Khoueiry, G.; Meghani, M.; Akhtar, M.; Costantino, T. Neutrophil to lymphocyte ratio and cardiovascular diseases: A review. Expert Rev. Cardiovasc. Ther. 2013, 11, 55–59. [Google Scholar] [CrossRef]
- Yoshitomi, R.; Nakayama, M.; Sakoh, T.; Fukui, A.; Katafuchi, E.; Seki, M.; Tsuda, S.; Nakano, T.; Tsuruya, K.; Kitazono, T. High neutrophil/lymphocyte ratio is associated with poor renal outcomes in Japanese patients with chronic kidney disease. Ren. Fail. 2019, 41, 238–243. [Google Scholar] [CrossRef] [PubMed] [Green Version]
- Frenkel, A.; Kachko, E.; Novack, V.; Klein, M.; Brotfain, E.; Koyfman, L.; Maimon, N. The Association of Glucocorticosteroid Treatment with WBC Count in Patients with COPD Exacerbation. J. Clin. Med. 2019, 8, 1697. [Google Scholar] [CrossRef] [Green Version]
- Hartog, N.L.; Davis, A.T.; Prokop, J.W.; Walls, A.; Rajasekaran, S. Monitoring neutrophil-to-lymphocyte ratio in patients with coronavirus disease 2019 receiving tocilizumab. Ann. Allergy Asthma Immunol. 2021, 126, 306–308. [Google Scholar] [CrossRef]
- Ghang, B.; Kwon, O.; Hong, S.; Lee, C.-K.; Yoo, B.; Kim, Y.-G. Neutrophil-to-lymphocyte ratio is a reliable marker of treatment response in rheumatoid arthritis patients during tocilizumab therapy. Mod. Rheumatol. 2017, 27, 405–410. [Google Scholar] [CrossRef]
- Moots, R.J.; Sebba, A.; Rigby, W.; Ostor, A.; Porter-Brown, B.; Donaldson, F.; Dimonaco, S.; Rubbert-Roth, A.; Van Vollenhoven, R.; Genovese, M.C. Effect of tocilizumab on neutrophils in adult patients with rheumatoid arthritis: Pooled analysis of data from phase 3 and 4 clinical trials. Rheumatology 2016, 56, 541–549. [Google Scholar] [CrossRef] [Green Version]


| Total Sample N = 272 | Group 1 N = 33 | Group 2 N = 134 | Group 3 N = 105 | p Value | Survivors N = 130 | Non-Survivors N = 142 | p Value | |
|---|---|---|---|---|---|---|---|---|
| Age ¶ | 62.7 ± 12 | 64.9 ± 9.9 | 65.4 ± 11 | 58.5 ± 12.4 | <0.0001 * | 58.2 ± 11.8 | 66.8 ± 10.5 | <0.0001 * |
| Gender F/M% | 31.6/68.4 | 33.3/66.7 | 35.1/64.9 | 26.7/73.3 | 0.372 ** | 28.5/71.5 | 34.5/65.5 | 0.284 ** |
| Obesity ⸕ | 30.9/69.1 | 30.3/69.7 | 26.9/73.1 | 36.2/63.8 | 0.301 ** | 33.1/66.9 | 28.9/71.1 | 0.454 ** |
| CCI ¶ | 3.61 ± 2.13 | 4.45 ± 2 | 4.29 ± 2 | 2.5 ± 1.77 | <0.0001 * | 2.53 ± 1.7 | 4.6 ± 2 | <0.0001 *** |
| SOFA Score 0 h ¶ | 4 ± 1.7 | 6.88 ± 2.26 | 3.72 ± 1.23 | 3.45 ± 1 | <0.0001 * | 3.62 ± 1.36 | 4.34 ± 1.9 | 0.001 *** |
| SOFA Score 48 h ¶ | 5.1 ± 2.9 | 8.55 ± 2.91 | 6.24 ± 2.21 | 4 ± 1.7 | <0.0001 * | 3.25 (±1.84) | 6.73 ± 2.65 | <0.0001 *** |
| Cardiac disease ⸕ | 22.4/77.6 | 12.1/87.9 | 13.4/86.6 | 37.1/62.9 | <0.001 ** | 33.8/66.2 | 12/88 | <0.001 ** |
| Diabetes mellitus ⸕ | 61.8/38.2 | 63.6/36.4 | 52.2/47.8 | 73.3/26.7 | 0.004 ** | 71.5/28.5 | 52.8/47.2 | 0.002 ** |
| Respiratory disease⸕ | 83.46/16.54 | 63.6/36.4 | 81.35/18.65 | 92.24/7.76 | 0.067 ** | 90/10 | 77.47/22.53 | 0.082 ** |
| CKD ⸕ | 90.1/9.9 | 84.8/15.2 | 88.8/11.2 | 93.3/6.7 | 0.287 ** | 92.3/7.7 | 88/12 | 0.238 ** |
| Liver disease ⸕ | 90/10 | 78.79/21.21 | 89.56/10.44 | 94.3/5.7 | 0.082 ** | 90/10 | 88.02/11.98 | 0.104 ** |
| Cancer ⸕ | 96/4 | 91/9 | 97/3 | 96.2/3.8 | 0.13 ** | 96.15/3.85 | 95.78/4.22 | 0.22 ** |
| Tocilizumab ⸕ | 87.5/12.5 | 87.9/12.1 | 89.6/10.4 | 84.8/15.2 | 0.538 ** | 83.1/16.9 | 91.5/8.5 | 0.035 ** |
| Anakinra ⸕ | 91.5/8.5 | 100/0 | 88.8/11.2 | 92.4/7.6 | 0.109 ** | 91.5/8.5 | 91.5/8.5 | 0.997 ** |
| Remdesivir ⸕ | 63.6/36.4 | 69.7/30.3 | 55.2/44.8 | 72.4/27.6 | 0.018 ** | 70/30 | 57.7/42.3 | 0.036 ** |
| HAIs ⸕ | 52.2/47.8 | 45.5/54.5 | 29.1/70.9 | 83.8/16.2 | <0.0001 ** | 72.3/27.7 | 33.8/66.2 | <0.0001 *** |
| ICU LOS ¶ | 12.97 ± 7 | 10.6 ± 6 | 14.14 ± 8.6 | 12.25 ± 4.3 | 0.044 * | 14.2 ± 7.1 | 11.9 ± 6.8 | <0.001 ** |
| ICU mortality% | 52.2 | 81.7 | 76.1 | 13.3 | <0.0001 ** |
| Values at ICU Admission (Mean ± SD) | Total Sample N = 272 | Group 1 N = 33 | Group 2 N = 134 | Group 3 N = 105 | p Value | Survivors N = 130 | Non-Survivors N = 142 | p Value |
|---|---|---|---|---|---|---|---|---|
| White blood cells (×103/μL) | 10.8 ± 4.51 | 13.51 ± 6.69 | 10.59 ± 4.15 | 10.22 ± 3.8 | 0.024 * | 10.42 ± 4.08 | 11.16 ± 4.85 | 0.380 ** |
| Neutrophils (×103/μL) | 9.42 ± 4.23 | 12.11 ± 6.05 | 9.3 ± 3.93 | 8.73 ± 3.58 | 0.007 * | 8.92 ± 3.85 | 9.88 ± 4.51 | 0.113 ** |
| Lymphocytes (×103/μL) | 0.87 ± 0.68 | 0.82 ± 0.56 | 0.8 ± 0.37 | 0.99 ± 0.94 | 0.225 * | 0.99 ± 0.87 | 0.77 ± 0.4 | 0.003 ** |
| Monocytes (×103/μL) | 0.48 ± 0.29 | 0.58 ± 0.44 | 0.46 ± 0.27 | 0.48 ± 0.26 | 0.425 * | 0.48 ± 0.26 | 0.49 ± 0.32 | 0.672 ** |
| Platelets (×103/μL) | 271 ± 106 | 256 ± 94 | 271 ± 112 | 275 ± 101 | 0.694 * | 277 ± 102 | 265 ± 110 | 0.207 ** |
| dNLR | 7.99 ± 4.34 | 10.12 ± 5.17 | 8.13 ± 4.23 | 7.14 ± 3.96 | 0.004 * | 7.13 ± 3.9 | 8.77 ± 4.58 | 0.002 ** |
| NLR | 13.93 ± 9.59 | 18.7 ± 11.29 | 13.85 ± 8.4 | 12.53 ± 10.04 | 0.002 * | 12.34 ± 9.54 | 15.4 ± 9.43 | 0.001 ** |
| SII | 3821 ± 2994 | 4820 ± 3220 | 3866 ± 2971 | 3449 ± 2903 | 0.042 * | 3440 ± 2868 | 4169 ± 3073 | 0.018 ** |
| MLR | 0.65 ± 0.42 | 0.77 ± 0.44 | 0.64 ± 0.39 | 0.62 ± 0.46 | 0.114 * | 0.61 ± 0.44 | 0.69 ± 0.4 | 0.017 ** |
| PLR | 396 ± 259 | 426 ± 275 | 402 ± 248 | 380 ± 269 | 0.332 * | 371 ± 253 | 419 ± 263 | 0.04 ** |
| C-reactive protein (mg/L) | 143 ± 90 | 163 ± 90 | 147 ± 91 | 133 ± 87 | 0.169 * | 137 ± 90 | 150 ± 89 | 0.166 ** |
| D-dimers (ng/mL) | 2910 ± 8728 | 3930 ± 8272 | 2645 ± 7985 | 2924 ± 9770 | <0.001 * | 2588 ± 8853 | 3207 ± 8632 | <0.001 ** |
| P/F ratio | 125 ± 54 | 134 ± 64 | 117 ± 51 | 132 ± 54 | 0.039 * | 132 ± 56 | 117 ± 52 | 0.011 ** |
| Values at 48 h (Mean ± SD) | ||||||||
| White blood cells (×103/μL) | 11.59 ± 5.09 | 14.53 ± 7.86 | 12.55 ± 4.77 | 9.44 ± 3.3 | <0.0001 * | 9.8 ± 3.73 | 13.24 ± 5.61 | <0.0001 ** |
| Neutrophils (×103/μL) | 10.22 ± 4.95 | 13.12 ± 7.39 | 11.41 ± 4.63 | 7.8 ± 3.06 | <0.0001 * | 8.15 ± 3.56 | 12.12 ± 5.3 | <0.0001 ** |
| Lymphocytes (×103/μL) | 0.86 ± 0.66 | 0.8 ± 0.62 | 0.66 ± 0.41 | 1.14 ± 0.82 | <0.0001 * | 1.14 ± 0.8 | 0.61 ± 0.36 | <0.0001 ** |
| Monocytes (×103/μL) | 0.47 ± 0.28 | 0.57 ± 0.35 | 0.45 ± 0.27 | 0.48 ± 0.28 | 0.085 | 0.48 ± 0.27 | 0.47 ± 0.29 | 0.555 ** |
| Platelets (×103/μL) | 299 ± 115 | 277 ± 141 | 296 ± 114 | 309 ± 106 | 0.190 | 311 ± 104 | 288 ± 123 | 0.034 ** |
| dNLR | 9.49 ± 6.33 | 11.21 ± 6.79 | 11.89 ± 6.61 | 5.88 ± 6.61 | <0.0001 * | 6.2 ± 4.24 | 12.5 ± 6.45 | <0.0001 ** |
| NLR | 17.28 ± 14.05 | 22.76 ± 14.92 | 22.46 ± 15.18 | 8.95 ± 6.1 | <0.0001 * | 9.5 ± 6.94 | 24.4 ± 15.12 | <0.0001 ** |
| SII | 5055 ± 4417 | 6148 ± 4966 | 6552 ± 4843 | 2802 ± 2206 | <0.0001 * | 3068 ± 2893 | 6875 ± 4782 | <0.0001 ** |
| MLR | 0.7 ± 0.55 | 0.99 ± 0.83 | 0.81 ± 0.58 | 0.46 ± 0.22 | <0.0001 * | 0.47 ± 0.24 | 0.9 ± 0.67 | <0.0001 ** |
| PLR | 470 ± 329 | 489 ± 342 | 566 ± 373 | 342 ± 199 | <0.0001 * | 351 ± 226 | 579 ± 369 | <0.0001 ** |
| Delta dNLR | 1.49 ± 5.19 | 1.09 ± 6.53 | 3.76 ± 5.09 | −1.26 ± 3.09 | <0.0001 * | −0.93 ± 3.79 | 3.72 ± 5.3 | <0.0001 ** |
| Delta NLR | 3.34 ± 11.68 | 4.05 ± 9.87 | 8.6 ± 12.03 | −3.58 ± 7.48 | <0.0001 * | −2.83 ± 7.92 | 9 ± 11.71 | <0.0001 ** |
| Delta SII | 1234 ± 3491 | 1327 ± 3492 | 2686 ± 3687 | −646 ± 2080 | <0.0001 * | −372 ± 2416 | 2706 ± 3678 | <0.0001 ** |
| Delta MLR | 0.04 ± 0.52 | 0.22 ± 0.75 | 0.16 ± 0.47 | −0.16 ± 0.42 | <0.0001 * | −0.13 ± 0.42 | 0.21 ± 0.55 | <0.0001 ** |
| Delta PLR | 74 ± 272 | 64 ± 225 | 164 ± 289 | −39 ± 219 | <0.0001 * | −20 ± 221 | 160 ± 287 | <0.0001 ** |
| C-reactive protein (mg/L) | 108 ± 83 | 125 ± 96 | 120 ± 84 | 88 ± 73 | 0.004 * | 94 ± 79 | 121 ± 85 | 0.004 ** |
| D-dimers (ng/mL) | 2261 ± 7200 | 2368 ± 3883 | 2098 ± 4800 | 2432 ± 10031 | <0.0001 * | 2186 ± 9046 | 2329 ± 4955 | <0.0001 ** |
| P/F ratio | 139 ± 65 | 143 ± 55 | 113 ± 50 | 171 ± 70 | <0.0001 * | 162 ± 70 | 117 ± 52 | <0.0001 ** |
| Need for IMV Prediction | Death Prediction | |||||||||||||
|---|---|---|---|---|---|---|---|---|---|---|---|---|---|---|
| AUC | 95% CI | p Value | AUC | 95% CI | p Value | |||||||||
| NLR 0 h | 0.573 | 0.500–0.647 | 0.052 | 0.621 | 0.554–0.687 | 0.001 | ||||||||
| SII 0 h | 0.548 | 0.475–0.622 | 0.201 | 0.583 | 0.516–0.651 | 0.018 | ||||||||
| dNLR 0 h | 0.568 | 0.494–0.642 | 0.071 | 0.609 | 0.542–0.676 | 0.002 | ||||||||
| PLR 0 h | 0.555 | 0.481–0.629 | 0.142 | 0.572 | 0.504–0.640 | 0.040 | ||||||||
| MLR 0 h | 0.521 | 0.447–0.595 | 0.598 | 0.584 | 0.516–0.652 | 0.017 | ||||||||
| NLR 48 h | 0.840 | 0.789–0.891 | <0.0001 | 0.867 | 0.825–0.909 | <0.0001 | ||||||||
| SII 48 h | 0.786 | 0.729–0.843 | <0.0001 | 0.796 | 0.744–0.848 | <0.0001 | ||||||||
| dNLR 48 h | 0.812 | 0.758–0.866 | <0.0001 | 0.831 | 0.784–0.879 | <0.0001 | ||||||||
| PLR 48 h | 0.730 | 0.667–0.794 | <0.0001 | 0.740 | 0.682–0.798 | <0.0001 | ||||||||
| MLR 48 h | 0.709 | 0.645–0.775 | <0.0001 | 0.747 | 0.689–0.805 | <0.0001 | ||||||||
| ΔNLR | 0.876 | 0.824–0.920 | <0.0001 | 0.846 | 0.799–0.894 | <0.0001 | ||||||||
| ΔSII | 0.834 | 0.781–0.887 | <0.0001 | 0.793 | 0.739–0.847 | <0.0001 | ||||||||
| ΔdNLR | 0.826 | 0.772–0.880 | <0.0001 | 0.791 | 0.736–0.845 | <0.0001 | ||||||||
| ΔPLR | 0.774 | 0.714–0.834 | <0.0001 | 0.742 | 0.683–0.802 | <0.0001 | ||||||||
| ΔMLR | 0.713 | 0.648–0.778 | <0.0001 | 0.700 | 0.637–0.762 | <0.0001 | ||||||||
| Need for IMV Prediction | ||||||||||||||
| AUC | 95% CI | p Value | Cut-off | Sn% | Sp% | PPV% | NPV% | |||||||
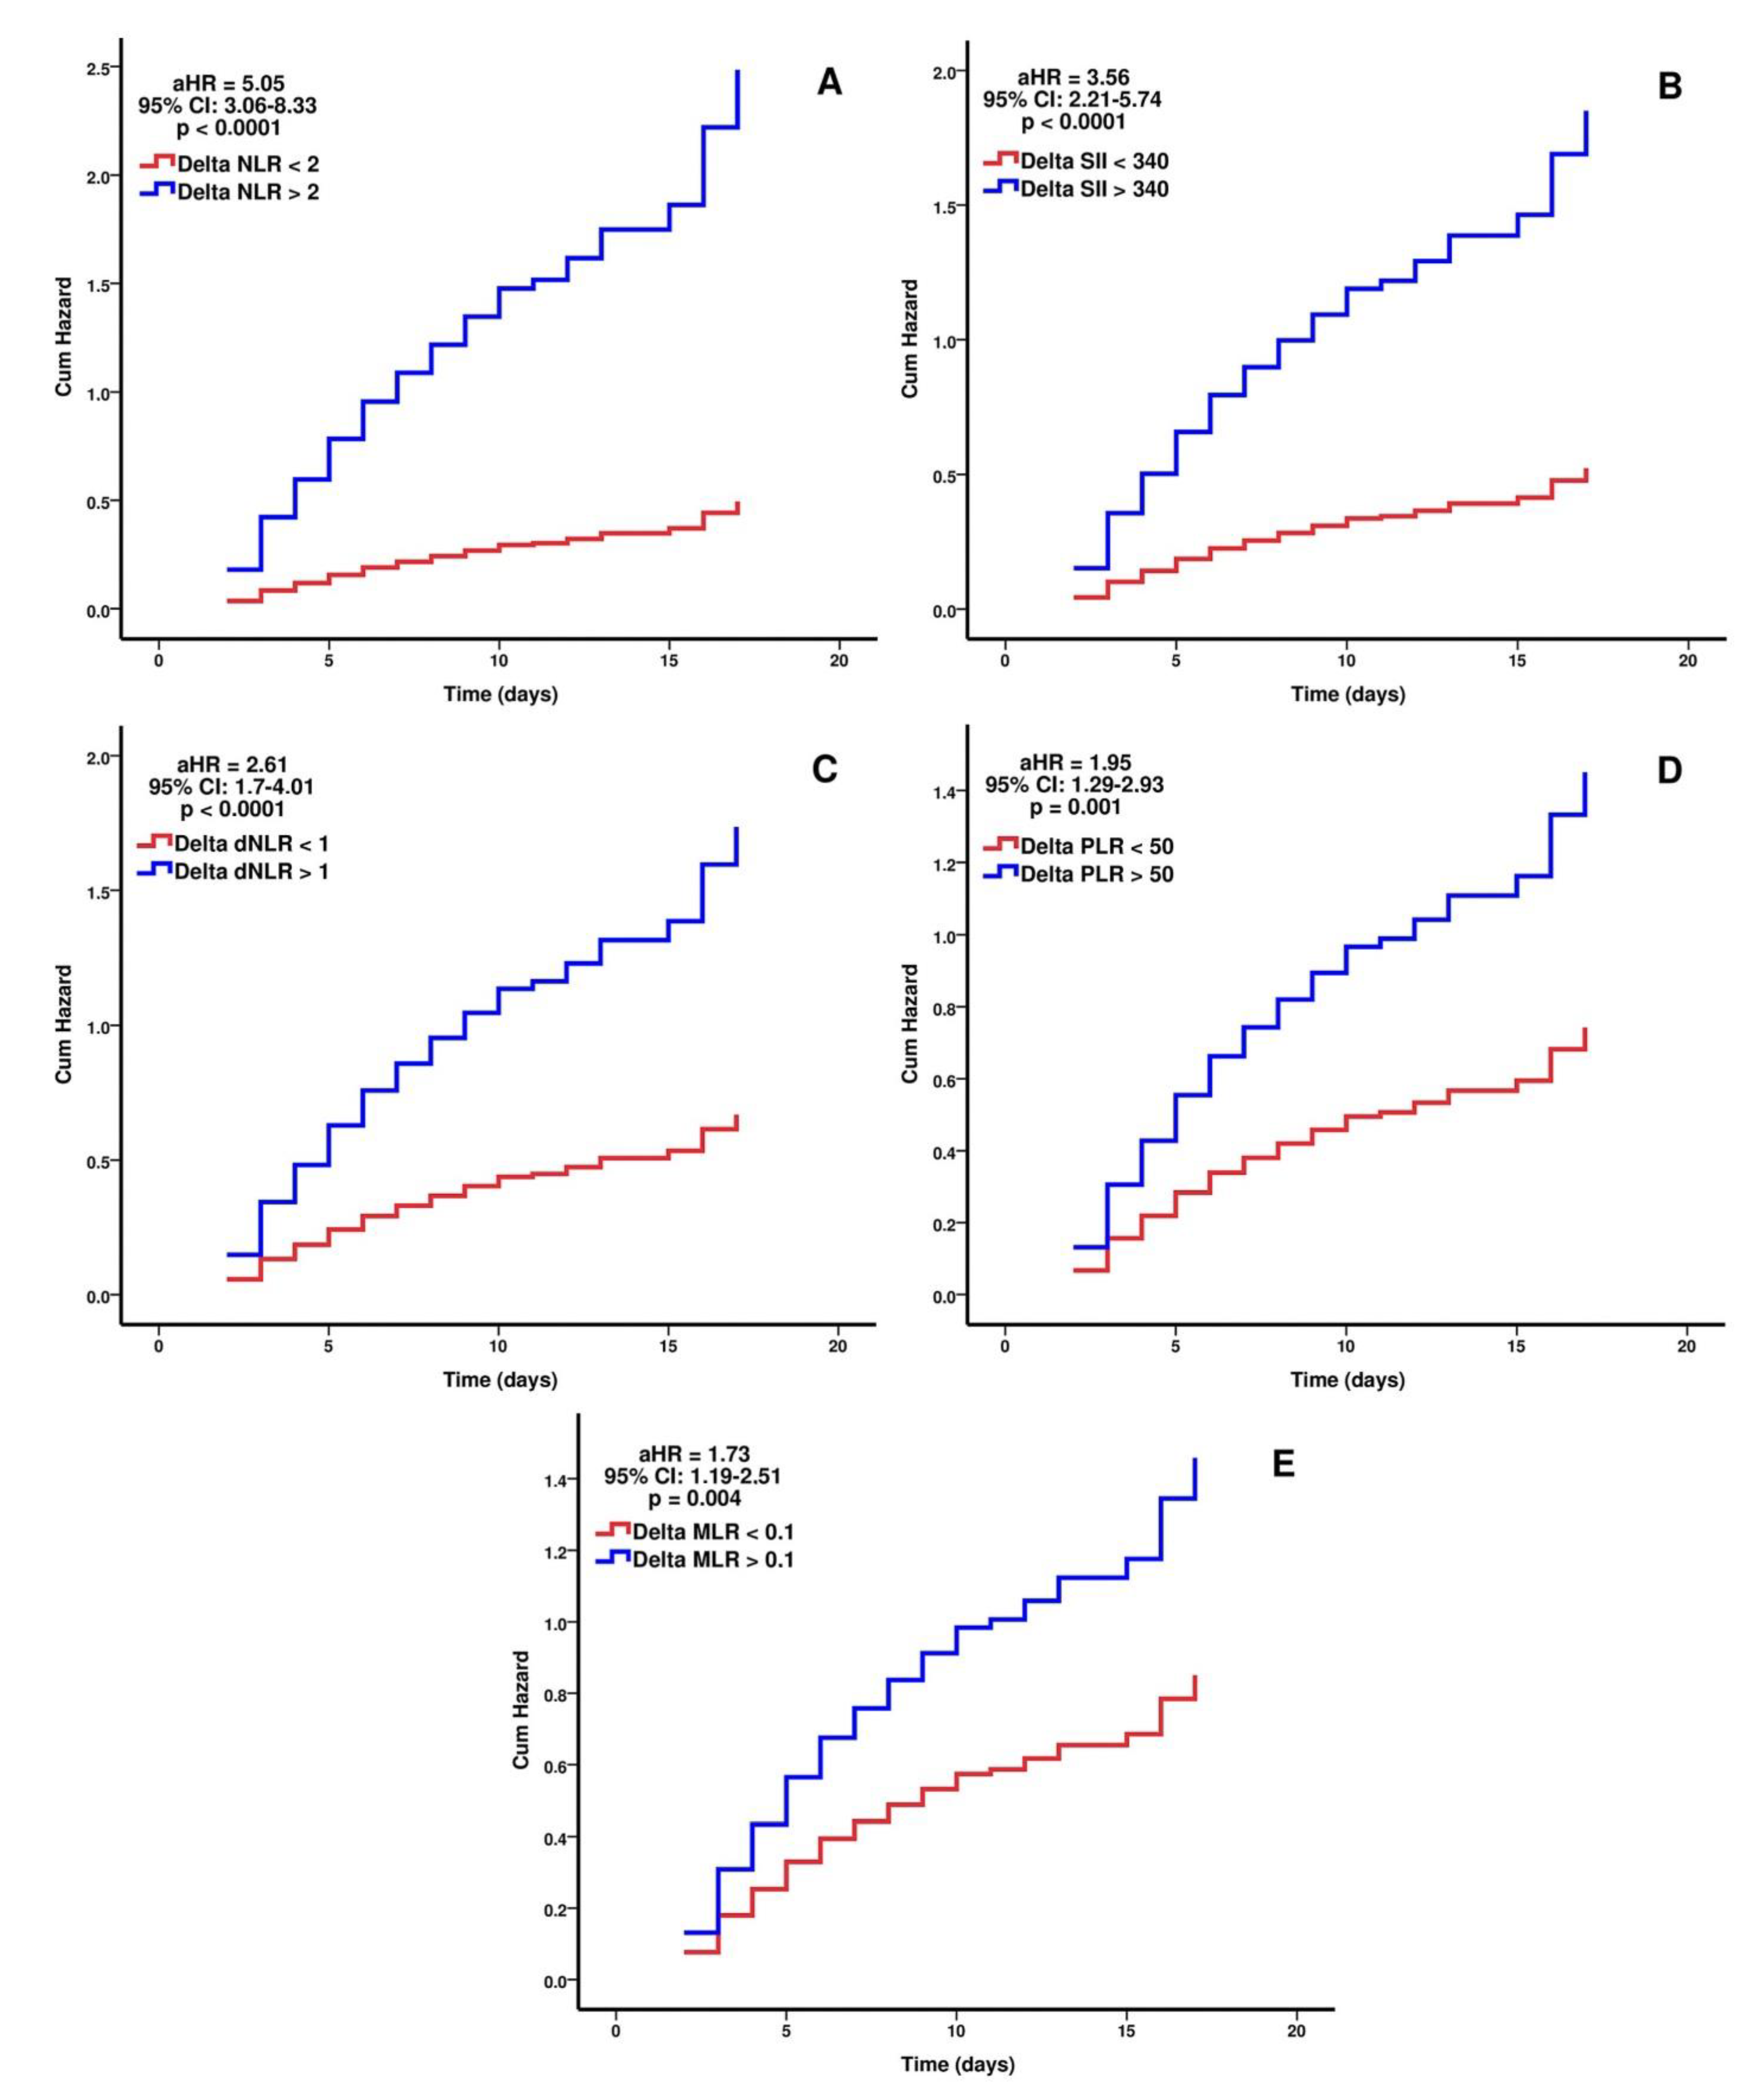
| ΔNLR | 0.876 | 0.824–0.920 | <0.0001 | >2 | 79.5 | 91.4 | 92.1 | 78 | ||||||
| ΔSII | 0.834 | 0.781–0.887 | <0.0001 | >340 | 79.5 | 80 | 83.3 | 75.7 | ||||||
| ΔdNLR | 0.826 | 0.772–0.880 | <0.0001 | >1 | 70.5 | 84.8 | 85.3 | 69.5 | ||||||
| ΔPLR | 0.774 | 0.714–0.834 | <0.0001 | >50 | 68.2 | 79 | 80.4 | 66.4 | ||||||
| ΔMLR | 0.713 | 0.648–0.778 | <0.0001 | >0.1 | 53.8 | 81.9 | 78.9 | 58.5 | ||||||
| Death Prediction | ||||||||||||||
| AUC | 95% CI | p Value | Cut-off | Sn% | Sp% | PPV% | NPV% | |||||||
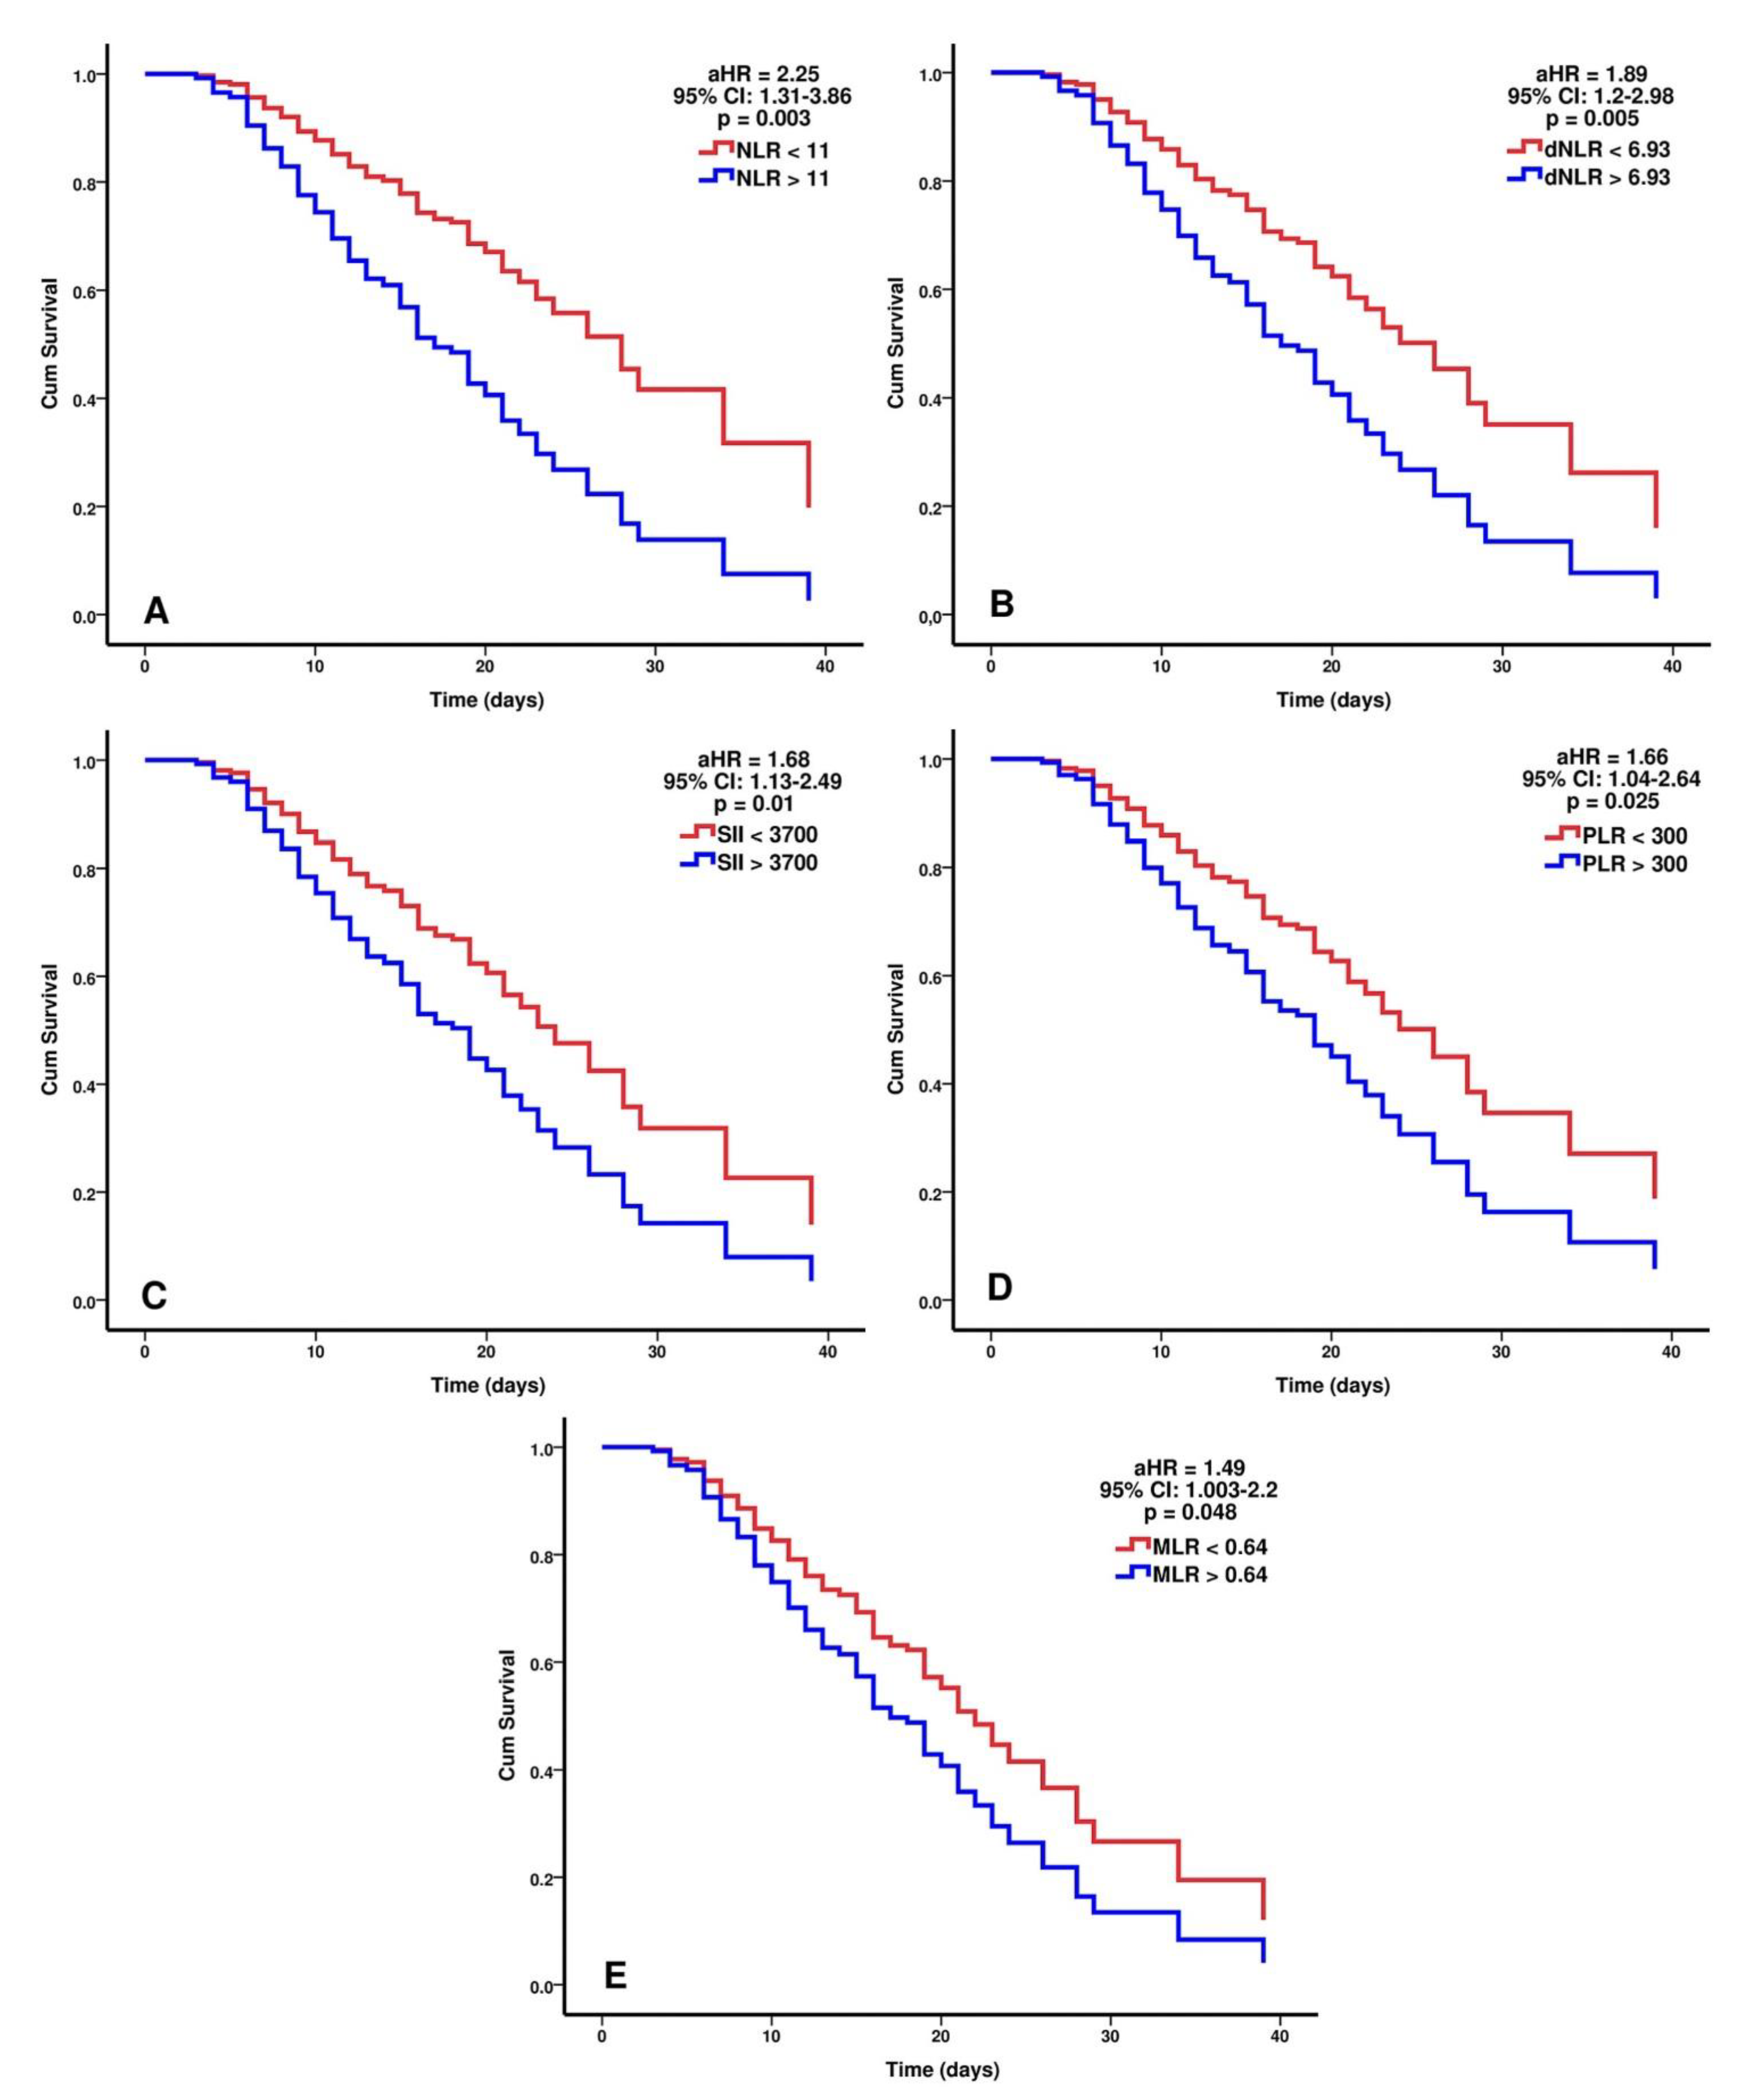
| NLR 48 h | 0.867 | 0.825–0.909 | <0.0001 | >11 | 86.6 | 72.3 | 77.4 | 83.2 | ||||||
| SII 48 h | 0.796 | 0.744–0.848 | <0.0001 | >3700 | 71.8 | 70.8 | 72.9 | 69.7 | ||||||
| dNLR 48 h | 0.831 | 0.784–0.879 | <0.0001 | >6.93 | 80.3 | 70 | 74.5 | 76.5 | ||||||
| PLR 48 h | 0.740 | 0.682–0.798 | <0.0001 | >300 | 82.4 | 49.2 | 63.9 | 71.9 | ||||||
| MLR 48 h | 0.747 | 0.689–0.805 | <0.0001 | >0.64 | 60 | 80.8 | 77.3 | 64.8 | ||||||
| COX PH Regression: ΔNLR > 2, Univariate Analysis, p < 0.0001 | |||
| ΔNLR > 2 | p value | HR | 95% CI for HR |
| <0.0001 | 6.88 | 4.47–10.60 | |
| COX PH regression: ΔNLR > 2, Multivariate analysis, p < 0.0001, Method: Enter | |||
| ΔNLR > 2 | p value | HR | 95% CI for HR |
| <0.0001 | 5.05 | 3.06–8.33 | |
| NIPPV | 0.002 | 1.88 | 1.27–2.77 |
| P/F ratio < 100 at 48 h | 0.028 | 1.52 | 1.05–2.21 |
| COX PH regression: ΔSII > 340, Univariate analysis, p < 0.0001 | |||
| ΔSII > 340 | p value | HR | 95% CI for HR |
| <0.0001 | 5.05 | 3.30–7.74 | |
| COX PH regression: ΔSII > 340, Multivariate analysis, p < 0.0001, Method: Enter | |||
| ΔSII > 340 | p value | HR | 95% CI for HR |
| <0.0001 | 3.56 | 2.21–5.74 | |
| NIPPV | <0.001 | 2.04 | 1.38–3.00 |
| P/F ratio < 100 at 48 h | 0.003 | 1.76 | 1.21–2.55 |
| C-Reactive Protein 48 h | 0.031 | 1.002 | 1.000–1.004 |
| COX PH regression: ΔdNLR > 1, Univariate analysis, p < 0.0001 | |||
| ΔdNLR > 1 | p value | HR | 95% CI for HR |
| <0.0001 | 4.03 | 2.76–5.89 | |
| COX PH regression: ΔdNLR > 1, Multivariate analysis, p < 0.0001, Method: Enter | |||
| ΔdNLR > 1 | p value | HR | 95% CI for HR |
| <0.0001 | 2.61 | 1.70–4.01 | |
| NIPPV | <0.001 | 2.01 | 1.36–2.95 |
| P/F ratio < 100 at 48 h | <0.001 | 1.96 | 1.34–2.85 |
| COX PH regression: ΔPLR > 50, Univariate analysis, p < 0.0001 | |||
| ΔPLR > 50 | p value | HR | 95% CI for HR |
| <0.0001 | 3.04 | 2.10–4.39 | |
| COX PH regression: ΔPLR > 50, Multivariate analysis, p < 0.0001, Method: Enter | |||
| ΔPLR > 50 | p value | HR | 95% CI for HR |
| 0.001 | 1.95 | 1.29–2.93 | |
| NIPPV | <0.001 | 2.03 | 1.38–2.98 |
| P/F ratio < 100 at 48 h | <0.0001 | 2.15 | 1.48–3.13 |
| COX PH regression: ΔMLR > 0.1, Univariate analysis, p < 0.0001 | |||
| ΔMLR > 0.1 | p value | HR | 95% CI for HR |
| <0.001 | 2.59 | 1.84–3.66 | |
| COX PH regression: ΔMLR > 0.1, Multivariate analysis, p < 0.0001, Method: Enter | |||
| ΔMLR > 0.1 | p value | HR | 95% CI for HR |
| 0.004 | 1.73 | 1.19–2.51 | |
| NIPPV | 0.002 | 1.89 | 1.28–2.80 |
| P/F ratio < 100 at 48 h | <0.0001 | 2.17 | 1.49–3.16 |
| C-Reactive Protein 48 h | 0.014 | 1.003 | 1.001–1.005 |
| COX PH Regression: NLR > 11, Univariate Analysis, p < 0.0001 | |||
| NLR > 11 | p value | HR | 95% CI for HR |
| <0.0001 | 4.6 | 2.80–7.56 | |
| COX PH regression: NLR > 12, Multivariate analysis, p < 0.0001, Method: Enter | |||
| NLR > 11 | p value | HR | 95% CI for HR |
| 0.003 | 2.25 | 1.31–3.86 | |
| HAIs | <0.001 | 2.31 | 1.58–3.40 |
| P/F ratio < 125 at 48 h | <0.0001 | 1.97 | 1.34–2.87 |
| Higher respiratory support | <0.0001 | 3.48 | 2.30–5.29 |
| COX PH regression: SII > 3700, Univariate analysis, p < 0.0001 | |||
| SII > 3700 | p value | HR | 95% CI for HR |
| <0.001 | 2.44 | 1.68–3.54 | |
| COX PH regression: SII > 3700, Multivariate analysis, p < 0.0001 | |||
| SII > 3700 | p value | HR | 95% CI for HR |
| 0.01 | 1.68 | 1.13–2.49 | |
| HAIs | <0.0001 | 2.3 | 1.56–3.39 |
| P/F ratio < 125 48 h | <0.001 | 2.10 | 1.43–3.09 |
| Higher respiratory support | <0.0001 | 3.76 | 2.50–5.62 |
| COX PH regression: dNLR > 6.93, Univariate analysis, p < 0.0001 | |||
| dNLR > 6.93 | p value | HR | 95% CI for HR |
| <0.0001 | 3.44 | 2.26–5.24 | |
| COX PH regression: dNLR > 6.93, Multivariate analysis, p < 0.0001, Method: Enter | |||
| dNLR > 6.93 | p value | HR | 95% CI for HR |
| 0.005 | 1.89 | 1.2–2.98 | |
| HAIs | <0.0001 | 2.26 | 1.54–3.34 |
| P/F ratio < 125 at 48 h | 0.003 | 1.88 | 1.28–2.75 |
| Tocilizumab | 0.041 | 0.52 | 0.28–0.97 |
| Higher respiratory support | <0.0001 | 3.73 | 2.48–5.62 |
| COX PH regression: PLR > 300, Univariate analysis, p < 0.0001 | |||
| ΔPLR > 300 | p value | HR | 95% CI for HR |
| <0.0001 | 2.36 | 1.53–3.64 | |
| COX PH regression: PLR > 300, Multivariate analysis, p < 0.0001, Method: Enter | |||
| PLR > 300 | p value | HR | 95% CI for HR |
| 0.025 | 1.66 | 1.04–2.64 | |
| HAIs | <0.0001 | 2.22 | 1.50–3.28 |
| P/F ratio < 125 at 48 h | <0.001 | 2.01 | 1.38–2.94 |
| Higher respiratory support | <0.0001 | 3.50 | 2.35–5.26 |
| COX PH regression: MLR > 0.64, Univariate analysis, p < 0.0001 | |||
| MLR > 0.64 | p value | HR | 95% CI for HR |
| <0.0001 | 2.38 | 1.70–3.33 | |
| COX PH regression: MLR > 0.64, Multivariate analysis, p < 0.0001, Method: Enter | |||
| MLR > 0.64 | p value | HR | 95% CI for HR |
| 0.048 | 1.49 | 1.003–2.20 | |
| HAIs | <0.001 | 2.19 | 1.48–3.22 |
| P/F ratio < 125 at 48 h | 0.001 | 1.93 | 1.32–2.81 |
| Higher respiratory support | <0.0001 | 3.55 | 2.40–5.24 |
Publisher’s Note: MDPI stays neutral with regard to jurisdictional claims in published maps and institutional affiliations. |
© 2021 by the authors. Licensee MDPI, Basel, Switzerland. This article is an open access article distributed under the terms and conditions of the Creative Commons Attribution (CC BY) license (https://creativecommons.org/licenses/by/4.0/).
Share and Cite
Moisa, E.; Corneci, D.; Negoita, S.; Filimon, C.R.; Serbu, A.; Negutu, M.I.; Grintescu, I.M. Dynamic Changes of the Neutrophil-to-Lymphocyte Ratio, Systemic Inflammation Index, and Derived Neutrophil-to-Lymphocyte Ratio Independently Predict Invasive Mechanical Ventilation Need and Death in Critically Ill COVID-19 Patients. Biomedicines 2021, 9, 1656. https://doi.org/10.3390/biomedicines9111656
Moisa E, Corneci D, Negoita S, Filimon CR, Serbu A, Negutu MI, Grintescu IM. Dynamic Changes of the Neutrophil-to-Lymphocyte Ratio, Systemic Inflammation Index, and Derived Neutrophil-to-Lymphocyte Ratio Independently Predict Invasive Mechanical Ventilation Need and Death in Critically Ill COVID-19 Patients. Biomedicines. 2021; 9(11):1656. https://doi.org/10.3390/biomedicines9111656
Chicago/Turabian StyleMoisa, Emanuel, Dan Corneci, Silvius Negoita, Cristina Raluca Filimon, Andreea Serbu, Mihai Ionut Negutu, and Ioana Marina Grintescu. 2021. "Dynamic Changes of the Neutrophil-to-Lymphocyte Ratio, Systemic Inflammation Index, and Derived Neutrophil-to-Lymphocyte Ratio Independently Predict Invasive Mechanical Ventilation Need and Death in Critically Ill COVID-19 Patients" Biomedicines 9, no. 11: 1656. https://doi.org/10.3390/biomedicines9111656
APA StyleMoisa, E., Corneci, D., Negoita, S., Filimon, C. R., Serbu, A., Negutu, M. I., & Grintescu, I. M. (2021). Dynamic Changes of the Neutrophil-to-Lymphocyte Ratio, Systemic Inflammation Index, and Derived Neutrophil-to-Lymphocyte Ratio Independently Predict Invasive Mechanical Ventilation Need and Death in Critically Ill COVID-19 Patients. Biomedicines, 9(11), 1656. https://doi.org/10.3390/biomedicines9111656