Article

Galactomannan Pentasaccharide Produced from Copra Meal Enhances Tight Junction Integration of Epithelial Tissue through Activation of AMPK

1
Department of Biochemistry, Faculty of Science, Chulalongkorn University, Bangkok 10330, Thailand
2
Department of Physiology, Faculty of Science, Mahidol University, Bangkok 10400, Thailand
3
Graduate School of Science, Osaka City University, Osaka 558-8585, Japan
4
Division of Preclinical Sciences, Chakri Naruebodindra Medical Institute, Faculty of Medicine Ramathibodi Hospital, Mahidol University, Bangkok 10540, Thailand
*
Author to whom correspondence should be addressed.
Biomedicines 2019, 7(4), 81; https://doi.org/10.3390/biomedicines7040081
Submission received: 18 September 2019 / Revised: 9 October 2019 / Accepted: 11 October 2019 / Published: 14 October 2019
(This article belongs to the Section Drug Discovery and Development)

Abstract

:
Mannan oligosaccharide (MOS) is well-known as an effective fed supplement for livestock to increase their nutrients absorption and health status. Pentasaccharide of mannan (MOS5) was reported as a molecule that possesses the ability to increase tight junction of epithelial tissue, but the structure and mechanism of action remains undetermined. In this study, the mechanism of action and structure of MOS5 were investigated. T84 cells were cultured and treated with MOS5 compared with vehicle and compound C, a 5′-adenosine monophosphate-activated protein kinase (AMPK) inhibitor. The results demonstrated that the ability of MOS5 to increase tight junction integration was inhibited in the presence of dorsomorphine (compound C). Phosphorylation level of AMPK was elevated in MOS5 treated group as determined by Western blot analysis. Determination of MOS5 structure was performed using enzymatic mapping together with 1H, 13C NMR, and 2D-NMR analysis. The results demonstrated that the structure of MOS5 is a β-(1,4)-mannotetraose with α-(1,6)-galactose attached at the second mannose unit from non-reducing end.

1. Introduction

Tight junction is also one of the crucial compartments of a barrier function of an epithelial tissue which is a part of anatomical barriers of innate immunity in complex and higher organisms. An impaired tight junction is a common pathologic feature in many inflammatory diseases such as inflammatory bowel disease (IBD) or Crohn’s disease or even chronic diarrhea in HIV-infected patient, or a side-effect of some drugs such as gefitinib or other drugs in EFGR-inhibitor family [1,2,3]. Impaired tight junction may lead to many symptoms such as leaking of intra- and intercellular fluid to the gut, may leading to diarrhea, malnutrition, and colitis [4,5,6,7,8]. The loss of tight junction barrier function might also lead to a dysfunction of villi that might resulting in an abnormality in nutrient absorption [1,9,10,11]. Interestingly, many recent studies had reported that β-glycans can increase tight junction formation through 5′-adenosine monophosphate-activated protein kinase (AMPK) signaling pathway which is a part of the mTOR signaling pathway [12,13,14].
Mannan oligosaccharides (MOS) is well-known as a supplementary fed for livestock which can increase the body composition, also raised immunity and stress response [15,16,17,18,19,20,21,22,23]. Although MOSs have been proven to have biological activities over the livestock quality enhancement, its mechanism of action in the tissue or cells is still unknown. Previously, MOS5, a pentasaccharide obtained from the digestion of pretreated galactomannan from copra meal with recombinant β-mannanase was reported to have the ability to enhance tight junction integration in epithelial cells [24]. Previous reports have demonstrated that β-glycan enhances tight junction integration of epithelial cells through activation of the AMPK pathway [12,13,25,26]. This infers that MOS5, which is also a β-glycan, might also enhance a tight junction integration of epithelial cells through activation of AMPK pathway.
In this study, T84 cells, a lung metastasis-colonic human colonic carcinoma cells, were used as a epithelial cell model for tight junction integrity studies induced by MOS5. Trans-epithelial electrical resistance (TEER) assay was employed. Dorsomorphine (compound C), an inhibitor of AMPK, was used to elucidate the involvement of AMPK in the activation of tight junction integration of epithelial cells by MOS5. Moreover, MOS5 structure was successfully elucidated using specific enzymatic mapping and 1H, 13C NMR, and 2D NMR analysis.

2. Materials and Methods

2.1. Cell Culture

For transepithelial electrical resistance (TEER) experiment, T84 cells (American Type Culture Collection, VA, USA) were grown in a mixture of DMEM (Invitrogen Co., Calsbad, CA, USA), supplemented with 10% v/v fetal bovine serum (FBS), 100 U/mL penicillin, and 100 ug/mL streptomycin. The cells were cultured in 25 cm2 cell culture flask (Corning life science, Tewksbury, MA, USA) maintained at 37 °C in a humidified CO2 incubator [12]. To form polarized monolayers, T84 cells were seeded in the Transwell® insert (Corning life science, Tewksbury, MA, USA) at a density of approximately 5 × 10⁵ cells/insert and cultured for 14 days or until transepithelial electrical resistance (TEER) reached 1000 Ohm/cm2. The culture media were replaced daily [26].

2.2. Preparation of MOS5

MOS5 was produced by an enzyme hydrolytic method using RMase24 with a pre-treated galactomannan substrate obtained from copra meal in our previous study [24]. The separated MOS5 was also purified through Biogel P2 and Biogel P4 size exclusion column chromatography, respectively. The column size was 27 cm in length, 3.2 cm in diameter, with a flow rate of 0.46 mL/min at room temperature.

2.3. Determination of MOS5 Effects on TEER and Calcium Switch Assay

Each purified MOS5 was dissolved separately in ultrapure water to make a 50 µM to 100 µM stock concentration then filtered through 0.2-µm filter membrane before mixing with DMEM/Ham’s F-12 without FBS up to desired concentration (0.1, 1, 5, 10, and 20 µM). After the cells were grown and the polarized monolayer was formed, each prepared MOS in DMEM was treated to the cells and the change in TEER was monitored before and at 24 h after treatment. For calcium switch assay, T84 cells were cultured in DMEM in a transwell® insert (Corning life science, Tewksbury, MA, USA) until cells formed the monolayer and the population of the cells reached 80% or until the TEER of the cells were steady. After that, DMEM medium was substituted with the minimum essential medium eagle, spinner modification (SMEM) (Ca2+-free culture media) to disrupt tight junctions. After 24 h, the SMEM medium was replaced with regular DMEM/Ham’s F-12 (containing Ca2+) supplemented with the vehicle, MOS5 (10 µM), MOS5 (10 µM) plus compound C (80 µM), or compound C (80 µM) alone. TEER was measured before and every 15 min after Ca2+ switch up to 12 h [25,26].

2.4. Western Blot Analysis

T84 cells were treated with 10 µM of purified MOS5, compared with non-treated group. After treatments for subjected time point, cell lysates were harvested using RIPA buffer (20 mM Tris-HCl pH7.4, 150 mM NaCl, 1 mM EDTA, 1% Triton-X100, 1% sodium deoxycholate, 0.1% SDS. Protease inhibitors: 1 mM PMSF, 5 ug/mL aprotinin and 5 ug/mL leupeptin were added prior to use). A total of 30 µg of protein was separated using sodium dodecyl sulfate polyacrylamide gel electrophoresis (SDS-PAGE) before transferring to nitrocellulose membrane. The membrane was incubated for 1 h with 5% non-fat dried milk (BioRad, Hercules, CA, USA), and incubated overnight with rabbit antibodies to phosphorylate-AMPK/Thr-172 (p-AMPK), AMPK-α and β-actin (Cell Signaling Technology, Boston, MA, USA). The membrane was then washed for four times with Tris-buffered saline Tween-20 (TBST) and incubated for 1 h at room temperature with horseradish peroxidase-conjugated goat antibody to rabbit immunoglobulin G (Cell Signaling Technology, Boston, MA, USA) [26]. The signals were detected using Luminata Crescendo Western HRP Substrate (Merck Millipore, Billerica, MA, USA). Band density was analyzed using Image J software (version 1.51s, National Institute of Health, Bethesda, MD, USA).

2.5. Purification of α-Galactosidase from Achantina Fulica

A crude α-galactosidase (A. fulica) was kindly offered by from Amano Enzyme Inc., Nagoya, Aichi, Japan and labelled as CAfGLA. One hundred milligrams of crude enzyme powder was diluted and mixed well with 20 mL of deionized water and precipitated with 30% ammonium sulfate solution for overnight at 4 °C. The supernatant was collected by centrifugation at 12,000× g, 10 min before repeating the precipitation by scaling up the ammonium sulfate concentration to 70% and 90%, respectively. The protein was then dialyzed with 5mM phosphate buffer pH 7.4 for 12 h, twice, to remove the excess ammonium sulfate salt. This dialyzed enzyme was labelled as pCAfGLA and was then separated through Sephadex G150 gel filtration column chromatography with gravity at 4 °C. The column size was 3 cm in diameter, 48 cm in length. Activities of separated fractions were investigated with mannobiose and melibiose to determine the digestion ability of the enzyme over β-1,4-mannosidic linkage and α-1,6-galactosidic linkage at 37 °C. The result was analyzed by TLC.

2.6. Structural Analysis of MOS5 Products

For structural analysis of MOS5, 50 mg of purified MOS5 was dissolved in ultrapure water before digesting directly with enzyme with excess amount of selected fractions of pCAfGLA at 37 °C for overnight that shown endo-mannosidase activity before purification through Biogel p4 size exclusion chromatography and then analyzed with thin layer chromatography in butanol: acetic acid: water (3:3:2) system for 3 ascents. The molecular weight of m-2 and m-3, a digestion product of MOS5, was also confirmed with MALDI imaging mass spectrometer (Solari X, FT mass spectrometry, Bruker, Billerica, MA, USA) before analyzing their structure on a FT-NMR spectrometer (AVANCE 300, Bruker, Billerica, MA, USA) at room temperature with 3-(trimethylsilyl)-1-propanesulfonic acid sodium salt (DSS) as external standard.

2.7. Statistical Analysis

The ratio of phosphorylation of p-AMPK/AMPK-α over of the MOS5 treated (M) and untreated group (N) at each time point was calculated by the following equation:
Phosphorylation   of   M = [ p - AMPK   of   M ( beta - actin ) ] ÷ [ AMPK - α   of   M ( beta - actin ) ]
Phosphorylation   of   N = [ p - AMPK   of   N ( beta - actin ) ] ÷ [ AMPK - α   of   N ( beta - actin ) ]
Percent   relative   of   p - AMPK / AMPK - α   to   control = [ Phosphorylation   of   M Phosphorylation   of   N ] ÷ [ Phosphorylation   of   N Phosphorylation   of   N ]
The significant difference between samples was determined by one-way ANOVA using GraphPad Prism 7 software (GraphPad Software Inc., La Jolla, CA, USA).

3. Results

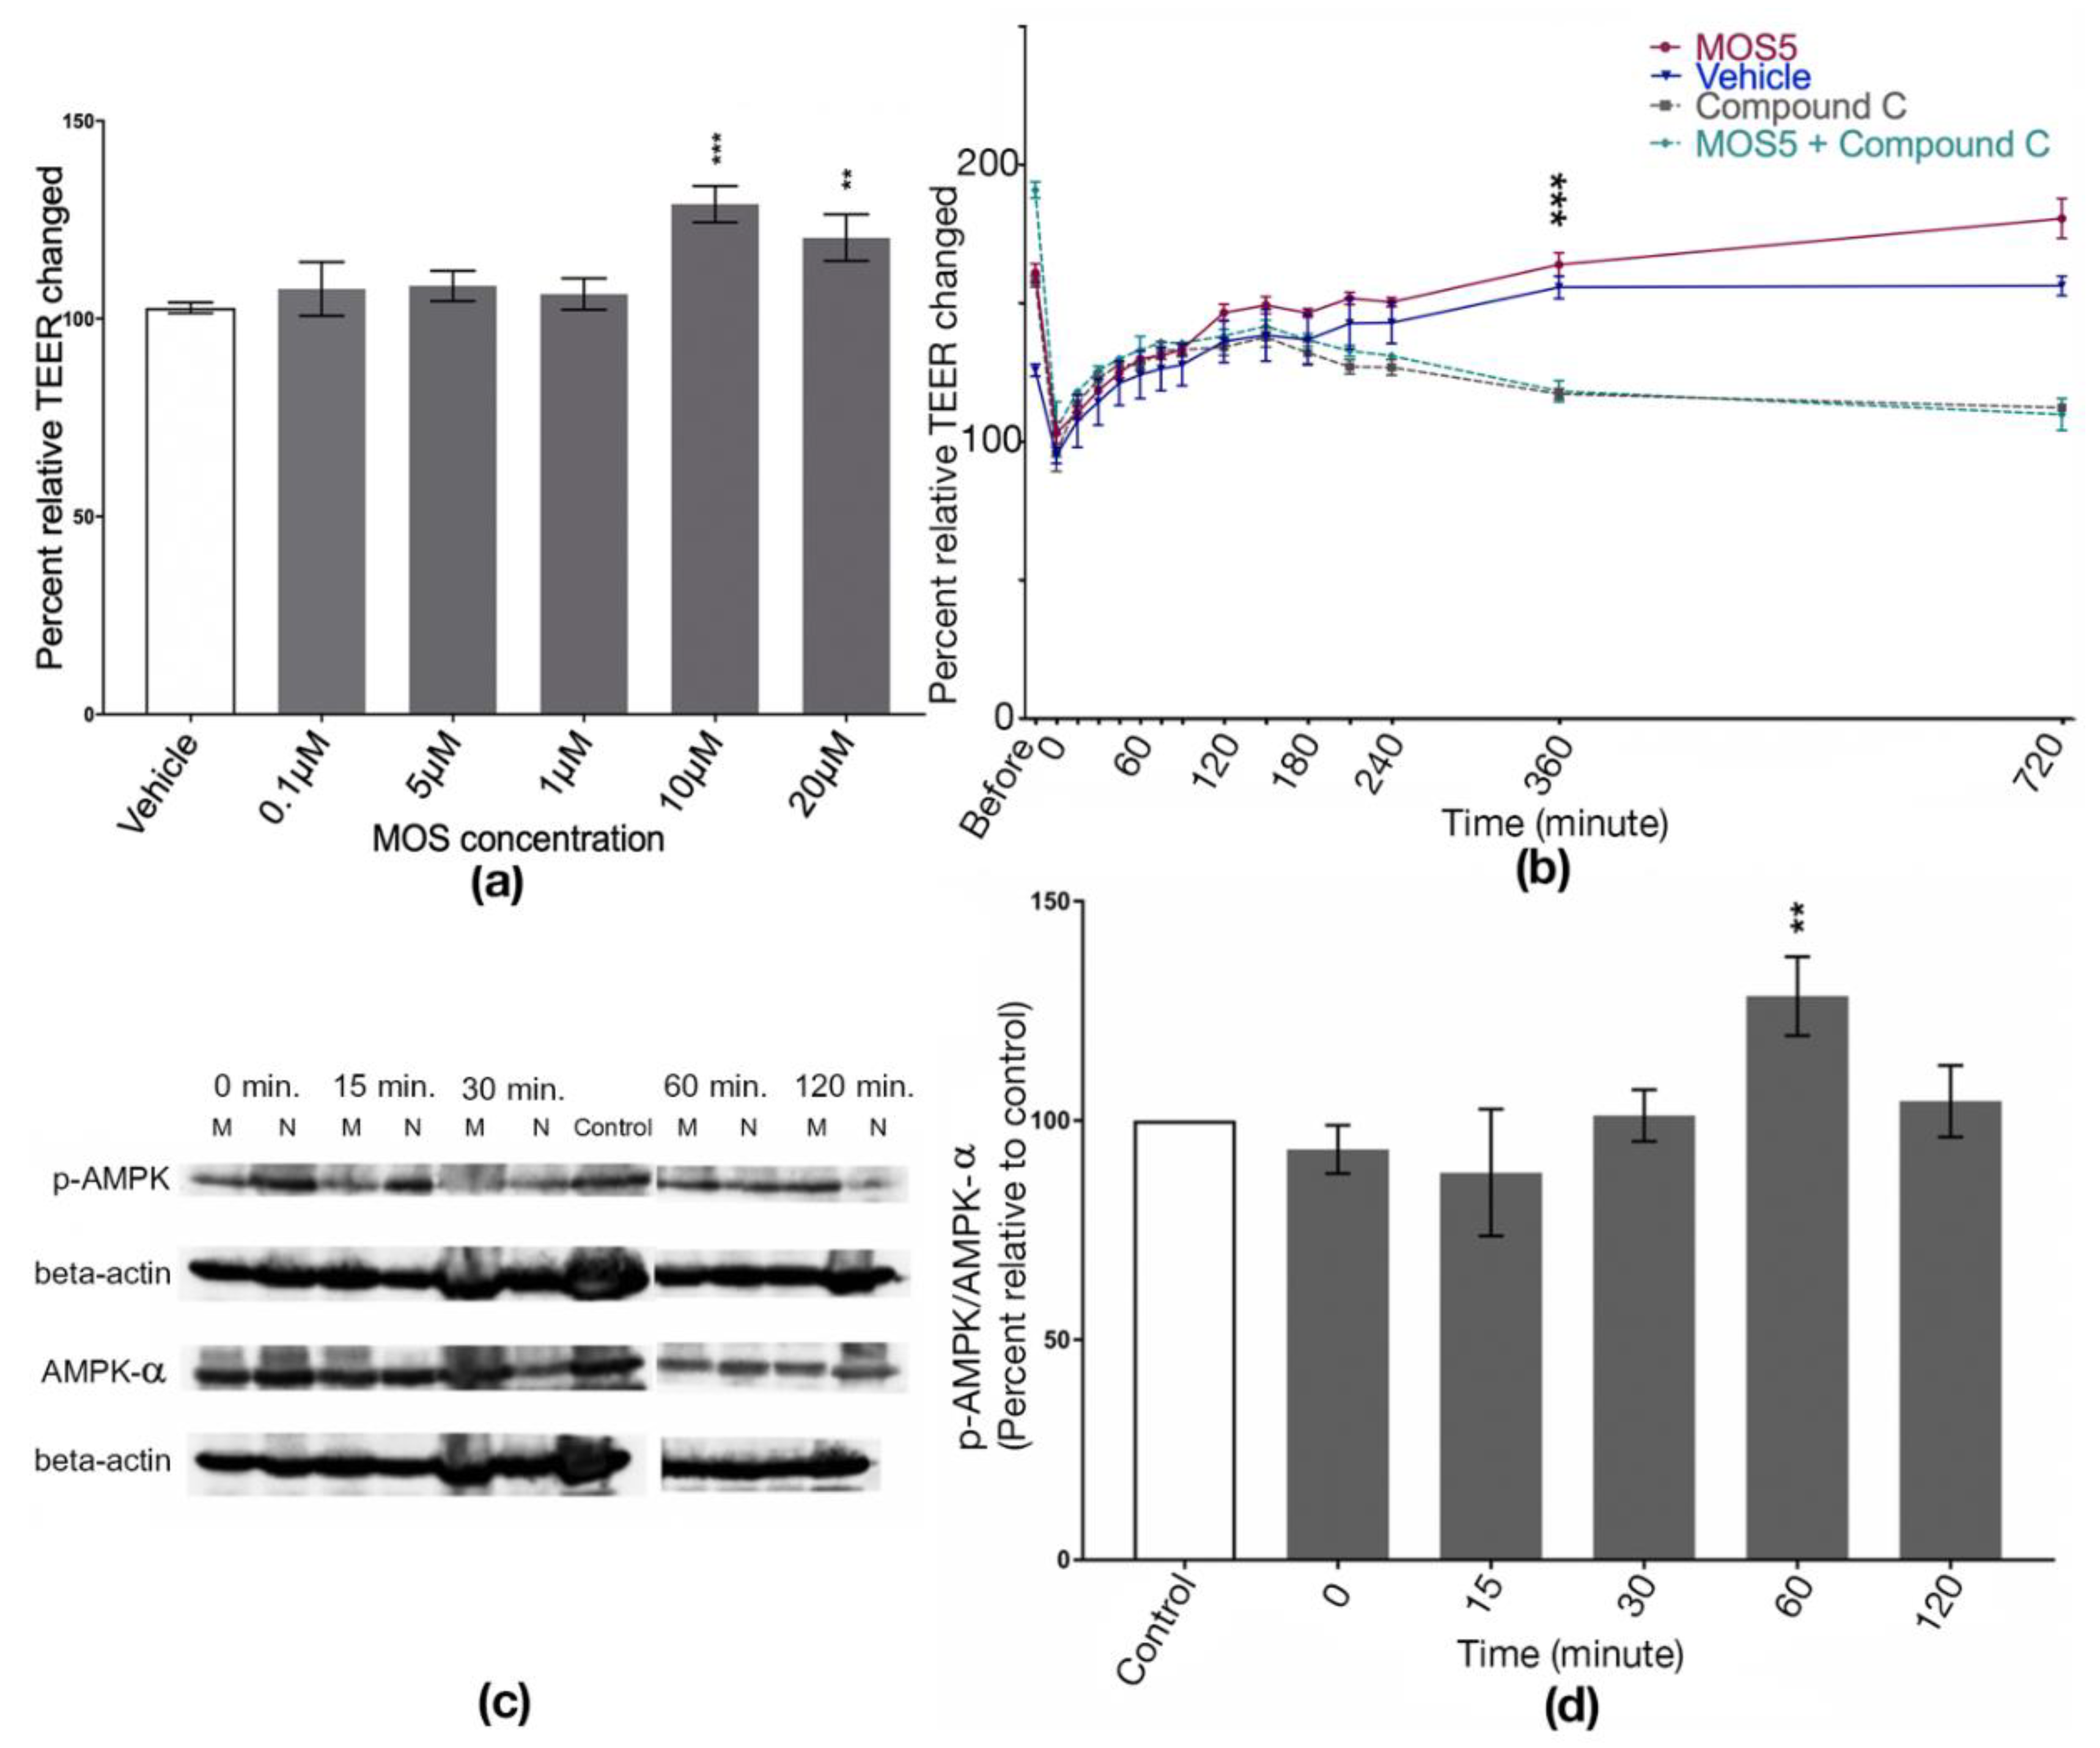
3.1. Effects of MOS5 on Tight Junction Assembly of MOS5 via AMPK Pathway

In this study, determination of MOS5 concentration results shows that a concentration at 10 µM and 20 µM of MOS5 significantly increased TEER when compared to the vehicle group (n = 3–4, one-way ANOVA, p = 0.002 and p < 0.0001, respectively). The concentration below 5 µM showed no difference in TEER level (Figure 1a). TEER results under a challenging of AMPK inhibitor, compound C, showed a significant difference of TEER recovering between MOS5 treatment and vehicles. TEER value from a treatment group of MOS5 + compound C showed no difference as compared to compound C treated group (n = 4–5, two-way ANOVA, p < 0.0001) (Figure 1b). To confirm this hypothesis, Western blot analysis of p-AMPK/AMPK-α expression was done. Total protein of each sample was extracted and then the blot analysis was performed and the band intensities were measured with ImageJ software. The band intensity of p-AMPK and AMPK-α were analysed with beta-actin band intensities before calculation. The results showed that the phosphorylation of AMPK was significantly increased at 60 min after administration of 10 µM MOS5 to the cells (n = 3, one-way ANOVA, p = 0.0014) (Figure 1c,d).

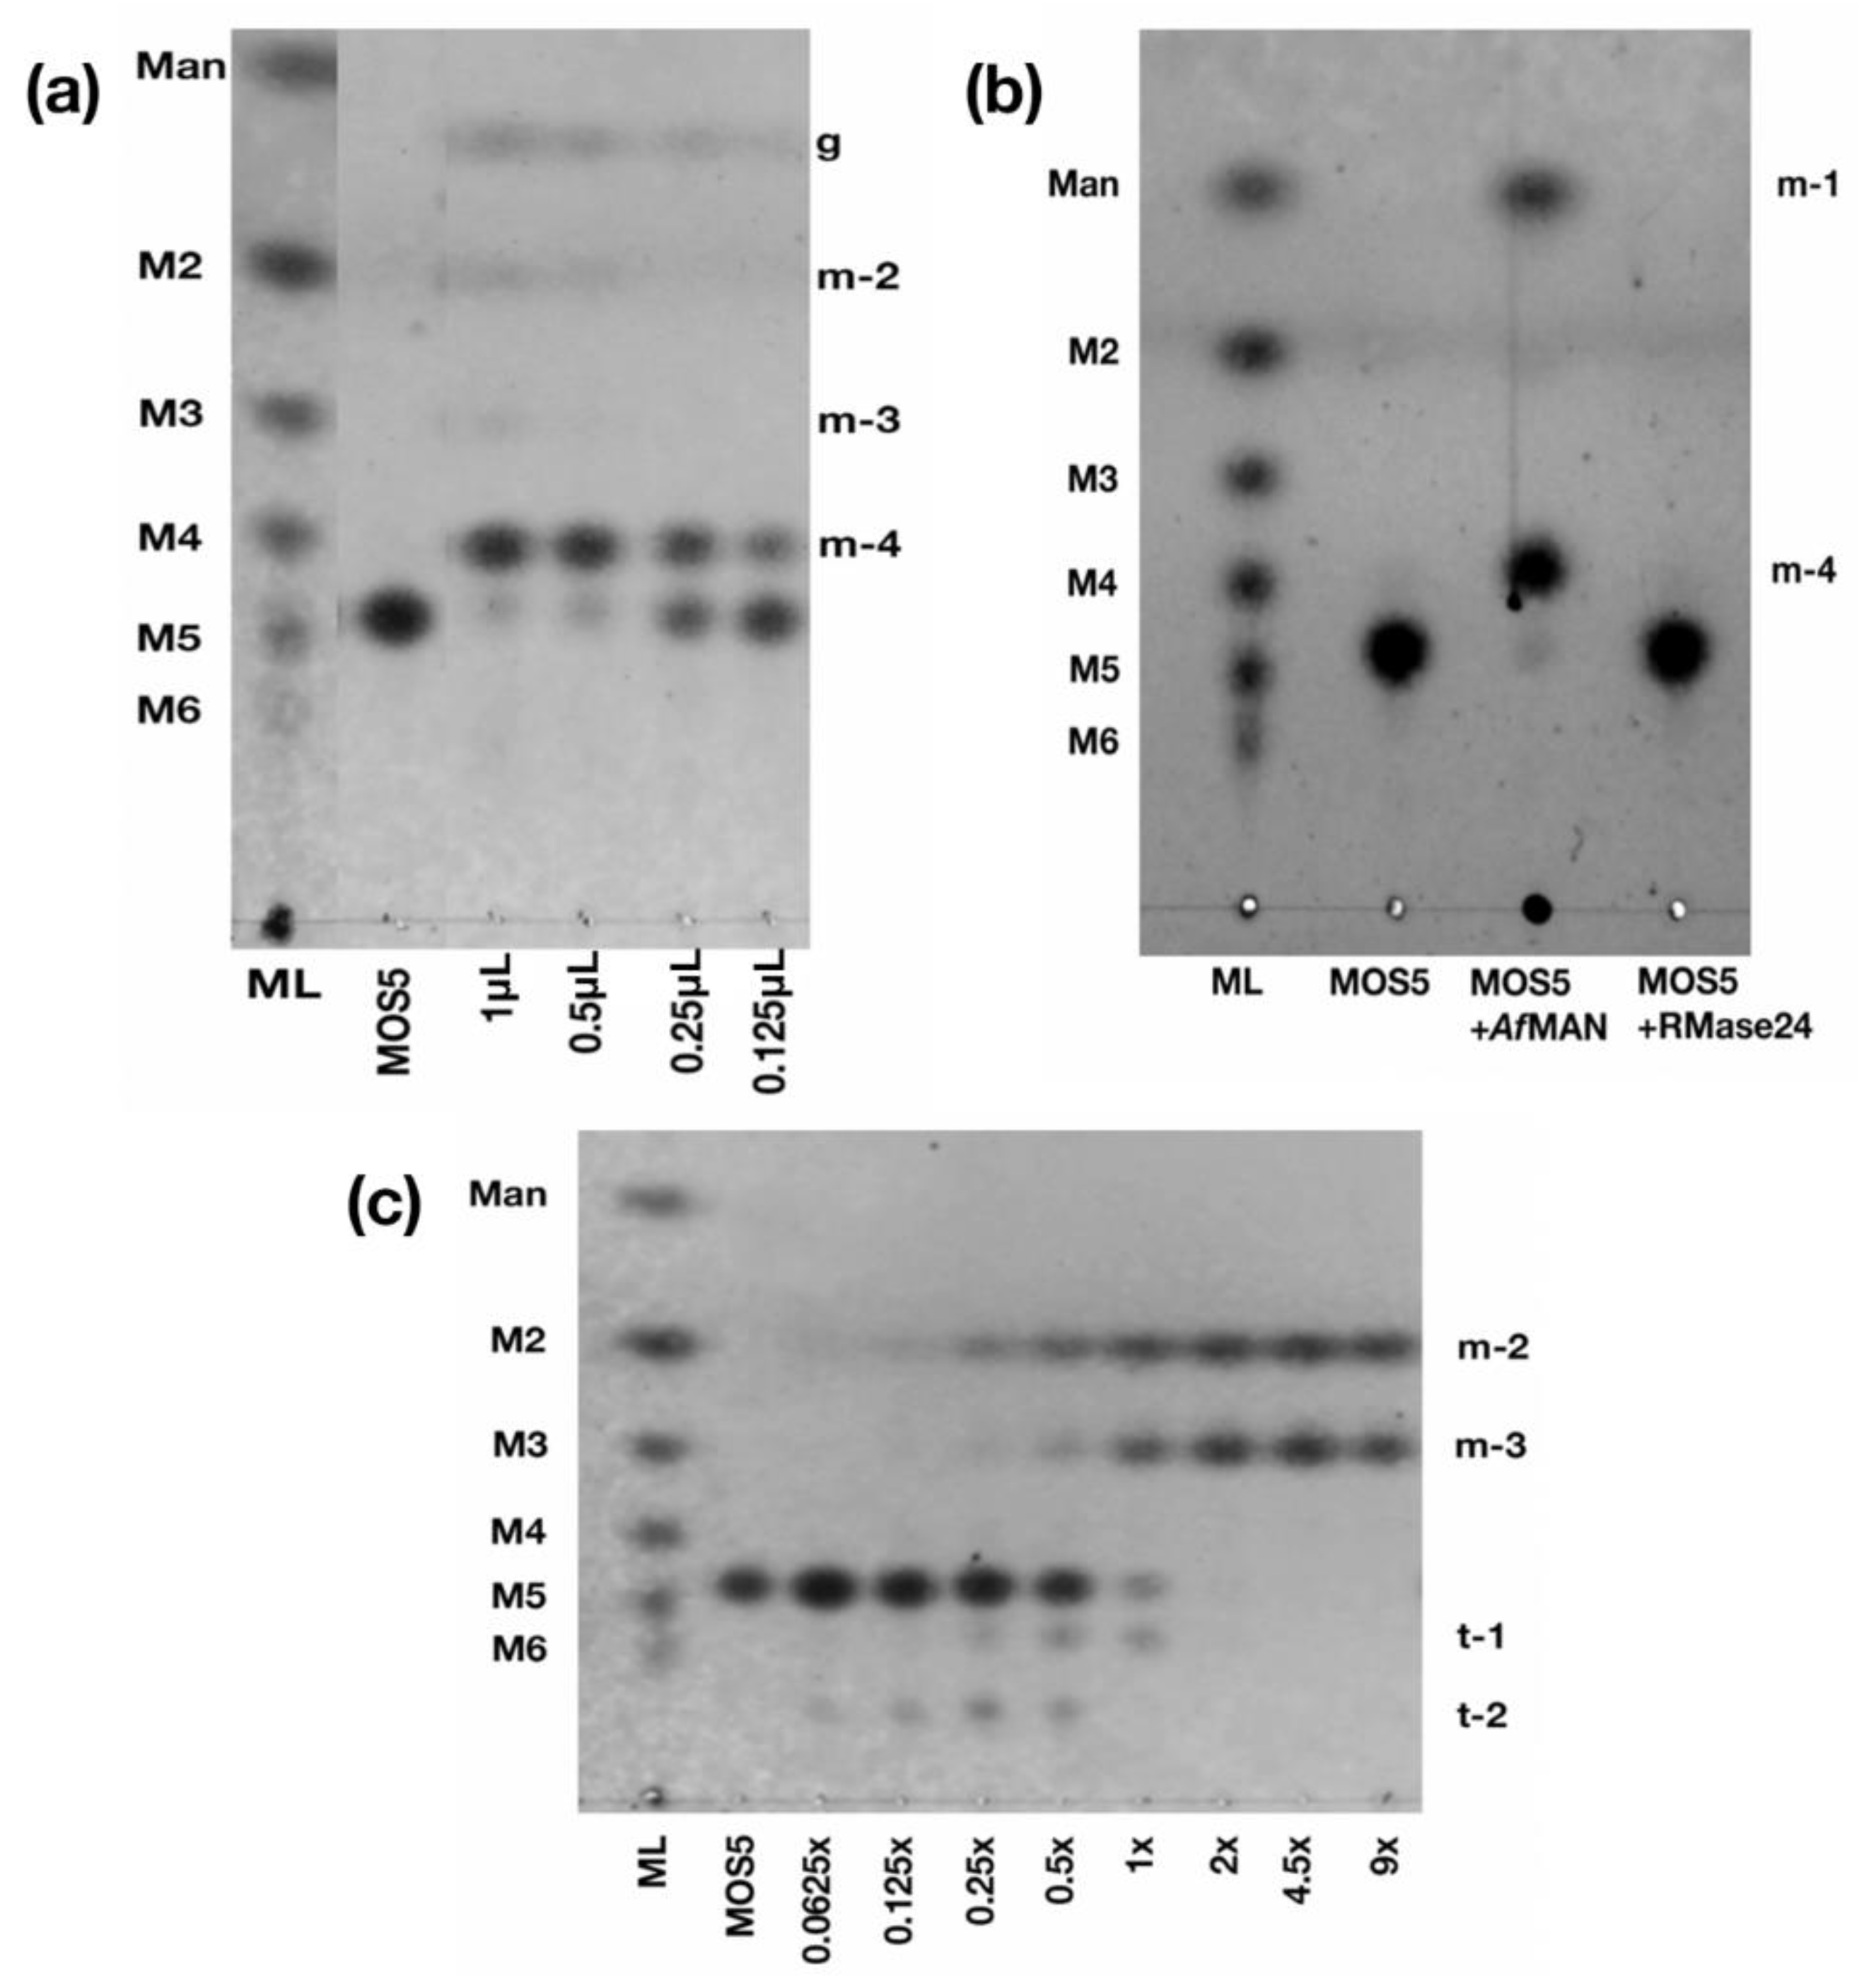
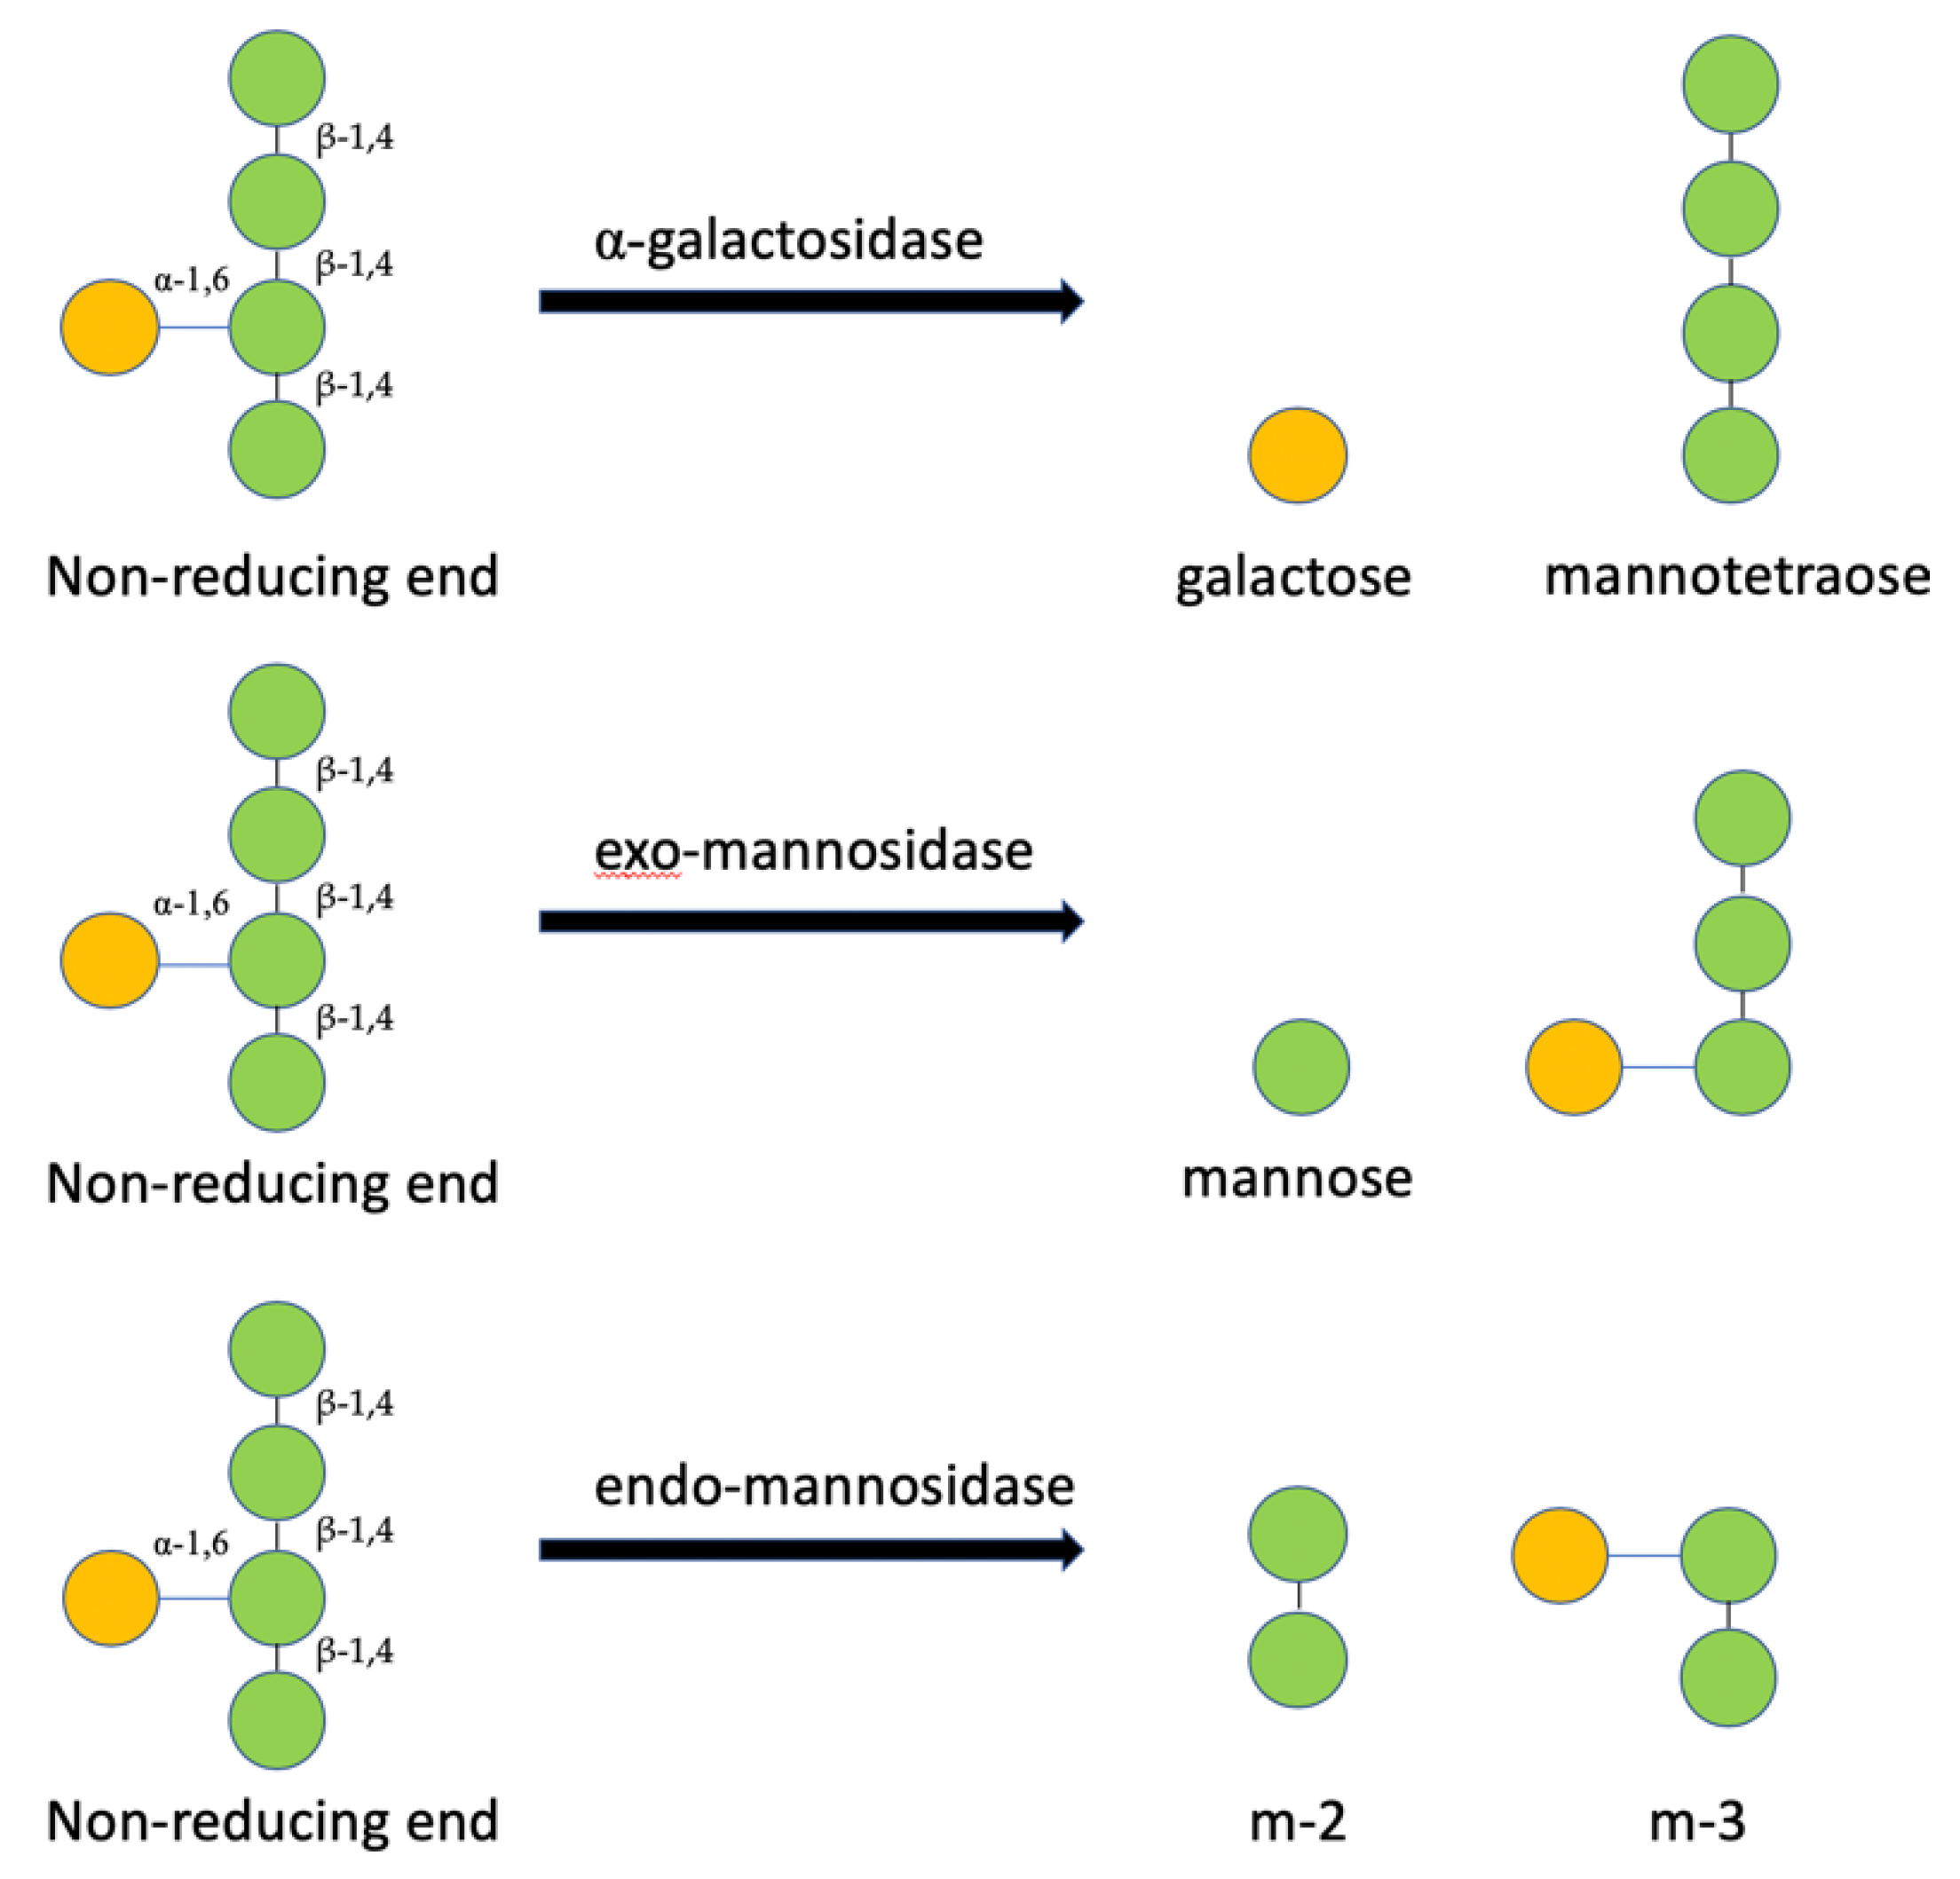
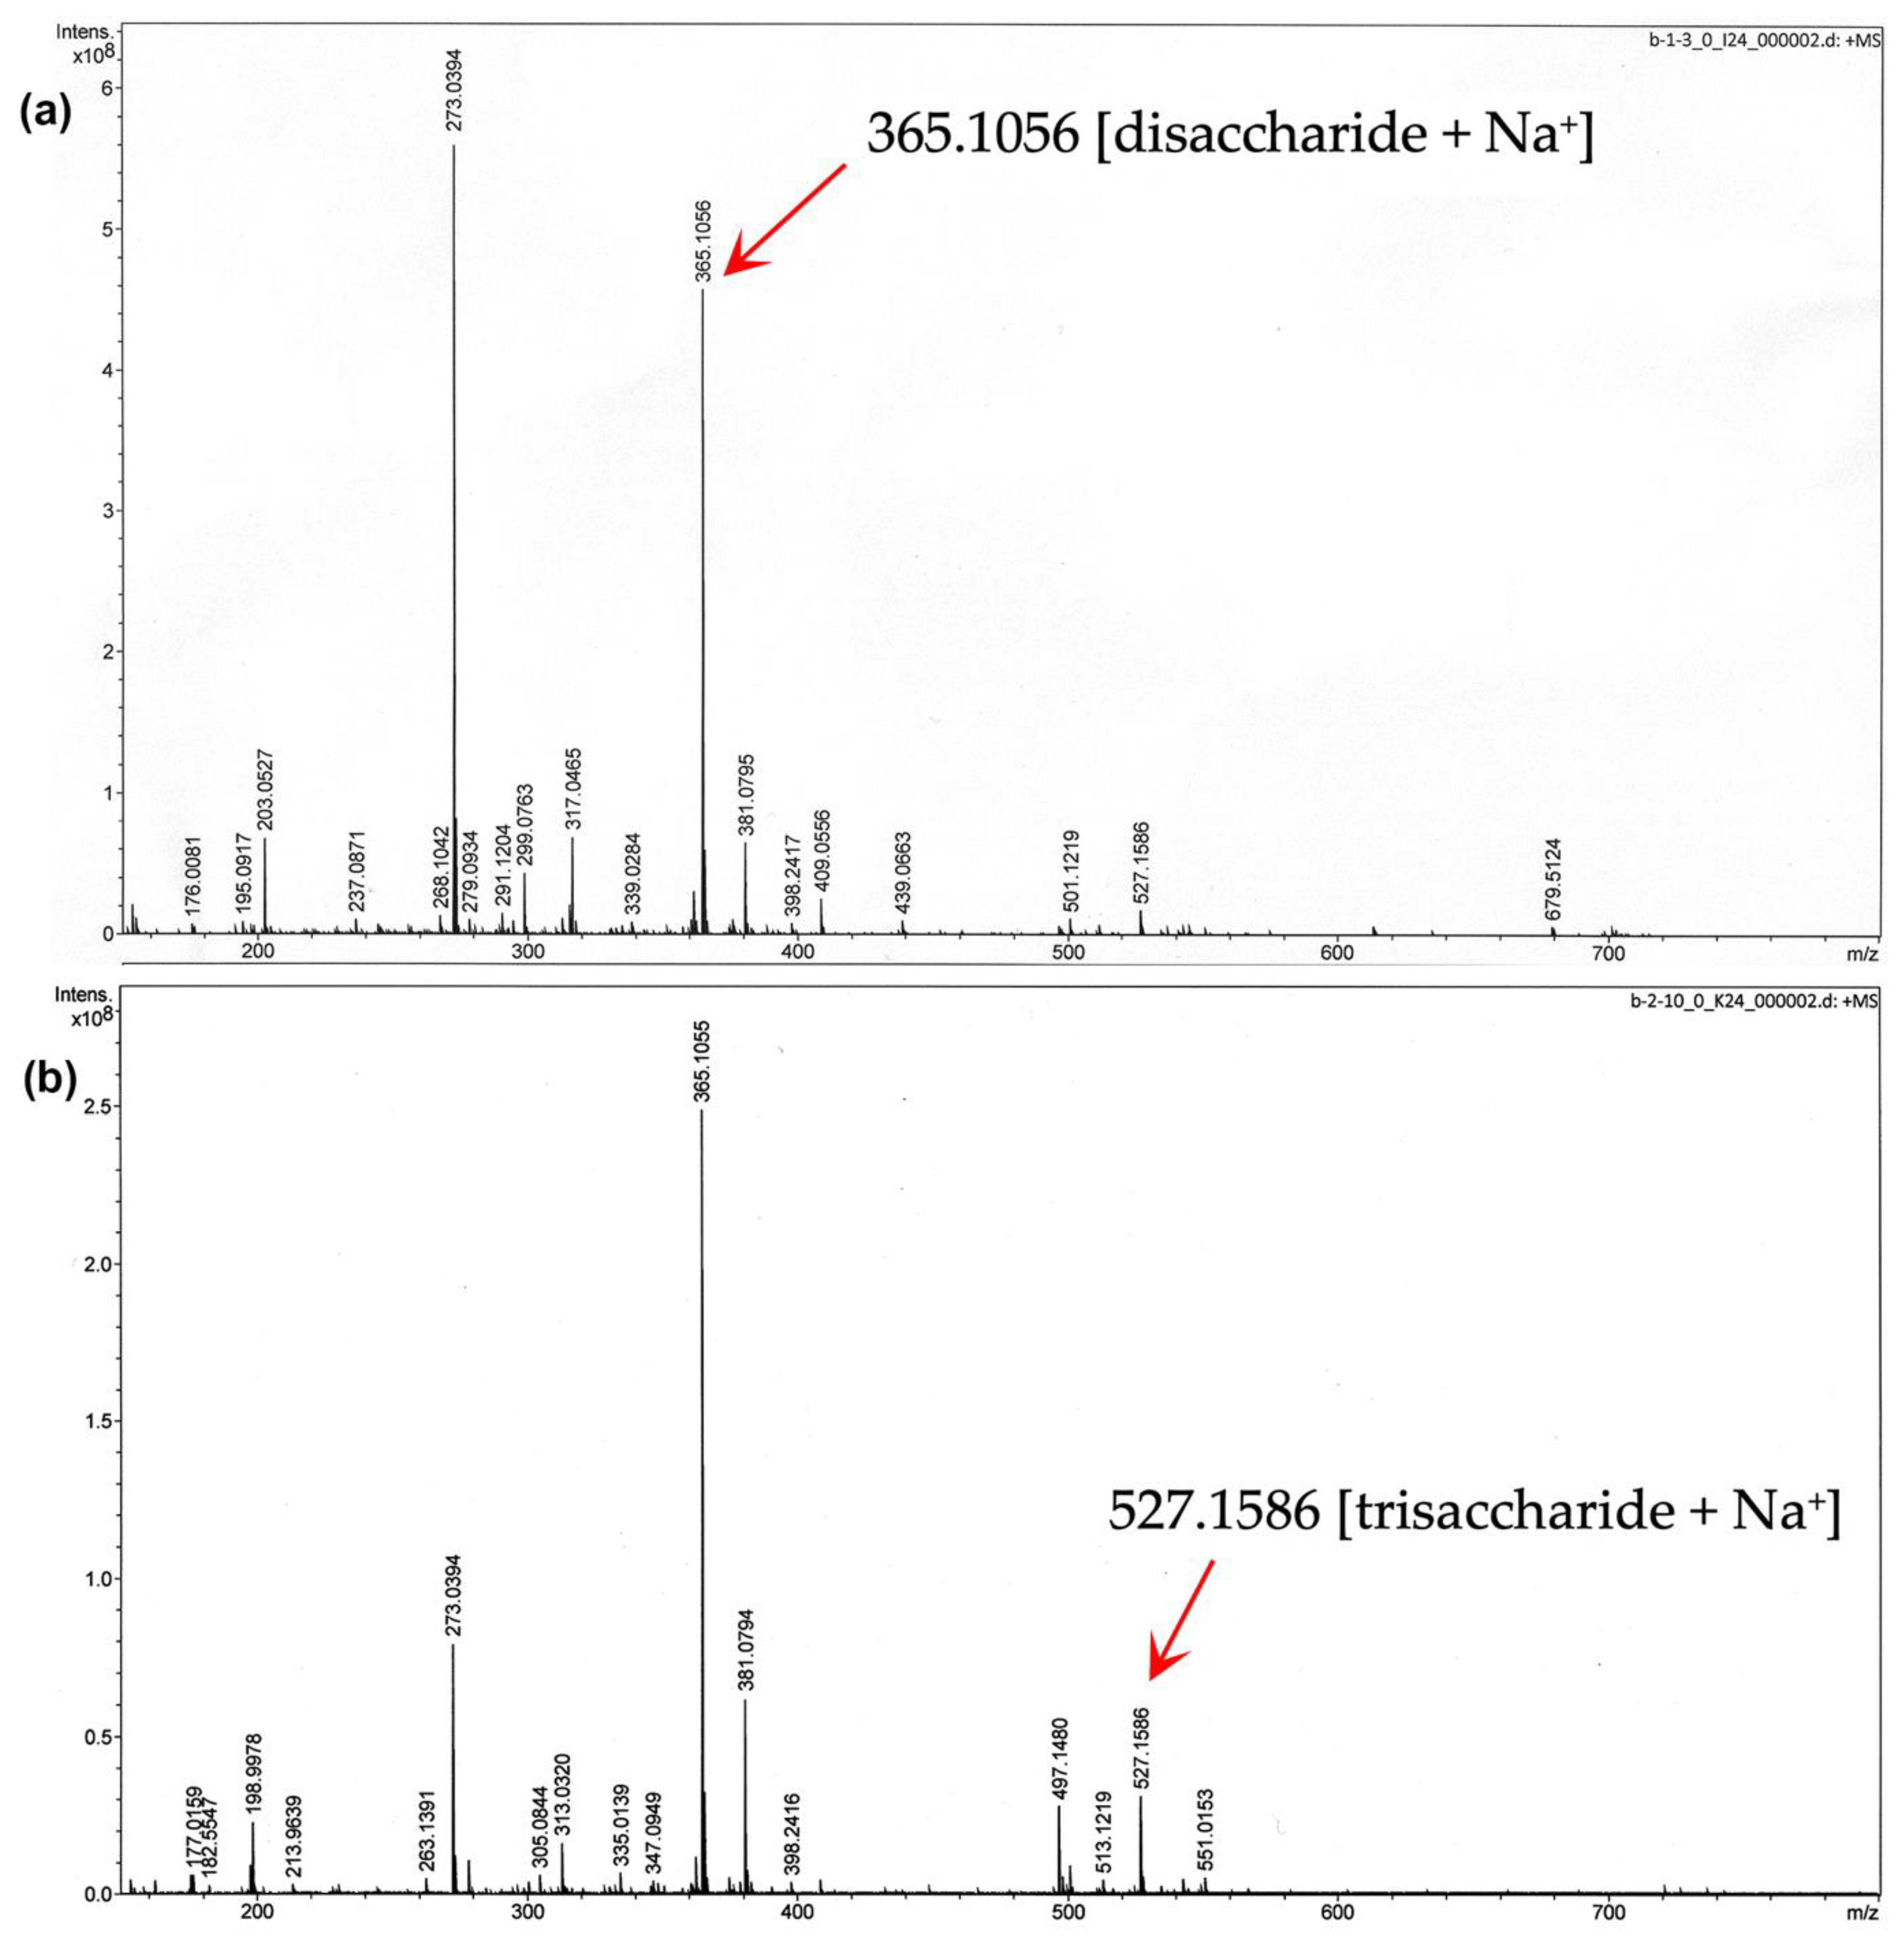
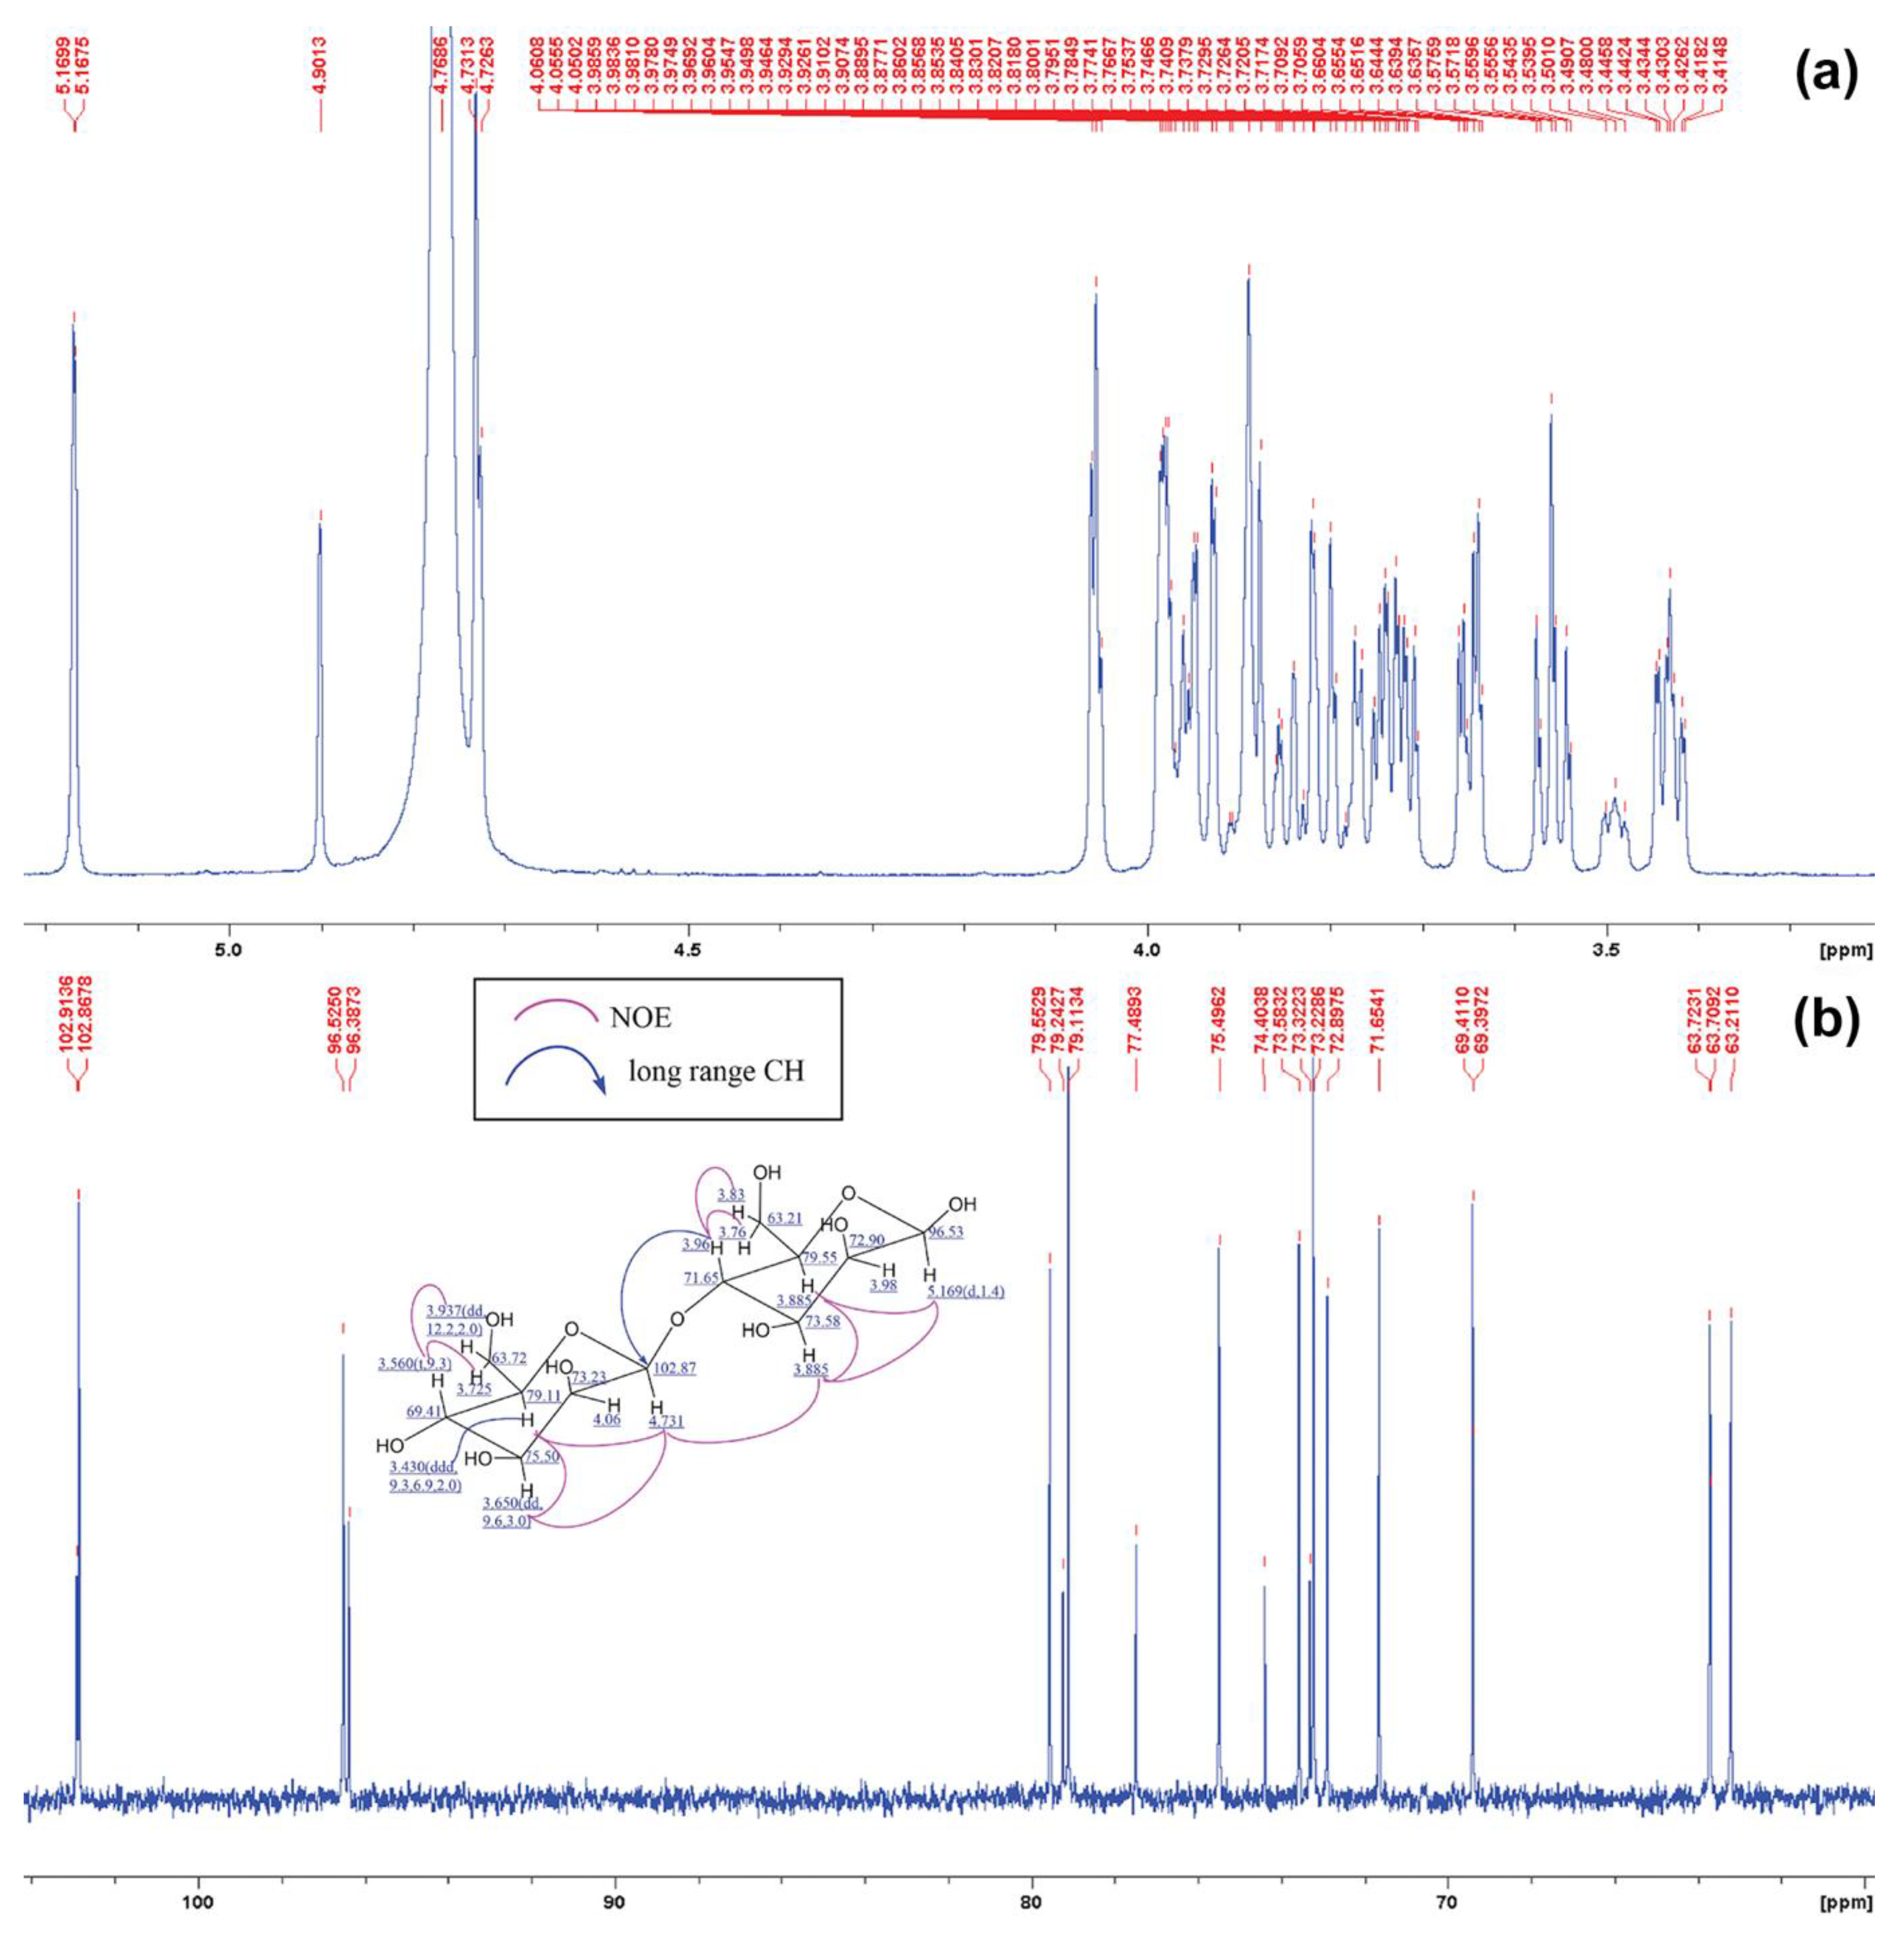
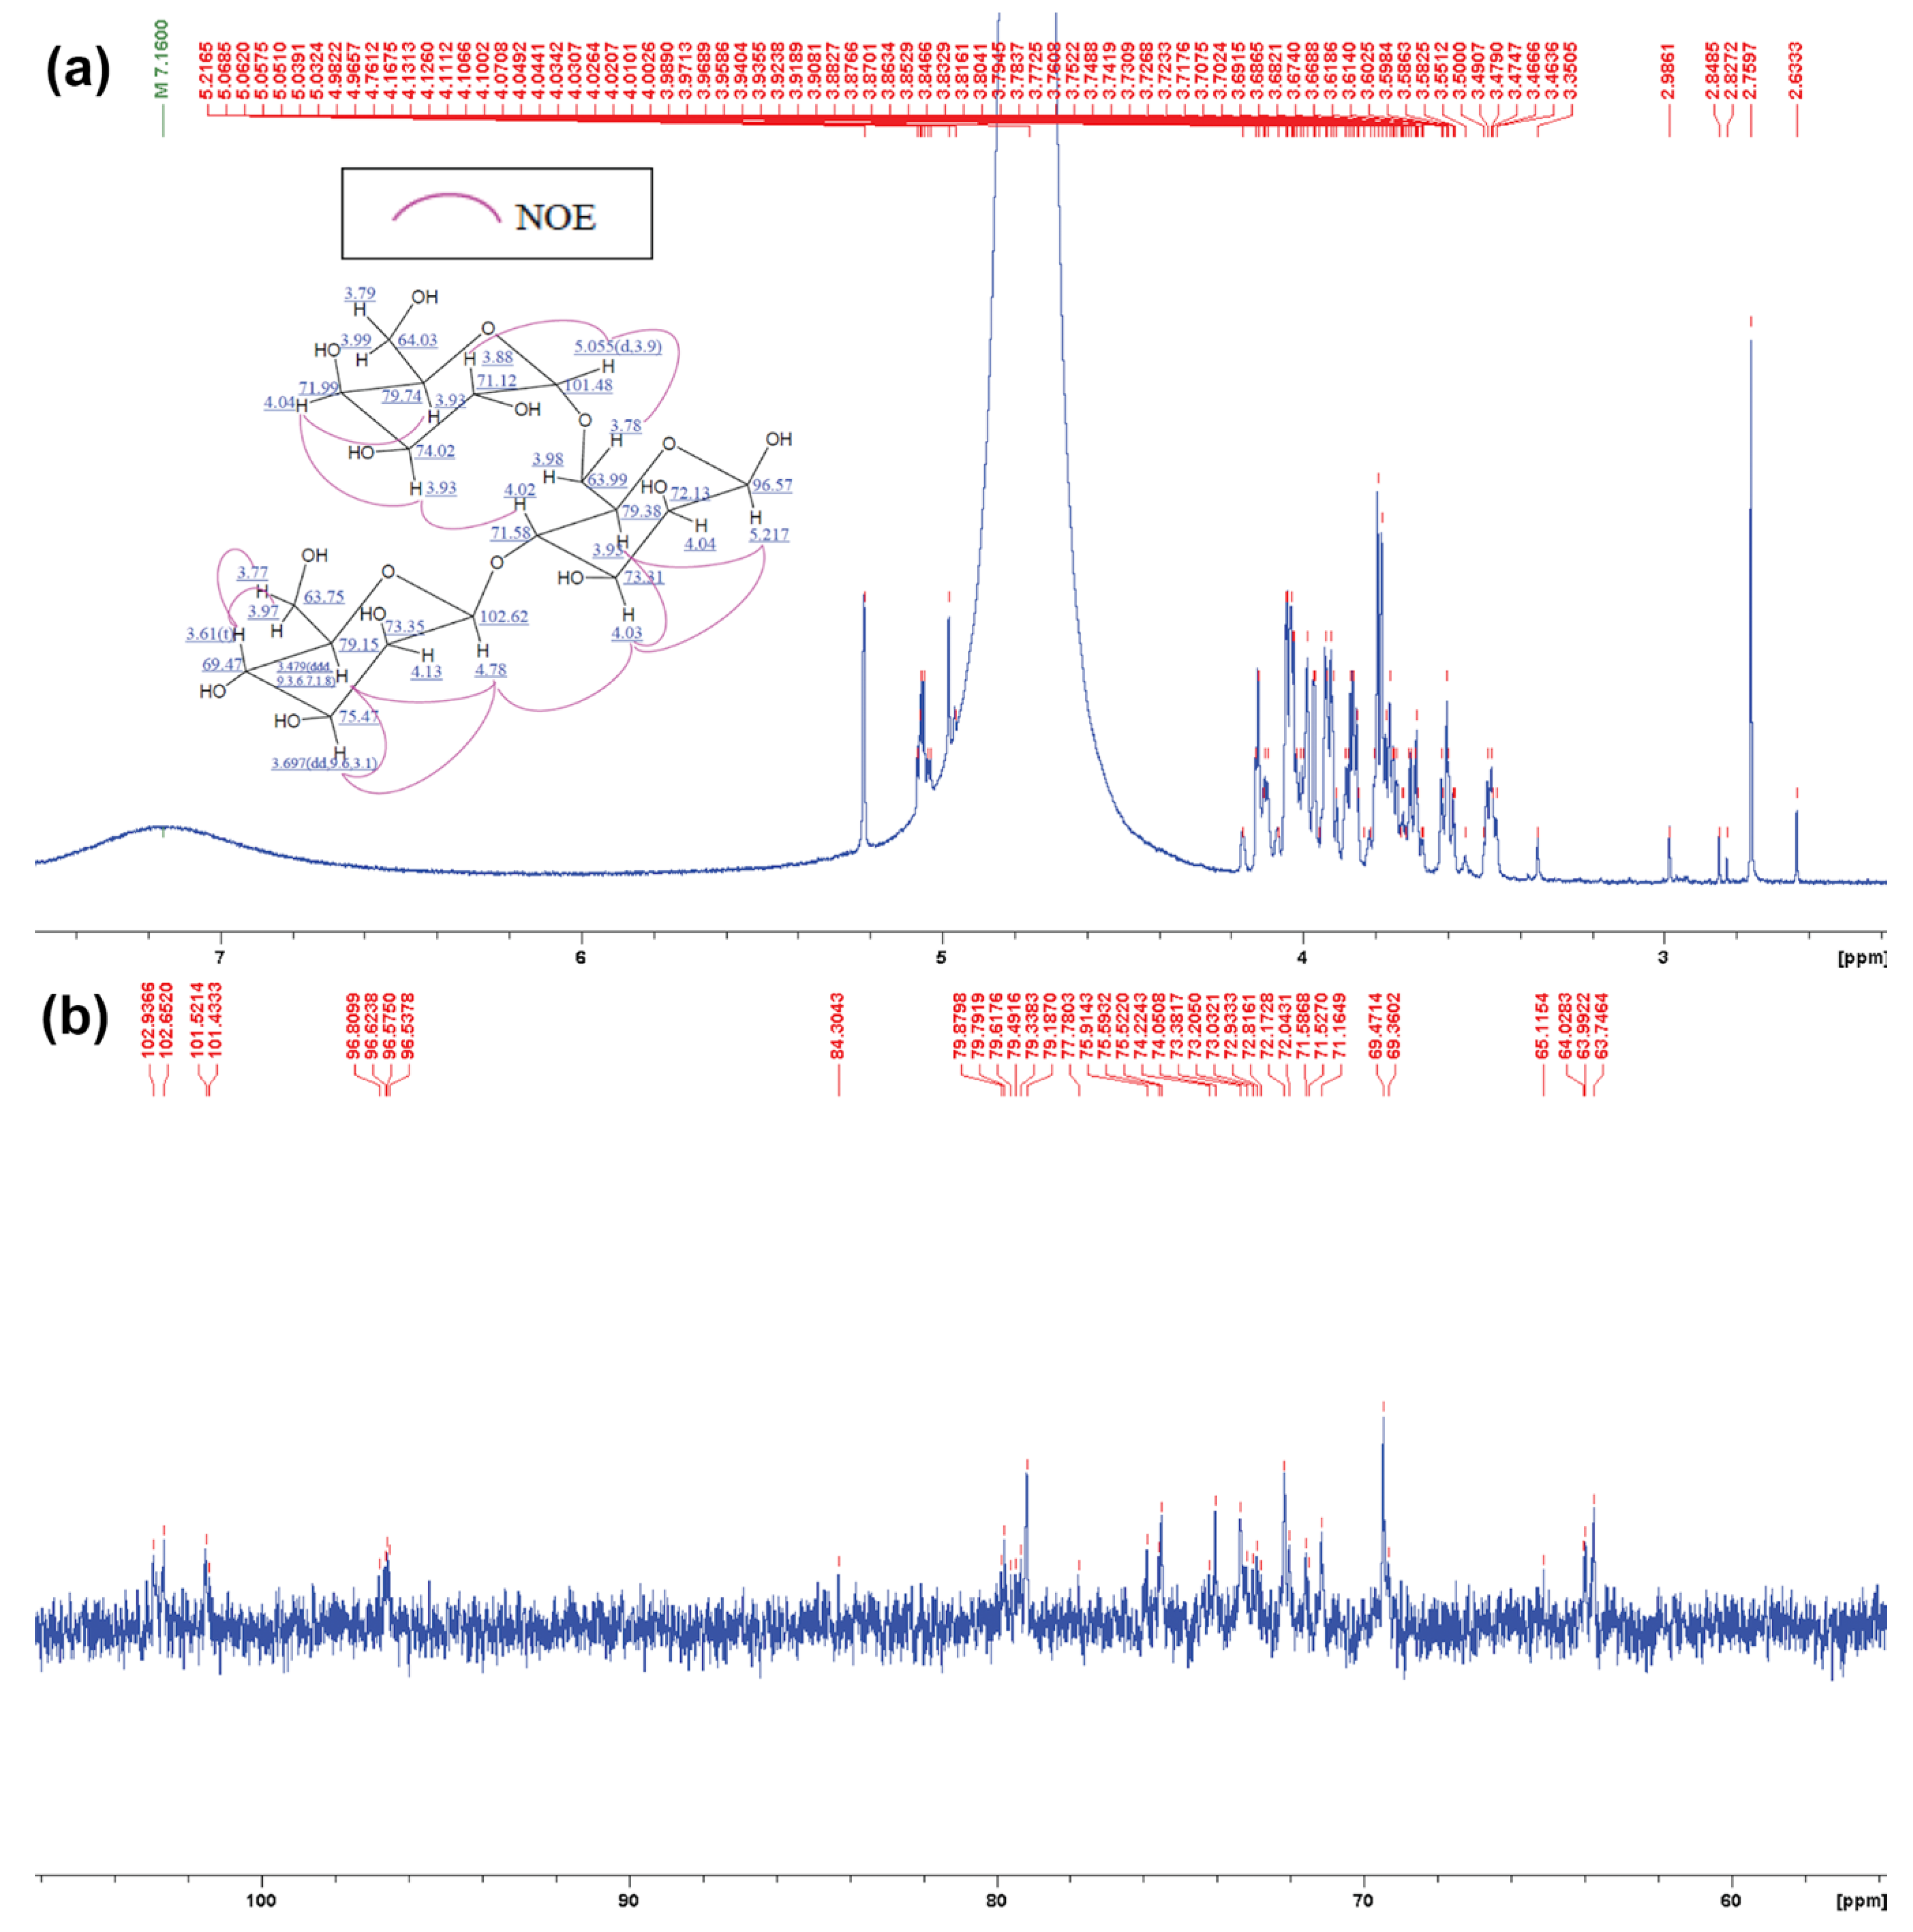
3.2. Determination of MOS5 Structure via Enzymatic Hydrolysis Assay

The result from incomplete digestion of purified MOS5 with α-galactosidase from A. fulica (Amano Enzyme Inc., Nagoya, Aichi, Japan) (CAfGLA) showed a monosaccharide band which has a different retention distance (Rf) than mannose (g), and a band with the same Rf to mannotetraose (m-4) (Figure 2a). Interestingly, once the concentration of α-galactosidase is increased, the products revealed other oligosaccharides. There was a disaccharide band with the same Rf to mannobiose (m-2) and a trisaccharide band (m-3) with a slightly different Rf than mannotriose (Figure 2a). Digestion of MOS5 with exo-β-D-mannosidase (A. fulica) (Seikagaku Corporation, Shiyoda-ku, Tokyo, Japan) revealed a monosaccharide band with the same Rf to mannose and a tetrasaccharide band with a different Rf from mannotetraose standard. Interestingly, recombinant β-mannannase, RMase24, cannot perform further digestion with MOS5 (Figure 2b).
Next, further purification of pCAfGLA was performed through Sephadex G150 gel filtration column chromatography and 5 mL was collected in each fraction. Fraction number 35 (F35) of separated pCAfGLA was labelled as PAfGLAF35, which has endo-β-mannosidase activity. Digestion of MOS5 with a lower amount of PAfGLAF35 than 2 µL per 1 µL of 1 µM MOS5 produced oligosaccharides larger than MOS5. A concentration of PAfGLAF35 used in digestion for NMR analysis was at excess to avoid a transferase by-product (Figure 2c). From this information, we can conclude the structure of MOS5 as shown in Figure 3.
The structure of MOS5 was further confirmed by NMR and MS. Digestion products of MOS5 with PAfGLAF35, m-2 and m-3, were collected and purified through Biogel P2 size exclusion chromatography before submitting to mass spectrometry and NMR analysis to confirm the structure. Mass of m-2 and m-3 were analyzed and showed a peak at 365 m/z and 527m/z, which indicated the molecular weight of disaccharide and trisaccharide with sodium salt, respectively (Figure 4a,b).
1H and 13C NMR spectra of m-2 and m-3 were analyzed at 300MHz and 150 MHz in D2O, respectively. The structural result of m-2 shown in Figure 5. The anomeric proton of mannose was identified with a chemical shift of protons following by; C1 on β-1,4 was identified at δ 5.169 ppm. C2 approximately at δ 3.98 to 4.06 ppm, and C4 approximately at δ 3.56. to 3.61 ppm. Moreover, a long-range CH proton chemical shift was also found at δ 4.731 ppm and δ 3.96 ppm which represented proton of C1 and C4 at β-1,4-mannosidic linkage, respectively. This had been confirmed with results from 13C NMR which revealed a chemical shift of carbon at following; anomeric C1 at δ 96.53 ppm, C2 at δ 72.90 and 73.23 ppm, and non-linkage C4 at δ 69.41ppm (Figure 5a–c).
Whereas 1H and 13C NMR spectra of m-3 represent the similar chemical shift signals as m-2, other different signals had been detected. 1H NMR spectra of m-3 revealed a signal of C1 on β-1,4 at δ 5.217 ppm. C2 approximately at δ 4.04 to 4.13 ppm, and C4 approximately at δ 3.61 ppm, but there were others proton chemical shift at δ 3.88 ppm, δ 4.04 ppm and 5.055 ppm which were identified as a proton chemical shift of C2, C4, and anomeric proton of C1 of α-1,6 linkage of galactose, respectively. The result shown on 13C NMR went along with the same trend as 1H NMR as it showed a similar pattern of carbon chemical shift of mannose at δ 96.57ppm on anomeric C1, δ 72.13 and 73.35 ppm on C2, and non-linkage C4 at δ 69.47ppm. 13C NMR result of m-3 also showed additional signal at δ 101.48, 71.12, and 71.99 ppm representing a chemical shift of C1 anomeric carbon, C2, and C3 of α-1,6 galactose, respectively (Figure 6a–c). Further 2D NMR analyses supporting m-2 and m-3 structures are provided in Figures S1–S6 and Figures S7–S12, respectively.

4. Discussion

From our recent study, MOS5 is the main compound in crude MOS from the enzymatic digestion that shows the ability to enhance the tight junction of epithelial cells [24]. In this study we varied the concentration of MOS5 to determine the optimal comcentration that will best promote tight junction assembly. MOS5 at 10 µM was found to be the optimal concentration to promote tight junction assembly. This concentration was then used in further experiments. Interestingly, a higher concentration of MOS5, 20 µM, shows a lower trend in promoting tight junction. This phenomena was observed earlier for β-glycan activation of tight junction [12,13,25,26,27,28].This might be a result of over activation of the cellular signaling pathway. Further studies are required.
Therefore, the detailed mechanism of action of MOS5 remains unknown. However, MOS5 may increase tight junction assembly through the activation of AMPK via its downstream pathway in the epithelial cells. This hypothesis was supported by previous reports demonstrating the ability of oligosaccharides to increase tight junction assembly through the activation of AMPK [12,26]. Substantiation of this hypothesis was drawn with the determination of tight junction assembly with MOS5 in the presence and absence of compound C, an AMPK inhibitor. TEER result shows that under inhibition of AMPK with compound C, MOS5 could no longer enhance the tight junction assembly of T84 after the destruction of cellular tight junction by Ca2+ removal. This result indicated that MOS5 might activate cellular tight junction via AMPK pathway. To confirm this hypothesis, Western blot analysis of AMPK phosphorylation was performed to observe the changes in phosphorylation level of AMPK after MOS5 treatment. The result revealed that treatment of MOS5 over T84 can increase phosphorylation of AMPK at 60 min post-treatment. From these results it can be concluded that MOS5 activates cellular tight junction of epithelial cells through phosphorylation of AMPK.
Several studies reported that MOS molecules obtained from copra meal consist of mannose and galactose but the order of their repeating units and the structure of the functional MOS molecules remained unknown [29,30,31,32,33]. In our study, determination of MOS5 structure was performed using enzymatic mapping together with NMR analysis methods. Digestion of MOS5 with crude α-galactosidase released galactose and a tetrasaccharide which had a similar retention distance on TLC to mannotetraose standard. Traces amount of m-2 and m-3, resulted from the contamination of endo-mannosidase within the crude enzyme. Furthermore, hydrolysis of MOS5 with exo-β-1,4-mannosidase resulted in mannose unit and tetrasaccharide product, which had a different retention distance from mannotetraose. This suggested that this tetrasaccharide obtained from this reaction was a heteromer tetramer composed of mannose and galactose. It has been reported that the presence of galactose in galactomannan polymer can limit the hydrolysis activity of exo-mannosidase [34].
To determine the order of mannose and galactose unit in MOS5 structure, MOS5 was digested with endo-β-mannosidase. Ademark, et al. reported that only mannobiose and mannotriose products were obtained from the digestion of mannopentose [35], suggesting that endo-β-mannosidase cannot perform a further digestion on disaccharide or trisaccharide which will be helpful to determine the structure of MOS5. The endo-β-mannosidase digestion resulted in disaccharide and trisaccharide as the digestion products. The digestion products were purified and molecular weight of these products were confirmed by mass spectrometry analysis. The structure of the disaccharide and trisaccharide were determined by 13C NMR, 1H NMR, and 2D NMR analysis. The results showed that the disaccharide product was β-(1,4)-mannobiose, while the trisaccharide product was β-(1,4)-mannobiose with α-(1,6)-galactose attached on the second mannose unit from non-reducing end. From the results of α-galactosidase, exo-β-1,4-mannosidase digestions, and the NMR results of the disaccharide and trisaccharide product from the endo-β-mannosidase digestion, we can conclude that MOS5 is a pentasaccharide containing mannotetraose with α-(1,6)-galactose attached to the second mannose unit from non-reducing end, showed in figure3.

5. Conclusions

Pentasaccharide, MOS5, from copra meal digestion has the ability to increase tight junction of epithelial tissue. Enzymatic hydrolysis of MOS5 and 13C NMR, 1H NMR, and 2D NMR analysis of MOS5 hydrolytic products demonstrated that the structure of bioactive MOS5 is a β-(1,4)-mannotetraose with α-(1,6)-galactose attached to the second mannose unit from the non-reducing end. MOS5 activate tight junction integration though the activation of AMPK pathway.

Supplementary Materials

Supplementary materials can be found at https://www.mdpi.com/2227-9059/7/4/81/s1.

Author Contributions

Conceptualization, R.P., and C.M.; methodology and validation, C.N., P.P., P.W., K.W.; formal analysis and investigation, C.N.; resources, R.P., K.I., and C.M.; data curation, C.N.; writing—original draft preparation, C.N., T.C.; writing—review and editing, T.C., R.P., K.I.; supervision, R.P., K.I., and C.M.; project administration, C.N.

Funding

This work was supported by the 100th Anniversary Chulalongkorn University Fund for Doctoral scholarship, the office of Graduate School, Chulalongkorn University.

Acknowledgments

The α-galactosidase (A. fulica) which was supported from Amano Enzyme Inc., Nagoya, Aichi, Japan. Special thanks to Kamontip Kuttiyawong, for her kindly advice and support during our lab process in Osaka, Japan.

Conflicts of Interest

The authors declare no conflict of interest.

References

  1. Edelblum, K.L.; Turner, J.R. The tight junction in inflammatory disease: Communication breakdown. Curr. Opin. Pharmacol. 2009, 9, 715–720. [Google Scholar] [CrossRef] [PubMed]
  2. Hong, S.; Gu, Y.; Gao, Z.; Guo, L.; Guo, W.; Wu, X.; Shen, Y.; Sun, Y.; Wu, X.; Xu, Q. EGFR inhibitor-driven endoplasmic reticulum stress-mediated injury on intestinal epithelial cells. Life Sci. 2014, 119, 28–33. [Google Scholar] [CrossRef] [PubMed]
  3. Johnson, K.S.; Levin, F.; Chu, D.S. Persistent corneal epithelial defect associated with erlotinib treatment. Cornea 2009, 28, 706–707. [Google Scholar] [CrossRef] [PubMed]
  4. Clayburgh, D.R.; Shen, L.; Turner, J.R. A porous defense: The leaky epithelial barrier in intestinal disease. Lab. Investig. 2004, 84, 282. [Google Scholar] [CrossRef] [PubMed]
  5. Shen, L. Tight junctions on the move: Molecular mechanisms for epithelial barrier regulation. Ann. New York Acad. Sci. 2012, 1258, 9. [Google Scholar] [CrossRef] [PubMed]
  6. Shen, L.; Su, L.; Turner, J.R. Mechanisms and functional implications of intestinal barrier defects. Dig. Dis. 2009, 27, 443–449. [Google Scholar] [CrossRef] [PubMed]
  7. Su, L.; Shen, L.; Clayburgh, D.R.; Nalle, S.C.; Sullivan, E.A.; Meddings, J.B.; Abraham, C.; Turner, J.R. Targeted epithelial tight junction dysfunction causes immune activation and contributes to development of experimental colitis. Gastroenterology 2009, 136, 551–563. [Google Scholar] [CrossRef]
  8. Sartor, R.B. Microbial influences in inflammatory bowel diseases. Gastroenterology 2008, 134, 577–594. [Google Scholar] [CrossRef]
  9. Sawada, N.; Murata, M.; Kikuchi, K.; Osanai, M.; Tobioka, H.; Kojima, T.; Chiba, H. Tight junctions and human diseases. Med. Electron. Microsc. 2003, 36, 147–156. [Google Scholar] [CrossRef]
  10. Turner, J.R. Intestinal mucosal barrier function in health and disease. Nat. Rev. Immunol. 2009, 9, 799. [Google Scholar] [CrossRef]
  11. Mitic, L.L.; Van Itallie, C.M.; Anderson, J.M. Molecular physiology and pathophysiology of tight junctions I. Tight junction structure and function: Lessons from mutant animals and proteins. Am. J. Physiol. Gastrointest. Liver Physiol. 2000, 279, G250–G254. [Google Scholar] [CrossRef] [PubMed]
  12. Muanprasat, C.; Wongkrasant, P.; Satitsri, S.; Moonwiriyakit, A.; Pongkorpsakol, P.; Mattaveewong, T.; Pichyangkura, R.; Chatsudthipong, V. Activation of AMPK by chitosan oligosaccharide in intestinal epithelial cells: Mechanism of action and potential applications in intestinal disorders. Biochem. Pharm. 2015, 96, 225–236. [Google Scholar] [CrossRef] [PubMed]
  13. Mattaveewong, T.; Wongkrasant, P.; Chanchai, S.; Pichyangkura, R.; Chatsudthipong, V.; Muanprasat, C. Chitosan oligosaccharide suppresses tumor progression in a mouse model of colitis-associated colorectal cancer through AMPK activation and suppression of NF-κB and mTOR signaling. Carbohydr. Polym. 2016, 145, 30–36. [Google Scholar] [CrossRef] [PubMed]
  14. Lin, S.J.; Hu, Y.; Zhu, J.; Woodruff, T.K.; Jardetzky, T.S. Structure of betaglycan zona pellucida (ZP)-C domain provides insights into ZP-mediated protein polymerization and TGF-β binding. Proc. Natl. Acad. Sci. USA 2011, 108, 5232–5236. [Google Scholar] [CrossRef]
  15. Dimitroglou, A.; Merrifield, D.L.; Spring, P.; Sweetman, J.; Moate, R.; Davies, S.J. Effects of mannan oligosaccharide (MOS) supplementation on growth performance, feed utilisation, intestinal histology and gut microbiota of gilthead sea bream (Sparus aurata). Aquaculture 2010, 300, 182–188. [Google Scholar] [CrossRef]
  16. Cheled-Shoval, S.; Gamage, N.W.; Amit-Romach, E.; Forder, R.; Marshal, J.; Van Kessel, A.; Uni, Z. Differences in intestinal mucin dynamics between germ-free and conventionally reared chickens after mannan-oligosaccharide supplementation. Poult. Sci. 2014, 93, 636–644. [Google Scholar] [CrossRef]
  17. Corrigan, A.; Horgan, K.; Clipson, N.; Murphy, R. Effect of dietary prebiotic (mannan oligosaccharide) supplementation on the caecal bacterial community structure of turkeys. Microb. Ecol. 2012, 64, 826–836. [Google Scholar] [CrossRef]
  18. Mansour, M.R.; Akrami, R.; Ghobadi, S.; Denji, K.A.; Ezatrahimi, N.; Gharaei, A. Effect of dietary mannan oligosaccharide (MOS) on growth performance, survival, body composition, and some hematological parameters in giant sturgeon juvenile (Huso huso Linnaeus, 1754). Fish. Physiol. Biochem. 2012, 38, 829–835. [Google Scholar] [CrossRef]
  19. Ai, Q.; Xu, H.; Mai, K.; Xu, W.; Wang, J.; Zhang, W. Effects of dietary supplementation of Bacillus subtilis and fructooligosaccharide on growth performance, survival, non-specific immune response and disease resistance of juvenile large yellow croaker, Larimichthys crocea. Aquaculture 2011, 317, 155–161. [Google Scholar] [CrossRef]
  20. Mourão, J.L.; Pinheiro, V.; Alves, A.; Guedes, C.; Pinto, L.; Saavedra, M.J.; Spring, P.; Kocher, A. Effect of mannan oligosaccharides on the performance, intestinal morphology and cecal fermentation of fattening rabbits. Anim. Feed Sci. Technol. 2006, 126, 107–120. [Google Scholar] [CrossRef]
  21. Grisdale-Helland, B.; Helland, S.J.; Gatlin III, D.M. The effects of dietary supplementation with mannanoligosaccharide, fructooligosaccharide or galactooligosaccharide on the growth and feed utilization of Atlantic salmon (Salmo salar). Aquaculture 2008, 283, 163–167. [Google Scholar] [CrossRef]
  22. Staykov, Y.; Spring, P.; Denev, S.; Sweetman, J. Effect of a mannan oligosaccharide on the growth performance and immune status of rainbow trout (Oncorhynchus mykiss). Aquac. Int. 2007, 15, 153–161. [Google Scholar] [CrossRef]
  23. Genc, M.; Aktas, M.; Genc, E.; Yilmaz, E. Effects of dietary mannan oligosaccharide on growth, body composition and hepatopancreas histology of Penaeus semisulcatus (de Haan 1844). Aquac. Nutr. 2007, 13, 156–161. [Google Scholar] [CrossRef]
  24. Nopvichai, C.; Charoenwongpaiboon, T.; Luengluepunya, N.; Ito, K.; Muanprasat, C.; Pichyangkura, R. Production and purification of mannan oligosaccharide with epithelial tight junction enhancing activity. PeerJ 2019, 7, e7206. [Google Scholar] [CrossRef] [PubMed]
  25. Muanprasat, C.; Chatsudthipong, V. Chitosan oligosaccharide: Biological activities and potential therapeutic applications. Pharm. Ther. 2017, 170, 80–97. [Google Scholar] [CrossRef]
  26. Yousef, M.; Pichyangkura, R.; Soodvilai, S.; Chatsudthipong, V.; Muanprasat, C. Chitosan oligosaccharide as potential therapy of inflammatory bowel disease: Therapeutic efficacy and possible mechanisms of action. Pharm. Res. 2012, 66, 66–79. [Google Scholar] [CrossRef]
  27. Peshev, D.; Van den Ende, W. Fructans: Prebiotics and immunomodulators. J. Funct. Foods 2014, 8, 348–357. [Google Scholar] [CrossRef]
  28. Shi, L.; Fang, B.; Yong, Y.; Li, X.; Gong, D.; Li, J.; Yu, T.; Gooneratne, R.; Gao, Z.; Li, S. Chitosan oligosaccharide-mediated attenuation of LPS-induced inflammation in IPEC-J2 cells is related to the TLR4/NF-κB signaling pathway. Carbohydr. Polym. 2019, 219, 269–279. [Google Scholar] [CrossRef]
  29. Ghosh, A.; Verma, A.K.; Tingirikari, J.R.; Shukla, R.; Goyal, A. Recovery and purification of oligosaccharides from copra meal by recombinant endo-β-mannanase and deciphering molecular mechanism involved and its role as potent therapeutic agent. Mol. Biotechnol. 2015, 57, 111–127. [Google Scholar] [CrossRef]
  30. Saittagaroon, S.; Kawakishi, S.; Namiki, M. Characterisation of polysaccharides of copra meal. J. Sci. Food Agric. 1983, 34, 855–860. [Google Scholar] [CrossRef]
  31. Khuwijitjaru, P.; Watsanit, K.; Adachi, S. Carbohydrate content and composition of product from subcritical water treatment of coconut meal. J. Ind. Eng. Chem. 2012, 18, 225–229. [Google Scholar] [CrossRef]
  32. Abe, J.-i.; Hossain, M.Z.; Huzukuri, S. Isolation of β-mannanase-producing microorganism. J. Ferment. Bioeng. 1994, 78, 259–261. [Google Scholar] [CrossRef]
  33. Hossain, M.Z.; Abe, J.-i.; Hizukuri, S. Multiple forms of β-mannanase from Bacillus sp. KK01. Enzym. Microb. Technol. 1996, 18, 95–98. [Google Scholar] [CrossRef]
  34. McCleary, B.; Matheson, N.; Small, D.M. Galactomannans and a galactoglucomannan in legume seed endosperms: Structural requirements for β-mannanase hydrolysis. Phytochemistry 1976, 15, 1111–1117. [Google Scholar] [CrossRef]
  35. Ademark, P.; Varga, A.; Medve, J.; Harjunpää, V.; Drakenberg, T.; Tjerneld, F.; Stålbrand, H. Softwood hemicellulose-degrading enzymes from Aspergillus niger: Purification and properties of a β-mannanase. J. Biotechnol. 1998, 63, 199–210. [Google Scholar] [CrossRef]
Figure 1. (a) Transepithelial electrical resistant (TEER) result of T84 cells treated with MOS5 with various concentration compared to the control group (vehicle). TEER of T84 cells were significantly increased at 20 µM and 10 µM of MOS5 (n = 3–4, one-way ANOVA, p = 0.002 and p < 0.0001, respectively). (b) Determination of tight junction reassembly of MOS5 compared to vehicle (no-treated) group and AMPK inhibitor, compound C. Result shown that MOS5 could recovered the TEER faster compared to the control but could not recovered TEER under the presence of compound C (n = 4–5, two-way ANOVA, p < 0.0001). (c,d) Western blot analysis of AMPK phosphorylation. M and N indicated T84 cells treated with 10 µM MOS5 and untreated with MOS5, respectively. The phosphorylation of AMPK was highest after the treatment of MOS5 for 60 min (n = 3, one-way ANOVA, p = 0.0014). The results here were represented as mean ± SD. (** and *** indicated a significant as p 0.002 and p < 0.0001, respectively.)
Biomedicines 07 00081 g001
Figure 2. Enzymatic mapping of MOS5. (a) Digestion of MOS5 with CAfGLA. 1–0.125 µL indicates a reaction between 1 µL of 1 µM MOS5 and 1 µL to 0.125 µL of 20 mg/mL CAfGLA, respectively. (b) Digestion of MOS5 with exo-beta-D-mannosidase (A. fulica) (Seikagaku corporation, Japan) and RMase24. (c) Digestion of MOS5 with various amount of pAfGLAF35. 0.0625–9.0000× indicates a reaction between 1 µL of 1 µM MOS5 with 0.0625 µL to 9 µL of pAfGLAF35, amount ranging as labelled respectively.
Biomedicines 07 00081 g002
Figure 3. The structure of MOS5 predicted from enzymatic analysis.
Biomedicines 07 00081 g003
Figure 4. Mass spectrometry analysis of digested MOS5 (a) m-2 with sodium salt at 365 m/z, and (b) m-3 with sodium salt at 527.1586 m/z.
Biomedicines 07 00081 g004
Figure 5. NMR analysis of PAfGLAF35 hydrolytic product, m-2. (a) 1H NMR of m-2 and (b) 13C NMR spectra of m-2. Predicted structure of m-2 is provided within Figure 5b.
Biomedicines 07 00081 g005
Figure 6. NMR analysis of PAfGLAF35 hydrolytic product, m-3. (a) 1H NMR of m-3 and (b) 13C NMR spectra of m-3. Predicted structure of m-3 is provided within Figure 6b.
Biomedicines 07 00081 g006

