Article

Carbon Dots Fluorescence-Based Colorimetric Sensor for Sensitive Detection of Aluminum Ions with a Smartphone

1
Laboratory of Micro & Nano Biosensing Technology in Food Safety, Hunan Provincial Key Laboratory of Food Science and Biotechnology, College of Food Science and Technology, Hunan Agricultural University, Changsha 410128, China
2
College of Bioscience and Biotechnology, Hunan Agricultural University, Changsha 410128, China
*
Authors to whom correspondence should be addressed.
These authors contributed equally to this work.
Chemosensors 2021, 9(2), 25; https://doi.org/10.3390/chemosensors9020025
Submission received: 21 December 2020 / Revised: 22 January 2021 / Accepted: 26 January 2021 / Published: 29 January 2021
(This article belongs to the Special Issue Near-Infrared Fluorophores for Biomedical Research)

Abstract

:
In this work, blue emission carbon dots (CDs) are synthesized in the one-pot solvothermal method using naringin as precursor. The CDs are used to develop a ratiometric fluorescence sensor for the sensitive analysis of Al3+ with a detection limit of 113.8 nM. A fluorescence emission peak at 500 nm gradually appears, whereas the original fluorescence peak at 420 nm gradually decreases upon the increase in the Al3+ concentration. More importantly, the obvious color change of the CDs probe from blue to green under a 360 nm UV lamp can be identified by a smartphone and combined with the RGB (red/green/blue) analysis. This results in a visual and sensitive analysis of Al3+ with a detection limit of 5.55 μM. Moreover, the high recovery is in the 92.46–104.10% range, which demonstrates the high accuracy of this method for actual samples’ analysis. The use of a smartphone and the RGB analysis greatly simplifies the operation process, saves equipment cost, shortens the detection time, and provides a novel method for the instant, on-site, visual detection of Al3+ in actual samples.

1. Introduction

Aluminum, which is considered the most abundant metal element in the Earth’s crust, is widely used in daily applications, such as water treatment, aluminum containers, cooking utensils, and food additives, resulting in a reasonable increase in the Al3+ concentration in water and food. Its slow accumulation in the human body can adversely affect the human health, since this compound is suspected to play a role in both Parkinson’s and Alzheimer’s diseases [1,2]. The permissible level in drinking water is set as 7.41 μM by the World Health Organization (WHO) [3]. This highly requires the development of Al3+ sensors to quantitatively detect Al3+ on-site and instantly. Traditional methods include atomic absorption spectrometry (AAS), atomic absorption spectrometry (ABS), and inductively coupled plasma mass spectrometry (ICP-MS). They are highly sensitive analysis tools but need expensive instrument facilities, which increases the difficulty in satisfying the on-site, instant determination of the Al3+ [4,5].
To simplify the detection procedure, colorimetric sensors based on the nanoparticles have attracted considerable attention due to their instant, low-cost, and visual identification characteristics [6,7]. For example, Joshi et al. reported a sensitive and selective colorimetric probe for Al3+ by using indole-2-carboxylic acid capped sliver nanoparticles (AgNPs) [8]. Gold nanoparticles (AuNPs) are also used as a novel probe for constructing the colorimetric sensors for Al3+.Based on the stable Au-S band, 5-mercaptomethyltetrazole (MMT) [9] and 5-(1,2-dithiolan-3-yl)–N-((1-(2-(2-(2- hydroxyethoxy) ethoxy)ethyl)-1H-1,2,3-triazol-4-yl)methyl)pentanamide (TTP) [10] were modified on the surface of AuNPs, which serve as the specific probes for Al3+. The units on the surface of AuNPs chelate with Al3+, thus inducing the aggregation of AuNPs and the color change of solutions from red to blue. Moreover, ionic liquid (1-ethyl-3-methylimidazolium thiocyanate)-coated AuNPs (IL-AuNPs) was prepared in one step using IL as the protecting ligands [11]. The IL resulted in the aggregation of AuNPs and colorimetric detection as well in the presence of Al3+, due to the synergistic action of cationic and anionic moiety of IL. However, these methods are normally based on the detection of the absorptivity changes, and suffer from a moderate sensitivity and accuracy. Given the specific interaction between Al3+ and fluorescent chromophore, many efforts on the exploitation of fluorescence sensors were conducted to improve the sensitivity for the Al3+ detection, in which various functional chromophore-mediated small molecules, such as schiff bases [12] and coumarin [13], were synthesized as fluorescence probes. The new schiff base ((E)-2-(((8-hydroxy-2,3,6,7-tetrahydro-1H,5H-pyrido [3,2,1-ij]quinolin-9-yl)methylene)amino)benzoic acid) exhibited obvious fluorescence enhancement towards Al3+ [12], while coumarin derivatives from the reaction between 7-diethylaminocoumarin-3-carbohydrazide and 2-hydroxy-1-naphthaldehyde serve as the ratiometric fluorescent probe for Al3+ detection [13]. The chelation-enhanced fluorescence effect and the inhibited charge transfer account for the above selective detection of Al3+. Although these methods are sensitive, these constructed fluorescence sensors suffer from the complex synthesis procedure and poor anti-photobleaching property. Moreover, the sensitivity of these normal fluorescence sensors was still limited by the influence of the fluctuation of the light source, the environmental uncertainty, and the subtle changes in the probe concentration. To eliminate these effects, one solution is to develop a ratiometric sensor using two different-colored fluorescence probes. Two-color fluorescence probes including quantum dots [14,15], quantum dots-conventional fluorescent dyes [16], metal nanoclusters [17], gold nanoclusters-carbon dots [18], have been confirmed in the ratiometric strategy. However, these devices normally require the adjustment of the fluorescence intensity ratio of the two different-colored fluorescence probes, increasing the complexity of the technique.
Carbon dots (CDs) are a new class of fluorescent nanomaterials and they have been used extensively in various applications, such as sensing and imaging [19,20], because of their simple synthesis, low cost, and low toxicity [21,22]. Since the surface groups of the CDs can interact with metal ions via chelation, a ratiometric sensor based on two-color fluorescent CDs has been proposed for the visual detection of Pb2+ under a UV lamp [23]. Inspired by previous works that claim the Al3+ can induce a new fluorescence peak when itinteracts with several small fluorescent molecules [24,25], one kind of fluorescent CDs can be used to develop a fluorescence-based colorimetric sensor for the sensitive detection of Al3+. This is possible if the surface of the CDs possesses specific chemical groups.
Recently, smartphone-based analysis has introduced a significant convenience in the field of fluorescence-based colorimetric detection, making it possible to detect analytes in real time and on-site [26,27]. Moreover, the color images can be digitized via the RGB profile analysis and with the help of an open source software, such as Image J or RGB picker. The results show that a smartphone-based analysis can satisfy the on-site quantitative determination of several compounds. For example, Wang et al. [23] reported an instrument-free, paper-based analytical device with two dual-emission CDs for the quantitative detection of Pb2+ based on a color recognizer (a smartphone application) to evaluate the RGB values in the image. Similarly, fluoride anions were successfully detected by using the combination of a smartphone and the RGB analysis. The probes consisted of mixed lanthanide and metal-organic frameworks [28]. Apart from the on-site determination of ions, small molecules, such as miRNAs [27], tetracycline [29], and alkaline phosphatase [30], were also analyzed sensitively via the combination of a smartphone and two-color fluorescent materials.Therefore, the on-site quantitative detection of Al3+ can be achieved using one kind of CDs probe and a smartphone coupled with the RGB profile analysis of the images.
The precursors for the synthesis of CDs are usually citric acid, glucose, etc., which have multiple hydroxyl groups. These CDs exhibit excellent fluorescence properties and have been used in the detection of various ions [22]. In recent years, naringin has been shown to be a flavonone glycoside with pharmacological activity and multiple hydroxyl groups [31,32], and has exhibited potential effects in the aspects of neurological disorders [33], diabetes [34], and toxicity [35]. However, it has not been reported as a carbon source to synthesize CDs. Herein, blue emissive CDs at 420 nm were synthesized from naringinin ethanol solvent. The surface of the CDs possesses abundant carbon-oxygen bonds, which offer the chelating sites to Al3+. When Al3+ is added into the CDs probe solution, a new fluorescence emission peak at 500 nm appears, whereas the intensity of the original fluorescence peak at 420 nm decreases (Figure 1). Based on these results, a ratiometric fluorescence sensor was developed for detecting Al3+ with a detection limit of 113.8 nM. Moreover, this fluorescence-based colorimetric method coupled with the RGB analysis was also investigated to detect Al3+ with a detection limit of 5.55 μM. To the best of the authors’ knowledge, this manuscript is the first report of a CDs-based sensor for the Al3+ detection via the colorimetric fluorescent analysis.

2. Materials and Methods

2.1. Chemicals

Naringin (C27H32O14)was obtained from Alfa Aesar Chemical Company (Beijing, China). Ethanol, quinine sulfate, HCl, NaOH, AgNO3, Al(NO3)3, CaCl2, CdCl2, CoCl2, CrCl3, CuSO4, FeCl2, FeCl3, Hg(NO3)2, KCl, MgCl2, NaCl, NiCl2, ZnCl2, Pb(NO3)2, As3+ standard solution, glycine, serine, L-threoine, L-glutamic, L-alanine, L-aspartic, glucose, glutathione, vitamin C, urea, humic acid, fulvic acid, and acetic-acetate buffer (pH 5.0) were of analytical reagent grade and were purchased from local reagent suppliers. Deionized water was prepared via a Milli-Q ultrapure water system and used during the whole experiment.

2.2. Characterization and Instrumentation

Fluorescence spectra were recorded via a F-7000 fluorescence spectrophotometer (Hitachi). UV-vis absorption spectra were collected on a Shimadzu UV-2600 spectrophotometer. The morphology and the particle size were measured by using a JEM-2100 transmission electron microscope (TEM). The functional groups of the CDs were characterized via a FT-IR spectrometer (Shimadzu, IR Affinity-1). The Crystal properties and elements were analyzed by X-ray diffractometer (XRD) and X-ray photoelectron spectroscopy (XPS) of Japan electronics corporation. The zeta potential was measured by using the Nano-ZS90Malvern Zetasizer. The photographs were taken with a Huawei smartphone. The RGB colors of the photographs were analyzed via Image J (designed by National Institutes of Health).

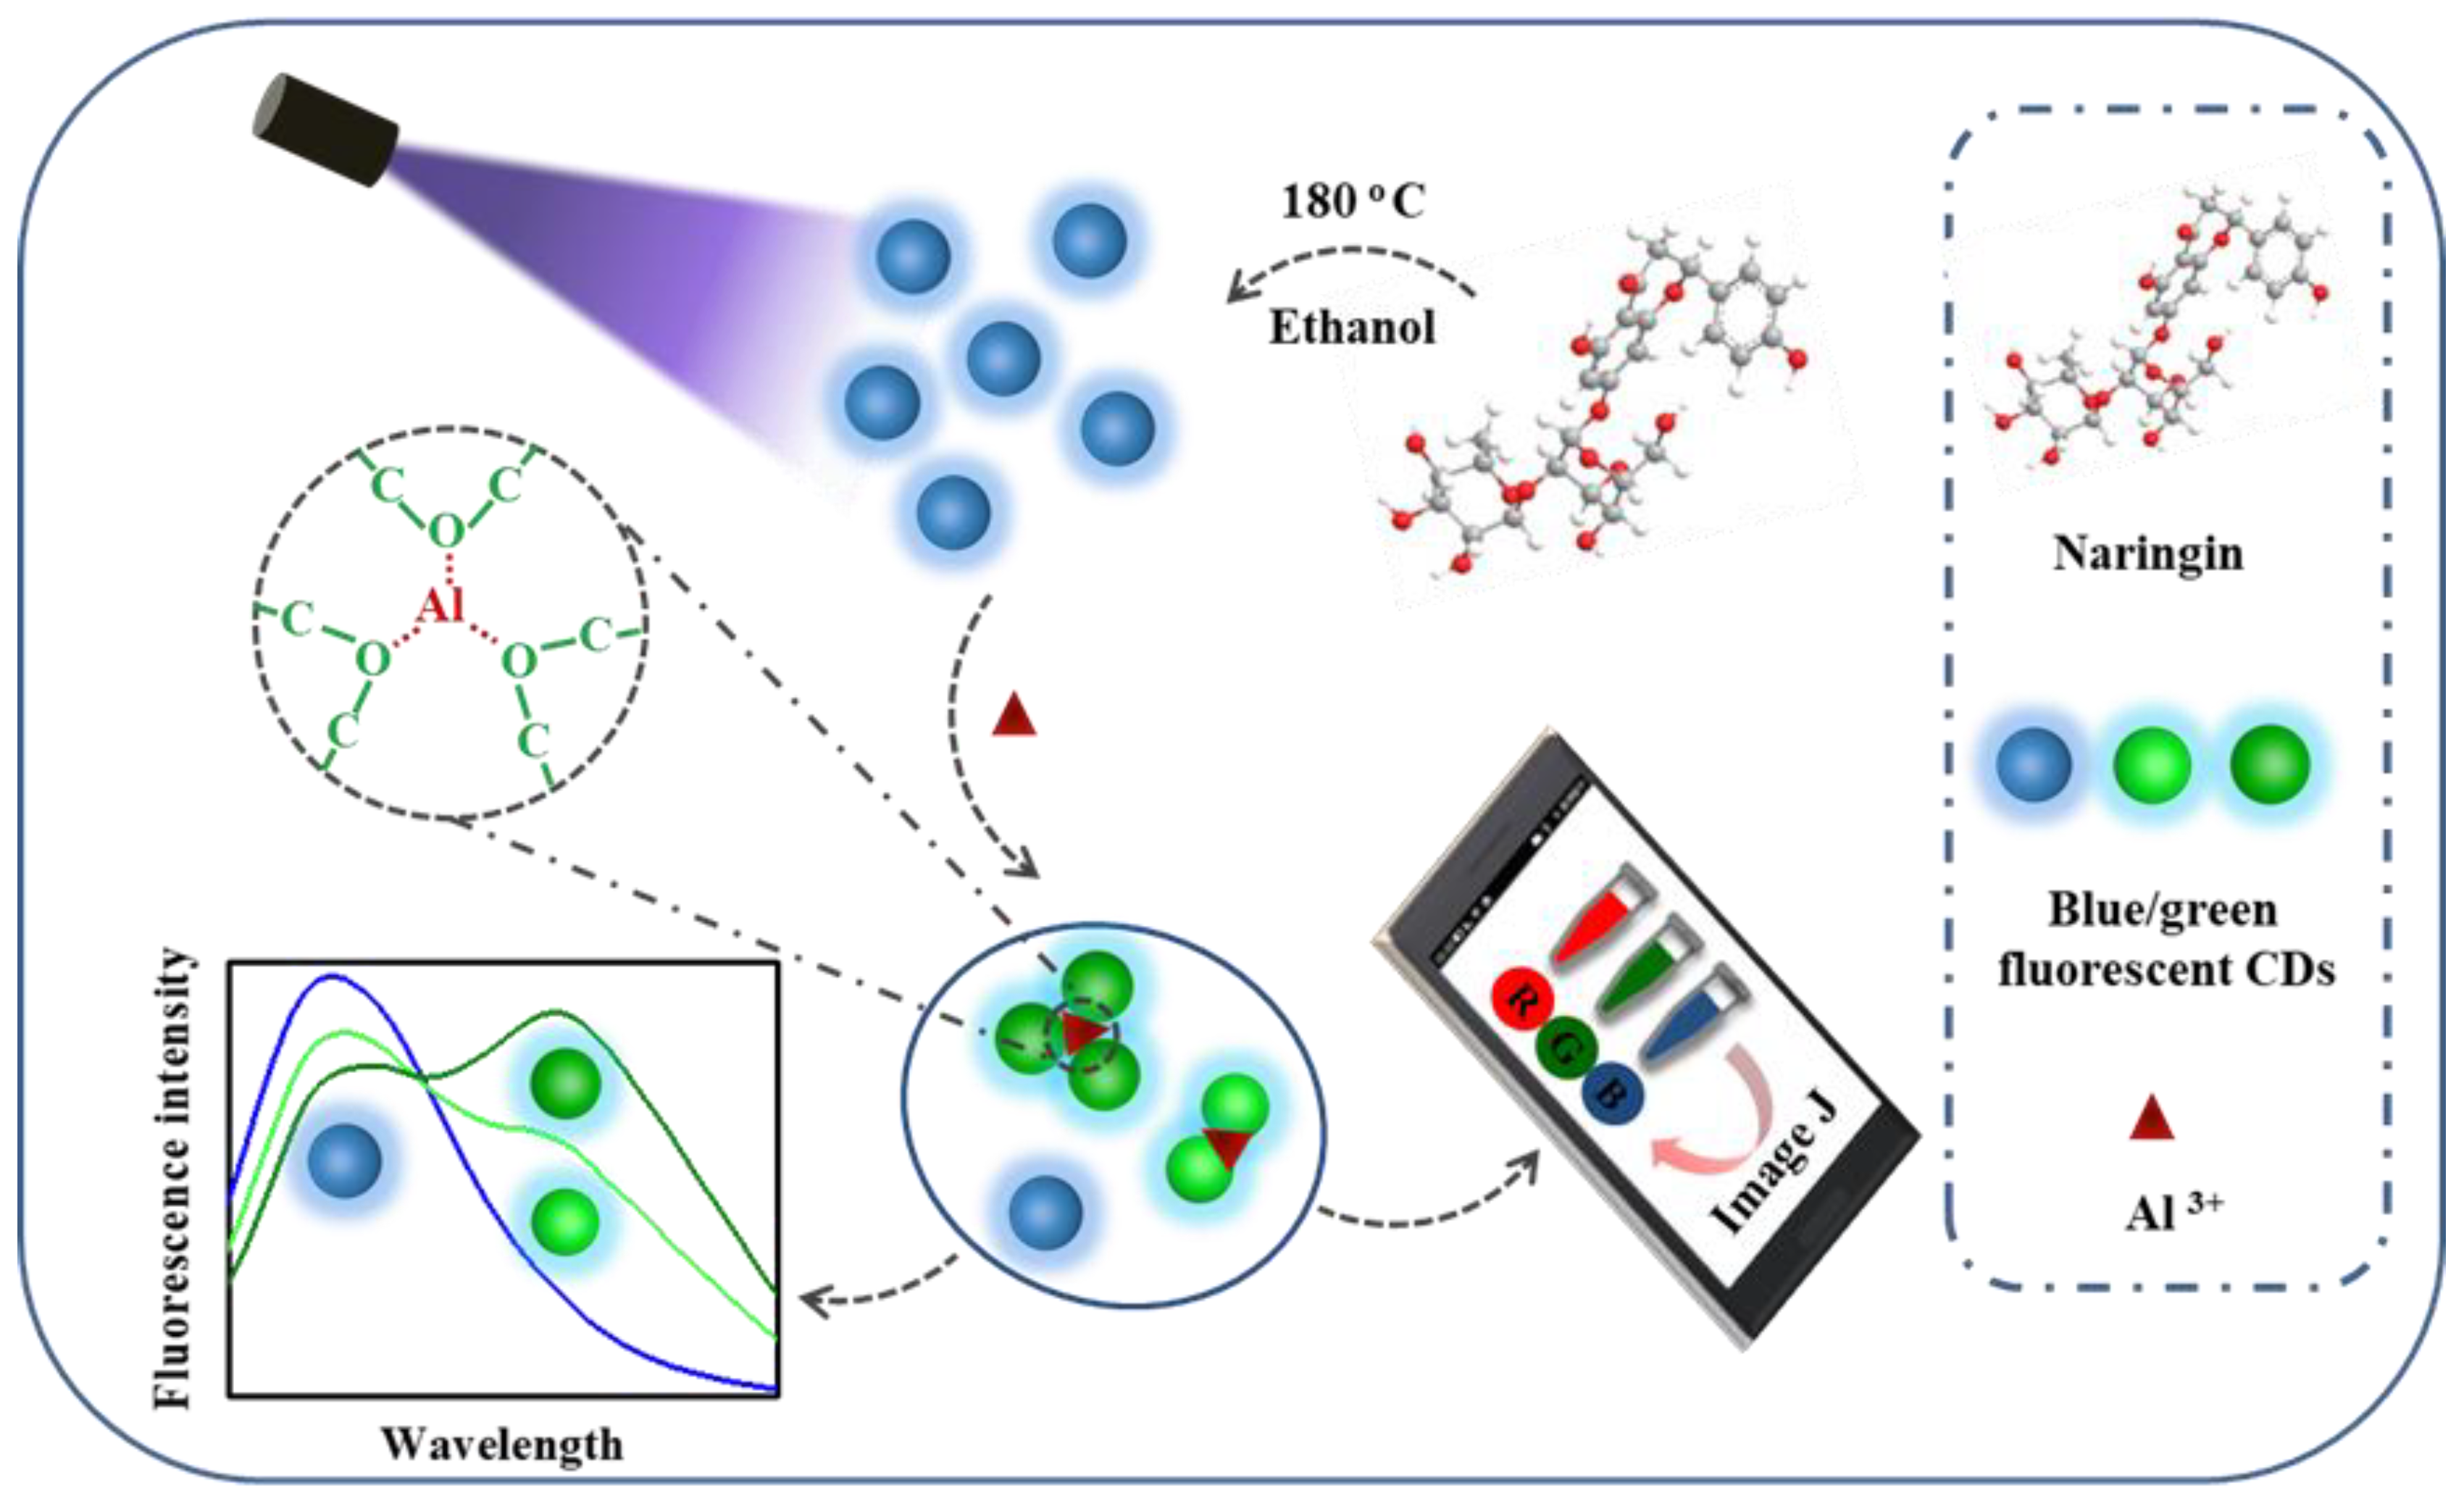
2.3. Preparation of the CDs

The CDs were prepared via the solvothermal method using naringin as the precursor in an ethanol solution. Briefly, 0.02 mmol of naringin were dissolved in 5 mL of ethanol. Then, the mixed solution was heated in a Teflon-lined stainless-steel autoclave at 180 °C for 2 h. The resulting solution was centrifuged at 10,000 rpm for 10 min to remove the large particles. The solvent ethanol was evaporated via rotary evaporation technology, and then appropriate water was added to re-dissolve the CDs. The CDs aqueous solution was purified by using a filter membrane (0.22 μm) and then freeze-dried. To ensure the repeatability and accuracy of the results, 0.1 mg/mL of CDs were used during the whole experiment.

2.4. Determination of Al3+

For a typical fluorescent assay, 20 μL aliquots of Al3+ solution with different concentrations were mixed with 500 μL of a 0.1 mg/mL CDs solution at pH 5.0. After the solution reacted for 10 min at room temperature, the fluorescence measurements were performed, but the fluorescence intensity was collected after the detection solution was illuminated for 15 min under a 360 nm excitation source. For the RGB detection assay, the mixture samples were pre-excited for 15 min via a 360 nm UV lamp, and then a series of color fluorescence photos were obtained using a smartphone. Image J was used to split the information of the fluorescence photos into blue (B), green (G), and red (R) channel photos via the split channel menu commands. Then, the G/B values were chosen to detect the Al3+. To test the selectivity of such CDs-based assay, 20 μL of solution with a constant concentration of different metal ions (Ag+, Al3+, Ca2+, Cd2+, Co2+, Cr3+, Cu2+, Fe2+, Fe3+, Hg2+, K+, Mg2+, Na+, Ni2+, Zn2+, Pb2+, and As3+) and small molecule (glycine, serine, L-threoine, L-glutamic, L-alanine, L-aspartic, glucose, glutathione, Vitamin C, urea, humic acid, and fulvic acid) were examined via the same procedure. Further, the anti-interference of the CDs-based sensor was also explored in the presence of Al3+ and different small molecules (glycine, serine, L-threoine, L-glutamic, L-alanine, L-aspartic, glucose, glutathione, vitamin C, urea, humic acid, and fulvic acid) and the mixture of above 12 kinds of small molecules.

2.5. Analysis of Spiked Water Sample

To verify the reliability of the CDs-based probe, samples of tap water from the laboratory and lake water from the Liuyang lake (Hunan, China) were collected. After having filtered them through a 0.22 μm membrane, different concentrations of Al3+ were added to the samples. The concentrations were detected using the fluorescent assay and the RGB assay based on the CDs-based probe under the optimized condition.

3. Results and Discussion

3.1. Characterization of the CDs

CDs were synthesized from naringin in ethanol. Like most fluorescent dyes, CDs have the self-quenching effect (concentration quenching) [36]. When its concentration is large, the interaction between adjacent CDs causes the decrease of fluorescence intensity and a red shift of the fluorescence emission spectrum [37,38]. As shown in Figure S1 (Supplementary Materials), although the fluorescence intensity of CDs with a concentration of 0.2 mg/mL is the highest, there is an obvious red-shift in the fluorescence emission peak of CDs. Therefore, 0.1 mg/mL CDs were selected for the subsequent experiments to ensure the effective and accurate fluorescence properties of CDs.
Both the UV-vis absorption spectra and the fluorescence spectra (Figure 2A) were investigated. The absorption spectra of the CDs exhibit two peaks centered at 270 nm and 340 nm, which probably correspond to the π-π* transition of the C=C bond and to the n-π* transition of the C=O bond, respectively [39]. When excited at 360 nm, the maximum intensity of the emission appears at 420 nm and show a high quantum yield (QY) (28.33 ± 0.52%) using quinine sulfate as the reference. The CDs also exhibit an excitation-dependent property (Figure 2B), which probably results from the size distribution and the surface states of the CDs [22,40,41]. As the excitation wavelength increases from 300 nm to 400 nm, the CDs fluorescence emission shows a red-shift of approximately 100 nm, which is followed by the decrease in the fluorescence intensity. As shown in Figure 2C, the CDs fluorescence is affected by the pH, but it is stable in the 4.0–9.0 range. Moreover, after being irradiated with a 360 nm UV light, the fluorescence of CDs increases within 15 min, and then remains stable for 3 h (Figure S2), which indicates that CDs have higher photobleaching-resistance. This photo-enhancement effect induced by the irradiation of UV/Vis light is called as “photoactivation”. This phenomenon was first discovered in semiconductor quantum dots (QD), and has been widely studied in the past few decades [42]. Due to the similar properties of CDs with QDs, the photoactivation property of CDs has been studied as well by many groups [43,44]. It is noting that the functional groups (C–O–C, C=C, –C=O, and –OH) of CD from naringin in our work are slightly reduced after UV light irradiation (Figure S3), that are similar with the Li’s report [44]. Therefore, we speculate that the photoactivation property of CDs from naringin may also result from the intrinsic states of CDs. Notably, this fluorescence property of CDs from naringin is proved to be irreversible within 12 h (Figure S4). This indicates that the CDs have stable fluorescence properties, after being irradiated by the UV lamp for 15 min, no matter if they continue to be irradiated by UV lamp or kept away from UV lamp. Therefore, the CDs probe needs pre-excitation for 15 min once for the subsequent accurate fluorescence experiment.
The morphology and the size of the CDs were characterized via TEM (Figure S5A). The CDs are approximately spherical and exhibit an average diameter of 1.17 ± 0.13 nm. Their size distribution is narrow according to the statistically analyzed results from more than 100 individual nanoparticles. The FTIR spectra were detected to identify the surface functional groups of the CDs. As shown in Figure 2D, the peaks at 1385 cm−1, 1520 cm−1, 1694 cm−1, and 3034–3476 cm−1 correspond to the stretching vibrations of the C–O–C, C=C, –C=O, and –OH groups, respectively [45], suggesting the presence of the ether, hydroxyl, and carboxyl groups on the surface of the CDs. These functional groups improve the water solubility of the CDs. The XRD pattern (Figure S6A) of the CDs shows no obvious crystal lattice, suggesting that the sample has an amorphous structure. The XPS analysis shows that CDs have two peaks at 285.1 eV and 532.1 eV, corresponding to C 1s and O 1s, respectively (Figure S6B). The type of bond is further explored through high-resolution XPS analysis (Figure S6C,D). The high-resolution C1s peak at 284.3 eV, 285.7 eV, 287.2 eV, and 289.0 eV are attributed to the C=C, C–O–C, C–C, and C=O bond, while the three peaks at 532.3 eV, 533.2 eV, and 534.2 eV in the high-resolution O1s peak spectrum correspond to the C=O, C–O–C, and –OH bond, respectively [23,41]. Therefore, the CDs are composed of carbon, oxygen, and hydrogen. The calculated zeta potential of the CDs was measures −11.20 ± 0.21 mV, implying that the CDs are negatively charged (Figure S7).

3.2. Detection Mechanism

As shown in Figure 1, blue fluorescent CDs with a 420 nm emission peak were synthesized from the naringin via the one-pot solvothermal method. In the presence of Al3+, a new peak appears at 500 nm due to the close proximity of adjacent CDs mediated by Al3+, which probably increase the conjugated π systems. This results in the red-shift of the fluorescence spectra. The ratiometric fluorescence data were obtained by monitoring the changes in the fluorescence spectra at 420 nm and 500 nm. Moreover, a fluorescence-based colorimetric assay was also prepared for the visual detection of Al3+ based on the analysis of the color information changes, which were monitored by a smartphone.
To confirm the interaction between the CDs and Al3+, both the TEM and the FTIR spectra were collected. As shown in Figure S5B, the distance between some CDs is close upon the addition of 7.69 mM Al3+, followed with an increase in average diameter from 1.17 ± 0.13 nm of CDs to 1.79 ± 0.56 nm of CDs-Al3+.This is the result of the chelation effect between metal ions and the surface groups of CDs [22,45].The FTIR measurement was carried out to identify the chemical groups changes on the surface of the CDs (Figure S8). As the concentration of the Al3+ increases in the 0–7.69 mM range, the increase in the absorption of the C–O–C band (1385 cm−1) suggests that Al3+ interacts with the C–O–C bond on the surface of the CDs [46]. These CDs in the complex are close to each other, which not only increases the local concentration of CDs [38,47], but also increases the extension of the conjugated π system [24,48], thereby inducing a red-shift in the fluorescence spectra. Therefore, one can speculate that the generation of the green fluorescence of the CDs arises from the coordination of the Al3+ ions and the C–O–C bond on the surface of the CDs. Moreover, the zeta potential of the CDs increases from −11.20 ± 0.21 mV to 24.04 ± 0.18 mV upon the addition of 7.69 mM of Al3+, which further indicates that Al3+ interacts with the CDs (Figure S7).

3.3. Effect of the pH on the Detection of Al3+

It is noted that the Al(III) in natural water would hydrolyze and absorb/co-coagulate with other matter, when the pH of solution is alkaline. However, there is an ion form for the Al(III) in the acidic solution [49]. Therefore, the pH of detection probes is the key factor for successful performance of the strategy. As shown in Figure S9, the ratio of I500/I420 for the CDs in the presence of Al3+ could remain stable at the pH range from 4.0 to 9.0. Considering that the high acid is unrealistic in natural water, as well as the pH changes of different concentration of Al(NO3)3 solution (Figure S10), we selected pH 5.0 in the subsequent studies.

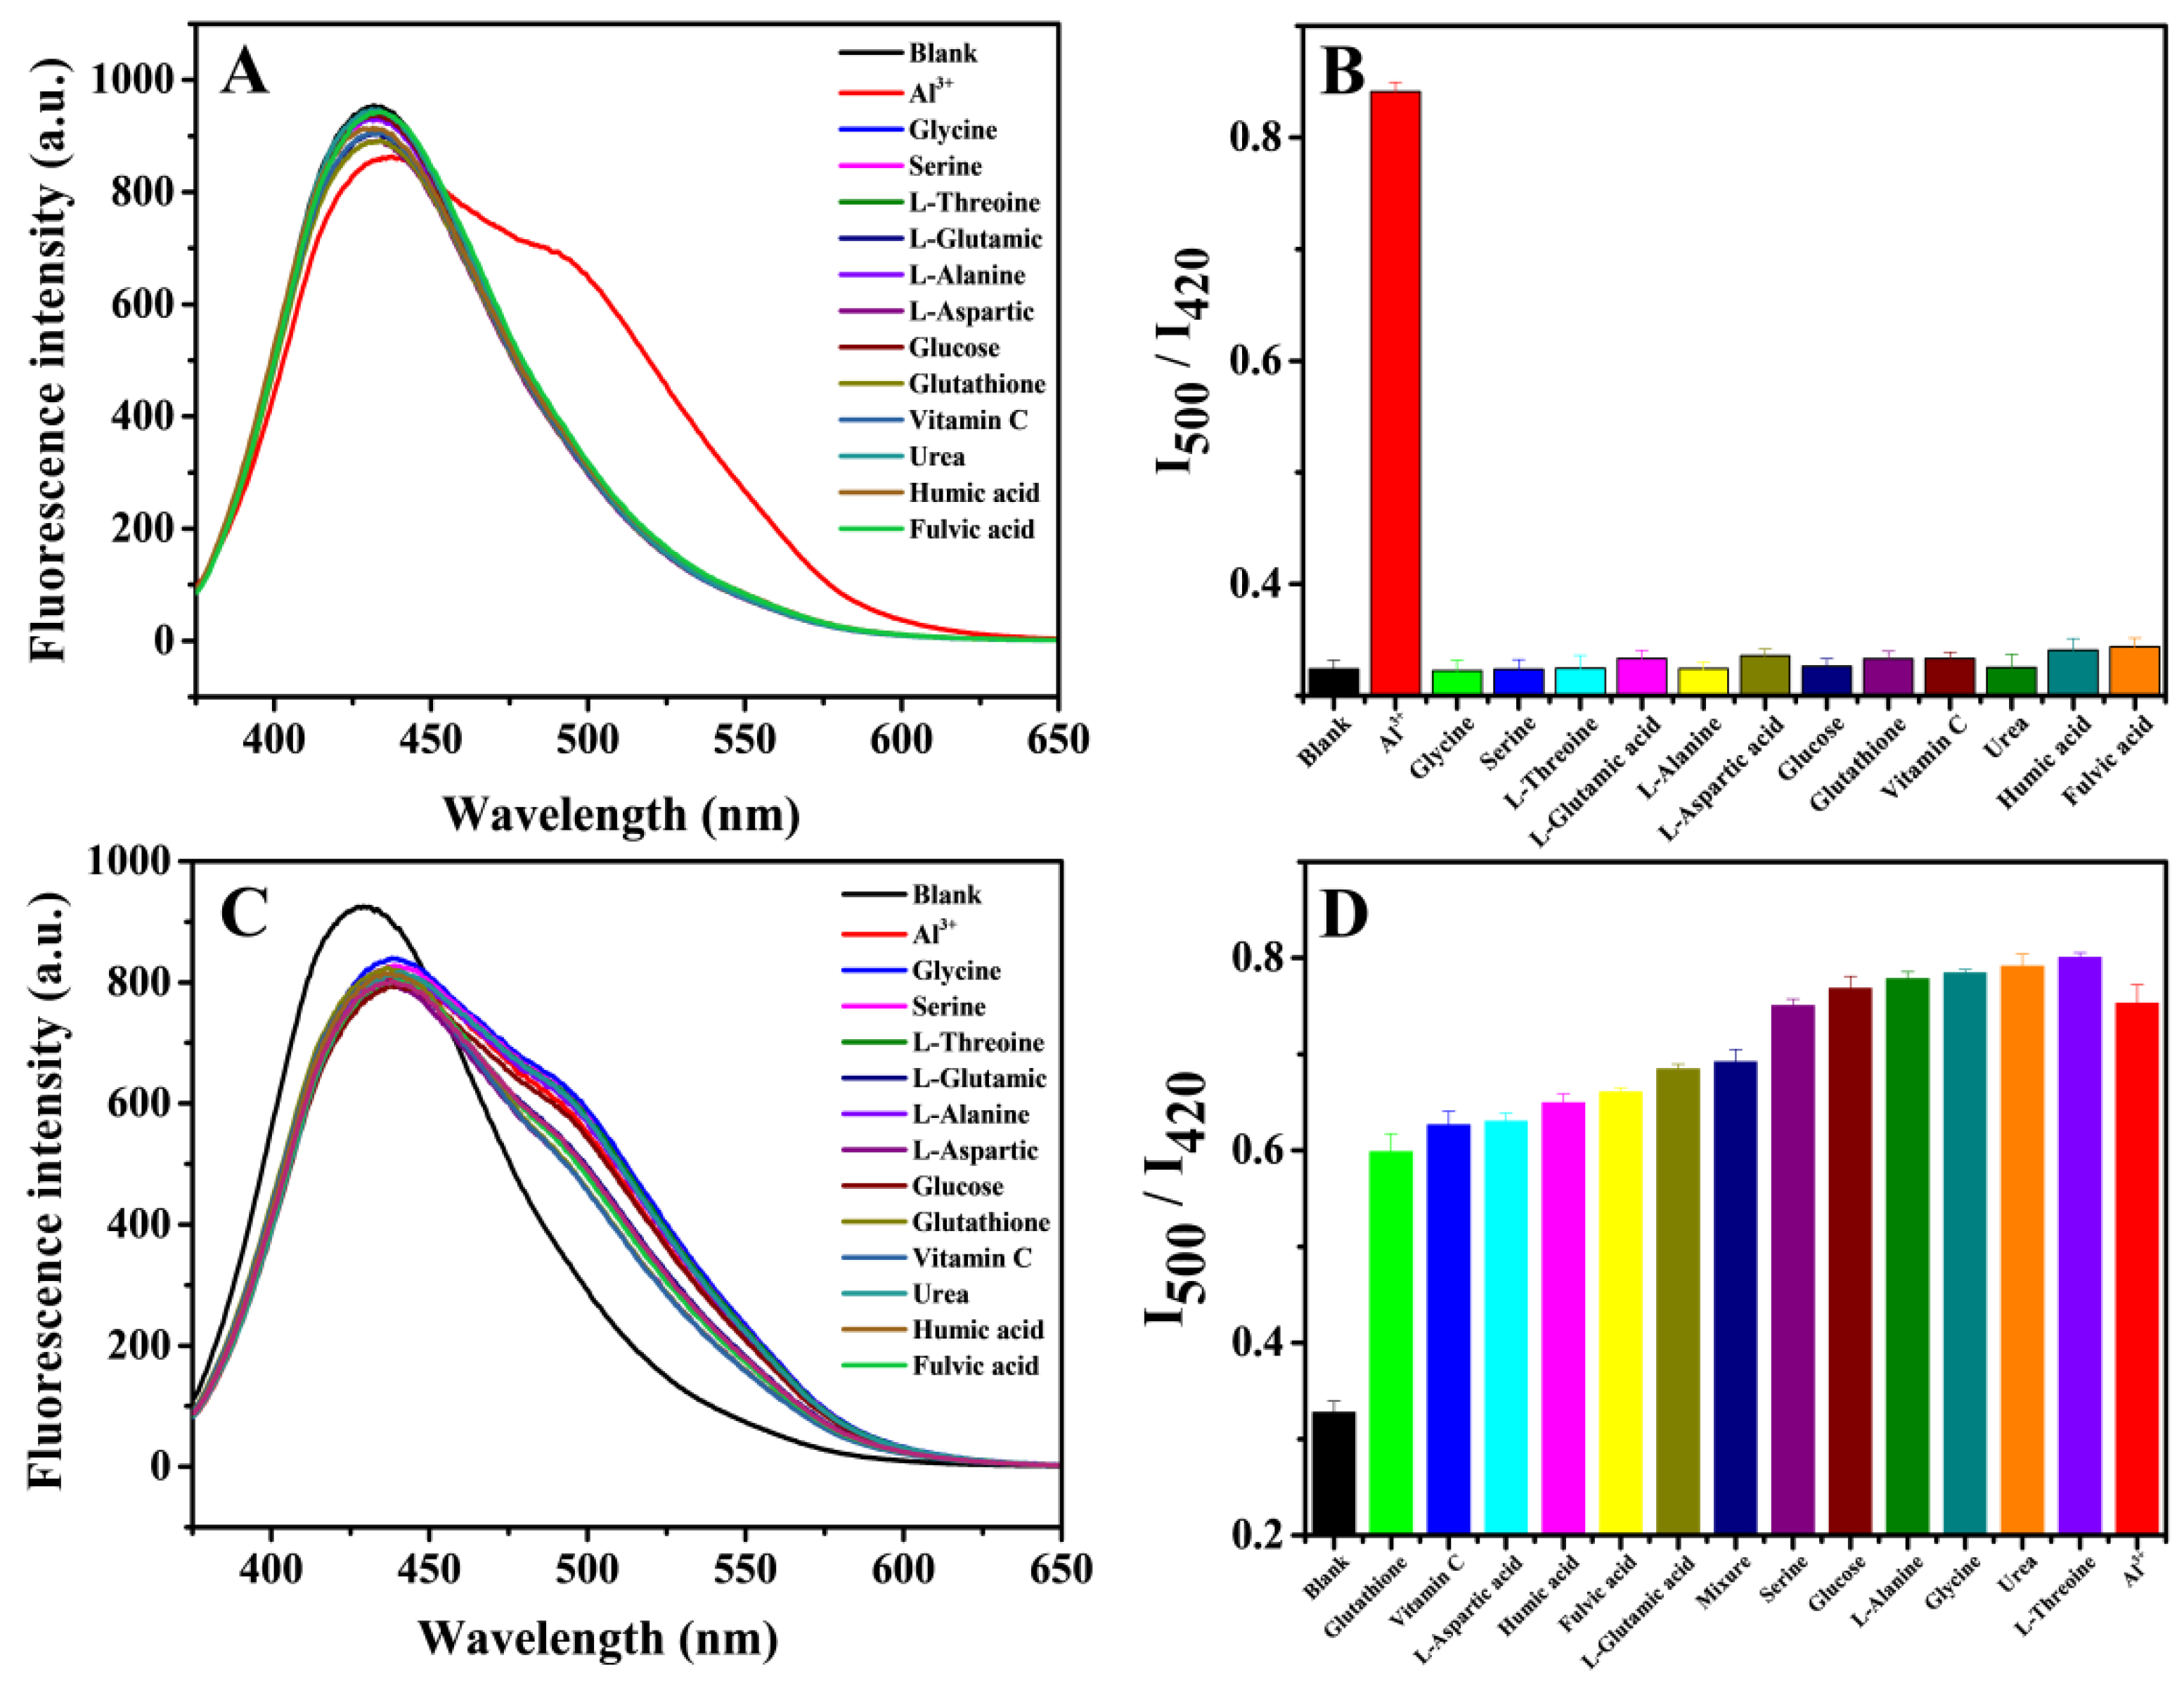
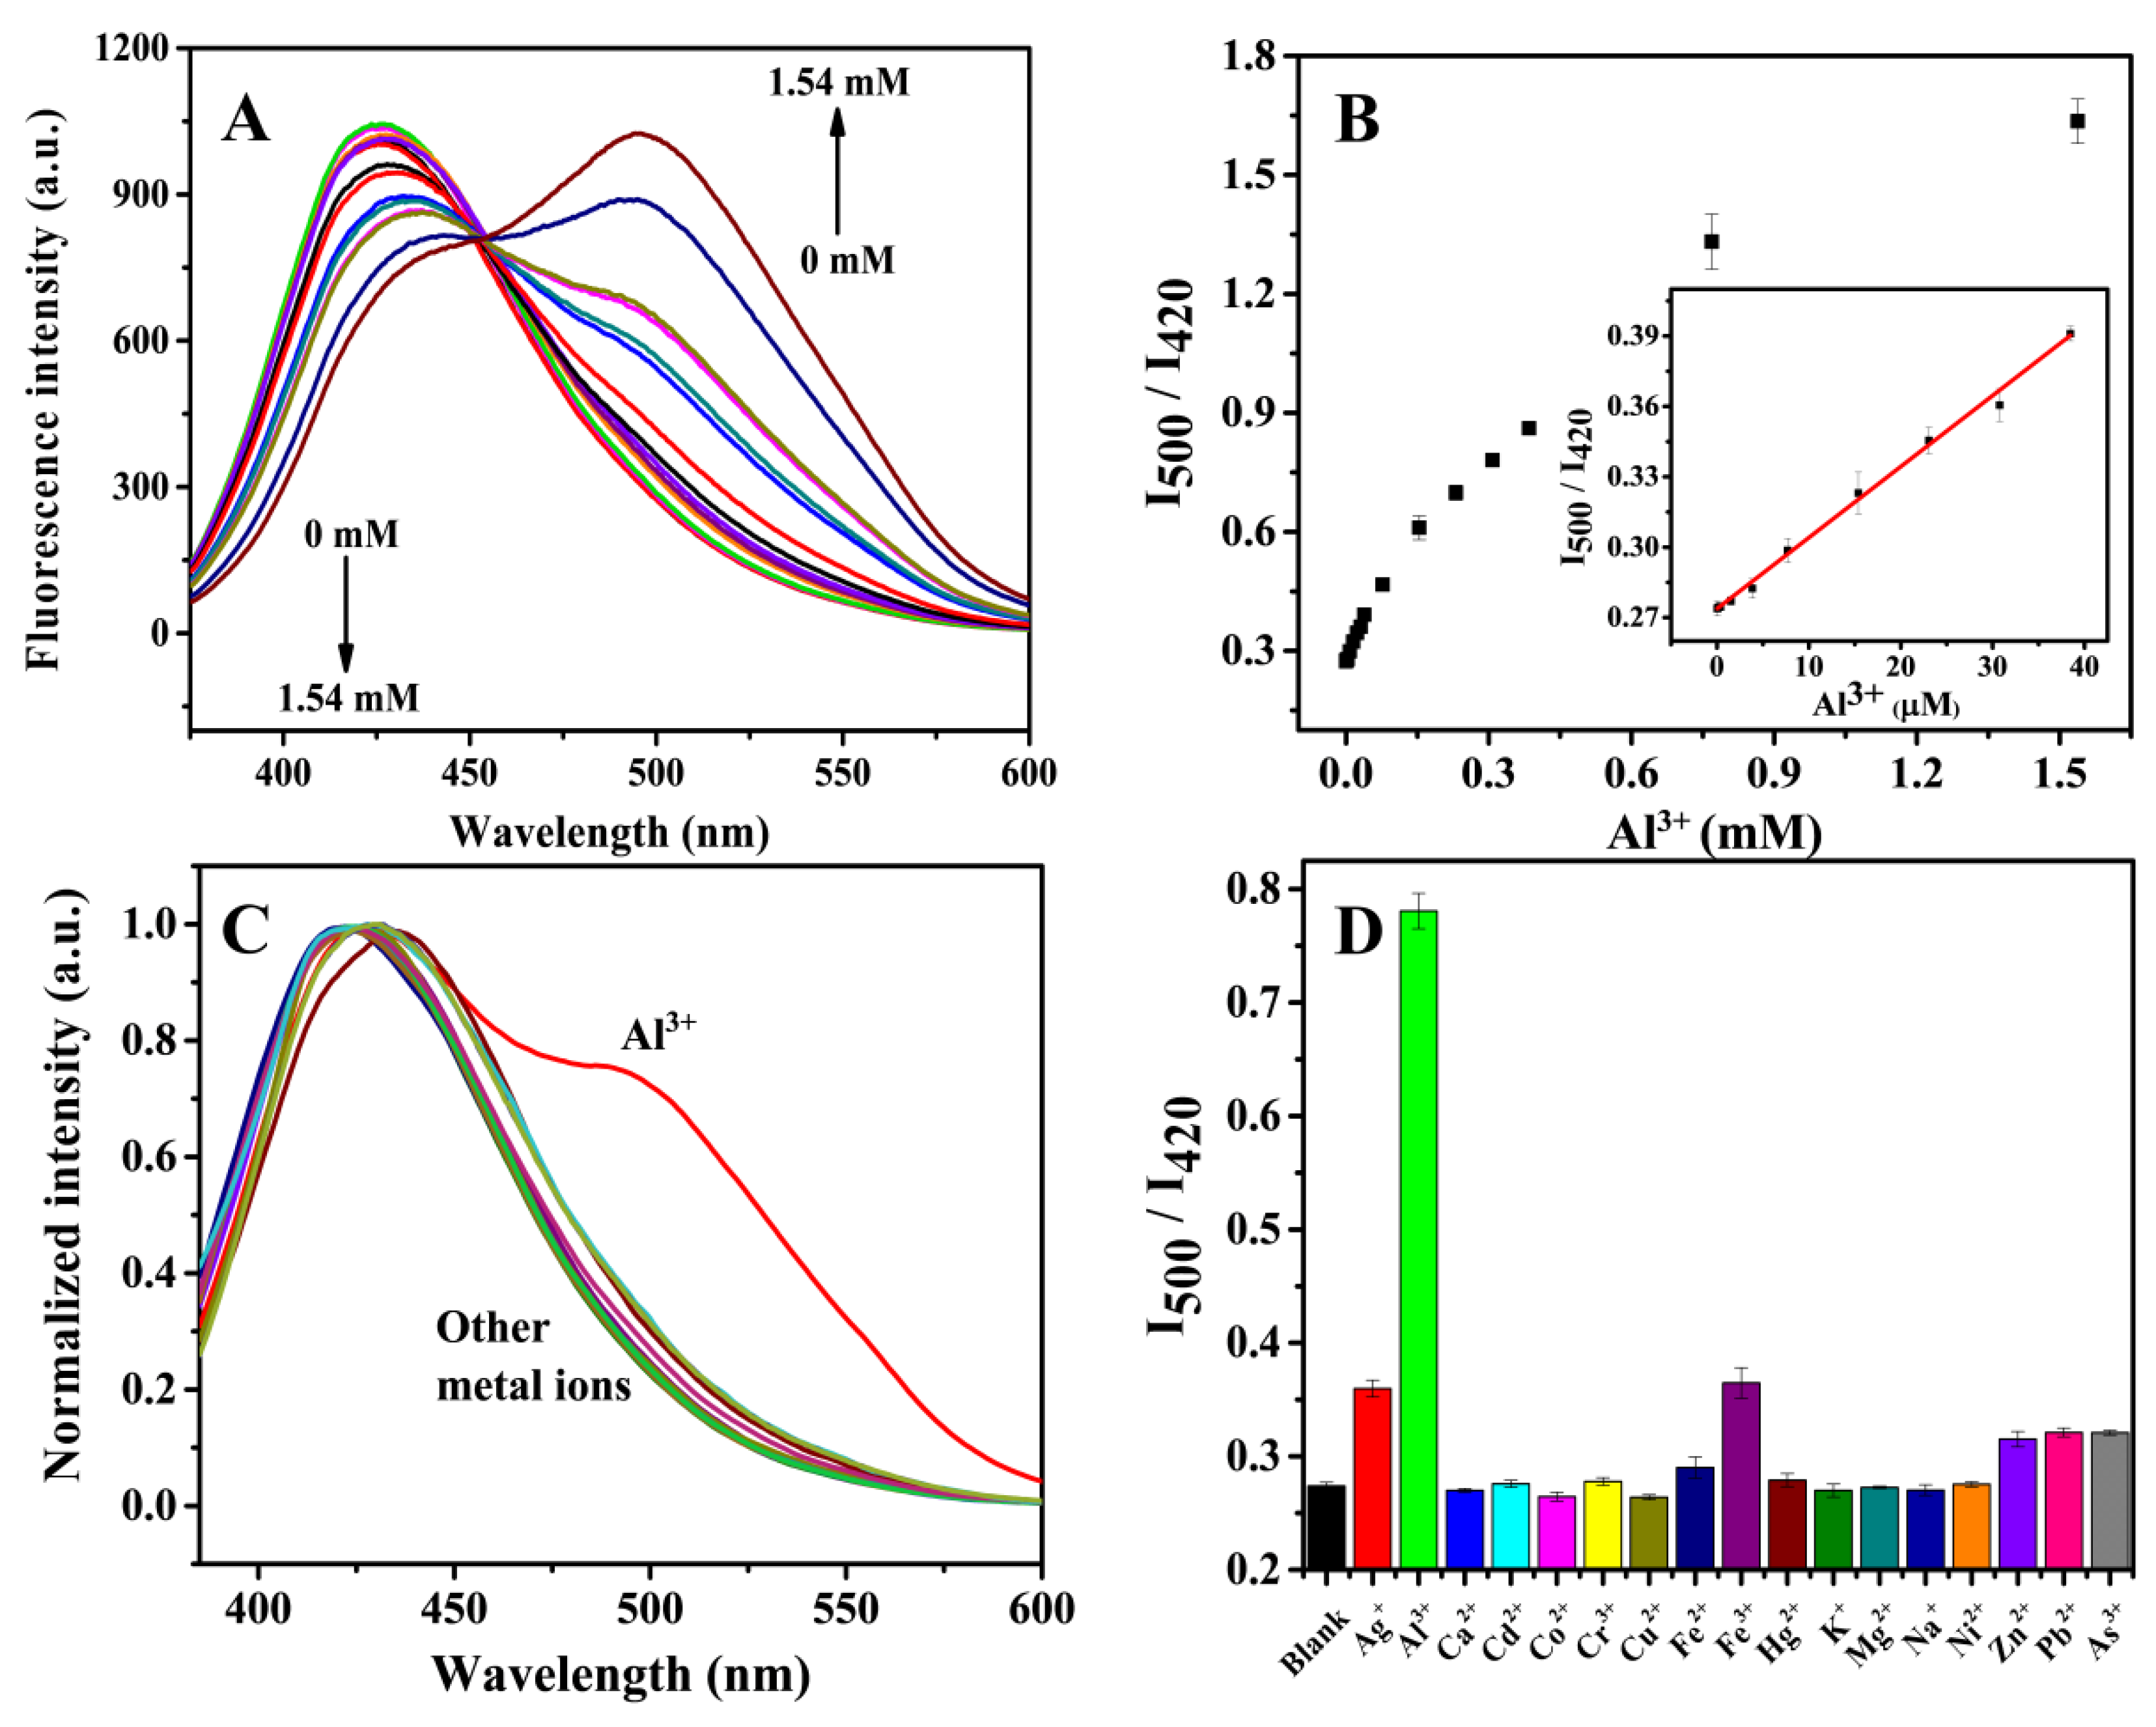
3.4. Fluorescence Detection of Al3+

Since the oxygen-containing groups on the surface of the CDs interact with the metal ions [50], the reliability of the CDs in the Al3+ detection was explored. As show in Figure 3A, the fluorescence of the CDs at 420 nm decreases gradually, whereas the fluorescence emission peak at 500 nm appears upon the addition of Al3+. The fluorescence intensity ratio (I500/I420) was used to investigate the sensitivity of the CDs probe for Al3+ (Figure 3B). Upon the increase in the concentration of Al3+ from 0 to 1.54 mM, the linear relation the concentration in the 0.15–38.46 μM range (R2 = 0.9960) was obtained by plotting the I500/I420 ratio as a function of the Al3+ concentration. The limit of detection (LOD) measures 113.8 nM based on the 3δ/slope calculation. This value is much lower than the one reported for the maximum amount of drinking water specified by the WHO (7.41 μM) and is comparable to that of other reported investigations (Table S1).
To evaluate the specificity of the CDs-based sensor in detecting Al3+, the effect of other metal ions and small molecule was investigated. Figure 3C shows that only Al3+ fosters the generation of the fluorescence emission peak at 500 nm, contrarily to other metal ions (Ag+, Ca2+, Cd2+, Co2+, Cr3+, Cu2+, Fe2+, Fe3+, Hg2+, K+, Mg2+, Na+, Ni2+, Zn2+, Pb2+, and As3+). The I500/I420 ratio is considerably higher than that of other metal ions and of the blank sample (Figure 3D). In addition, the effect of 12 kinds of small molecules (glycine, serine, L-threoine, L-glutamic, L-alanine, L-aspartic, glucose, glutathione, vitamin C, urea, fulvic acid, and humic acid) on Al3+ detection is also negligible (Figure 4A,B). These data indicate that the CDs-based fluorescent sensor is highly selective in detecting Al3+. Furthermore, the anti-interference of the sensor is satisfactory in the detection of Al3+ in real samples towards the common interferers or the mixture of interferers (Figure 4C,D).

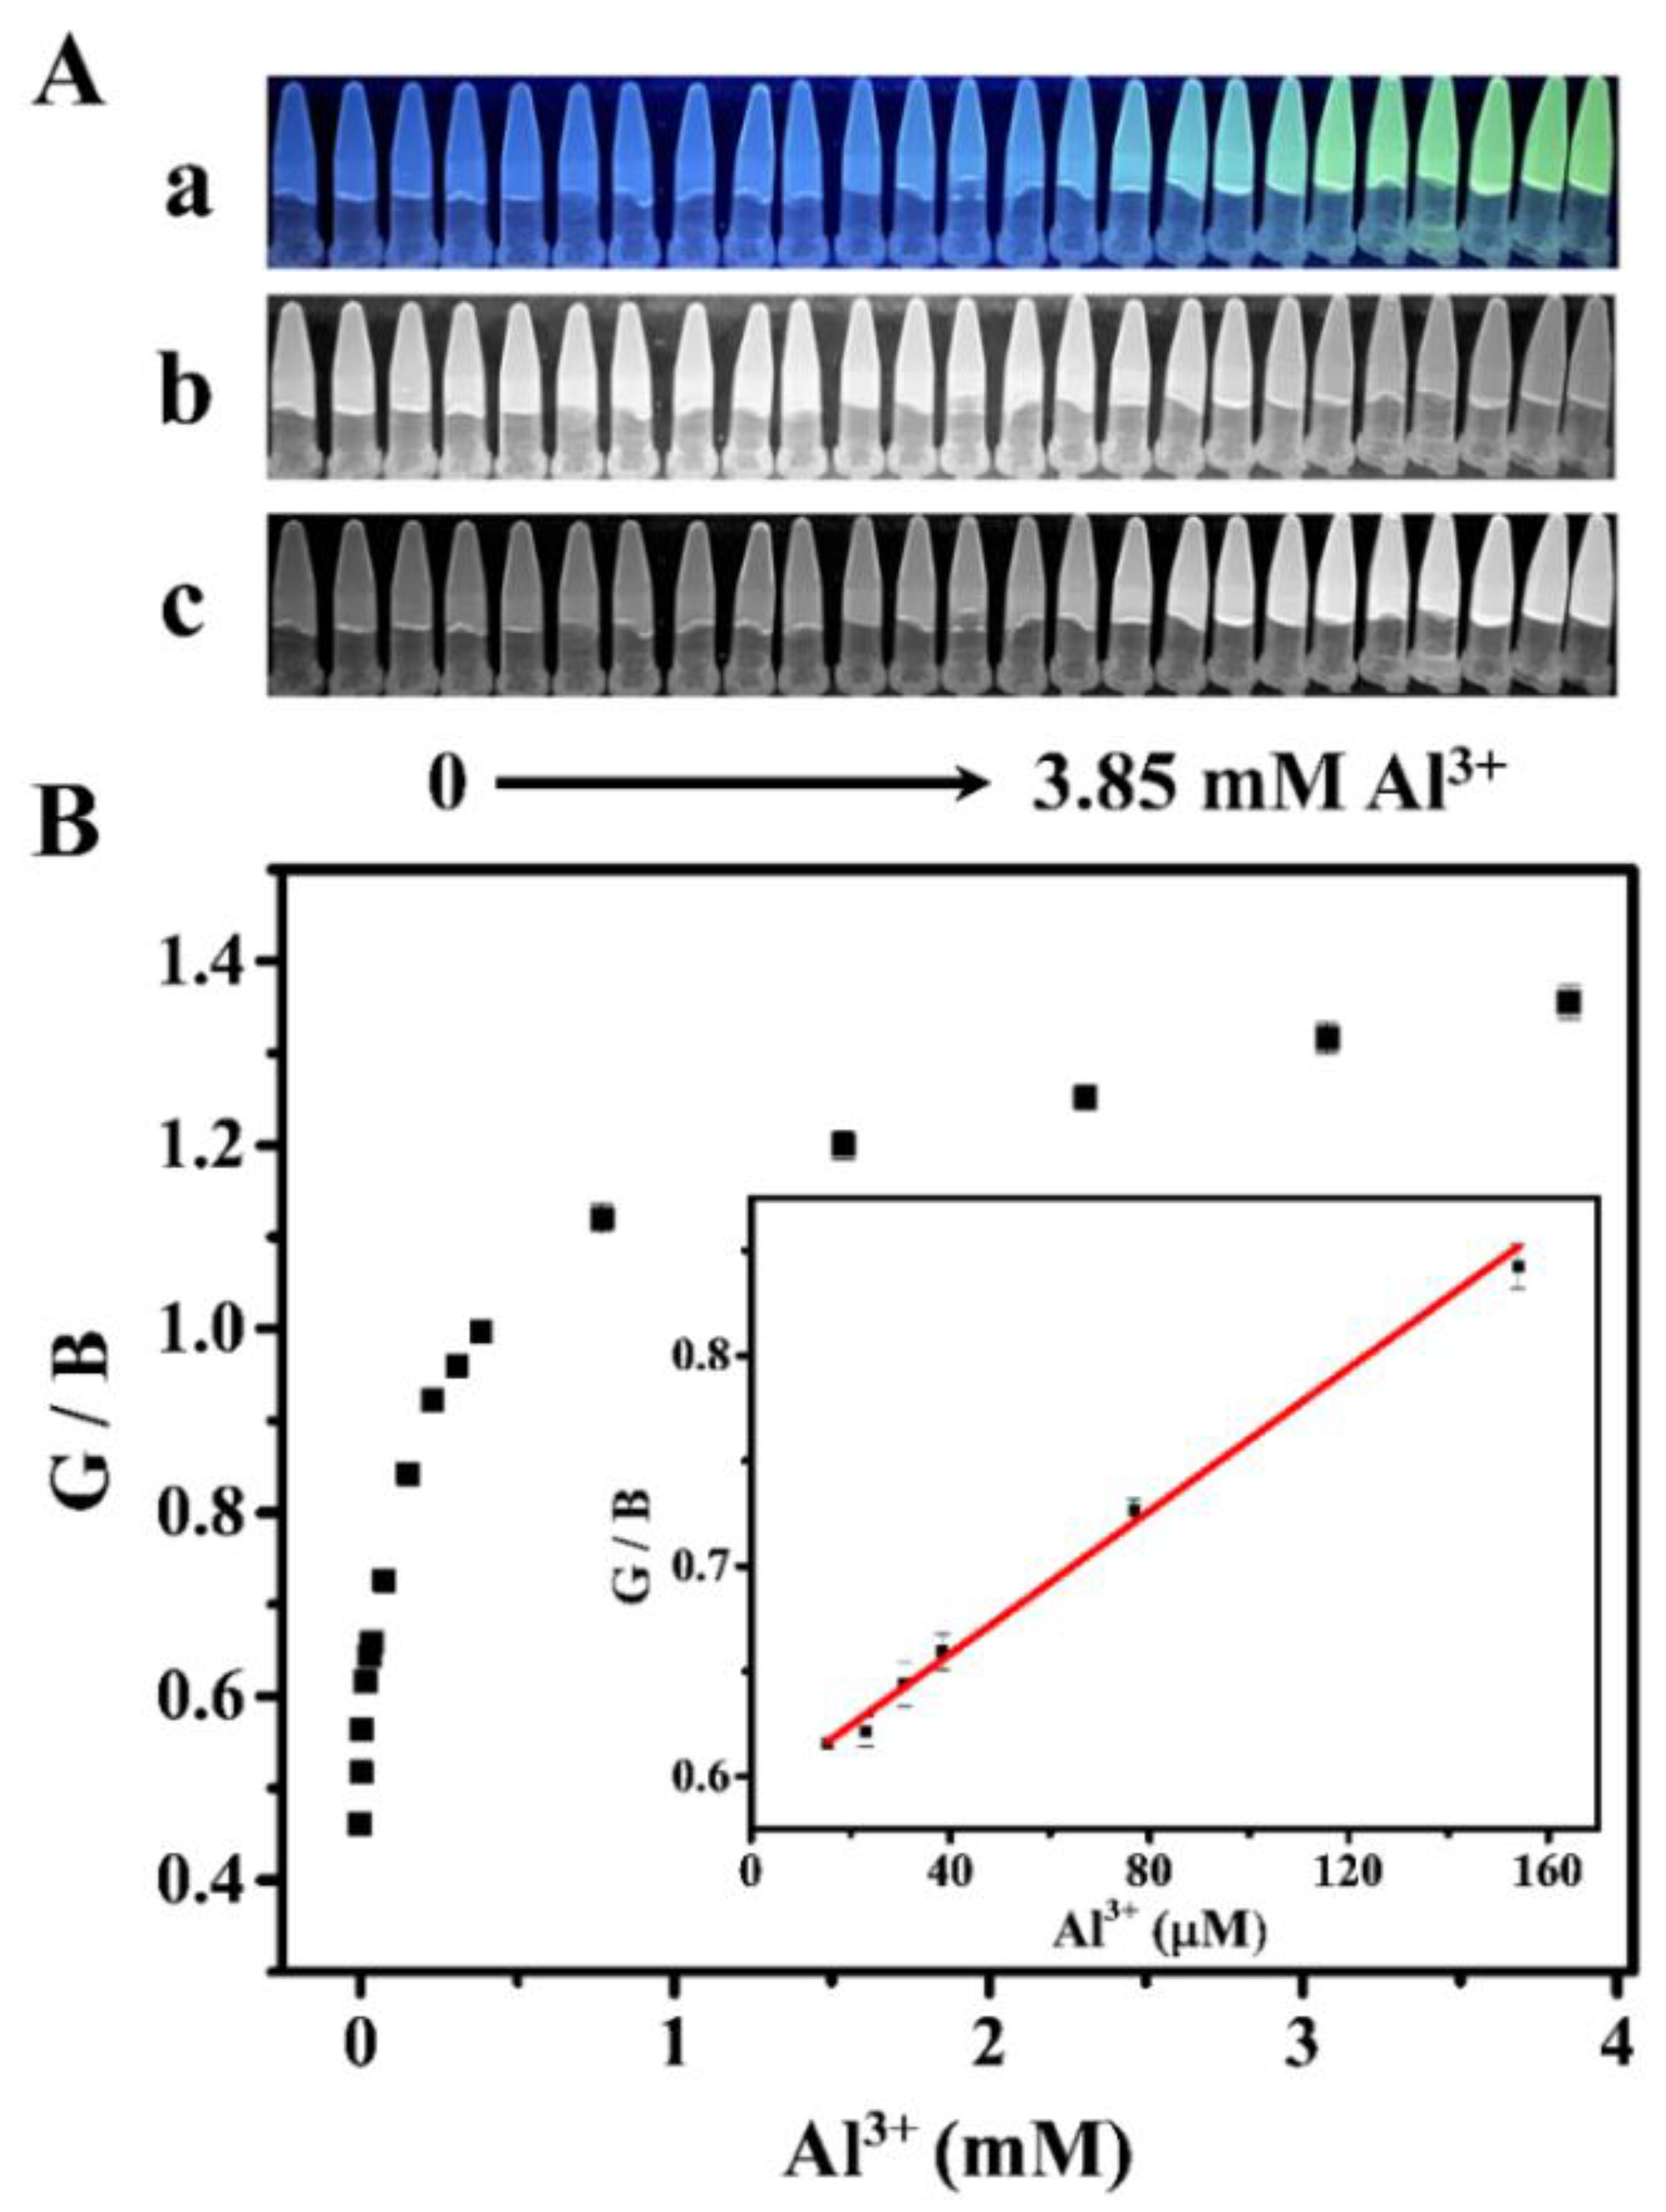
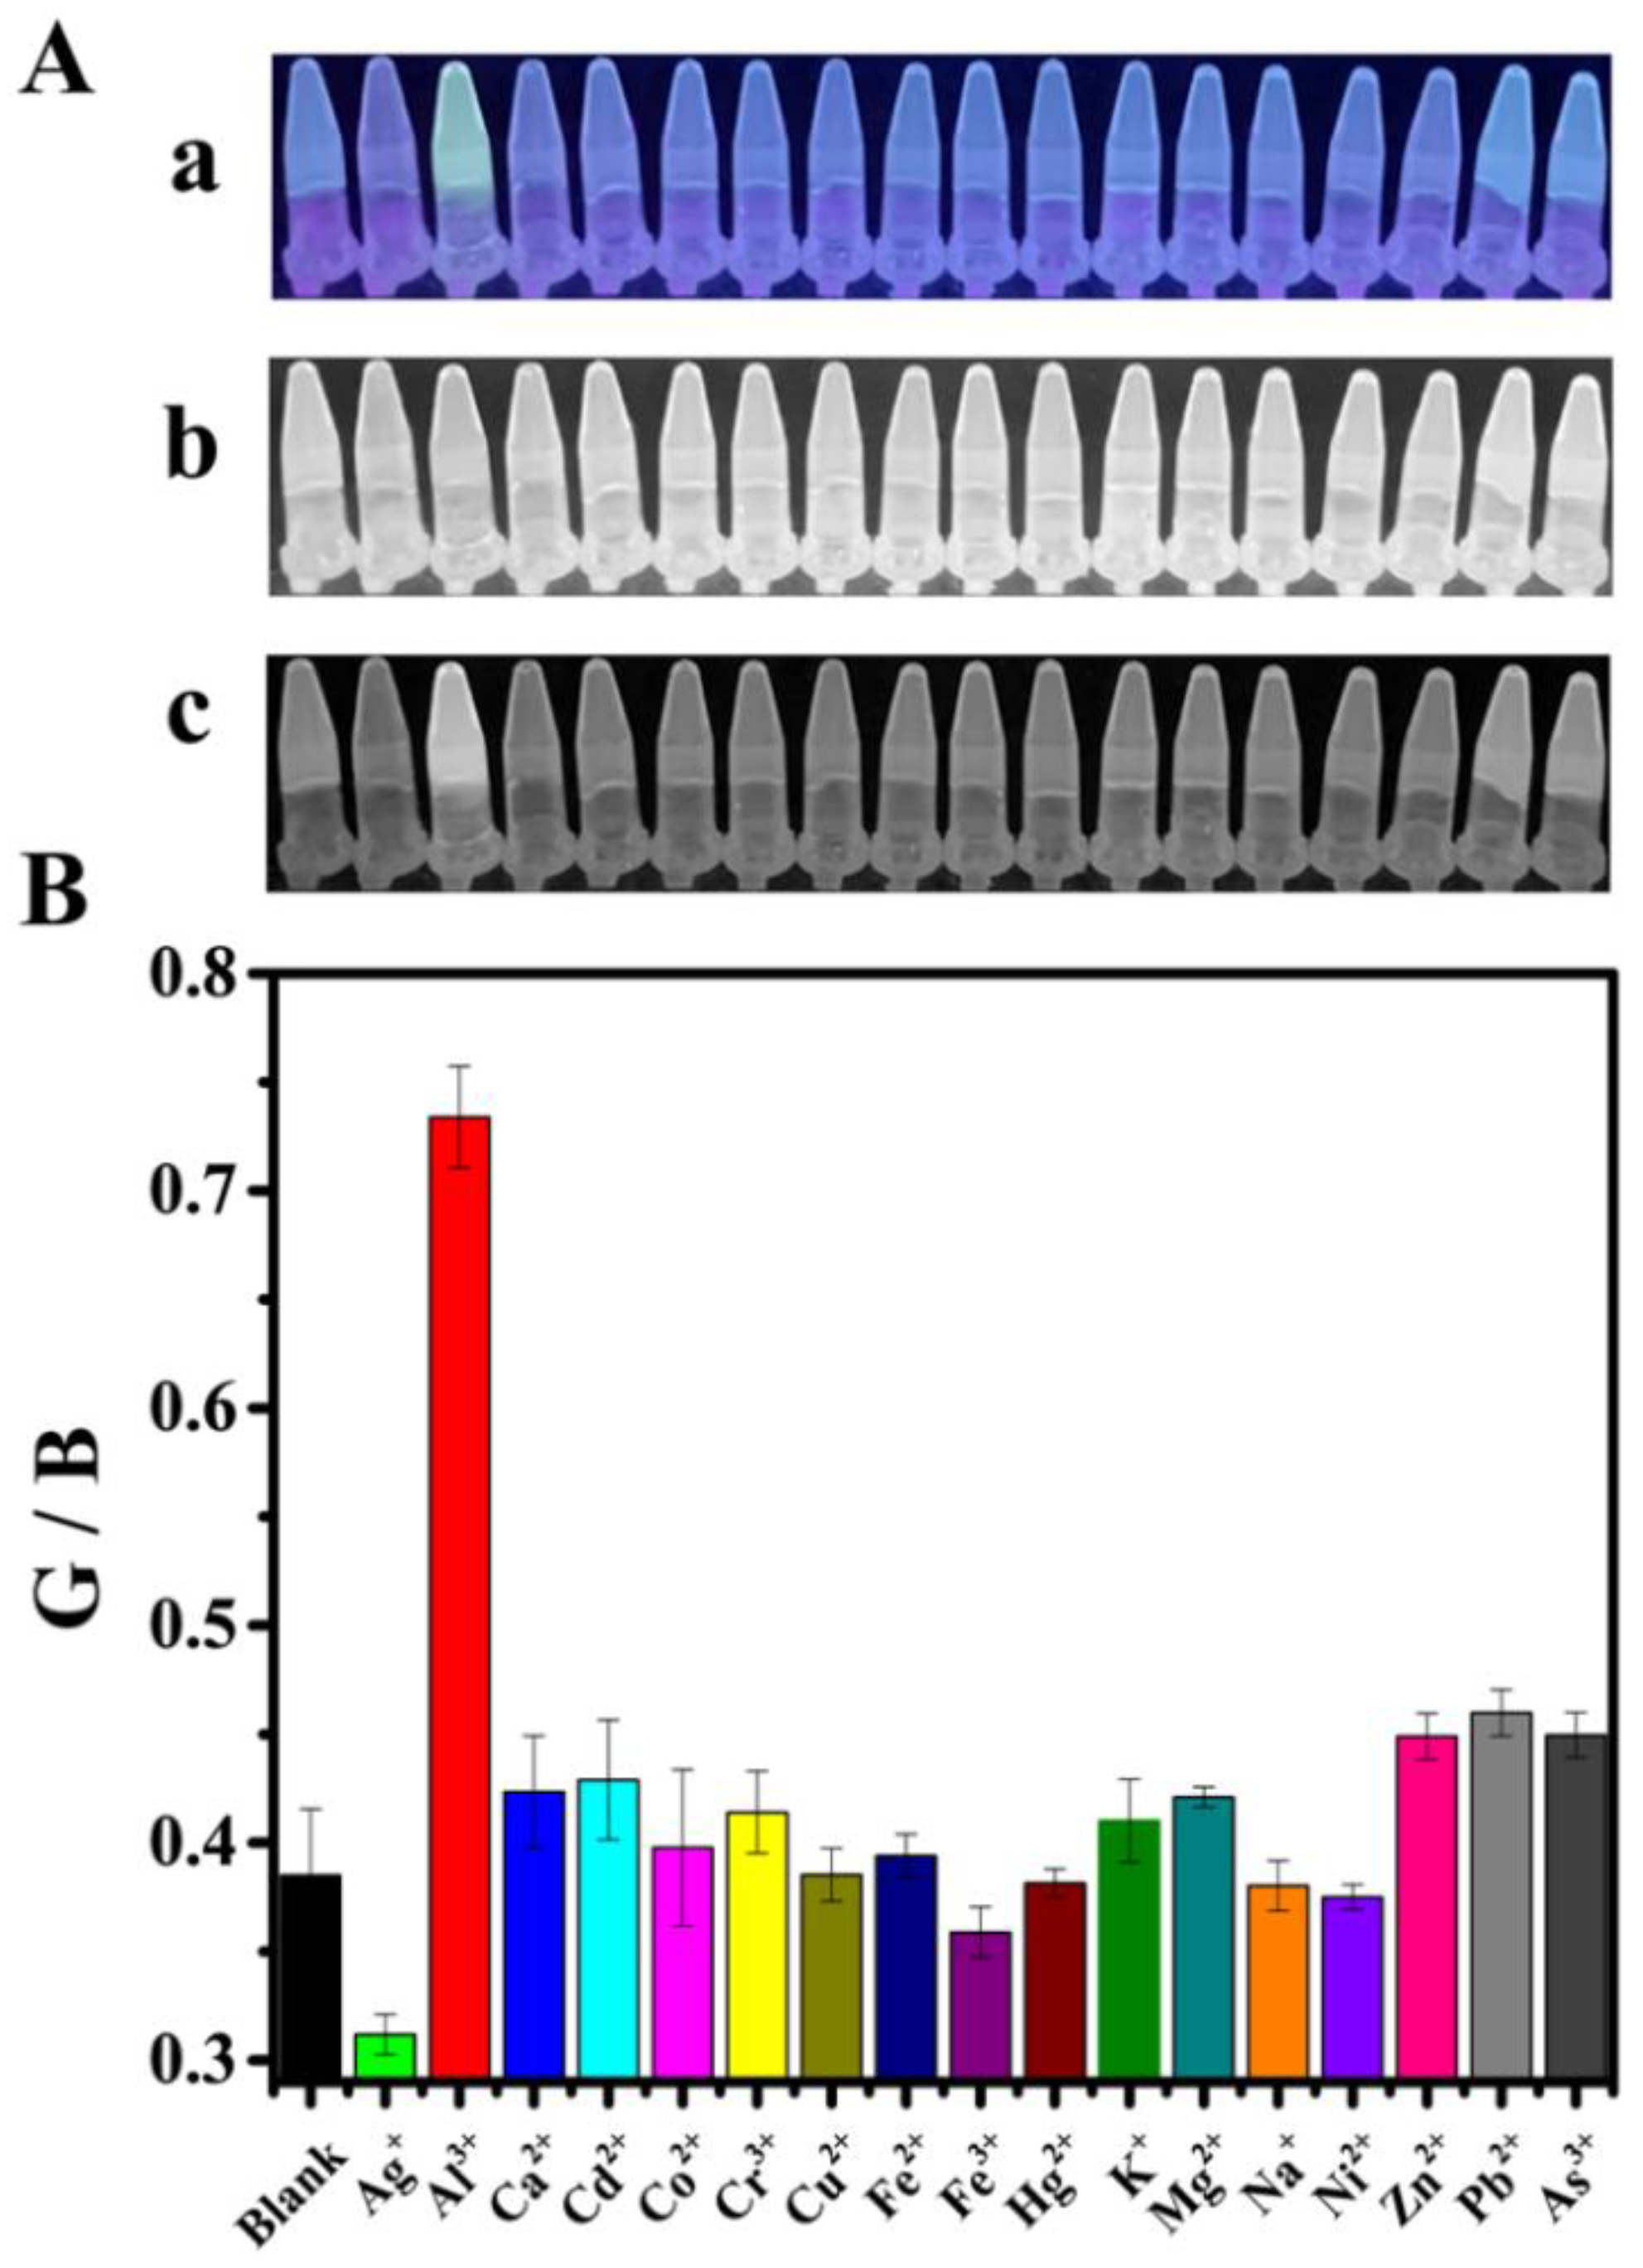
3.5. RGB Detection of Al3+

Based on the results on the fluorescence detection of Al3+, the appearance of the fluorescence emission peak at 500 nm provides the prerequisites for the fluorescence-based colorimetric strategy for the Al3+ detection. Figure 5A shows a photo that was taken by a smartphone under a 360 nm UV light. The fluorescence color of the CDs-Al3+ solution changes from blue to green upon the increase in the concentration of Al3+, which was available for the RGB analysis. In order to obtain the sample color information (RGB value), the color fluorescent image was split into the blue channel (B), green channel (G), and red channel (R) via Image J. The results show that the fluorescence intensity of B decreases gradually, whereas the fluorescence intensity of G increases gradually. By considering the ratio between the blue channel and the green channel(G/B) as the signal, a linear trend between the concentration of Al3+ and the G/B value can be obtained (Figure 5B). The G/B value is linear as a function of the concentration of Al3+ in the 15.39–153.85 μM range (R2 = 0.9917). The calculated LOD measures 5.55 μM, which is lower than the report for the maximum amount of drinking water specified by the WHO (7.41 μM) and is comparable to that of other reported investigations (Table S1). These results show that the detection of Al3+ in a “portable” way is possible by using a simple smartphone.
To estimate the selectivity of the CDs-based sensor via the RGB method, the color fluorescent images of the CDs with Al3+ and other metal ions (Ag+, Ca2+, Cd2+, Co2+, Cr3+, Cu2+, Fe2+, Fe3+, Hg2+, K+, Mg2+, Na+, Ni2+, Zn2+, Pb2+ and As3+) were obtained by using a smartphone. As shown in Figure 6A, the CDs-Al3+ solution presents a high intensity in the fluorescence signal under UV light when compared to other ions and the blank sample, especially in the green channel. Interestingly, the CDs-Ag+ and CDs-Fe3+ solutions present a weaker fluorescence intensity due to the quenching effect of Ag+ and Fe3+ on the CDs, which is a benefit for the selectivity. As shown in Figure 6B and Figure 7, the G/B value of the CDs-Al3+ solution is remarkably higher than that for other metal ions and 12 kinds of small molecules, indicating that this CDs-based sensor exhibits an excellent selectivity for the RGB analysis assay. More importantly, the above 12 kinds of small molecules and the mixture of these small molecules are proven not to interfere with the detection of Al3+ in the RGB analysis assay (Figure S11).

3.6. Analysis of Spiked Water Sample

To study the potential applicability of the CDs-based sensor for the detection of Al3+, tap and lake water were spiked with different concentration of Al3+ solutions. The actual Al3+ content in tap and lake water sample were determined using AAS, which was lower than the LOD of the AAS. Table 1 lists the recovery rates based on the fluorescence analysis and on the smartphone-based analysis. The values measure 93.77–104.10% and 92.46–102.16% with a relative standard deviation (RSD) in the range of 2.05–5.64% and 3.56–7.09%, respectively, indicating the satisfactory accuracy and reproducibility of the CDs-based sensor for its application on actual water samples.

4. Conclusions

In summary, a colorimetric fluorescent sensor was designed for detecting Al3+ based on as-prepared CDs probe and a smartphone coupled with an RGB analysis. When Al3+ is added gradually, the CDs probe exhibits a series of color changes from blue to green under a UV lamp. This phenomenon is probably due to the interaction between the Al3+ions and the C–O–C band on the surface of the CDs, followed with the proximity of CDs. By considering the I500/I420 ratio as the signal, a ratiometric fluorescence assay was prepared for the detection of Al3+ ions. The results show that its detection limit measures 113.8 nM. More importantly, the color information can be identified with the help of the smartphone and the RGB analysis software. These results prove a fluorescence-based colorimetric method for the Al3+ detection with a detection limit of 5.55 μM, which provides an instrument-free and an on-site visual detection of this compound. Additionally, this colorimetric fluorescent sensor was demonstrated in real samples (tap water and lake water) with satisfactory recoveries. To the best of the authors’ knowledge, this is the first time that Al3+ was detected using CDs via a fluorescence-based colorimetric method. By introducing the smartphone and the RGB analysis, this detection technology paves the way to conveniently and instantly detecting targets.

Supplementary Materials

The following are available online at https://www.mdpi.com/2227-9040/9/2/25/s1, Figure S1: Fluorescence spectra and normalized fluorescence spectra of CDs with different concentrations, Figure S2: Anti-photobleaching property of the CDs when irradiated under UV lamp for 3 h, Figure S3. The FTIR spectra of CDs (A) before and (B) after irradiation at 360 nm UV light for 15 min. Figure S4: The fluorescence intensity of CDs at different dark storage time interval when irradiated under UV lamp for 15 min once, Figure S5: TEM images of CDs, CDs with the addition of Al3+ (7.69 mM), Figure S6: XRD and XPS spectrum of the CDs, Figure S7: Zeta potential of the CDs and the CDs-Al3+ (7.69 mM), Figure S8: FTIR spectra of CDs, CDs with the addition of different concentration of Al3+ (7.69 μM, 76.9 μM, 769 μM, 7.69 mM), Figure S9: Fluorescence spectra and I500/I420 of CDs after adding 76.92 μM Al3+ at the pH from 4.0 to 9.0, Figure S10: The pH value of different concentrations of Al(NO3)3 in acetic-acetate buffer solution (pH 5.0), Figure S11: Images of the CDs-Al3+ (307.69 μM) solution upon the addition of different small molecule and the mixture of above small molecules obtained with a smartphone under a 360 nm UV lamp; G/B value responses to the different small molecule (307.69 μM glutathione, vitamin C, L-aspartic, fulvic acid, L-glutamic, serine, glucose, L-alanine, glycine, urea, and L-threoine, and 247 μg/mL humic acid), Table S1: Comparison among different methods used in the Al3+ detection.

Author Contributions

Conceptualization, X.S.; methodology, W.W., X.L., and X.S.; software, W.W., J.H., W.G., and X.S.; validation, W.W. and J.H.; formal analysis, W.W., J.H., and X.L.; investigation, W.W., J.H., W.G., and X.S.; resources, X.L. and X.S.; data curation, W.W., J.H., and X.S.; Writing—Original draft preparation, W.W., J.H., and X.S.; Writing—Review and editing, W.G., X.L., and X.S.; visualization, X.L. and X.S.; supervision, X.L. and X.S.; project administration, X.S.; funding acquisition, X.S. All authors have read and agreed to the published version of the manuscript.

Funding

This research was funded by the National Natural Science Foundation of China (NSFC, Projectno.31972155, 31801473), Natural Science Foundation of Hunan Province (2019JJ40115, 2020RC3050), China Postdoctoral Science Foundation (2018M642980), and Training Program of Excellent Young Innovators of Changsha (kq1905017, kq2009058).

Conflicts of Interest

The authors declare no conflict of interest.

References

  1. Perl, D.P.; Gajdusek, D.C.; Garruto, R.M.; Yanagihara, R.T.; Gibbs, C.J. Intraneuronal aluminum accumulation in amyotrophic lateral sclerosis and Parkinsonism-dementia of Guam. Science 1982, 217, 1053–1055. [Google Scholar] [CrossRef] [PubMed]
  2. Perl, D.P.; Brody, A.R. Alzheimer’s disease: X-ray spectrometric evidence of aluminum accumulation in neurofibrillary tangle-bearing neurons. Science 1980, 208, 297–299. [Google Scholar] [CrossRef] [PubMed]
  3. World Health Organization Guidelines for Drinking Water Quality; World Health Organization: Geneva, Switzerland, 2004; Volume 301.
  4. Torawane, P.; Tayade, K.; Bothta, S.; Sahoo, S.K.; Singh, N.; Borse, A.; Kuwar, A. A highly selective and sensitive fluorescent turn-on chemosensor for Al3+ based on C=N isomerisation mechanism with nanomolar detection. Sens. Actuators B Chem. 2016, 222, 562–566. [Google Scholar] [CrossRef]
  5. Purkait, R.; Sinha, C. Solvent-tuned discriminant sensing of Al3+, Mg2+ and HF2- byvanilinyl-picolinyl hydrazide Schiffbase. New J. Chem. 2019, 43, 9815–9823. [Google Scholar] [CrossRef]
  6. Song, Y.J.; Wei, W.L.; Qu, X.G. Colorimetric biosensing using smart materials. Adv. Mater. 2011, 23, 4215–4236. [Google Scholar] [CrossRef] [PubMed]
  7. Lu, D.; Zhang, D.; Zhao, Q.; Lu, X.Y.; Shi, X.B. A critical factor for quantifying proteins in unmodified gold nanoparticles-based aptasensing: The effect of pH. Chemosensors 2020, 8, 98. [Google Scholar] [CrossRef]
  8. Joshi, P.; Painuli, R.; Kumar, D. Label-free colorimetric nanosensor for the selective on-site detection of aqueous Al3+. ACS Sustain. Chem. Eng. 2017, 5, 4552–4562. [Google Scholar] [CrossRef]
  9. Xue, D.S.; Wang, H.Y.; Zhang, Y.B. Specific and sensitive colorimetric detection of Al3+ using 5-mercaptomethyltetrazole capped gold nanoparticles in aqueous solution. Talanta 2014, 119, 306–311. [Google Scholar] [CrossRef]
  10. Chen, Y.C.; Lee, I.L.; Sung, Y.M.; Wu, S.P. Colorimetric detection of Al3+ ions using triazole–ether functionalized gold nanoparticles. Talanta 2013, 117, 70–74. [Google Scholar] [CrossRef]
  11. Chen, W.W.; Jia, Y.X.; Feng, Y.; Zheng, W.S.; Wang, Z.; Jiang, X.Y. Colorimetric detection of Al(III) in vermicelli samples based on ionic liquid group coated gold nanoparticles. RSC Adv. 2015, 5, 62260–62264. [Google Scholar] [CrossRef]
  12. Lee, J.J.; Park, G.J.; Kim, Y.S.; Lee, S.Y.; Lee, H.J.; Noh, I.; Kim, C. A water-soluble carboxylic-functionalized chemosensor for detecting Al3+ in aqueous media and living cells: Experimental and theoreticalstudies. Biosens. Bioelectron. 2015, 69, 226–229. [Google Scholar] [CrossRef]
  13. Qin, J.C.; Yang, Z.Y. Ratiometric fluorescent probefor Al3+ based on coumarin derivative in aqueous media. Anal. Methods 2015, 7, 2036–2040. [Google Scholar] [CrossRef]
  14. Yao, J.L.; Zhang, K.; Zhu, H.J.; Ma, F.; Sun, M.T.; Yu, H.; Sun, J.; Wang, S.H. Efficient ratiometric fluorescence probe based on dual-emission quantum dots hybrid for on-site determination of copper ions. Anal. Chem. 2013, 85, 6461–6468. [Google Scholar] [CrossRef] [PubMed]
  15. Wei, X.; Chen, H. Ratiometric fluorescence molecularly imprinted sensor basedon dual-emission quantum dots hybrid for determination of tetracycline. Anal. Bioanal. Chem. 2019, 411, 5809–5816. [Google Scholar] [CrossRef] [PubMed]
  16. Noor, M.O.; Krull, U. Camera-based ratiometric fluorescence transduction of nucleic acid hybridization with reagentless signal amplification on a paper-based platform using immobilized quantum dots as donors. Anal. Chem. 2014, 86, 10331–10339. [Google Scholar] [CrossRef]
  17. Khan, I.M.; Niazi, S.; Yu, Y.; Mohsin, A.; Mushtag, B.S.; Iqbal, M.W.; Rehman, A.; Alhtar, W.; Wang, Z.P. Aptamer induced multicolored AuNCs-WS2 “Turn on” FRET nano platform for dual-color simultaneous detection of AflatoxinB1 and Zearalenone. Anal. Chem. 2019, 91, 14085–14092. [Google Scholar] [CrossRef]
  18. Liu, H.J.; Jia, L.; Wang, Y.X.; Wang, M.Y.; Gao, Z.D.; Ren, X.Q. Ratiometric fluorescent sensor for visual determination of copperions and alkaline phosphatase based on carbon quantum dotsand gold nanoclusters. Anal. Bioanal. Chem. 2019, 411, 2531–2543. [Google Scholar] [CrossRef]
  19. Lim, S.Y.; Shen, W.; Gao, Z.Q. Carbon quantum dots and their applications. Chem. Soc. Rev. 2015, 44, 362–381. [Google Scholar] [CrossRef]
  20. Shi, X.B.; Wen, C.; Fu, Z.D.; Deng, F.M.; Zheng, S.; Liu, Q.Y. Photo properties and applications of single quantum dots. Prog. Chem. 2014, 26, 1781–1792. [Google Scholar] [CrossRef]
  21. Wang, Y.F.; Hu, A.G. Carbon quantum dots: Synthesis, properties and applications. J. Mater. Chem. C 2014, 2, 6921–6939. [Google Scholar] [CrossRef] [Green Version]
  22. Shi, X.B.; Wei, W.; Fu, Z.D.; Gao, W.L.; Zhang, C.Y.; Zhao, Q.; Deng, F.M.; Lu, X.Y. Review on carbon dots in food safety applications. Talanta 2019, 194, 809–821. [Google Scholar] [CrossRef] [PubMed]
  23. Wang, H.Q.; Yang, L.; Chu, S.Y.; Liu, B.H.; Zhang, Q.K.; Zou, L.M.; Yu, S.M.; Jiang, C.L. Semi-quantitative visual detection of lead ions with smartphone via colorimetric paper-based analytical device. Anal. Chem. 2019, 91, 9292–9299. [Google Scholar] [CrossRef] [PubMed]
  24. Zhang, Y.; Fang, Y.; Xu, N.Z.; Zhang, M.Q.; Wu, G.Z.; Yao, C. A colorimetric and ratiometric fluorescent chemosensor based on furan-pyrene for selective and sensitive sensing Al3+. Chin. Chem. Lett. 2016, 27, 1673–1678. [Google Scholar] [CrossRef]
  25. Soufeena, P.P.; Aravindakshan, K.K. Antipyrine derived schiff base: A colorimetric sensor for Fe(III) and “Turn-On” fluorescent sensor for Al(III). J. Lumin. 2019, 205, 400–405. [Google Scholar] [CrossRef]
  26. Peng, B.; Xu, J.M.; Fan, M.M.; Guo, Y.; Ma, Y.J.; Zhou, M.; Fang, Y.J. Smartphone colorimetric determination of hydrogen peroxidein real samples based on B, N, and S co-doped carbon dots probe. Anal. Bioanal. Chem. 2020, 412, 861–870. [Google Scholar] [CrossRef]
  27. Tian, Y.; Zhang, L.L.; Wang, H.J.; Ji, W.Y.; Zhang, Z.Y.; Zhang, Y.Y.; Yang, Z.C.; Cao, Z.S.; Zhang, S.F.; Chang, J. Intelligent detection platform for simultaneous detection of multiple MiRNAs based on Smartphone. ACS Sens. 2019, 4, 1873–1880. [Google Scholar] [CrossRef]
  28. Zeng, X.L.; Hu, J.; Zhang, M.; Wang, F.L.; Wu, L.; Hou, X.D. Visual detection of fluoride anions using mixed lanthanide metal-organic frameworks with a smartphone. Anal. Chem. 2020, 92, 2097–2102. [Google Scholar] [CrossRef]
  29. Shen, Z.; Zhang, C.; Yu, X.L.; Li, J.; Wang, Z.Y.; Zhang, Z.P.; Liu, B.H. Microwave synthesis of cyclen functional carbon dots to construct a ratiometric fluorescent probe for tetracycline detection. J. Mater. Chem. C 2018, 6, 9636–9641. [Google Scholar] [CrossRef]
  30. Hou, L.; Qin, Y.X.; Li, J.Y.; Qin, S.Y.; Huang, Y.L.; Lin, T.R.; Guo, L.Q.; Ye, F.G.; Zhao, S.L. A ratiometric multicolor fluorescence biosensor for visual detection of alkaline phosphatase activity via a smartphone. Biosens. Bioelectron. 2019, 143, 111605. [Google Scholar] [CrossRef]
  31. Chen, R.; Qi, Q.L.; Wang, M.T.; Li, Q.L. Therapeutic potential of naringin: An overview. Pharm. Biol. 2016, 54, 3203–3210. [Google Scholar] [CrossRef]
  32. Salehi, B.; Fokou, P.V.T.; Rad, M.S.; Zucca, P.; Pezzani, R.; Martins, N.; Rad, J.S. The therapeutic potential of naringenin: A review of clinical Trials. Pharmaceuticals 2019, 12, 11. [Google Scholar] [CrossRef] [PubMed] [Green Version]
  33. Ahmed, S.; Khan, H.; Aschner, M.; Hasan, M.M.; Hasan, S.S. Therapeutic potential of naringin in neurological disorders. Food Chem. Toxicol. 2019, 132, 110646. [Google Scholar] [CrossRef] [PubMed]
  34. Hartogh, D.D.; Tsiani, E. Antidiabetic properties of naringenin: A citrus fruit polyphenol. Biomolecules 2019, 9, 99. [Google Scholar] [CrossRef] [PubMed] [Green Version]
  35. Singh, Z.; Sharma, S.; Kaur, A. Antitoxic effects of naringin: A flavonoid with diverse biological activities. World J. Pharm. Res. 2018, 7, 484–489. [Google Scholar] [CrossRef]
  36. Ye, R.Q.; Xiang, C.S.; Lin, J.; Peng, Z.W.; Huang, K.W.; Yan, Z.; Cook, N.P.; Samuel, E.L.G.; Hwang, C.C.; Ruan, G.D.; et al. Coal as an abundant source of grapheme quantum dots. Nat. Commun. 2013, 4, 2943. [Google Scholar] [CrossRef]
  37. Wang, W.S.; Damm, C.; Walter, J.; Nacken, T.J.; Peukert, W. Photobleaching and stabilization of carbon nanodots produced by solvothermal synthesis. Phys. Chem. Chem. Phys. 2016, 18, 466–475. [Google Scholar] [CrossRef] [PubMed] [Green Version]
  38. Meng, X.; Chang, Q.; Xue, C.R.; Yang, J.L.; Hu, S.L. Full-colour carbon dots from energy-efficient synthesis to concentration-dependent photoluminescence properties. Chem. Commun. 2017, 53, 3074–3077. [Google Scholar] [CrossRef] [PubMed]
  39. Han, C.P.; Wang, R.; Wang, K.Y.; Xu, H.T.; Sui, M.R.; Li, J.J.; Xu, K. Highly fluorescent carbon dots as selective and sensitive “on-off-on”probes for iron(III) ion and apoferritin detection and imaging in living cells. Biosens. Bioelectron. 2016, 83, 229–236. [Google Scholar] [CrossRef] [PubMed]
  40. Xu, H.; Yang, X.P.; Li, G.; Zhao, C.; Liao, X.J. Green Synthesis of fluorescent carbon dots for selective detection of tartrazine in food samples. J. Agric. Food Chem. 2015, 63, 6707–6714. [Google Scholar] [CrossRef] [PubMed]
  41. Song, Y.; Zhu, C.Z.; Song, J.H.; Li, H.; Du, D.; Lin, Y.H. Drug-derived bright and color-tunable N-doped carbon dotsfor cell imaging and sensitive detection of Fe3+ in living cells. ACS Appl. Mater. Interfaces 2017, 9, 7399–7405. [Google Scholar] [CrossRef] [PubMed] [Green Version]
  42. Carrion, C.C.; Cardenas, S.; Simonet, B.M.; Valcarcel, M. Quantum dots luminescence enhancement due to illumination with UV/Vis light. Chem. Commun. 2009, 35, 5214–5226. [Google Scholar] [CrossRef] [PubMed]
  43. Tan, D.Z.; Zhou, S.F.; Shimotsuma, Y.; Miura, K.; Qiu, J.R. Effect of UV irradiation on photoluminescence of carbon dots. Opt. Soc. Am. 2014, 4, 213–219. [Google Scholar] [CrossRef]
  44. Li, X.Y.; Yan, L.H.; Si, J.H.; Xu, H.H.; Xu, Y.M. Tuning the photoluminescence property of carbon dots by ultraviolet light irradiation. RSC Adv. 2019, 9, 12732–12736. [Google Scholar] [CrossRef] [Green Version]
  45. Gao, Z.; Wang, L.B.; Su, R.X.; Huang, R.L.; Qi, W.; He, Z.M. A carbon dot-based off-on fluorescent probe for highly selective and sensitive detection of phytic acid. Biosens. Bioelectron. 2015, 70, 232–238. [Google Scholar] [CrossRef] [PubMed]
  46. Hung, P.J.; Chir, J.L.; Ting, W.; Wu, A.T. A selective colorimetric and ratiometric fluorescent chemosensor for detection of Al3+ ion. J. Lumin. 2015, 158, 371–375. [Google Scholar] [CrossRef]
  47. Wang, Y.B.; Chang, Q.; Hu, S.L. Carbon dots with concentration-tunable multicoloredphotoluminescence for simultaneous detection of Fe3+ and Cu2+ ions. Sens. Actuators B Chem. 2017, 253, 928–933. [Google Scholar] [CrossRef]
  48. Li, Y.P.; Liu, X.M.; Zhang, Y.H.; Chang, Z. A fluorescent and colorimetric sensor for Al3+ based on a dibenzo-18-crown-6 derivative. Inorg. Chem. Commun. 2013, 33, 6–9. [Google Scholar] [CrossRef]
  49. Yang, Y.X.; Zhang, W.H.; Qiu, H.; Tsang, D.C.W.; Morel, J.L.; Qiu, R.L. Effect of coexisting Al(III) ions on Pb(II) sorption on biochars: Role of pH buffer and competition. Chemosphere 2016, 161, 438–445. [Google Scholar] [CrossRef]
  50. Yan, F.Y.; Shi, D.C.; Zheng, T.C.; Yun, K.Y.; Zhou, X.G.; Chen, L. Carbon dots as nanosensor for sensitive and selective detection ofHg2+ and L-cysteine by means of fluorescence “Off–On” switching. Sens. Actuators B Chem. 2016, 224, 926–935. [Google Scholar] [CrossRef]
Figure 1. Schematic illustration of the strategy for the detection of Al3+.
Chemosensors 09 00025 g001
Figure 2. (a) UV-vis absorption spectra (black line) and (b) fluorescence spectra (red line, at 360 nm excitation) of the carbon dots (CDs) (A); (B) excitation-dependent property and (C) pH-dependence of the CDs for different pH conditions (I0 corresponds to the initial fluorescence intensity at pH = 7.0); (D) FTIR spectra of the CDs.
Chemosensors 09 00025 g002
Figure 3. (A) Fluorescence spectra of the CDs upon the addition of different concentrations of Al3+; (B) relation between the concentration of Al3+ and the I500/I420 value. The inset shows the linear relation in the 0.15–38.46 μM range; (C) fluorescence spectra and (D) I500/I420 variation of the CDs upon the addition of 307.69 μM different metal ions (Ag+, Al3+, Ca2+, Cd2+, Co2+, Cr3+, Cu2+, Fe2+, Fe3+, Hg2+, K+, Mg2+, Na+, Ni2+, Zn2+, Pb2+, and As3+).
Chemosensors 09 00025 g003
Figure 4. (A,B) The selectivity of the fluorescence method towards various small molecules. (A) Fluorescence spectra and (B) I500/I420 variation of the CDs upon the addition of different small molecule. (C,D) Evaluation of the interference from various small molecules in the fluorescence method. (C) Fluorescence spectra and (D) I500/I420 variation of the CDs-Al3+ (307.69 μM) upon the addition of different small molecule and the mixture of above small molecules. The concentration is 307.69 μM for glycine, serine, L-threoine, L-glutamic, L-alanine, L-aspartic, glucose, glutathione, vitamin C, urea, and fulvic acid, and 247 μg/mL for humic acid.
Chemosensors 09 00025 g004
Figure 5. Images of the CDs solutions obtained by using a smartphone under a 360 nm UV lamp. (a) Different concentrations of Al3+ were added into the sample; (b) blue channel content of the image and (c) green channel (A). (B) G/B as a function of the Al3+concentration. The inset shows the linear fit of G/B as a function of the Al3+concentration.
Chemosensors 09 00025 g005
Figure 6. (a) Images of the CDs-ions solution obtained with a smartphone under a 360 nm UV lamp. (b) Blue channel and (c) green channel content of the image (A). (B) G/B value responses depending on the nature of the metal ions; the concentration of the metal ions measures 307.69 μM.
Chemosensors 09 00025 g006
Figure 7. The selectivity of the RGB method towards various small molecules. (a) Images of the CDs-small molecule solution obtained with a smartphone under a 360 nm UV lamp, (b) blue channel and (c) green channel content of the image (A). (B) G/B value responses to the different small molecule (307.69 μM glycine, serine, L-threoine, L-glutamic, L-alanine, L-aspartic, glucose, glutathione, vitamin C, urea, and fulvic acid and 247 μg/mL humic acid).
Chemosensors 09 00025 g007
Table 1. Recovery of Al3+ in spiked tap and lake water.
Samples Fluorescence Analysis RGB Analysis
Addition (μM)Found (μM)Recovery
(%)
RSD
(%)
Addition (μM)Found (μM)Recovery (%)RSD (%)
Tap water0.390.4101.272.0515.3914.4794.024.47
3.853.6995.915.6430.7728.6893.213.56
15.3915.0998.022.5438.4737.0296.234.11
30.7729.997.313.976.9278.58102.166.74
Lake water0.390.3796.313.0215.3914.2392.465.3
3.853.6193.772.7230.7730.1397.925.39
15.3916.02104.15.5738.4636.0793.797.09
30.7728.9594.093.8976.9274.3296.624.58
Publisher’s Note: MDPI stays neutral with regard to jurisdictional claims in published maps and institutional affiliations.

