
Enantioresolution and Binding Affinity Studies on Human Serum Albumin: Recent Applications and Trends


Abstract
:1. Introduction
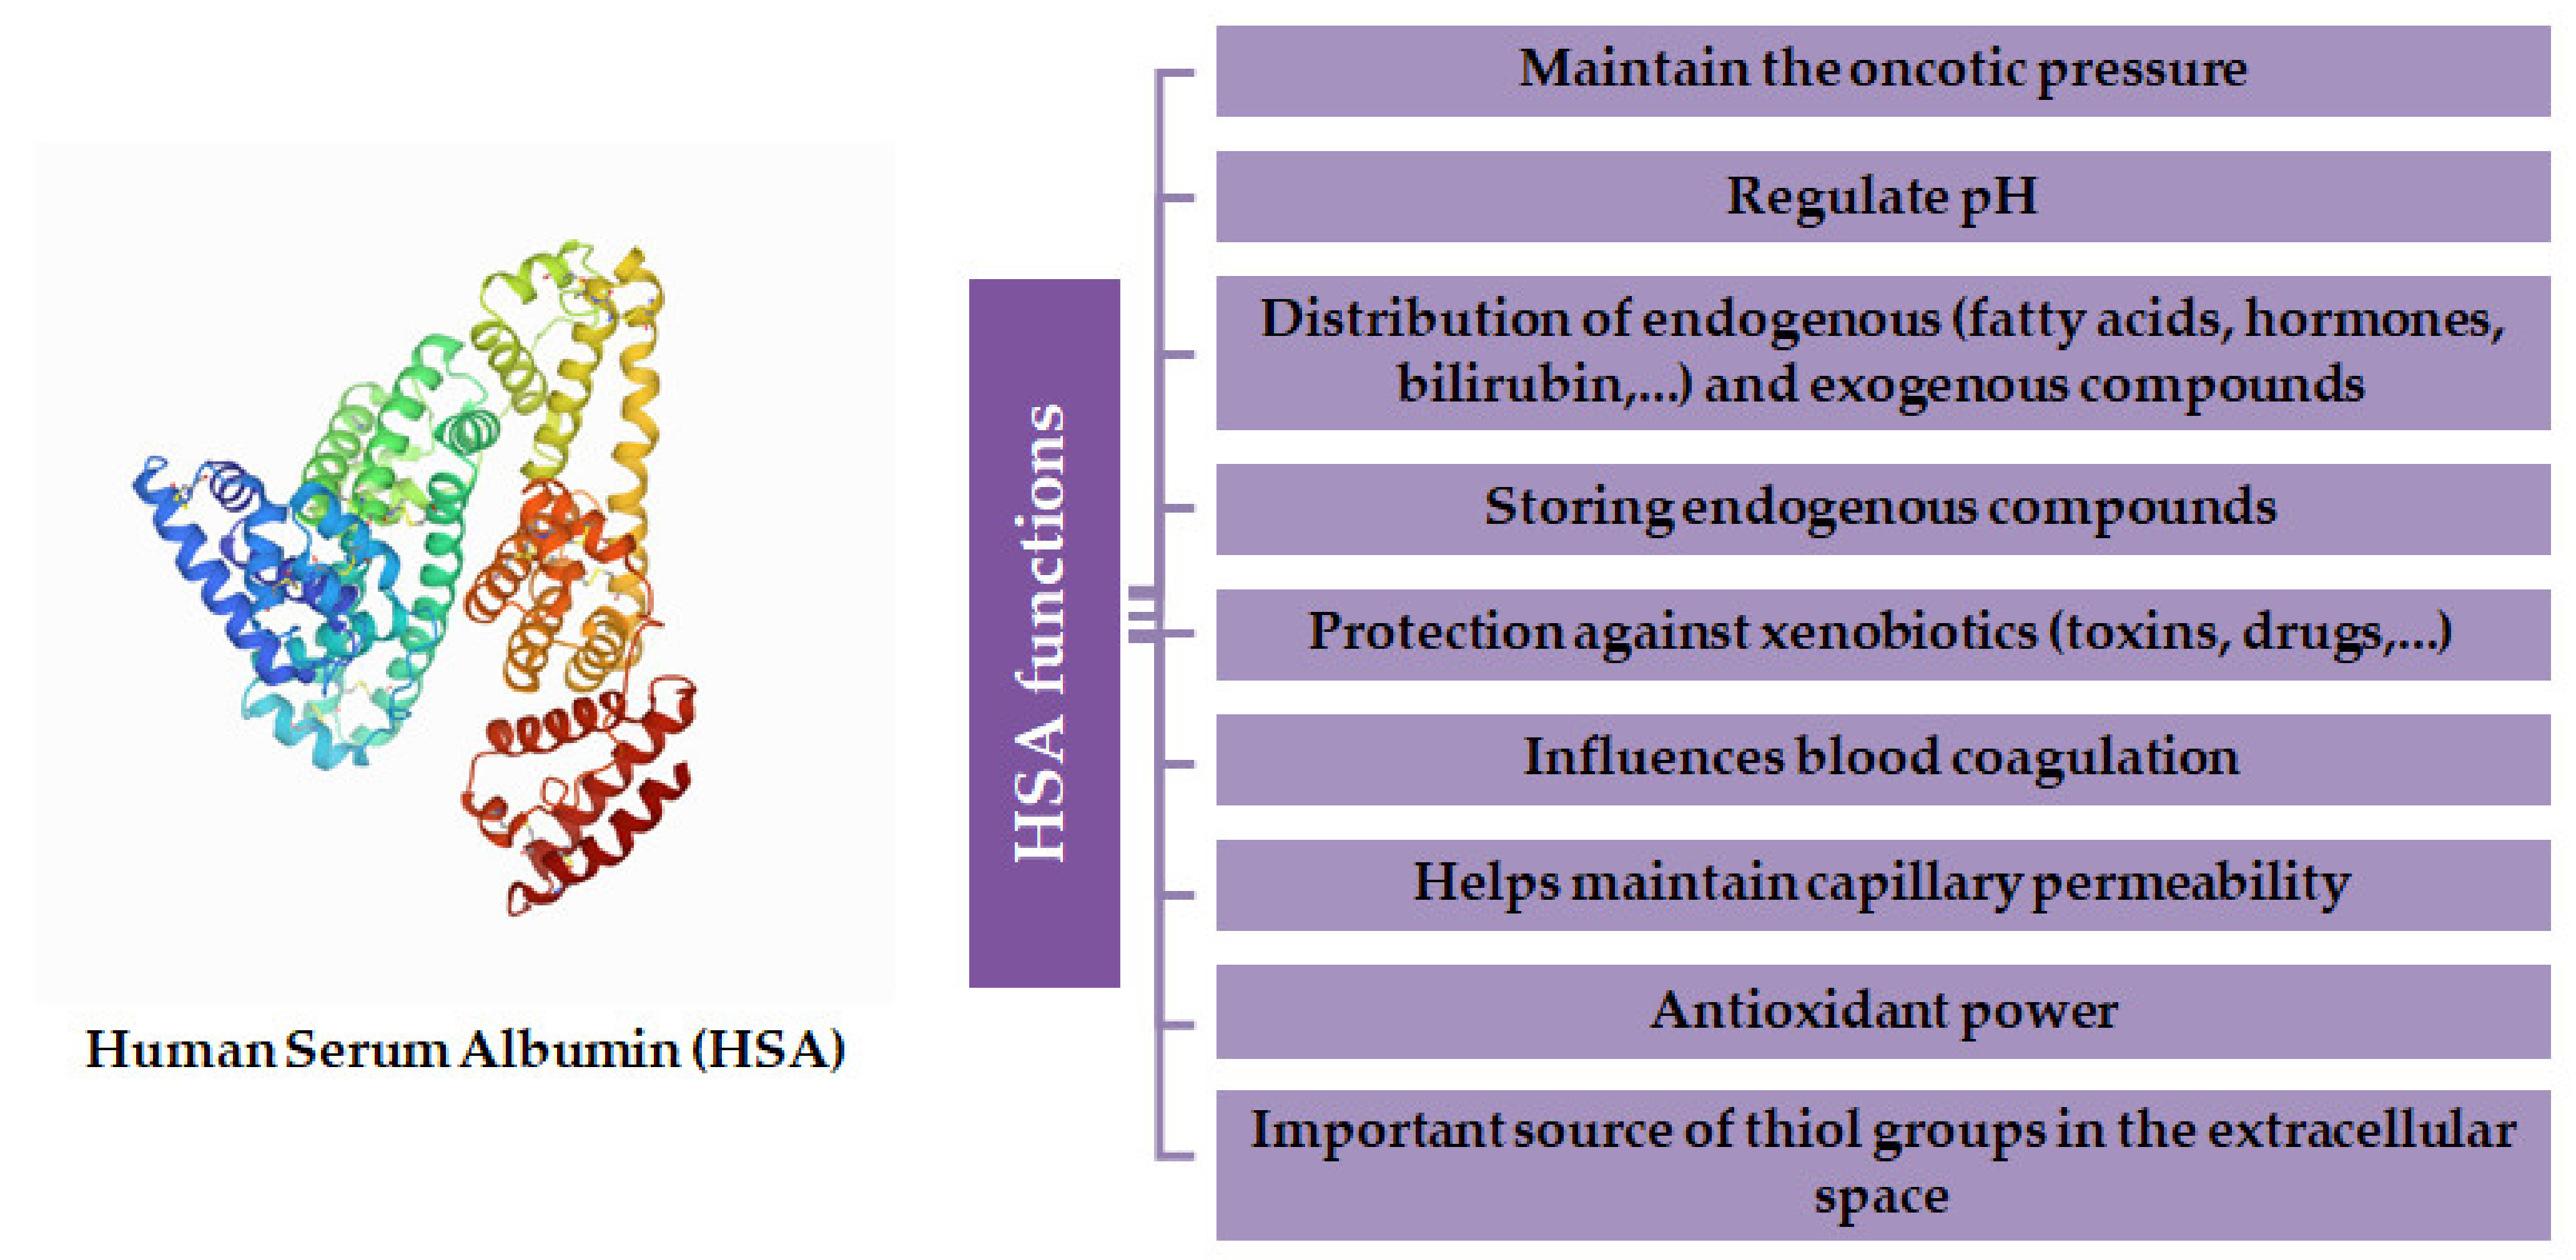
2. Human Serum Albumin
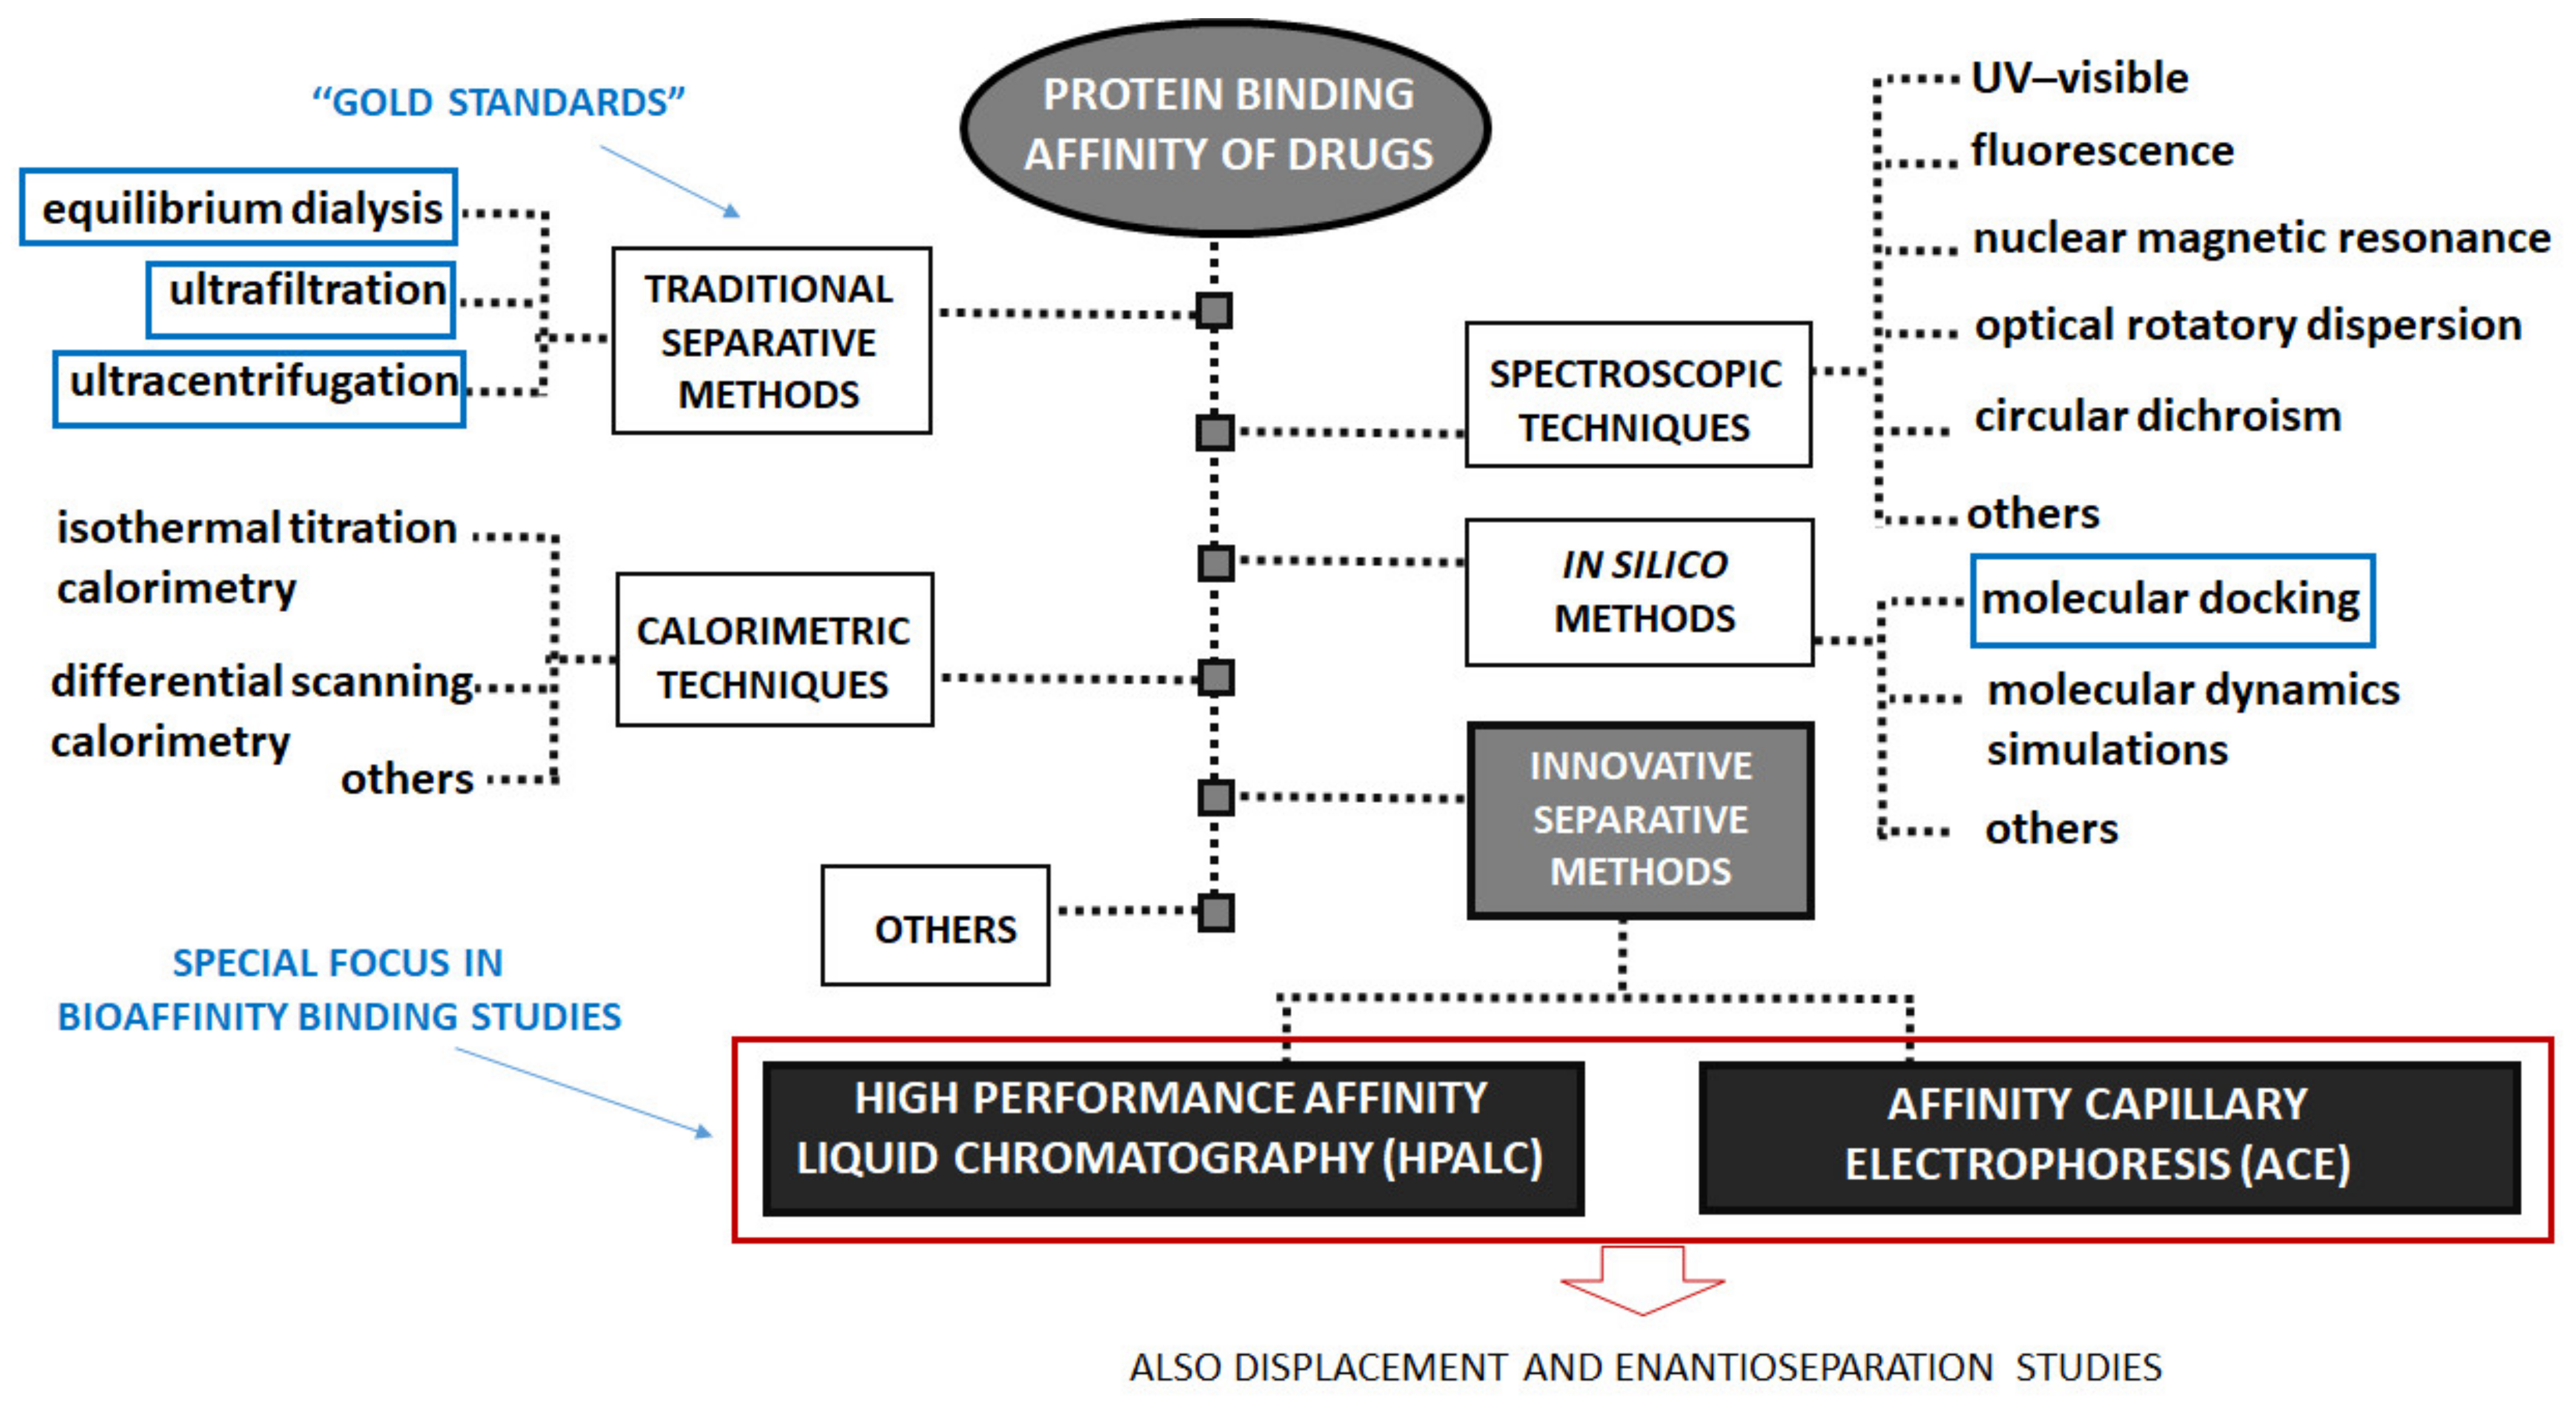
3. Determination of Protein Binding Affinity of Drugs
3.1. Equilibrium Dialysis, Ultrafiltration and Ultracentrifugation
3.2. High-Performance Affinity Liquid Chromatography
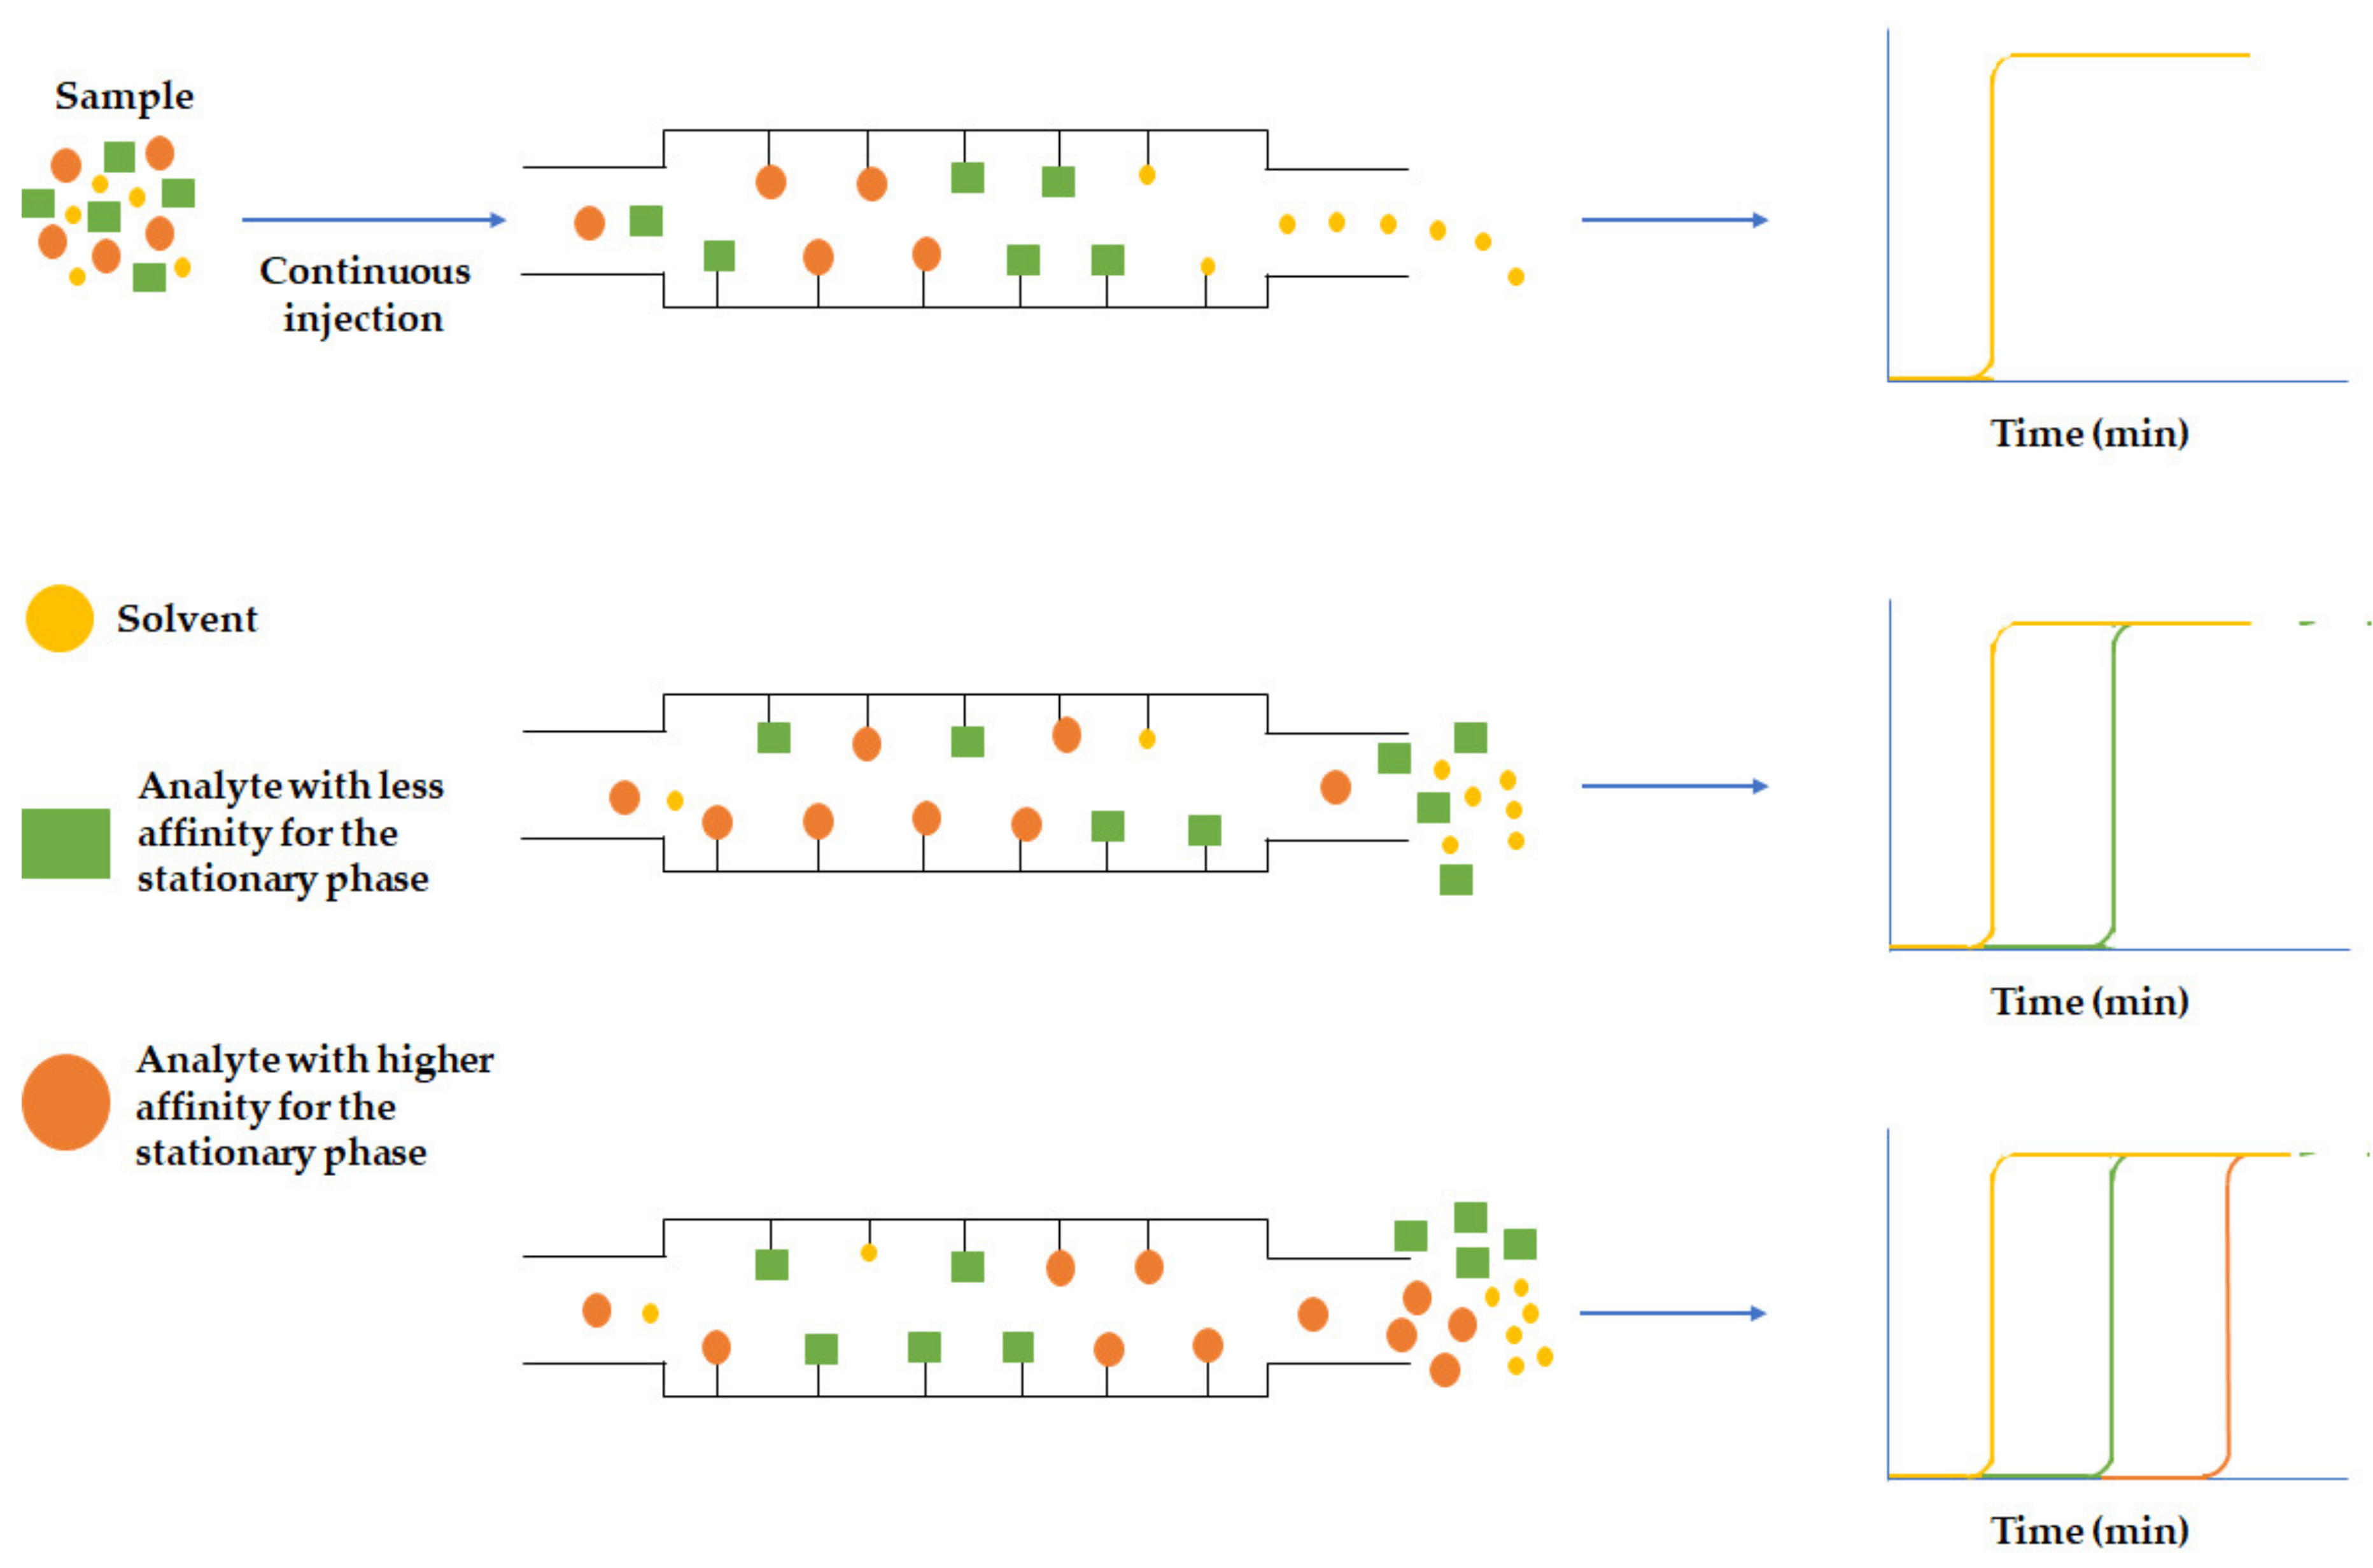
3.2.1. Frontal Analysis
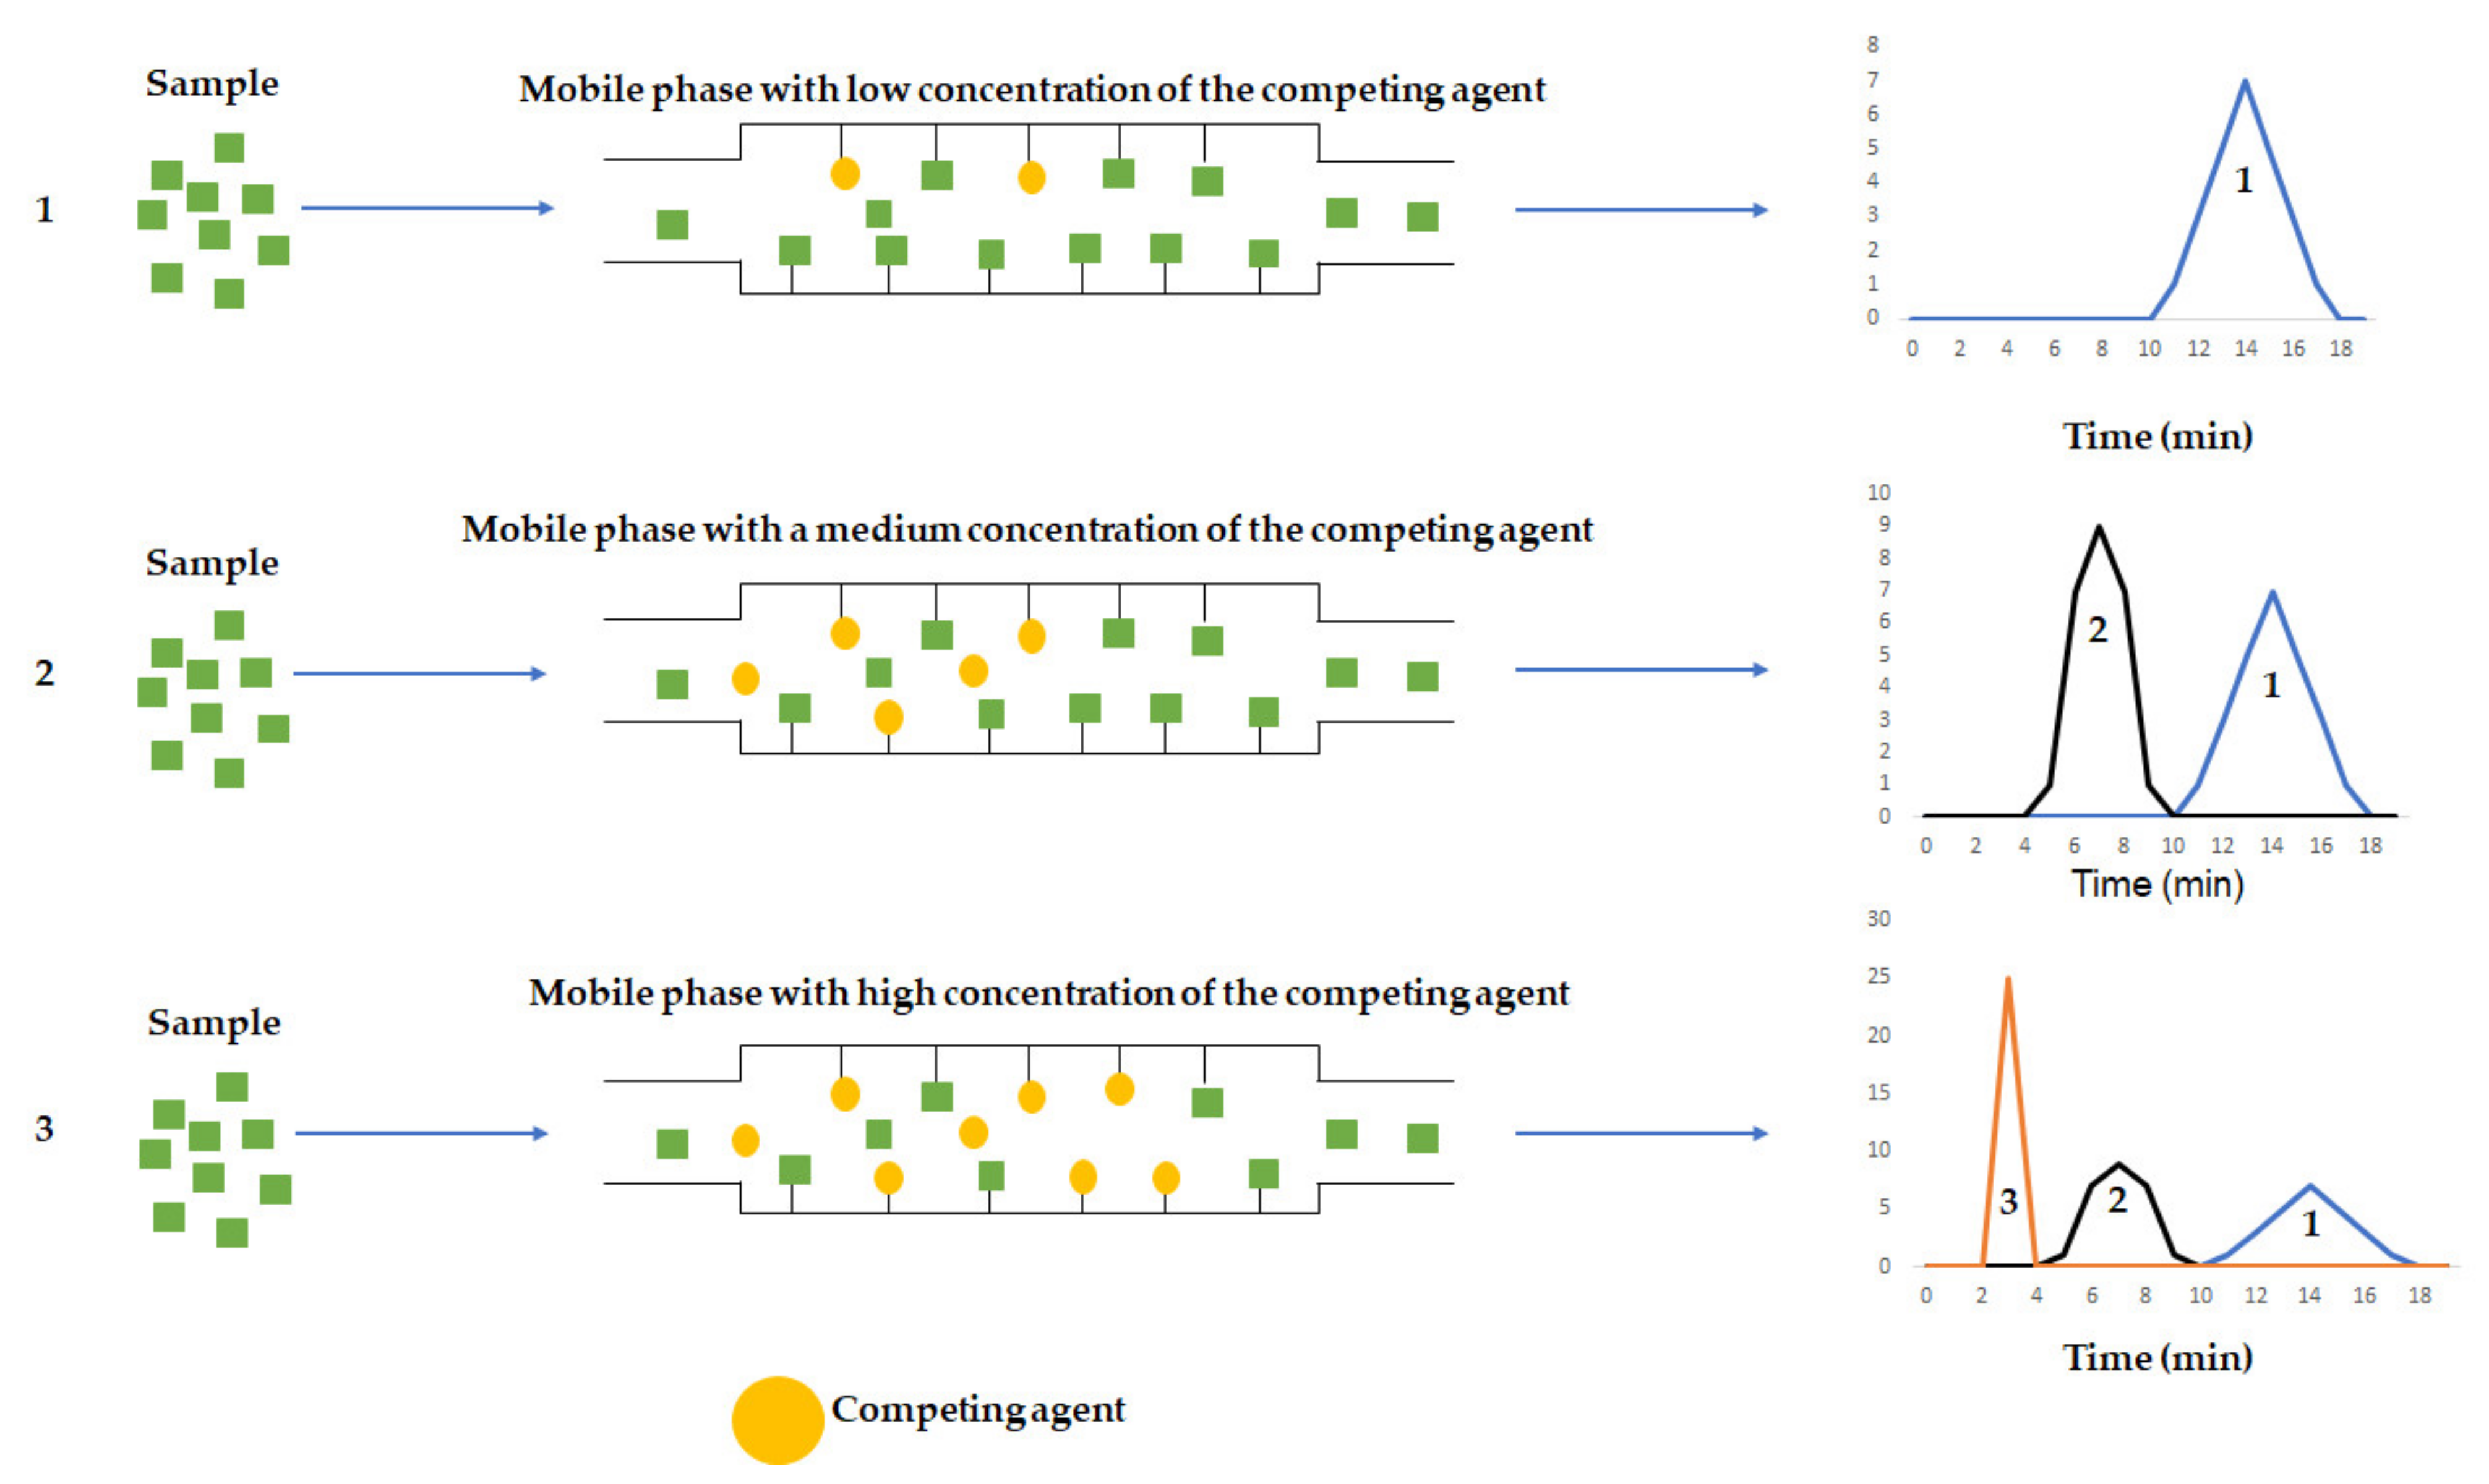
3.2.2. Zonal Analysis
3.3. Capillary Electrophoresis
3.4. In Silico Methods
4. Enantioresolution Studies by Chromatographic and Electrophoretic Methods Using HSA as Chiral Selector
5. Conclusions
Author Contributions
Funding
Institutional Review Board Statement
Informed Consent Statement
Acknowledgments
Conflicts of Interest
References
- Hage, D.S.; Jackson, A.; Sobansky, M.R.; Schiel, J.E.; Yoo, M.J.; Joseph, K.S. Characterization of drug-protein interactions in blood using high-performance affinity chromatography. J. Sep. Sci. 2009, 32, 835–853. [Google Scholar] [CrossRef] [Green Version]
- Li, Z.; Hage, D.S. Analysis of stereoselective drug interactions with serum proteins by high-performance affinity chromatography: A historical perspective. J. Pharm. Biomed. Anal. 2017, 144, 12–24. [Google Scholar] [CrossRef]
- Zhang, F.; Xue, J.; Shao, J.; Jia, L. Compilation of 222 drugs’ plasma protein binding data and guidance for study designs. Drug Discov. Today 2012, 17, 475–485. [Google Scholar] [CrossRef]
- Smith, S.A.; Waters, N.J. Pharmacokinetic and Pharmacodynamic Considerations for Drugs Binding to Alpha-1-Acid Glycoprotein. Pharm. Res. 2018, 36, 30. [Google Scholar] [CrossRef]
- Yamamoto, H.; Takada, T.; Yamanashi, Y.; Ogura, M.; Masuo, Y.; Harada-Shiba, M.; Suzuki, H. VLDL/LDL acts as a drug carrier and regulates the transport and metabolism of drugs in the body. Sci. Rep. 2017, 7, 633. [Google Scholar] [CrossRef]
- Mehvar, R. Role of protein binding in pharmacokinetics. Am. J. Pharm. Educ. 2005, 5, 1–8. [Google Scholar]
- Bohnert, T.; Gan, L.S. Plasma protein binding: From discovery to development. J. Pharm. Sci. 2013, 102, 2953–2994. [Google Scholar] [CrossRef]
- López-Yerena, A.; Perez, M.; Vallverdú-Queralt, A.; Escribano-Ferrer, E. Insights into the binding of dietary phenolic compounds to human serum albumin and food-drug interactions. Pharmaceutics 2020, 12, 1123. [Google Scholar] [CrossRef]
- Lin, Z.J.; Musiano, D.; Abbot, A.; Shum, L. In vitro plasma protein binding determination of flunarizine using equilibrium dialysis and liquid chromatography-tandem mass spectrometry. J. Pharm. Biomed. Anal. 2005, 37, 757–762. [Google Scholar] [CrossRef] [PubMed]
- Roberts, J.A.; Pea, F.; Lipman, J. The clinical relevance of plasma protein binding changes. Clin. Pharmacokinet. 2013, 52, 1–8. [Google Scholar] [CrossRef]
- Li, Z.; Beeram, S.R.; Bi, C.; Suresh, D.; Zheng, X.; Hage, D.S. High-Performance Affinity Chromatography: Applications in Drug-Protein Binding Studies and Personalized Medicine. In Personalized Medicine; Donev, R., Ed.; Academic Press Inc.: Cambridge, MA, USA, 2016; pp. 1–39. [Google Scholar]
- Hughes, J.P.; Rees, S.; Kalindjian, S.B.; Philpott, K.L. Principles of early drug discovery. Br. J. Pharmacol. 2011, 162, 1239–1249. [Google Scholar] [CrossRef] [Green Version]
- Gomes, A.S.; Brandão, P.; Fernandes, C.S.G.; Da Silva, M.R.P.C.; De Sousa, M.E.D.S.P.; De Magalhães Pinto, M.M. Drug-like properties and ADME of xanthone derivatives: The antechamber of clinical trials. Curr. Med. Chem. 2016, 23, 3654–3686. [Google Scholar] [CrossRef] [PubMed]
- Di, L. An update on the importance of plasma protein binding in drug discovery and development. Expert Opin. Drug Discov. 2021, 1–13. [Google Scholar] [CrossRef] [PubMed]
- Benet, L.Z.; Hoener, B.A. Changes in plasma protein binding have little clinical relevance. Clin. Pharmacol. Ther. 2002, 71, 115–121. [Google Scholar] [CrossRef]
- Schmidt, S.; Gonzalez, D.; Derendorf, H. Significance of protein binding in pharmacokinetics and pharmacodynamics. J. Pharm. Sci. 2010, 99, 1107–1122. [Google Scholar] [CrossRef]
- Rolan, P.E. Plasma protein binding displacement interactions—Why are they still regarded as clinically important? Br. J. Clin. Pharmac. 1994, 37, 125–128. [Google Scholar] [CrossRef]
- Christensen, H.; Baker, M.; Tucker, G.T.; Rostami-Hodjegan, A. Prediction of plasma protein binding displacement and its implications for quantitative assessment of metabolic drug-drug interactions from in vitro data. J. Pharm. Sci. 2006, 95, 2778–2787. [Google Scholar] [CrossRef]
- McElnay, J.C.; D’Arcy, P.F. Protein binding displacement interactions and their clinical importance. Drugs 1983, 25, 494–513. [Google Scholar] [CrossRef] [PubMed]
- O’Reilly, R.A.; Goulart, D.A. Comparative interaction of sulfinpyrazone and phenylbutazone with racemic warfarin: Alteration in vivo of free fraction of plasma warfarin. J. Pharmacol. Exp. Ther. 1982, 219, 691–694. [Google Scholar]
- Perucca, E.; Hebdige, S.; Frigo, G.M.; Gatti, G.; Lecchini, S.; Crema, A. Interaction between phenytoin and valproic acid: Plasma protein binding and metabolic effects. Clin. Pharmacol. Ther. 1980, 28, 779–789. [Google Scholar] [CrossRef]
- Sekhon, B.S. Exploiting the power of stereochemistry in drugs: An overview of racemic and enantiopure drugs. J. Mod. Med. Chem. 2013, 1, 10–36. [Google Scholar] [CrossRef] [Green Version]
- Silva, B.; Fernandes, C.; Guedes de Pinho, P.; Remião, F. Chiral Resolution and Enantioselectivity of Synthetic Cathinones: A Brief Review. J. Anal. Toxicol. 2018, 42, 17–24. [Google Scholar] [CrossRef] [PubMed]
- Smith, S.W. Chiral toxicology: It’s the same thing only different. Toxicol. Sci. 2009, 110, 4–30. [Google Scholar] [CrossRef]
- Coelho, M.M.; Fernandes, C.; Remião, F.; Tiritan, M.E. Enantioselectivity in drug pharmacokinetics and toxicity: Pharmacological relevance and analytical methods. Molecules 2021, 26, 3113. [Google Scholar] [CrossRef] [PubMed]
- Fernandes, C.; Carraro, M.L.; Ribeiro, J.; Araújo, J.; Tiritan, M.E.; Pinto, M.M.M. Synthetic chiral derivatives of xanthones: Biological activities and enantioselectivity studies. Molecules 2019, 24, 791. [Google Scholar] [CrossRef] [Green Version]
- Mannschreck, A.; Kiesswetter, R.; von Angerer, E. Unequal activities of enantiomers via biological receptors: Examples of chiral drug, pesticide, and fragrance molecules. J. Chem. Ed. 2007, 84, 2012–2017. [Google Scholar] [CrossRef]
- Tiritan, M.E.; Ribeiro, A.R.; Fernandes, C.; Pinto, M. Chiral Pharmaceuticals. Kirk-Othmer Encyclopedia of Chemicl Technology; John Wiley & Sons, Inc.: Hoboken, NJ, USA, 2016. [Google Scholar]
- Shen, Q.; Wang, L.; Zhou, H.; Jiang, H.D.; Yu, L.S.; Zeng, S. Stereoselective binding of chiral drugs to plasma proteins. Acta Pharmacol. Sin. 2013, 34, 998–1006. [Google Scholar] [CrossRef] [Green Version]
- Chuangl, V.T.G.; Otagiri, M. Stereoselective binding of human serum albumin. Chirality 2006, 18, 159–166. [Google Scholar] [CrossRef]
- Zielinski, K.; Sekula, B.; Bujacz, A.; Szymczak, I. Structural investigations of stereoselective profen binding by equine and leporine serum albumins. Chirality 2020, 32, 334–344. [Google Scholar] [CrossRef]
- Liu, C.; Guo, J.; Cui, F. Study on the stereoselective binding of cytosine nucleoside enantiomers to human serum albumin. Spectrochim. Acta Part A Mol. Biomol. Spectrosc. 2020, 224, 117452. [Google Scholar] [CrossRef] [PubMed]
- Mu, H.; Chen, S.; Liu, F.; Xiao, J.; Huang, H.; Zhang, Y.; Sun, Y.; Gao, X.; Lei, H.; Yuan, X. Stereoselective interactions of lactic acid enantiomers with HSA: Spectroscopy and docking application. Food Chem. 2019, 270, 429–435. [Google Scholar] [CrossRef]
- Li, H.; Xu, Q.; Zheng, X.L.; Xu, H.; Chen, G.; Meng, Q.G. Study of Stereoselective Interaction Between Ginsenoside Rh2 and Serum Albumin by Spectroscopic Methods and Molecular Docking. Spectrosc. Spectr. Anal. 2018, 38, 3839–3845. [Google Scholar]
- Gellad, W.F.; Choi, P.; Mizah, M.; Good, C.B.; Kesselheim, A.S. Assessing the chiral switch: Approval and use of single-enantiomer drugs, 2001 to 2011. Am. J. Manag. Care 2014, 20, e90–e97. [Google Scholar] [PubMed]
- Calcaterra, A.; D’Acquarica, I. The market of chiral drugs: Chiral switches versus de novo enantiomerically pure compounds. J. Pharm. Biomed. Anal. 2018, 147, 323–340. [Google Scholar] [CrossRef]
- FDA. FDA’s policy statement for the development of new stereoisomeric drugs. 57 Fed. Reg. 1992, 22, 249. [Google Scholar]
- Investigation of Chiral Active Substances. Directive 75/318/EEC. 1993. Available online: https://www.ema.europa.eu/en/documents/scientific-guideline/investigation-chiral-active-substances_en.pdf (accessed on 14 September 2021).
- Ball-Jones, N.R.; Badillo, J.J.; Franz, A.K. Strategies for the enantioselective synthesis of spirooxindoles. Org. Biomol. Chem. 2012, 10, 5165–5181. [Google Scholar] [CrossRef] [PubMed]
- Borie, C.; Ackermann, L.; Nechab, M. Enantioselective syntheses of indanes: From organocatalysis to C-H functionalization. Chem. Soc. Rev. 2016, 45, 1368–1386. [Google Scholar] [CrossRef]
- Quasdorf, K.W.; Overman, L.E. Catalytic enantioselective synthesis of quaternary carbon stereocentres. Nature 2014, 516, 181–191. [Google Scholar] [CrossRef]
- Wang, W.; Liu, X.; Lin, L.; Feng, X. Recent Progress in the Chemically Catalyzed Enantioselective Synthesis of Cyanohydrins. Euro. J. Org. Chem. 2010, 2010, 4751–4769. [Google Scholar] [CrossRef]
- Ribeiro, A.R.; Maia, A.S.; Cass, Q.B.; Tiritan, M.E. Enantioseparation of chiral pharmaceuticals in biomedical and environmental analyses by liquid chromatography: An overview. J. Chromatogr. B 2014, 968, 8–21. [Google Scholar] [CrossRef]
- Pinto, M.M.M.; Fernandes, C.; Tiritan, M.E. Chiral separations in preparative scale: A medicinal chemistry point of view. Molecules 2020, 25, 1931. [Google Scholar] [CrossRef] [PubMed]
- Fernandes, C.; Tiritan, M.E.; Pinto, M.M.M. Chiral separation in preparative scale: A brief overview of membranes as tools for enantiomeric separation. Symmetry 2017, 9, 206. [Google Scholar] [CrossRef] [Green Version]
- Agranat, I.; Wainschtein, S.R. The strategy of enantiomer patents of drugs. Drug Discov. Today 2010, 15, 163–170. [Google Scholar] [CrossRef] [PubMed]
- Agranat, I.; Caner, H.; Caldwell, J. Putting chirality to work: The strategy of chiral switches. Nat. Rev. Drug Discov. 2002, 1, 753–768. [Google Scholar] [CrossRef] [PubMed]
- Caner, H.; Groner, E.; Levy, L.; Agranat, I. Trends in the development of chiral drugs. Drug Discov. Today 2004, 9, 105–110. [Google Scholar]
- Brocks, D.R. Drug disposition in three dimensions: An update on stereoselectivity in pharmacokinetics. Biopharm. Drug Dispos. 2006, 27, 387–406. [Google Scholar] [CrossRef]
- Kratochwil, N.A.; Huber, W.; Francis, M.; Kansy, M.; Gerber, P.R. Predicting plasma protein binding of drugs: A new approach. Biochem. Pharmacol. 2002, 64, 1355–1374. [Google Scholar] [CrossRef]
- Fournier, T.; Medjoubi-n, N.; Porquet, D. Alpha-1-acid glycoprotein. Biochim. Biophys. Acta 2000, 1482, 157–171. [Google Scholar] [CrossRef]
- Carter, D.C.; Ho, J.X. Structure of serum albumin. Adv. Protein Chem. 1994, 45, 153–203. [Google Scholar]
- Lambrinidis, G.; Vallianatou, T.; Tsantili-Kakoulidou, A. In Vitro, in silico and integrated strategies for the estimation of plasma protein binding. A review. Adv. Drug Deliv. Rev. 2015, 86, 27–45. [Google Scholar] [CrossRef]
- Bi, C.; Zheng, X.; Azaria, S.; Beeram, S.; Li, Z.; Hage, D.S. Chromatographic studies of protein-based chiral separations. Separations 2016, 3, 27. [Google Scholar] [CrossRef] [PubMed] [Green Version]
- Dos Santos, R.; Figueiredo, C.; Viecinski, A.C.; Pina, A.S.; Barbosa, A.J.M.; Roque, A.C.A. Designed affinity ligands to capture human serum albumin. J. Chromatogr. A 2019, 1583, 88–97. [Google Scholar] [CrossRef] [PubMed]
- More, J.; Bulmer, M. Human serum albumin: A multifunctional plasma protein. In Production of Plasma Proteins for Therapeutic Use; 2013; pp. 159–183. [Google Scholar]
- Ascenzi, P.; Bocedi, A.; Notari, S.; Fanali, G.; Fesce, R.; Fasano, M. Allosteric modulation of drug binding to human serum albumin. Mini-Rev. Med. Chem. 2006, 6, 483–489. [Google Scholar] [CrossRef] [PubMed]
- Ghuman, J.; Zunszain, P.A.; Petitpas, I.; Bhattacharya, A.A.; Otagiri, M.; Curry, S. Structural basis of the drug-binding specificity of human serum albumin. J. Mol. Biol. 2005, 353, 38–52. [Google Scholar] [CrossRef]
- He, X.M.; Carter, D.C. Atomic structure and chemistry of human serum albumin. Nature 1992, 358, 209–215. [Google Scholar] [CrossRef] [PubMed] [Green Version]
- Curry, S.; Brick, P.; Franks, N.P. Fatty acid binding to human serum albumin: New insights from crystallographic studies. Biochim. Biophys. Acta Mol. Cell Biol. Lipids 1999, 1441, 131–140. [Google Scholar] [CrossRef]
- Evans, T.W. Review article: Albumin as a drug—Biological effects of albumin unrelated to oncotic pressure. Aliment Pharmacol. Ther. Suppl. 2002, 16, 6–11. [Google Scholar] [CrossRef]
- Gupta, D.; Lis, C.G. Pretreatment serum albumin as a predictor of cancer survival: A systematic review of the epidemiological literature. Nutr. J. 2010, 9, 69. [Google Scholar] [CrossRef] [Green Version]
- Sbarouni, E.; Georgiadou, P.; Voudris, V. Ischemia modified albumin changes—Review and clinical implications. Clin. Chem. Lab. Med. 2011, 49, 177–184. [Google Scholar] [CrossRef]
- Koga, M.; Kasayama, S. Clinical impact of glycated albumin as another glycemic control marker. Endocr. J. 2010, 57, 751–762. [Google Scholar] [CrossRef] [Green Version]
- Zorzi, A.; Linciano, S.; Angelini, A. Non-covalent albumin-binding ligands for extending the circulating half-life of small biotherapeutics. Med. Chem. Comm. 2019, 10, 1068–1081. [Google Scholar] [CrossRef]
- Fanali, G.; di Masi, A.; Trezza, V.; Marino, M.; Fasano, M.; Ascenzi, P. Human serum albumin: From bench to bedside. Mol. Aspects Med. 2012, 33, 209–290. [Google Scholar] [CrossRef]
- Elsadek, B.; Kratz, F. Impact of albumin on drug delivery--new applications on the horizon. J. Control. Release 2012, 157, 4–28. [Google Scholar] [CrossRef] [PubMed]
- Wanat, K.; Brzezińska, E.; Sobańska, A.W. Aspects of drug-protein binding and methods of analyzing the phenomenon. Curr. Pharm. Des. 2018, 24, 2974–2985. [Google Scholar] [CrossRef] [PubMed]
- Vuignier, K.; Schappler, J.; Veuthey, J.L.; Carrupt, P.A.; Martel, S. Drug-protein binding: A critical review of analytical tools. Anal. Bioanal. Chem. 2010, 398, 53–66. [Google Scholar] [CrossRef]
- Howard, M.L.; Hill, J.J.; Galluppi, G.R.; McLean, M.A. Plasma protein binding in drug discovery and development. Comb. Chem. High Throughput Screen. 2010, 13, 170–187. [Google Scholar] [CrossRef]
- Hage, D.S.; Anguizola, J.A.; Bi, C.; Li, R.; Matsuda, R.; Papastavros, E.; Pfaunmiller, E.; Vargas, J.; Zheng, X. Pharmaceutical and biomedical applications of affinity chromatography: Recent trends and developments. J. Pharm. Biomed. Anal. 2012, 69, 93–105. [Google Scholar] [CrossRef] [PubMed] [Green Version]
- Siddiqui, S.; Ameen, F.; ur Rehman, S.; Sarwar, T.; Tabish, M. Studying the interaction of drug/ligand with serum albumin. J. Mol. Liq. 2021, 336, 116200. [Google Scholar] [CrossRef]
- Cheng, Y.; Ho, E.; Subramanyam, B.; Tseng, J.L. Measurements of drug-protein binding by using immobilized human serum albumin liquid chromatography-mass spectrometry. J. Chromatogr. B 2004, 809, 67–73. [Google Scholar] [CrossRef] [PubMed]
- Banker, M.J.; Clark, T.H.; Williams, J.A. Development and validation of a 96-well equilibrium dialysis apparatus for measuring plasma protein binding. J. Pharm. Sci. 2003, 92, 967–974. [Google Scholar] [CrossRef] [PubMed]
- Wan, H.; Rehngren, M. High-throughput screening of protein binding by equilibrium dialysis combined with liquid chromatography and mass spectrometry. J. Chromatogr. A. 2006, 1102, 125–134. [Google Scholar] [CrossRef] [PubMed]
- Singh, S.S.; Mehta, J. Measurement of drug-protein binding by immobilized human serum albumin-HPLC and comparison with ultrafiltration. J. Chromatogr. B 2006, 834, 108–116. [Google Scholar] [CrossRef] [PubMed]
- Vuignier, K.; Guillarme, D.; Veuthey, J.L.; Carrupt, P.A.; Schappler, J. High performance affinity chromatography (HPAC) as a high-throughput screening tool in drug discovery to study drug-plasma protein interactions. J. Pharm. Biomed. Anal. 2013, 74, 205–212. [Google Scholar] [CrossRef] [PubMed]
- Kim, H.S.; Kye, Y.S.; Hage, D.S. Development and evaluation of N-hydroxysuccinimide-activated silica for immobilizing human serum albumin in liquid chromatography columns. J. Chromatogr. A. 2004, 1049, 51–61. [Google Scholar] [CrossRef]
- Kim, H.S.; Wainer, I.W. Rapid analysis of the interactions between drugs and human serum albumin (HSA) using high-performance affinity chromatography (HPAC). J. Chromatogr. B 2008, 870, 22–26. [Google Scholar] [CrossRef] [Green Version]
- Loun, B.; Hage, D.S. Thermodynamic studies of (R)- and (S)-warfarin binding to immobilized human serum albumin. Chiral separation mechanisms in protein-based HPLC columns. 661994. Anal. Chem. 1994, 66, 3814–3822. [Google Scholar] [CrossRef] [PubMed]
- Loun, B.; Hage, D.S. Kinetic studies of (R)- and (S)-warfarin binding to immoblized human serum albumin. Chiral separation mechanisms in protein-based HPLC columns. 681996. Anal. Chem. 1994, 66, 1218–1225. [Google Scholar] [CrossRef]
- Patel, S.; Wainer, I.W.; Lough, W. Affinity based chiral stationary phases. In Handbook of Affinity Chromatography; CRC: Boca Raton, FL, USA, 2006. [Google Scholar]
- Aubry, A.F.; Markoglou, N.; McGann, A. Comparison of drug binding interactions on human, rat and rabbit serum albumin using high-performance displacement chromatography. Comp. Biochem. Physiol. Part C Pharmacol. Toxicol. Endocrinol. 1995, 112, 257–266. [Google Scholar] [CrossRef]
- Esmaeilzadeh, S.; Valizadeh, H.; Zakeri-Milani, P. The effects of pH, temperature and protein concentration on the in vitro binding of flutamide to human serum albumin. Pharm. Dev. Technol. 2017, 22, 982–991. [Google Scholar] [CrossRef]
- Ashton, D.S.; Beddell, C.; Ray, A.D.; Valkό, K. Quantitative structure-retention relationships of acyclovir esters using immobilised albumin high-performance liquid chromatography and reversed-phase high-performance liquid chromatography. J. Chromatogr. A 1995, 707, 367–372. [Google Scholar] [CrossRef]
- Lämmerhofer, M. Chiral recognition by enantioselective liquid chromatography: Mechanisms and modern chiral stationary phases. J. Chromatogr. A 2010, 1217, 814–856. [Google Scholar] [CrossRef] [PubMed]
- Scriba, G.K.E. Chiral recognition mechanisms in analytical separation sciences. Chromatographia 2012, 75, 815–838. [Google Scholar] [CrossRef]
- Haginaka, J. Protein-based chiral stationary phases for high-performance liquid chromatography enantioseparations. J. Chromatogr. A 2001, 906, 253–273. [Google Scholar] [CrossRef]
- Stewart, K.K.; Doherty, R.F. Resolution of DL-tryptophan by affinity chromatography on bovine serum albumin agarose columns. Proc. Natl. Acad. Sci. USA 1973, 70, 2850–2852. [Google Scholar] [CrossRef] [PubMed] [Green Version]
- Allenmark, S.; Bomgren, B.; Borén, H. Direct liquid chromatographic separation of enantiomers on immobilized protein stationary phases. III. Optical resolution of a series of N-aroyl d,l-amino acids by high-performance liquid chromatography on bovine serum albumin covalently bound to silica. J. Chromatogr. A 1983, 264, 63–68. [Google Scholar] [CrossRef]
- Cavazzini, A.; Pasti, L.; Massi, A.; Marchetti, N.; Dondi, F. Recent applications in chiral high performance liquid chromatography: A review. Anal. Chim. Acta 2011, 706, 205–222. [Google Scholar] [CrossRef]
- Haginaka, J. Recent progresses in protein-based chiral stationary phases for enantioseparations in liquid chromatography. J. Chromatogr. B 2008, 875, 12–19. [Google Scholar] [CrossRef]
- Teixeira, J.; Tiritan, M.E.; Pinto, M.M.M.; Fernandes, C. Chiral stationary phases for liquid chromatography: Recent developments. Molecules 2019, 24, 865. [Google Scholar]
- Millot, M.C. Separation of drug enantiomers by liquid chromatography and capillary electrophoresis, using immobilized proteins as chiral selectors. J. Chromatogr. B 2003, 797, 131–159. [Google Scholar] [CrossRef]
- Bocian, S.; Skoczylas, M.; Buszewski, B. Amino acids, peptides, and proteins as chemically bonded stationary phases—A review. J. Sep. Sci. 2016, 39, 83–92. [Google Scholar]
- Anderson, J.; Berthod, A.; Pino, V.; Stalcup, A.M. Analytical Separation Science; Wiley: Hoboken, NJ, USA, 2016; Volume 5. [Google Scholar]
- Millot, M.C.; Servagent-Noinville, S.; Taleb, N.L.; Baron, M.H.; Revault, M.; Sébiller, B. Structural changes of human serum albumin immobilized on chromatographic supports: A high-performance liquid chromatography and Fourier-transform infrared spectroscopy study. J. Chromatogr. B Biomed. Sci. Appl. 2001, 753, 101–113. [Google Scholar] [CrossRef]
- Do Carmo, J.P.; Phyo, Y.Z.; Palmeira, A.; Tiritan, M.E.; Afonso, C.; Kijjoa, A. Enantioseparation, recognition mechanisms and binding of xanthones on human serum albumin by liquid chromatography. Bioanalysis 2019, 11, 1255–1274. [Google Scholar] [CrossRef] [PubMed]
- Kamble, S.; Loadman, P.; Abraham, M.H.; Liu, X. Structural properties governing drug-plasma protein binding determined by high-performance liquid chromatography method. J. Pharm. Biomed. Anal. 2018, 149, 16–21. [Google Scholar] [CrossRef] [PubMed] [Green Version]
- Hage, D.S. High-performance affinity chromatography: A powerful tool for studying serum protein binding. J. Chromatogr. B 2002, 768, 3–30. [Google Scholar] [CrossRef]
- Shibukawa, A.; Kuroda, Y.; Nakagawa, T. High-performance frontal analysis for drug-protein binding study. J. Pharm. Biomed. Anal. 1999, 18, 1047–1055. [Google Scholar] [CrossRef]
- Bertucci, C.; Domenici, E. Reversible and Covalent Binding of Drugs to Human Serum Albumin: Methodological Approaches and Physiological Relevance. Curr. Med. Chem. 2002, 9, 1463–1481. [Google Scholar]
- Cass, Q.B.; Degani, A.L.G. Desenvolvimento de Métodos por HPLC: Fundamentos, Estratégias e Validação; Editora da UFCar: São Carlos, Brazil, 2001. [Google Scholar]
- Talbert, A.M.; Tranter, G.E.; Holmes, E.; Francis, P.L. Determination of Drug-plasma Protein Binding Kinetics and Equilibria by Chromatographic Profiling: Exemplification of the Method Using L-Tryptophan and Albumin. Anal. Chem. 2002, 74, 446–452. [Google Scholar]
- Noctor, T.A.G.; Pham, C.D.; Kaliszan, R.; Wainer, I.W. Stereochemical aspects of benzodiazepine binding to human serum albumin. I. Enantioselective high performance liquid affinity chromatographic examination of chiral and achiral binding interactions between 1,4- benzodiazepines and human serum albumin. Mol. Pharmacol. 1992, 42, 506–511. [Google Scholar]
- Kaliszan, R.; Noctor, T.A.G.; Wainer, I.W. Stereochemical aspects of benzodiazepine binding to human serum albumin. II. Quantitative relationships between structure and enantioselective retention in high performance liquid affinity chromatography. Mol. Pharmacol. 1992, 42, 512–517. [Google Scholar]
- Hage, D.S.; Noctor, T.A.G.; Wainer, I.W. Characterization of the protein binding of chiral drugs by high-performance affinity chromatography interactions of R- and S-ibuprofen with human serum albumin. J. Chromatogr. A 1995, 693, 23–32. [Google Scholar]
- Yang, J.; Hage, D.S. Characterization of the binding and chiral separation of d- and l-tryptophan on a high-performance immobilized human serum albumin column. J. Chromatogr. A 1993, 645, 241–250. [Google Scholar] [CrossRef]
- Loun, B.; Hage, D.S. Characterization of thyroxine-albumin binding using high-performance affinity chromatography. I. Interactions at the warfarin and indole sites of albumin. J. Chromatogr. B Biomed. Sci. Appl. 1992, 579, 225–235. [Google Scholar] [CrossRef]
- Loun, B.; Hage, D.S. Characterization of thyroxine-albumin binding using high-performance affinity chromatography II. Comparison of the binding of thyroxine, triiodothyronines and related compounds at the warfarin and indole sites of human serum albumin. J. Chromatogr. B Biomed. Sci. Appl. 1995, 665, 303–314. [Google Scholar] [CrossRef]
- Pistolozzi, M.; Fortugno, C.; Franchini, C.; Corbo, F.; Muraglia, M.; Roy, M.; Felix, G.; Bertucci, C. Species-dependent binding of tocainide analogues to albumin: Affinity chromatography and circular dichroism study. J. Chromatogr. B 2014, 968, 69–78. [Google Scholar] [CrossRef] [PubMed]
- Yoo, M.J.; Smith, Q.R.; Hage, D.S. Studies of imipramine binding to human serum albumin by high-performance affinity chromatography. J. Chromatogr. B 2009, 877, 1149–1154. [Google Scholar] [CrossRef] [Green Version]
- Matsuda, R.; Jobe, D.; Beyersdorf, J.; Hage, D.S. Analysis of drug-protein binding using on-line immunoextraction and high-performance affinity microcolumns: Studies with normal and glycated human serum albumin. J. Chromatogr. A 2015, 1416, 112–120. [Google Scholar] [CrossRef] [Green Version]
- Matsuda, R.; Li, Z.; Zheng, X.; Hage, D.S. Analysis of glipizide binding to normal and glycated human serum albumin by high-performance affinity chromatography. Anal. Bioanal. Chem. 2015, 407, 5309–5321. [Google Scholar] [CrossRef]
- Tao, P.; Li, Z.; Woolfork, A.G.; Hage, D.S. Characterization of tolazamide binding with glycated and normal human serum albumin by using high-performance affinity chromatography. J. Pharm. Biomed. Anal. 2019, 166, 273–280. [Google Scholar] [CrossRef]
- Chen, J.; Ohnmacht, C.; Hage, D.S. Studies of phenytoin binding to human serum albumin by high-performance affinity chromatography. J. Chromatogr. B 2004, 809, 137–145. [Google Scholar] [CrossRef]
- Bertucci, C.; Pistolozzi, M.; Felix, G.; Danielson, U.H. HSA binding of HIV protease inhibitors: A high-performance affinity chromatography study. J. Sep. Sci. 2009, 32, 1625–1631. [Google Scholar] [CrossRef]
- Buchholz, L.; Cai, C.-H.; Andress, L.; Cleton, A.; Brodfuehrer, J.; Cohen, L. Evaluation of the human serum albumin column as a discovery screening tool for plasma protein binding. Euro. J. Pharm. Sci. 2002, 15, 209–215. [Google Scholar] [CrossRef]
- Valko, K.; Nunhuck, S.; Bevan, C.; Abraham, M.H.; Reynolds, D.P. Fast Gradient HPLC Method to Determine Compounds Binding to Human Serum Albumin. Relationships with Octanol/Water and Immobilized Artificial Membrane Lipophilicity. J. Chromatogr. B 2003, 877, 2236–2248. [Google Scholar] [CrossRef] [PubMed]
- Tong, Z.; Hage, D.S. Characterization of interaction kinetics between chiral solutes and human serum albumin by using high-performance affinity chromatography and peak profiling. J. Chromatogr. A 2011, 1218, 6892–6897. [Google Scholar] [CrossRef] [PubMed] [Green Version]
- Cao, H.; Liu, X.; Ulrih, N.P.; Sengupta, P.K.; Xiao, J. Plasma protein binding of dietary polyphenols to human serum albumin: A high performance affinity chromatography approach. Food Chem. 2019, 270, 257–263. [Google Scholar] [CrossRef] [PubMed]
- Bertucci, C.; Cimitan, S.; Riva, A.; Morazzoni, P. Binding studies of taxanes to human serum albumin by bioaffinity chromatography and circular dichroism. J. Pharm. Biomed. Anal. 2006, 42, 81–87. [Google Scholar] [CrossRef]
- Pistolozzi, M.; Franchini, C.; Corbo, F.; Muraglia, M.; De Giorgi, M.; Felix, G.; Bertucci, C. Tocainide analogues binding to human serum albumin: A HPLAC and circular dichroism study. J. Pharm. Biomed. Anal. 2010, 53, 179–185. [Google Scholar] [CrossRef] [PubMed]
- Claire, A.; Lethier, L.; Guillaume, Y.C. An organic monolithic capillary column functionalized with human serum albumin and its application for the nano—Chromatography study of its binding with universal cancer peptides and its impact on immunogenicity. J. Liq. Chromatogr. Relat. Technol. 2020, 43, 777–783. [Google Scholar] [CrossRef]
- Rodriguez, E.L.; Poddar, S.; Choksi, M.; Hage, D.S. Development of an on-line immunoextraction/entrapment system for protein capture and use in drug binding studies by high-performance affinity chromatography. J. Chromatogr. B 2020, 1136, 121812. [Google Scholar] [CrossRef]
- Ovbude, S.T.; Tao, P.; Li, Z.; Hage, D.S. High-Performance affinity chromatographic studies of repaglinide and nateglinide interactions with normal and glyoxal- or methylglyoxal-modified human albumin serum. J. Pharm. Biomed. Anal. 2021, 201, 114097. [Google Scholar] [CrossRef]
- Woolfork, A.G.; Suh, K.; Weigand, M.; Hage, D.S. Studies of binding by 2-imidazolines to human serum albumin and alpha1-acid glycoprotein by high-performance affinity chromatography. J. Pharm. Biomed. Anal. 2021, 202, 114135. [Google Scholar] [CrossRef]
- Fernandes, C.; Teixeira, J.; Pinto, M.M.M.; Tiritan, M.E. Strategies for Preparation of Chiral Stationary Phases: Progress on Coating and Immobilization Methods. Molecules 2021, 26, 5477. [Google Scholar] [CrossRef]
- Matsuda, R.; Anguizola, J.; Hoy, K.S.; Hage, D.S. Analysis of drug–protein interactions by high-performance affinity chromatography: Interactions of sulfonylurea drugs with normal and glycated human serum albumin. In Methods in Molecular Biology; Humana Press Inc.: Totowa, NJ, USA, 2015; pp. 255–277. [Google Scholar]
- Anguizola, J.; Joseph, K.S.; Barnaby, O.S.; Matsuda, R.; Alvarado, G.; Clarke, W.; Cerny, R.L.; Hage, D.S. Development of affinity microcolumns for drug-protein binding studies in personalized medicine: Interactions of sulfonylurea drugs with in vivo glycated human serum albumin. Anal. Chem. 2013, 85, 4453–4460. [Google Scholar] [CrossRef] [PubMed] [Green Version]
- Zheng, X.; Li, Z.; Beeram, S.; Podariu, M.; Matsuda, R.; Pfaunmiller, E.L.; Ii, C.J.W.; Carter, N.; Hage, D.S. Analysis of biomolecular interactions using affinity microcolumns: A review. J. Chromatogr. B 2014, 968, 49–63. [Google Scholar] [CrossRef] [Green Version]
- Daicel-Corporation. INSTRUCTION MANUAL FOR CHIRALPAK® HAS. 2018. Available online: http://chiraltech.com/wp-content/uploads/2018/09/CHIRALPAK-HSA-2018.pdf (accessed on 14 September 2021).
- Bertucci, C.; Tedesco, D. Human serum albumin as chiral selector in enantioselective high-performance liquid chromatography. Curr. Med. Chem. 2017, 24, 743–757. [Google Scholar] [CrossRef] [PubMed]
- Eberherr, W.; Buchberger, W.; Hertsens, R.; Klampfl, C.W. Investigations on the Coupling of High-Performance Liquid Chromatography to Direct Analysis in Real Time Mass Spectrometry. Anal. Chem. 2010, 82, 5792–5796. [Google Scholar] [CrossRef]
- Mallik, R.; Jiang, T.; Hage, D.S. High-performance affinity monolith chromatography: Development and evaluation of human serum albumin columns. Anal. Chem. 2005, 76, 7013–7022. [Google Scholar] [CrossRef]
- Maddi, S.; Scriba, G.; Yamsani, M.R. Stereoselective binding of chiral anti-diabetic drug nateglinide to plasma proteins. Drug Metabol. Drug Interact. 2011, 26, 81–86. [Google Scholar] [CrossRef]
- Haginaka, J. Enantiomer separation of drugs by capillary electrophoresis using proteins as chiral selectors. J. Chromatogr. A 2000, 875, 235–254. [Google Scholar] [CrossRef]
- Hancu, G.; Orlandini, S.; Papp, L.A.; Modroiu, A.; Gotti, R.; Furlanetto, S. Application of Experimental Design Methodologies in the Enantioseparation of Pharmaceuticals by Capillary Electrophoresis: A Review. Molecules 2021, 26, 4681. [Google Scholar] [CrossRef] [PubMed]
- Albishri, H.M.; El Deeb, S.; AlGarabli, N.; AlAstal, R.; A Alhazmi, H.; Nachbar, M.; El-Hady, D.A.; Wätzig, H. Recent advances in affinity capillary electrophoresis for binding studies. Bioanalysis 2014, 6, 3369–3392. [Google Scholar] [CrossRef] [PubMed]
- Chu, Y.H.; Avila, L.Z.; Biebuyck, H.A.; Whitesides, G.M. Use of affinity capillary electrophoresis to measure binding constants of ligands to proteins. J. Med. Chem. 1992, 35, 2915–2917. [Google Scholar] [CrossRef]
- Olabi, M.; Stein, M.; Wätzig, H. Affinity capillary electrophoresis for studying interactions in life sciences. Methods 2018, 146, 76–92. [Google Scholar] [CrossRef]
- El-Hady, D.; Kühne, S.; El-Maali, N.; Wätzig, H. Precision in affinity capillary electrophoresis for drug-protein binding studies. J. Pharm. Biomed. Anal. 2010, 52, 232–241. [Google Scholar] [CrossRef]
- Zhu, X.; Ding, Y.; Lin, B.; Jakob, A.; Koppenhoefer, B. Study of enantioselective interactions between chiral drugs and serum albumin by capillary electrophoresis. Electrophoresis 1999, 20, 1869–1877. [Google Scholar] [CrossRef]
- Yang, J.; Hage, D.S. Chiral separations in capillary electrophoresis using human serum albumin as a buffer additive. Anal. Chem. 1994, 66, 2719–2725. [Google Scholar] [CrossRef]
- Ding, Y.; Zhu, X.; Lin, B. Study of interaction between drug enantiomers and serum albumin by capillary electrophoresis. Electrophoresis 1999, 20, 1890–1894. [Google Scholar] [CrossRef]
- Ding, Y.S.; Zhu, X.F.; Lin, B.C. Capillary electrophoresis study of human serum albumin binding to basic drugs. Chromatographia 1999, 49, 343–346. [Google Scholar] [CrossRef]
- Jia, Z.; Ramstad, T.; Zhong, M. Determination of protein-drug binding constants by pressure-assisted capillary electrophoresis (PACE)/frontal analysis (FA). J. Pharm. Biomed. Anal. 2002, 30, 405–413. [Google Scholar] [CrossRef]
- Kim, H.S.; Austin, J.; Hage, D.S. Identification of drug-binding sites on human serum albumin using affinity capillary electrophoresis and chemically modified proteins as buffer additives. Electrophoresis 2002, 23, 956–963. [Google Scholar] [CrossRef]
- Scriba, G.K.E.; Harnisch, H.; Zhu, Q. Enantiomer separations by capillary electrophoresis. In Methods in Molecular Biology; Humana Press Inc.: Totowa, NJ, USA, 2016; pp. 277–299. [Google Scholar]
- Xu, H.; Yu, X.; Chen, H. Enantiomeric separation of basic drugs with partially filled serum albumin as chiral selector in capillary electrophoresis. Anal. Sci. 2004, 20, 1409–1413. [Google Scholar] [CrossRef] [Green Version]
- Liu, X.; Song, Y.; Yue, Y.; Zhang, J.; Chen, X. Study of interaction between drug enantiomers and human serum albumin by flow injection-capillary electrophoresis frontal analysis. Electrophoresis 2008, 29, 2876–2883. [Google Scholar] [CrossRef] [PubMed]
- Martínez-Gómez, M.A.; Escuder-Gilabert, L.; Villanueva-Camañas, R.M.; Sagrado, S.; Medina-Hernández, M.J. Enantioseparation of nuarimol by affinity electrokinetic chromatography-partial filling technique using human serum albumin as chiral selector. J. Sep. Sci. 2008, 31, 3265–3271. [Google Scholar] [CrossRef]
- Asensi-Bernardi, L.; Martin-Biosca, Y.; Escuder-Gilabert, L.; Sagrado, S.; Medina-Hernandez, M.J. Evaluation of the enantioselective binding of imazalil to human serum albumin by capillary electrophoresis. Biomed. Chromatogr. 2015, 29, 1637–1642. [Google Scholar] [CrossRef]
- Xu, Y.; Hong, T.; Chen, X.; Ji, Y. Affinity capillary electrophoresis and fluorescence spectroscopy for studying enantioselective interactions between omeprazole enantiomer and human serum albumin. Electrophoresis 2017, 38, 1366–1373. [Google Scholar] [CrossRef]
- Ratih, R.; Watzig, H.; Stein, M.; El Deeb, S. Investigation of the enantioselective interaction between selected drug enantiomers and human serum albumin by mobility shift-affinity capillary electrophoresis. J. Sep. Sci. 2020, 43, 3960–3968. [Google Scholar] [CrossRef]
- Zhao, L.; Chen, D. Characterization of interactions between methoxatin disodium salt and human serum albumin by pressure-assisted capillary electrophoresis/frontal analysis and circular dichroism spectroscopy. Biomed. Chromatogr. 2015, 29, 123–128. [Google Scholar] [CrossRef]
- Liu, T.T.; Xiang, L.L.; Wang, J.L.; Chen, D.Y. Application of capillary electrophoresis-frontal analysis for comparative evaluation of the binding interaction of captopril with human serum albumin in the absence and presence of hydrochlorothiazide. J. Pharm. Biomed. Anal. 2015, 115, 31–35. [Google Scholar] [CrossRef]
- Zhang, Y.; Sha, Y.; Qian, K.; Chen, X.; Chen, Q. Comparison of three methods for analyzing loureirin B and human serum albumin interaction using capillary electrophoresis. Electrophoresis 2017, 38, 1038–1043. [Google Scholar] [CrossRef]
- Nevídalová, H.; Michalcová, L.; Glatz, Z. Applicability of capillary electrophoresis-frontal analysis for displacement studies: Effect of several drugs on l-tryptophan and lidocaine binding to human serum albumin. J. Sep. Sci. 2020, 43, 4225–4233. [Google Scholar] [CrossRef]
- Martínez-Gómez, M.A.; Villanueva-Camañas, R.M.; Sagrado, S.; Medina-Hernández, M.J. Evaluation of enantioselective binding of antihistamines to human serum albumin by ACE. Electrophoresis 2007, 28, 2635–2643. [Google Scholar] [CrossRef]
- Asensi-Bernardi, L.; Martin-Biosca, Y.; Medina-Hernandez, M.J.; Sagrado, S. On the zopiclone enantioselective binding to human albumin and plasma proteins. An electrokinetic chromatography approach. J. Chromatogr. A 2011, 1218, 3111–3117. [Google Scholar] [CrossRef]
- Asensi-Bernardi, L.; Martin-Biosca, Y.; Sagrado, S.; Medina-Hernandez, M.J. Electrokinetic chromatographic estimation of the enantioselective binding of nomifensine to human serum albumin and total plasma proteins. Biomed. Chromatogr. 2012, 26, 1357–1363. [Google Scholar] [CrossRef] [PubMed]
- Fernandes, C.; Palmeira, A.; Ramos, I.I.; Carneiro, C.; Afonso, C.; Tiritan, M.E.; Cidade, H.; Pinto, P.C.A.G.; Saraiva, M.L.M.F.S.; Reis, R. Chiral derivatives of xanthones: Investigation of the effect of enantioselectivity on inhibition of cyclooxygenases (COX-1 and COX-2) and binding interaction with human serum albumin. Pharmaceuticals 2017, 10, 50. [Google Scholar] [CrossRef] [Green Version]
- Meng, X.-Y.; Zhang, H.-X.; Mezei, M.; Cui, M. Molecular docking: A powerful approach for structure-based drug discovery. Curr. Comput.-Aided Drug Des. 2011, 7, 146–157. [Google Scholar] [CrossRef]
- Halperin, I.; Ma, B.; Wolfson, H.; Nussinov, R. Principles of docking: An overview of search algorithms and a guide to scoring functions. Proteins 2002, 47, 409–443. [Google Scholar] [CrossRef]
- Moreira, I.S.; Fernandes, P.A.; Ramos, M.J. Protein-protein docking dealing with the unknown. J. Comput. Chem. 2010, 31, 317–342. [Google Scholar] [CrossRef]
- Phyo, Y.Z.; Cravo, S.; Palmeira, A.; Tiritan, M.E.; Kijjoa, A.; Pinto, M.M.M.; Fernandes, C. Enantiomeric Resolution and Docking Studies of Chiral Xanthonic Derivatives on Chirobiotic Columns. Molecules 2018, 23, 142. [Google Scholar] [CrossRef] [Green Version]
- Phyo, Y.Z.; Teixeira, J.; Gonçalves, R.; Palmeira, A.; Tiritan, M.E.; Bousbaa, H.; Pinto, M.M.M.; Fernandes, C.; Kijjoa, A. Chiral derivatives of xanthones and benzophenones: Synthesis, enantioseparation, molecular docking, and tumor cell growth inhibition studies. Chirality 2021, 33, 153–166. [Google Scholar] [CrossRef]
- De Simone, G.; Pasquadibisceglie, A.; di Masi, A.; Buzzelli, V.; Trezza, V.; Macari, G.; Polticelli, F.; Ascenzi, P. Binding of direct oral anticoagulants to the FA1 site of human serum albumin. J. Mol. Recogn. 2021, 34, e2877. [Google Scholar] [CrossRef]
- Ali, M.S.; Muthukumaran, J.; Jain, M.; Al-Lohedan, H.A.; Farah, M.A.; Alsowilem, O.I. Experimental and computational investigation on the binding of anticancer drug gemcitabine with bovine serum albumin. J. Biomol. Struct. Dyn. 2021, 1–14. [Google Scholar] [CrossRef]
- Bratty, M.A. Spectroscopic and molecular docking studies for characterizing binding mechanism and conformational changes of human serum albumin upon interaction with Telmisartan. Saudi Pharm. J. SPJ Off. Publ. Saudi Pharm. Soc. 2020, 28, 729–736. [Google Scholar] [CrossRef]
- Mic, M.; Pîrnău, A.; Floare, C.G.; Marc, G.; Franchini, A.H.; Oniga, O.; Vlase, L.; Bogdan, M. Synthesis and molecular interaction study of a diphenolic hidrazinyl-thiazole compound with strong antioxidant and antiradical activity with HSA. J. Mol. Struct. 2021, 1244, 131278. [Google Scholar] [CrossRef]
- Thirugnanasundar, A.; Kesavan, M.P.; Kumar, S.M.; Ravi, L.; Bhaskar, R.; Rajagopal, G.; Rajesh, J. Synthesis, structure, DNA/protein molecular docking and biological studies of hydrazone ligand derived Cu(II) and VO(IV) complexes. Inorg. Chim. Acta 2021, 526, 120543. [Google Scholar] [CrossRef]
- Yasrebi, S.A.; Takjoo, R.; Riazi, G.H. HSA-interaction studies of uranyl complexes of alkyl substituted isothiosemicarbazone. J. Mol. Struct. 2019, 1193, 53–61. [Google Scholar] [CrossRef]
- Bapli, A.; Chatterjee, A.; Gautam, R.K.; Pandit, S.; Jana, R.; Seth, D. Interaction of a hydrophilic molecule with bovine serum albumin: A combined multi-spectroscopic, microscopic and isothermal calorimetric study in the presence of graphene oxide. J. Mol. Liq. 2021, 323, 114618. [Google Scholar] [CrossRef]
- Ferreira, L.G.; Dos Santos, R.N.; Oliva, G.; Andricopulo, A.D. Molecular docking and structure-based drug design strategies. Molecules 2015, 20, 13384–13421. [Google Scholar] [CrossRef]
- Leek, H.; Andersson, S. Preparative scale resolution of enantiomers enables accelerated drug discovery and development. Molecules 2017, 22, 158. [Google Scholar] [CrossRef] [Green Version]
- Silva, B.; Pereira, J.A.; Cravo, S.; Araújo, A.M.; Fernandes, C.; Pinto, M.M.M.; de Pinho, P.G.; Remião, F. Multi-milligram resolution and determination of absolute configuration of pentedrone and methylone enantiomers. J. Chromatogr. B 2018, 110, 158–164. [Google Scholar] [CrossRef]
- Carraro, M.L.; Palmeira, A.; Tiritan, M.E.; Fernandes, C.; Pinto, M.M.M. Resolution, determination of enantiomeric purity and chiral recognition mechanism of new xanthone derivatives on (S,S)-Whelk-O1 stationary phase. Chirality 2017, 29, 247–256. [Google Scholar] [CrossRef]
- Silva, B.; Fernandes, C.; Tiritan, M.E.; Pinto, M.M.; Valente, M.J.; Carvalho, M.; de Pinho, P.G.; Remião, F. Chiral enantioresolution of cathinone derivatives present in “legal highs”, and enantioselectivity evaluation on cytotoxicity of 3,4-methylenedioxypyrovalerone (MDPV). Forensic Toxicol. 2016, 34, 372–385. [Google Scholar] [CrossRef] [Green Version]
- Fernandes, C.; Brandão, P.; Santos, A.; Tiritan, M.E.; Afonso, C.; Cass, Q.B.; Pinto, M.M. Resolution and determination of enantiomeric purity of new chiral derivatives of xanthones using polysaccharide-based stationary phases. J. Chromatogr. A 2012, 1269, 143–153. [Google Scholar] [CrossRef]
- Rocco, A.; Aturki, Z.; Fanali, S. Chiral separations in food analysis. TrAC-Trends Anal. Chem. 2013, 52, 206–225. [Google Scholar] [CrossRef]
- Alvarez-Rivera, G.; Bueno, M.; Ballesteros-Vivas, D.; Cifuentes, A. Chiral analysis in food science. TrAC Trends Anal. Chem. 2020, 123, 115761. [Google Scholar] [CrossRef]
- Phyo, Y.; Ribeiro, J.; Fernandes, C.; Kijjoa, A.; Pinto, M.M.M. Marine natural peptides: Determination of absolute configuration using liquid chromatography methods and evaluation of bioactivities. Molecules 2018, 23, 306. [Google Scholar] [CrossRef] [Green Version]
- Zin, W.W.M.; Buttachon, S.; Dethoup, T.; Fernandes, C.; Cravo, S.; Pinto, M.M.M.; Gales, L.; Pereira, J.A.; Silva, A.M.S.; Sekeroglu, N.; et al. New cyclotetrapeptides and a new diketopiperzine derivative from the marine sponge-associated fungus Neosartorya glabra KUFA 0702. Mar. Drugs 2016, 14, 136. [Google Scholar] [CrossRef] [Green Version]
- Barreiro, J.C.; Tiritan, M.E.; Cass, Q.B. Challenges and innovations in chiral drugs in an environmental and bioanalysis perspective. TrAC Trends Anal. Chem. 2021, 142, 116326. [Google Scholar] [CrossRef]
- Ribeiro, A.R.L.; Maia, A.S.; Ribeiro, C.; Tiritan, M.E. Analysis of chiral drugs in environmental matrices: Current knowledge and trends in environmental, biodegradation and forensic fields. TrAC Trends Anal. Chem. 2020, 124, 115783. [Google Scholar] [CrossRef]
- Chmielewska, A.; Konieczna, L.; Baczek, T. A Novel Two-Step Liquid-Liquid Extraction Procedure Combined with Stationary Phase Immobilized Human Serum Albumin for the Chiral Separation of Cetirizine Enantiomers along with M and P Parabens. Molecules 2016, 21, 1654. [Google Scholar] [CrossRef] [Green Version]
- Barbato, F.; Carpentiero, C.; Grumetto, L.; La Rotonda, M.I. Enantioselective retention of β-blocking agents on human serum albumin and α1-acid glycoprotein HPLC columns: Relationships with different scales of lipophilicity. Euro. J. Pharm. Sci. 2009, 38, 472–478. [Google Scholar] [CrossRef]
- Andrisano, V.; Gotti, R.; Cavrini, V.; Tumiatti, V.; Felix, G.; Wainer, I.W. Capillary electrophoretic and high-performance liquid chromatographic studies of the enantioselective separation of α1-adrenoreceptor antagonists. J. Chromatogr. A 1998, 803, 189–195. [Google Scholar] [CrossRef]
- Bertucci, C.; Andrisano, V.; Gotti, R.; Cavrini, V. Modulation of Chromatographic Performances of HSA-Based HPLC Column by Reversible Binding of Lithocholic Acid. Chromatographia 2001, 53, 15–18. [Google Scholar] [CrossRef]
- Andrisano, V.; Bertucci, C.; Cavrini, V.; Recanatini, M.; Cavalli, A.; Varoli, L. Stereoselective binding of 2,3-substituted 3-hydroxypropionic acids on an immobilised human serum albumin chiral stationary phase: Stereochemical characterisation and quantitative structure-retention relationship study. J. Chromatogr. A 2000, 876, 75–86. [Google Scholar] [CrossRef]
- Andrisano, V.; Gotti, R.; Recanatini, M.; Cavalli, A.; Varoli, L.; Bertucci, C. Stereoselective binding of 2-(4-biphenylyl)-3-substituted-3-hydroxy-propionic acids on an immobilised human serum albumin chiral stationary phase. J. Chromatogr. B 2002, 768, 137–145. [Google Scholar] [CrossRef]
- Fitos, I.; Visy, J.; Simonyi, M. Species-dependency in chiral-drug recognition of serum albumin studied by chromatographic methods. J. Biochem. Biophys. Methods 2002, 54, 71–84. [Google Scholar] [CrossRef]
- Xu, S.; Wang, Y.; Tang, Y.; Ji, Y. A protein-based mixed selector chiral monolithic stationary phase in capillary electrochromatography. New J. Chem. 2018, 42, 13520–13528. [Google Scholar] [CrossRef]
- Martínez-Pla, J.J.; Martín-Biosca, Y.; Sagrado, S.; Villanueva-Camañas, R.M.; Medina-Hernández, M.J. Fast enantiomeric separation of propranolol by affinity capillary electrophoresis using human serum albumin as chiral selector: Application to quality control of pharmaceuticals. Anal. Chim. Acta 2004, 507, 171–178. [Google Scholar] [CrossRef]
- Martínez-Gómez, M.A.; Martínez-Pla, J.J.; Sagrado, S.; Villanueva-Camañas, R.M.; Medina-Hernández, M.J. Chiral separation of oxprenolol by affinity electrokinetic chromatography-partial filling technique using human serum albumin as chiral selector. J. Pharm. Biomed. Anal. 2005, 39, 76–81. [Google Scholar] [CrossRef]
- Martinez-Gomez, M.A.; Villanueva-Camañas, R.M.; Sagrado, S.; Medina-Hernández, M.J. Multivariate optimization approach for chiral resolution of drugs using human serum albumin in affinity electrokinetic chromatography-partial filling technique. Electrophoresis 2005, 26, 4116–4126. [Google Scholar] [CrossRef]
- Martínez-Gómez, M.A.; Sagrado, S.; Villanueva-Camañas, R.M.; Medina-Hernández, M.J. Enantioseparation of phenotiazines by affinity electrokinetic chromatography using human serum albumin as chiral selector: Application to enantiomeric quality control in pharmaceutical formulations. Anal. Chim. Acta 2007, 582, 223–228. [Google Scholar] [CrossRef]


| HSA Binding Sites | ||
|---|---|---|
| Sudlow’s Site I | Sudlow’s Site II | |
| Exogenous albumin ligands | Warfarin | Ibuprofen |
| Myristate | Diazepam | |
| Thyroxine | Propofol | |
| Indometacin | Myristate | |
| Phenylbutazone | Halothane | |
| Diflunisal | Thyroxine | |
| Method | Advantages | Disadvantages |
|---|---|---|
| Equilibrium dialysis | Easy procedure; As the standard method, it facilitates cross-comparison; Determination is done at equilibrium, reducing the effect of non-specific binding. | Nonspecific membrane binding may occur; Time-consuming procedure, depending on the characteristics of the compounds; Number of samples analyzed is reduced; Compounds with higher molecular weights and highly bound to plasma proteins will take longer time to reach equilibrium and errors may occur due to bacterial growth phenomena, changes in pH, or free fatty acid levels. |
| Ultrafiltration | Simple and fast procedure; The effect of non-specific binding is reduced since determination is done at equilibrium. | Nonspecific binding to the membrane or chamber walls may occur; Sieve effects can occur, in which water present in the plasma passes the membrane more rapidly than the drug molecules with a risk of determining a lower free fraction if not all molecules are allowed to pass through the membrane; Gibbs–Donnan effects and leakage of proteins through the membrane may occur contaminating the chamber. |
| Ultracentrifugation | Absence of membrane-related difficulties; Equipment allows better temperature control; Fast procedure since there is no need to establish an equilibrium. | Sampling of the supernatant may be difficult, due to the lipid layer formed by centrifugation; Sampling of the supernatant may favor contamination of the free fraction by the fraction bound to VLDL, LDL and chylomicrons; Sedimentation of the free fraction may occur due to the shape and size of the compound (especially for those with molecular weights > 400 Da) or due to the influence of temperature; The supernatant must be sampled as quickly as possible, as the free compounds diffuse as soon as the centrifuge stops; Equipment is more expensive; Time-consuming procedure; Processing a small number of samples. |
| Protein | Mr (kDa) | Type of Analytes | Column Tradename |
|---|---|---|---|
| Serum albumin | |||
| Human (HSA) | 67 | Acidic and neutral | CHIRAL-HAS® a CHIRAL HSA® b KeyStone HSA® c |
| Bovine (BSA) | 68 | Acidic and neutral | CHIRAL-BSA® a Ultron ES-BSA® d Resolvosil BSA® e |
| α1-Acid glycoprotein (AGP) | 44 | Basic, neutral and acidic | CHIRAL-AGP® a EnantioPac® f |
| Ovomucoid (OVM) | 28 | Basic, neutral and acidic | Ultron ES-OVM® d TSKgel Enantio-OVM® g |
| Cellobiohydrolases (CBH) | 60–70 | Basic and neutral | CHIRAL-CBH® a |
| Avidin | 68 | Basic, neutral and acidic | Bioptic AV-1® h |
| Pepsin | 34.6 | Basic and neutral | Ultron ES-Pepsin d |
| α-Chymotrypsin | 25 | Amino acids and derivatives | - |
| Penicillin G Acylase | 90 | Acidic | - |
| Antibodies | 150 | Aliphatic and aromatic | - |
| Lysozyme | 14 | Basic and neutral | - |
| Analyte | Type of Analysis | Chromatographic Conditions | Binding Affinity to HSA | Ref | |
|---|---|---|---|---|---|
| Association Constant (M−1) | Bound Percentage (%) | ||||
| Tocainide analogues | Frontal | Mobile phase: Solutions of L-tryptophan prepared in PPB (0.067 M, pH 7.4) ranging from 12.5 µM to 100 µM Flow rate: 1.0 mL/min Detection: UV; Spectra recorded at a scan rate of 20 nm/min Column: Silica monolithic column (50 mm × 4.6 mm i.d., 20 nm) immobilized with HSA Temperature: 28 °C | - | 34.7–98.7 | [111] |
| Imipramine | Frontal and zonal | Mobile phase: PPB (0.067 M, pH 7.4) Flow rate: 0.3 mL/min Detection: UV; λ = 251 nm Column: Homemade column with immobilized HSA Temperature: 37 °C | 1.6 (±1.0) × 105 | - | [112] |
| Warfarin Gliclazide | Frontal and zonal | Mobile phase: PPB (0.067 M, pH 7.4) Flow rate: 0.1 mL/min Detection: UV; λ = 308, 250 nm Column: Immunoextraction microcolumns containing adsorbed HSA (1.0 cm × 2.1 mm i.d.) Temperature: 37 °C | 2.4 (±0.4) × 105 4.1 (±0.5) × 104 | - | [113] |
| Glipizide | Frontal and zonal | Mobile phase: PPB (0.067 M, pH 7.4) Flow rate: 0.5 mL/min Detection: UV; λ = 254 nm Column: Nucleosil Si-300® silica with immobilized HSA (2.0 cm × 2.1 mm i.d.) Temperature: 37 °C | 2.4–6.0 × 10⁵ | - | [114] |
| Tolazamide | Frontal and zonal | Mobile phase: PPB (0.067 M, pH 7.4) Flow rate: 0.5 mL/min Detection: UV; λ = 254 nm Column: Nucleosil Si-300® silica microcolumns with immobilized HSA (1.0 or 2.0 cm × 2.1 mm i.d.) Temperature: 37 °C | 4.3–6.0 × 10⁴ | - | [115] |
| Phenytoin | Frontal and zonal | Mobile phase: PPB (0.067 M, pH 7.4) Flow rate: 0.2 mL/min Detection: UV; λ = 205 nm Column: Nucleosil Si-300® silica column with immobilized HSA (5 cm × 4.6 mm i.d.) Temperature: 37 °C | 8.8 (±2.0) × 103 | - | [116] |
| HIV protease inhibitors | Frontal and zonal | Mobile phase: PPB (0.067 M, pH 7.4):1-PrOH (100:0 to 90:10, v/v) Flow rate: 1.0 mL/min Detection: UV; λ = 228, 231 or 308 nm Column: Kromasil® silica column with immobilized HSA (50 × 4.0 mm i.d.) Temperature: 28 °C | 70.45–98.84 | [117] | |
| Timolol | Zonal | Mobile phase: AAB (0.050 M, pH 7.4): n-PrOH (94:6, v/v) Flow rate: 0.8 mL/min Detection: MS and UV; λ = 10 nm Column: HSA column by Hypersil® (50 mm × 4.6 mm i.d.) Temperature: 37 °C | - | 14.0 | [118] |
| Pindolol | - | 39.0 | |||
| Alprenolol | - | 40.0 | |||
| Pentobarbital | - | 35.0 | |||
| Amobarbital | - | 79.0 | |||
| Methohexital | - | 36.0 | |||
| Desipramine | - | 83.0 | |||
| Chlorpromazine | - | 43.0 | |||
| Clozapine | - | 93.0 | |||
| Bromazepam | - | 57.0 | |||
| Alprazolam | - | 70.0 | |||
| Flunitrazepam | - | 66.0 | |||
| Lorazepam | - | 80.0 | |||
| Midazolam | - | 92.0 | |||
| Acetaminophen | Zonal | Mobile phase: AAB (0.050 M, pH 7.4):2- PrOH (70–100: 0–30) Flow rate: 1.8 mL/min Detection: UV; λ = 230 and 254 nm Column: Chromtech® Immobilized HSA HPLC column (50 × 3 mm) Temperature: 30 °C | - | 14.0 | [119] |
| Acyclovir | - | 5.4 | |||
| Amoxicillin | - | 16.4 | |||
| Aspirin | - | 37.3 | |||
| Carbamazepine | - | 83.8 | |||
| Diazepam | - | 93.2 | |||
| Ibuprofen | - | 99.5 | |||
| Propanolol | - | 62.0 | |||
| Warfarin | - | 97.9 | |||
| Ketoconazole | - | 93.0 | |||
| Clonidine | - | 28.0 | |||
| Diclofenac | - | 99.0 | |||
| Flumazenil | - | 28.8 | |||
| Fluoxetine | - | 97.0 | |||
| Naproxen | - | 99.0 | |||
| m-HPPH (E1) | Mobile phase: PPB (0.067 M, pH 7.4) Flow rate: 0.1–2.0 mL/min Λ = 203 nm Column: Nucleosil Si-300® immobilized with HSA (10 × 4.6 mm i.d.) Temperature: 37 °C | 3.0 (±1.1) × 103 | - | ||
| m-HPPH (E2) | 3.4 (±1.3) × 103 | - | |||
| p-HPPH (E1) | Zonal | 5.1 (±0.7) × 103 | - | [120] | |
| p-HPPH (E2) | 6.3 (±0.9) × 103 | - | |||
| Dietary flavonoids | Zonal | Mobile phase: PPB (0.050 M, pH 7.0): ACN (85:15, v/v) Flow rate: 0.35 mL/min Detection: UV; λ = 210, 270, 280 and 360 nm Column: CHIRALPAK® HSA (150 × 40 mm, i.d., 5 µm) Temperature: 37 °C | - | 15.36–91.79 | [121] |
| Taxane derivatives | Zonal | Mobile phase: PPB (0.050 M, pH 7.4): 1-PrOH (100-80:0-20, v/v) Flow rate: 0.8 mL/min Detection: UV; λ = 230 nm Column: HSA Shandon Scientific® (15 × 0.4 cm i.d.) Temperature: 25 °C | - | 40.2–91.9 | [122] |
| Tocainide | Zonal | Mobile phase: PPB (0.067 M, pH 7.4) Flow rate: 1.0 mL/min Detection: UV Column: Silica column (50 mm × 4.0 mm i.d.) immobilized with HSA Temperature: 28 °C | - | 25.4 | [123] |
| Xanthone derivatives | Zonal | Mobile phase: PPB (pH 7.4; 0.067 M) and different percentages ACN ranging from 25 to 2% Flow rate: 0.9 mL/min Detection: UV; λ = 254 nm Column: CHIRALPAK® HSA (150 × 40 mm, i.d., 5 µm) Temperature: 37 °C | - | 79.02–99.99 | [98] |
| Universal cancer peptide 2 | Zonal | Mobile phase: PPB (0.050 M, pH 7.4) Flow rate: 100–300 nL/min Detection: UV; λ = 210 nm Column: poly (GMA-EDMA) monolithic capillary column immobilized with HSA (150 mm × 75 µm i.d.) Temperature: 37 °C | 0.94 × 10⁵ | - | [124] |
| Universal cancer peptide 4 | 1.32 × 10⁵ | - | |||
| Acetohexamide Glibenclamide Glipizide Tolbutamide | Zonal | Mobile phase: PPB (0.067 M, pH 7.4) Flow rate: 0.25 mL/min Detection: UV; λ = 252, 290, 226 nm Column: Hydrazide-activated silica column with entrapped HSA (1.0 cm × 2.1 mm i.d.) Temperature: 37 °C | 1.75(±0.31) × 105 1.98(±0.35) × 106 2.03(±0.33) × 105 1.22(±0.22) × 105 | - | [125] |
| Repaglinide Nateglinide | Zonal | Mobile phase: PPB (0.067 M, pH 7.4) Flow rate: 0.5 mL/min Column: Nucleosil Si-300® silica column with immobilized HSA (1.0 cm × 2.1 mm i.d) Detection: UV; λ = 308, 280 nm Temperature: 37 °C | 6.1(±0.2) × 104 7.1(±0.8) × 105 | - | [126] |
| 2-Imidazoline drugs | Zonal | Mobile phase: PPB (0.067 M, pH 7.4) Flow rate: 0.1–0.5 mL/min Detection: UV; λ = 210–283 nm Column: Nucleosil Si-300® silica column with immobilized HSA (25 mm × 2.1 mm i.d.) Temperature: 37 °C | 1.62 × 10³–1.07 × 10⁴ | - | [127] |
| Analyte | Technique | Electrophoretic Conditions | Binding Affinity to HSA | Ref | |
|---|---|---|---|---|---|
| Association Constant (M−1) | Bound Percentage (%) | ||||
| Mexiletine | CE | Agilent CE3D CE system Detection: DAD; λ = 200 nm for mexiletine and chlorpheniramine, λ = 214 nm for propranolol Running buffer: Phosphate buffer (67 mM, pH 7.4) Chiral selector: 0.4 M HSA Voltage: 8–16 kV Capillary temperature: 25 °C | 0.20–0.38 × 10³ | - | [150] |
| Chlorpheniramine | 0.83–1.24 × 10³ | - | |||
| Propranolol | 1.00–1.16 × 10³ | - | |||
| (R)-Amlodipine | CE | HPE-100 CE system Detection: DAD; λ = 214 nm Incubation with 300 µM HSA Separation buffer: Sodium dihydrogen phosphate buffer (60 mM, pH 3.7) Chiral selector: hydroxypropyl-β- cyclodextrin Voltage: 12 kV Capillary temperature: 23.5 °C | 0.991–1.12 × 10⁴ | - | [151] |
| (S)-Amlodipine | 0.902–1.04 × 10⁵ | - | |||
| Nuarimol | CE | Hewlett-Packard HP 3D CE system Detection: DAD; λ = 220 and 278 nm Background electrolyte: Sodium phosphate (67 mM, pH 7.4) Chiral selector: 160 µM HSA solution Voltage: 15 kV Capillary temperature: 30 °C | (9.7 ± 0.3) × 103 | 75.2 ± 2 | [152] |
| Imazalil (E1) | CE | Beckman P/ACE MDQ CE system Detection: DAD; λ = 200 nm Incubation with 530 µM HSA Background electrolyte: Sodium dihydrogen phosphate buffer (50 mM, pH 7.0) Incubation buffer Sodium dihydrogen phosphate buffer (50 mM, pH 7.4) + NaCl (9.2 g/L) Chiral selector: Highly sulfated β-cyclodextrin Voltage: 15 kV Capillary temperature: 40 °C | - | 54.4–57.1 | [153] |
| Imazalil (E2) | - | 38.2–40.0 | |||
| (S)-Omeprazole | CE | Agilent 7100 CE system Detection: DAD; λ = 302 nm Background electrolyte: Disodiumhydrogen phosphate and sodium dihydrogen phosphate (20 mM):1-propanol (95:5, v/v, pH 7.4) Chiral selector: Different concentrations of HSA Voltage: 20 kV Capillary temperature: 25 °C | 3.18 × 10³ | - | [154] |
| (R)-Omeprazole | 5.36 × 10³ | - | |||
| R-(+)-Verapamil | CE | PrinCE CEC- 760 system Detection: DAD; λ = 240 and 250 nm Background electrolyte: Phosphate buffer (20 mM, pH 7.4) Incubation buffer: Phosphate buffer (20 mM, pH 7.4) Chiral selector: 30–110 µM HSA Voltage: 15 kV Capillary temperature: 25 °C | 1.844 × 10³ | - | [155] |
| S-(-)-Verapamil | 0.066 × 10³ | - | |||
| R-(+)-Amlodipine | 22.62 × 10³ | - | |||
| S-(-)-Amlodipine | 25.073 × 10³ | - | |||
| Methoxatin disodium salt | CE | Agilent CE 1600A system Detection: DAD; λ = 249 nm Incubation with HSA (0–475 µM) Background electrolyte: Phosphate buffer (67 mM, pH 7.4) Voltage: 6 kV Capillary temperature: 293–310 K | 1–1.06 × 10³ | 48.80–53.70 | [156] |
| Captopril | CE | Agilent CE 1600A system Detection: DAD; λ = 210 nm Incubation with 400 µM HSA Background electrolyte: Phosphate buffer (67 mM, pH 7.4) Voltage: 8 kV Capillary temperature: 37 °C | 2.63 (±0.21) × 103 | 66 ± 6 | [157] |
| Loureirin B | CE | P/ACE MDQ CE system Detection: DAD; λ = 280 nm 30 µM HSA (injected into the capillary or mixed with Loureirin B) Background electrolyte: Phosphate buffer (50 mM, pH 7.4) Voltage: 18 kV Capillary temperature: 37 °C | 2.78–13.14 × 10⁴ | - | [158] |
| Lidocaine Tryptophan Diclofenac Ibuprofen Chlorpropamide Tolbutamide | CE | Agilent 3D CE system Detection: DAD; λ = 214, 220, 276 nm 25 or 75 µM HSA (added to samples) Background electrolyte: Borate buffer (pH 8.5) Voltage: 14 kV Capillary temperature: 25 °C | 1.96 (±0.32) × 103 8.82 (±0.08) × 103 2.56 (±0.08) × 104 8.82 (±0.60) × 103 8.04 (±0.04) × 103 1.19 (±0.08) × 104 | - | [159] |
| Brompheniramine (E1) | Hewlett-Packard HP 3D CE system Detection: DAD; λ = 225 nm Background electrolyte: Tris–(hydroxymethyl)-aminomethane (50 mM, pH 8.5, 8.25, 7.00, 7.80) Chiral selector: 180, 160 µM HSA solution Voltage: 15 kV Capillary temperature: 30 °C | (9.39 ± 0.10) × 102 | - | ||
| Brompheniramine (E2) | (2.60 ± 0.17) × 103 | - | |||
| Chlorpheniramine (E1) | (9.20 ± 0.20) × 102 | - | |||
| Chlorpheniramine (E2) | EKC | (1.69 ± 0.17) × 103 | - | ||
| Hydroxyzine (E1) | (5.3 ± 0.5) × 103 | - | [160] | ||
| Hydroxyzine (E2) | (6.3 ± 0.4) × 103 | - | |||
| Orphenadrine (E1) | (1.26 ± 0.13) × 103 | - | |||
| Orphenadrine (E2) | (1.67 ± 0.11) × 104 | - | |||
| (R)-Zopiclone | EKC | Beckman P/ACE MDQ CE system Detection: DAD; λ = 220 nm Incubation with 475 µM HSA Separation buffer: Tris-(hydroxymethyl)-aminomethane (50 mM, pH 6.0) Incubation buffer: Phosphate buffer (67 mM, pH 7.4) Chiral selector: carboxymethylated-β-cyclodextrin Voltage: 15 kV Capillary temperature: 25 °C | - | 49 ± 6 | [161] |
| (S)-Zopiclone | 45 ± 3 | ||||
| Nomifensine (E1) | EKC | Beckman P/ACE MDQ CE system Detection: DAD; λ = 220 nm Incubation with HSA Separation buffer: Tris-(hydroxymethyl)-aminomethane (50 mM, pH 6.0) Incubation buffer: Phosphate buffer (67 mM, pH 7.4) Chiral selector: heptakis-2,3,6-tri-O-methyl-β-cyclodextrin Voltage: 15 kV Capillary temperature: 50 °C | - | 40 ± 5 | [162] |
| Nomifensine (E2) | 63 ± 4 | ||||
| Analyte | Technique | Chromatographic/Electrophoretic Conditions | Chromatographic Parameters | Ref | |
|---|---|---|---|---|---|
| α | Rs | ||||
| Cetirizine | HPALC | Mobile phase: 2-Propanol: phosphate buffer (10 mM, pH 7.0) (10:90, v/v) Flow rate: 0.9 mL/min Detection: UV; λ = 227 nm Column: CHIRALPAK® HSA (100 × 4 mm) | 1.43 | 1.82 | [188] |
| Xanthone derivatives | HPALC | Mobile phases: Sodium/potassium phosphate buffer or ammonium/sodium acetate buffer (10 mM, pH 5.0 and pH 7.0): acetonitrile (90–76: 10–24, v/v) Flow rate: 0.9 mL/min Detection: UV; λ = 254 nm Column: CHIRALPAK® HSA (150 × 40 mm) | 1.40–9.16 | 1.51–4.97 | [98] |
| Atenolol | HPALC | Mobile phase: Phosphate buffer (0.01 M, pH 7.0) Flow rate: 0.5 mL/min Column: Chrom Tech® Chiral-HSA (100 × 4 mm) | 2.40 | 1.25 | [189] |
| Labetalol | 1.26 | 1.87 | |||
| Nadolol | 1.38 | - | |||
| Pindolol | 1.14 | 0.65 | |||
| α-Adrenoreceptor antagonists | HPALC | Mobile phase: 1-Propanol: potassium phosphate buffer (0.1 M, pH 7.4) (10:90 or 5:95, v/v) Flow rate: 1 mL/min Detection: UV; λ = 220 nm Column: mixed HSA and AGP (50:50) column (150 × 4.6 mm i.d.) | 1–1.57 | - | [190] |
| Warfarin | HPALC | Mobile phase: 1-Propanol: phosphate buffer (0.1 M, pH 7.0) (5:95, v/v) Flow rate: 1.0 mL/min Detection: UV; λ = 260 nm Column: HSA Shandon Scientific® (15 × 0.4 cm) | 1.16 | - | [191] |
| Temazepam | 1.43 | - | |||
| Temazepam hemisuccinate | 1.89 | - | |||
| Oxazepam hemisuccinate | 1.75 | - | |||
| Ketoprofen | HPALC | Mobile phase: 1-Propanol: phosphate buffer (0.1 M, pH 7.0) (10:90, v/v) Flow rate: 1.0 mL/min Detection: UV; λ = 260 nm and λ = 300 nm Column: HSA Shandon Scientific® (15 × 0.4 cm) | 1.38 | - | [191] |
| Fenoprofen | 2.17 | - | |||
| Suprofen | 4.87 | - | |||
| Naproxen | 1.43 | - | |||
| Hydroxypropionic acids | HPALC | Mobile phase: 1-Propanol: potassium phosphate buffer (0.1 M, pH 7.0) (10:90, v/v) containing 5 mM octanoic acid Flow rate: 1.0 mL/min Detection: UV; λ = 220 nm and λ = 275 nm Column: HSA Shandon Scientific® (150 × 4.6 mm) | 1–2.17 | - | [192,193] |
| Tofisopam | HPALC | Mobile phase: Phosphate buffer (0.1 M, pH 7.0) with 2-propanol or acetonitrile modifiers Flow rate: 0.9 mL/min Detection: UV; λ = 310 nm Column: HSA Chiral Protein-2® (150 × 4 mm) | 3.15 | - | [194] |
| Oxazepam acetate | 5.42 | - | |||
| Temazepam acetate | 19.86 | - | |||
| Lorazepam acetate | 2.00 | - | |||
| Oxazepam hemisuccinate | 14.30 | - | |||
| Oxazepam methylsuccinate | 5.39 | - | |||
| Lorazepam hemisuccinate | 3.25 | - | |||
| Warfarin | 1.30 | - | |||
| Phenprocoumon | 1.80 | - | |||
| Acenocoumarol | 1.73 | - | |||
| Tryptophan Metoprolol Esmolol Bisoprolol Azelastine Warfarin Labetalol Atenolol Terazosin Citalopram | CEC | Mobile phase: Phosphate buffer (10 mM, pH 7.0) without organic modifier for tryptophan, with acetonitrile (80:20, v/v) for warfarin and 2-propanol (90:10, v/v) for others Flow rate: 3 µL/min Detection: UV; λ = 215, 225, 240 and 254 nm Column: HSA–cellulase@poly(GMA–EDMA) monolith column Voltage: 10 and 15 kV Capillary temperature: 20 °C | - - - - - - - - - - | 2.13 1.87 1.60 1.72 1.92 1.48 0.76, 1.79 1.07 0.42 0.45 | [195] |
| (R)-Propranolol | CE | Hewlett-Packard HP 3D CE system Detection: DAD; λ = 220 nm Background electrolyte: Phosphate buffer (67 mM, pH 7.4) Chiral selector: 100 µM HSA solution Voltage: 20 kV Capillary temperature: 35 °C | 1.083 | 1.06 | [196] |
| (S)-Propanolol | |||||
| (R)- Oxprenolol | EKC | Hewlett-Packard HP 3D CE system Detection: DAD; λ = 220 nm Background electrolyte: Tris–(hydroxymethyl)-aminomethane (50 mM, pH 8.5) Chiral selector: 190 µM HSA solution Voltage: 15 kV Capillary temperature: 35 °C | - | 1.47 | [197] |
| (S)- Oxprenolol | |||||
| Promethazine | Hewlett-Packard HP 3D CE system Detection: DAD; λ = 200, 220, 240 and 274 nm Background electrolyte: Tris–(hydroxymethyl)-aminomethane (50 mM, pH 7.6, 8.4, 8.8, 8.0) Chiral selector: 170, 167 and 190 µM HSA solution Voltage: 15 kV Capillary temperature: 30 °C | - | 2.01 ± 0.15 | ||
| Alprenolol | - | 1.85 ± 0.13 | |||
| Oxprenolol | EKC | - | 1.5 ± 0.2 | [198] | |
| Propanolol | - | 1.5 | |||
| Brompheniramine | Hewlett-Packard HP 3D CE system Detection: DAD; λ = 225 nm Background electrolyte: Tris–(hydroxymethyl)-aminomethane (50 mM, pH 8.5, 8.25, 7.00, 7.80) Chiral selector: 180, 160 µM HSA solution Voltage: 15 kV Capillary temperature: 30 °C | - | 2.50 | ||
| Chlorpheniramine | - | 1.49 | |||
| Hydroxyzine | EKC | - | 1.41 | [160] | |
| Orphenadrine | - | 1.12 | |||
| Trimeprazine | EKC | Hewlett-Packard HP 3D CE system Detection: DAD; λ = 240 and 278 nm Background electrolyte: Tris–(hydroxymethyl)-aminomethane (50 mM, pH 7.6 and 7.5) Chiral selector: 170 µM HSA solution Voltage: 15 kV Capillary temperature: 30 °C | - | 1.74 | [199] |
| Prometazine | - | 2.01 | |||
| Nuarimol | EKC | Hewlett-Packard HP 3D CE system Detection: DAD; λ = 220 and 278 nm Background electrolyte: Tris–(hydroxymethyl)-aminomethane (50 mM, pH 7.3) Chiral selector: 160 µM HSA solution Voltage: 15 kV Capillary temperature: 30 °C | - | 1.1 | [152] |
| (R)-Zopiclone | EKC | Beckman P/ACE MDQ CE system Detection: DAD; λ = 220 nm Incubation with 475 µM HSA Separation buffer: Tris-(hydroxymethyl)-aminomethane (50 mM, pH 6.0) Incubation buffer: Phosphate buffer (67 mM, pH 7.4) Chiral selector: carboxymethylated-β-cyclodextrin Voltage: 15 kV Capillary temperature: 25 °C | 1.95 | 2.1 | [161] |
| (S)-Zopiclone | |||||
| Nomifensine (1st enantiomer) | EKC | Beckman P/ACE MDQ CE system Detection: DAD; λ = 220 nm Incubation with HSA Separation buffer: Tris-(hydroxymethyl)-aminomethane (50 mM, pH 6.0) Incubation buffer: Phosphate buffer (67 mM, pH 7.4) Chiral selector: heptakis-2,3,6-tri-O-methyl-β-cyclodextrin Voltage: 15 kV Capillary temperature: 50 °C | 2.7 ± 0.1 | 1.7 | [162] |
| Nomifensine (2nd enantiomer) | |||||
| Imazalil (1st enantiomer) | CE | Beckman P/ACE MDQ CE system Detection: DAD; λ = 200 nm Incubation with 530 µM HSA Background electrolyte: NaH2PO4 (50 mM, pH 7.0) Incubation buffer NaH2PO4 (50 mM, pH 7.4) + NaCl (9.2 g/L) Chiral selector: Highly sulfated β-cyclodextrin Voltage: 15 kV Capillary temperature: 40 °C | 2.0 | 4.4 | [153] |
| Imazalil (2nd enantiomer) | |||||
| R-(+)-Verapamil | CE | PrinCE CEC- 760 system Detection: DAD; λ = 240 and 250 nm Background electrolyte: HSA (30–110 µM) + phosphate buffer (20 mM, pH 7.4) Incubation buffer: Phosphate buffer (20 mM, pH 7.4) Voltage: 15 kV Capillary temperature: 25 °C | - | 2.7–1.0 | [155] |
| S-(-)-Verapamil | |||||
| R-(+)-Amlodipine | - | 3.6–1.1 | |||
| S-(-)-Amlodipine | |||||
Publisher’s Note: MDPI stays neutral with regard to jurisdictional claims in published maps and institutional affiliations. |
© 2021 by the authors. Licensee MDPI, Basel, Switzerland. This article is an open access article distributed under the terms and conditions of the Creative Commons Attribution (CC BY) license (https://creativecommons.org/licenses/by/4.0/).
Share and Cite
Cardoso, T.; Almeida, A.S.; Remião, F.; Fernandes, C. Enantioresolution and Binding Affinity Studies on Human Serum Albumin: Recent Applications and Trends. Chemosensors 2021, 9, 304. https://doi.org/10.3390/chemosensors9110304
Cardoso T, Almeida AS, Remião F, Fernandes C. Enantioresolution and Binding Affinity Studies on Human Serum Albumin: Recent Applications and Trends. Chemosensors. 2021; 9(11):304. https://doi.org/10.3390/chemosensors9110304
Chicago/Turabian StyleCardoso, Tony, Ana Sofia Almeida, Fernando Remião, and Carla Fernandes. 2021. "Enantioresolution and Binding Affinity Studies on Human Serum Albumin: Recent Applications and Trends" Chemosensors 9, no. 11: 304. https://doi.org/10.3390/chemosensors9110304
APA StyleCardoso, T., Almeida, A. S., Remião, F., & Fernandes, C. (2021). Enantioresolution and Binding Affinity Studies on Human Serum Albumin: Recent Applications and Trends. Chemosensors, 9(11), 304. https://doi.org/10.3390/chemosensors9110304