Article

Effect of Al and Mg Doping on Reducing Gases Detection of ZnO Nanoparticles

1
Laboratory of Physics of Materials and Nanomaterials Applied at Environment (LaPhyMNE), Faculty of Sciences in Gabes, Gabes University, Gabes 6072, Tunisia
2
King Abdulaziz City for Science and Technology (KACST), Material Science Research Institute, Riyadh 11442, Saudi Arabia
3
King Abdulaziz City for Science and Technology (KACST), National Center for Combustion & Plasma Technology, Riyadh 11442, Saudi Arabia
4
Department of Physics, College of Sciences, Imam Mohammad Ibn Saud Islamic University (IMSIU), Riyadh 11623, Saudi Arabia
5
Department of Engineering, University of Messina, 98166 Messina, Italy
6
National Center for Research in Materials Sciences, Technopole Borj Cédria, Laboratory of Physico-Chemistry of Mineral Materials and Their Applications, BP 73, Soliman 8027, Tunisia
*
Author to whom correspondence should be addressed.
Chemosensors 2021, 9(11), 300; https://doi.org/10.3390/chemosensors9110300
Submission received: 2 September 2021 / Revised: 17 October 2021 / Accepted: 19 October 2021 / Published: 24 October 2021

Abstract

:
In this work, the main objective is to enhance the gas sensing capability through investigating the effect of Al and Mg doping on ZnO based sensors. ZnO, Mg1% doped ZnO, Al5% doped ZnO and (Al5%, Mg1%) co-doped ZnO nanoparticles (NPs) were synthesized by a modified sol-gel method. The structural characterization showed the hexagonal crystalline structure of the prepared samples. Morphological characterizations confirmed the nanometric sizes of the NPs (27–57 nm) and elemental composition investigation proved the existence of Al and Mg with low concentrations. The optical characterization showed the high absorbance of the synthesized samples in the UV range. The gas sensing performances of the synthesized samples, prepared in the form of thick films, were investigated. Sensing tests demonstrated the high influence of the Al and Mg on the sensing performances towards H2 and CO gas, respectively. The 5A1MZO-based sensor exhibits high sensitivity and low detection limits to H2 (<2 ppm) and CO (<1 ppm). It showed a response around 70 (at 250 °C) towards 2000 ppm H2 and 2 (at 250 °C) towards CO.

1. Introduction

ZnO is an important semiconductor material that exhibits a wide range of properties for vast area of applications. The unique characteristics like wide bandgap (3.37 eV), high excitonic binding energy (60 meV) at room temperature, high-electron mobility, high chemical and thermal stability, strong cohesive energy (1.89 eV) and good biocompatibility make ZnO a favorable material for gas sensors [1,2,3]. Furthermore, the non-toxicity, low-cost, simplicity in fabrication, suitability for bulk production and robustness in practical applications, make ZnO very interesting to be used as a sensing material compared to other semiconducting metal oxides [4,5]. Several approaches were adopted to synthesize pure and doped ZnO nanoparticles, such as sol-gel [6], combustion, co-precipitation, hydrothermal [7], thermal stock [8], laser ablation in liquid [9] and the sonochemical method [10]. Among them, the sol-gel method is relatively simple, needs low-cost equipment and a low reaction temperature. On the other hand, it allows producing materials of high purity and crystallinity and with different shapes [11]. The preparation of pure, doped and co-doped ZnO NPs by sol-gel method for gas sensing is our main investigation.
Various materials such as graphene, polymers, small organic materials and semiconductor oxides are used for the sensitive detection of certain reducing gases [12,13]. Zinc oxide is one of the semiconductor oxides that attracted great attention thanks to its low coast, non-toxicity, flexibility in production and sensitivity to different gases [14]. ZnO-based gas sensors have exposed excessive abilities to detect harmful and flammable gases like CO [15,16], CO2 [17], NO2 [18,19], CH4 [20,21], NH3 [22,23] and H2 [24,25]. However, using pure ZnO as a sensing layer has some limitations, such as the high working temperature and detection limit, low selectivity, and the long response/recovery times. Doping ZnO with suitable elements is one of the methods used to improve the gas sensing properties. Group III elements, such as In, Al and Ga, and group-II elements, such as Mg and Ca, are widely used as n-type dopants in ZnO material [26,27]. They incorporate into ZnO material by replacing the host atoms Zn. This induces the release of free electrons and also contributes to high conductivity in ZnO material [28].
In this context, we have reported in our previous work [26] a considerable improvement in formaldehyde sensing of Ca-doped ZnO NPs-based sensor due to the basic centers provided by calcium which induces high gas adsorption. Moreover, Ga doped ZnO NPs were prepared by Dhahri et al. [5]. The substitution of the Zn2+ by the Ga3+ cation induces more oxygen species formation that are able to be chemisorbed. The Ga doped ZnO-based sensor showed a capacity to detect low CO concentrations at relatively lower operating temperature (200 °C). Additionally, it showed higher sensitivity and faster response/recovery times compared to pure ZnO sensor. Due to the sensing results given by Ca (group II) and Ga (group III) doping, we have chosen the Mg and Al doping agents.
In the present paper, we are interested in aluminum and magnesium elements. We synthesized and characterized ZnO, Mg-doped ZnO, Al-doped ZnO and (Al, Mg) co-doped ZnO NPs and studied the effect of Al and Mg on gas sensing properties. Al and Mg doping have improved the response toward the reducing gases H2 and CO, respectively, by inducing electronic effects which alter the reactivity of the detection layer’s surface. In the following, we present the preparation process of the NPs, the used characterization techniques and a description of the experimental setup and measurements of the gas sensor. Then, we present and interpret the obtained results.

2. Experimental Details

2.1. Preparation Process

The samples (pure, doped and co-doped ZnO NPs) were prepared by a modified sol-gel route. Mg doped ZnO NPs were prepared by dissolving 16 g of zinc acetate dehydrate [Zn(CH3COO)2 × 2H2O, 99%] in 112 mL of methanol under magnetic stirring at an ambient temperature. Then an adequate quantity of magnesium chloride hexahydrate (MgCl2 × 6H2O) corresponding to a ratio [Mg]/[Zn] of 0.01(1at.%) was added under magnetic stirring until total dissolution. The above solution was placed in an autoclave with about 220 mL of ethanol before being dried in the supercritical conditions of ethyl alcohol (Tc = 243 °C; Pc = 63.6 bars) according to El Mir et al.’s protocol [29,30]. The reaction of the formation of ZnO is given in (Equation (1)) for temperature range from 180 to 300 °C.
Zn(CH3CO2)2 + H2O → ZnO + 2CH3COOH
The same protocol was used to prepare Al-doped ZnO NPs. The Al precursor was the aluminum isoproxide (C9H21AlO3) and the [Al]/[Zn] atomic ratio was 0.05 (5 at.%). The Al–Mg co-doped sample was also prepared by the same adopted protocol. The magnesium and aluminum precursors were introduced simultaneously after dissolving zinc precursor (1 at.% Mg and 5 at.% Al). At the end, the gained nanopowders were annealed, in a muffle furnace, at 400 °C in air for 2 h. Mg1% doped ZnO, Al5% doped ZnO and (Al5%, Mg1%) co-doped zinc oxide are named, respectively, as 1MZO, 5AZO, 5A1MZO in the present investigation.

2.2. Characterization Techniques

Microstructural characterization was determined using X-ray diffraction (XRD, Philips PW1710) analysis with Cu-Kα1 radiations of wavelength 1.541874 Å. The surface morphology of the samples was analyzed using a transmission electron microscope (TEM; Tecnai G2-200 kV) and a field emission scanning electron microscopy (FESEM, type). Elemental composition was analyzed using energy dispersive X-ray (EDX) spectroscopy. The optical characterization was investigated with a UV-Vis-NIR spectrophotometer (Shimadzu UV-3101PC).

2.3. Sensing Tests

The prepared samples were used to design gas sensor devices. The sensing device consists of an alumina substrate with size dimensions of 6 mm× 3 mm, a pair of Pt interdigitated electrodes distant with 200 microns on the top side and a Pt heater on the back side. The prepared NPs were mixed with deionized water and deposited on sensing device via screen printed method. After that, the sensor devices were placed in a stainless-steel test chamber and exposed to a constant flow rate (100 cm3/min) of synthetic dry air and then to the flux of target gas (100–10,000 ppm of H2 and 5–50 ppm of CO). The concentrations of the inserted target gas within the test chamber were equipped with certified gas mixtures bottles and a mass-flow controller array. A multimeter data acquisition unit (Agilent 34970 A) was interfaced with a computer to measure the electrical resistance of the detection layer. The sensors temperature was controlled using a dual channel power supply instrument (Agilent E3632 A). For reducing gases, the gas response is defined as Ra/Rg, where Ra is the baseline resistance and Rg is the electrical resistance of the sensor at different target gas concentrations. Photos of the sensing device and measurement system are presented in Figure 1.

3. Results and Discussion

3.1. Characterization

Figure 2 shows the XRD patterns of the ZnO, 1MZO, 5AZO and 5A1MZO samples. The high intensity and the sharpness of diffraction peaks indicate the well crystallized structure of the samples. The indexed diffraction peaks of the samples are associated to the hexagonal structure of ZnO (JCPDS Card No. 36-1451) [31]. The crystalline structure does not change expressively for the doped and co-doped samples and this may be due to the small amount of Al and Mg doping elements. No extra peaks from other phases are detected, indicating the high purity of the synthesized samples. Figure 3 illustrates a magnification of the major peak (101) of all samples. The peaks intensity becomes sharper and narrower for doped and co-doped samples, which confirms their high crystallinity. A slight shift of (101) peak, towards lower angles, is noticed for doped and co-doped samples compared to pure ZnO. This shift suggests the incorporation of Mg and Al ions into the ZnO lattice, and it may be related to the difference in ionic radius of Al (0.53 Å) and Mg (0.72 Å) with Zn (0.74 Å).
The crystallite size was estimated using the Scherrer’s method [32] (Equation (2)) and the (101) plane was chosen for calculation.
G = 0.9   λ B   c o s θ
where G is the average crystallite size, λ is the X-ray wavelength (1.541874 Å), B is the full width at half-maximum peak (FWHM), and θ is the Bragg diffraction angle.
As shown in Table 1, the estimated crystallite sizes are approximately 36, 57, 35 and 27 nm for the ZnO, 1MZO, 5AZO and 5A1MZO, respectively. It seems that Mg doping induces grain growth. However, Al doping is responsible for the crystallite size decrease. Lattice parameters were calculated by Rietveld refinement using Fullprof program. Figure 4 presents the refined XRD pattern of the synthesized samples and Table 1 groups the estimated parameters values. They are in accordance with literature [33] and show small increase for doped and co-doped samples.
Figure 5 depicts low and high magnification SEM images of 1MZO and 5A1MZO nanoparticles. The samples show an agglomeration of sphere-shaped grains. It is observed that the sample surface is composed of agglomerated spherical particles, which are distributed all along the surface with uniform grain sizes. EDX analysis is a practical tool for detecting the chemical composition and the compounds stoichiometry. The EDX spectrum of 5A1MZO sample is shown in Figure 6. It shows distinct peaks related to zinc and oxygen atoms which presents the formation of ZnO NPs. Additionally, the higher peak at 1 keV is a characteristic to Zn and it confirms the formation of ZnO NPs [34]. Furthermore, the EDX spectrum reveals the presence of Zn, O, Al and Mg elements with suitable proportions, which proves the successful doping of Al and Mg elements in the ZnO lattice as well as the high purity of the sample. This is in accordance with XRD results.
Figure 7 reports a typical TEM image of 5A1MZO sample. The image shows prismatic shaped particles with nanometric size in the range of 15–26 nm. These crystallites size values agree well with those estimated by Scherrer’s method (27 nm) in XRD part. The white spots indicate focused ultra-small nanoparticles on the surface which may assigned of the beginning of aggregation. These nanoparticles enface the specific surface area and then improve the sensing parameters.
The HRTEM image of 5A1MZO NPs shows parallel lattice fringes with spacing of 0.24 nm, which corresponds to the (101) plane of crystalline ZnO.
Figure 8 depicts the ultraviolet–visible absorption spectra of ZnO, 1MZO, 5AZO and 5A1MZO samples. For all samples, the highest absorption is noted in the UV region. These strong absorption peaks may be assigned to the electron transitions from the valence band (VB) to conduction band (CB) (O2p–Zn3d) [35]. A low absorbance is noticed in the visible region while it slightly increases for Mg-doped ZnO nanoparticles. This is may be ascribed to different factors, namely particle size, oxygen deficiency and lattice defects [36,37]. The band-gap energy (Eg) was estimated from the Tauc’s relation, described in equation (Equation (3)) [38] and the Tauc’s plot is illustrated in Figure 9.
( α h v ) 2 = A ( h v E g )
where α is the absorption coefficient, () is the photon energy and A is a constant.
The estimated band gap was 3.24, 3.25, 3.17 and 3.19 eV for ZnO, 1MZO, 5AZO and 5A1MZO, respectively. The optical band gap energy slightly increases for 1MZO. However, it decreases for 5AZO and 5A1MZO samples. It seems to be visible that Mg is responsible for the small enhancement in gap energy and aluminum is responsible for the gap energy shrinkage. The present increase in the gap energy of 1MZO sample was theoretically obtained by Rouchdi et al. [39]. It may be related to the variance in electronegativity and ionic radius of Mg and Zn atoms which introduce defects in the ZnO lattice. The decrease in the gap energy of 5AZO sample may be attributed to the strong sp–d exchange interaction between the moving “sp” carriers, i.e., band electrons of ZnO and the localized d electrons of Al ions which substitute the Zn2+ ions [40]. Additionally, Caglar et al. [41] mentioned that Al doping induces narrowing band gap energy and it is possibly attributed to the carriers increase in the conduction band edge and to the new recombination centers formed with low emission energy.

3.2. Gas Sensing Studies

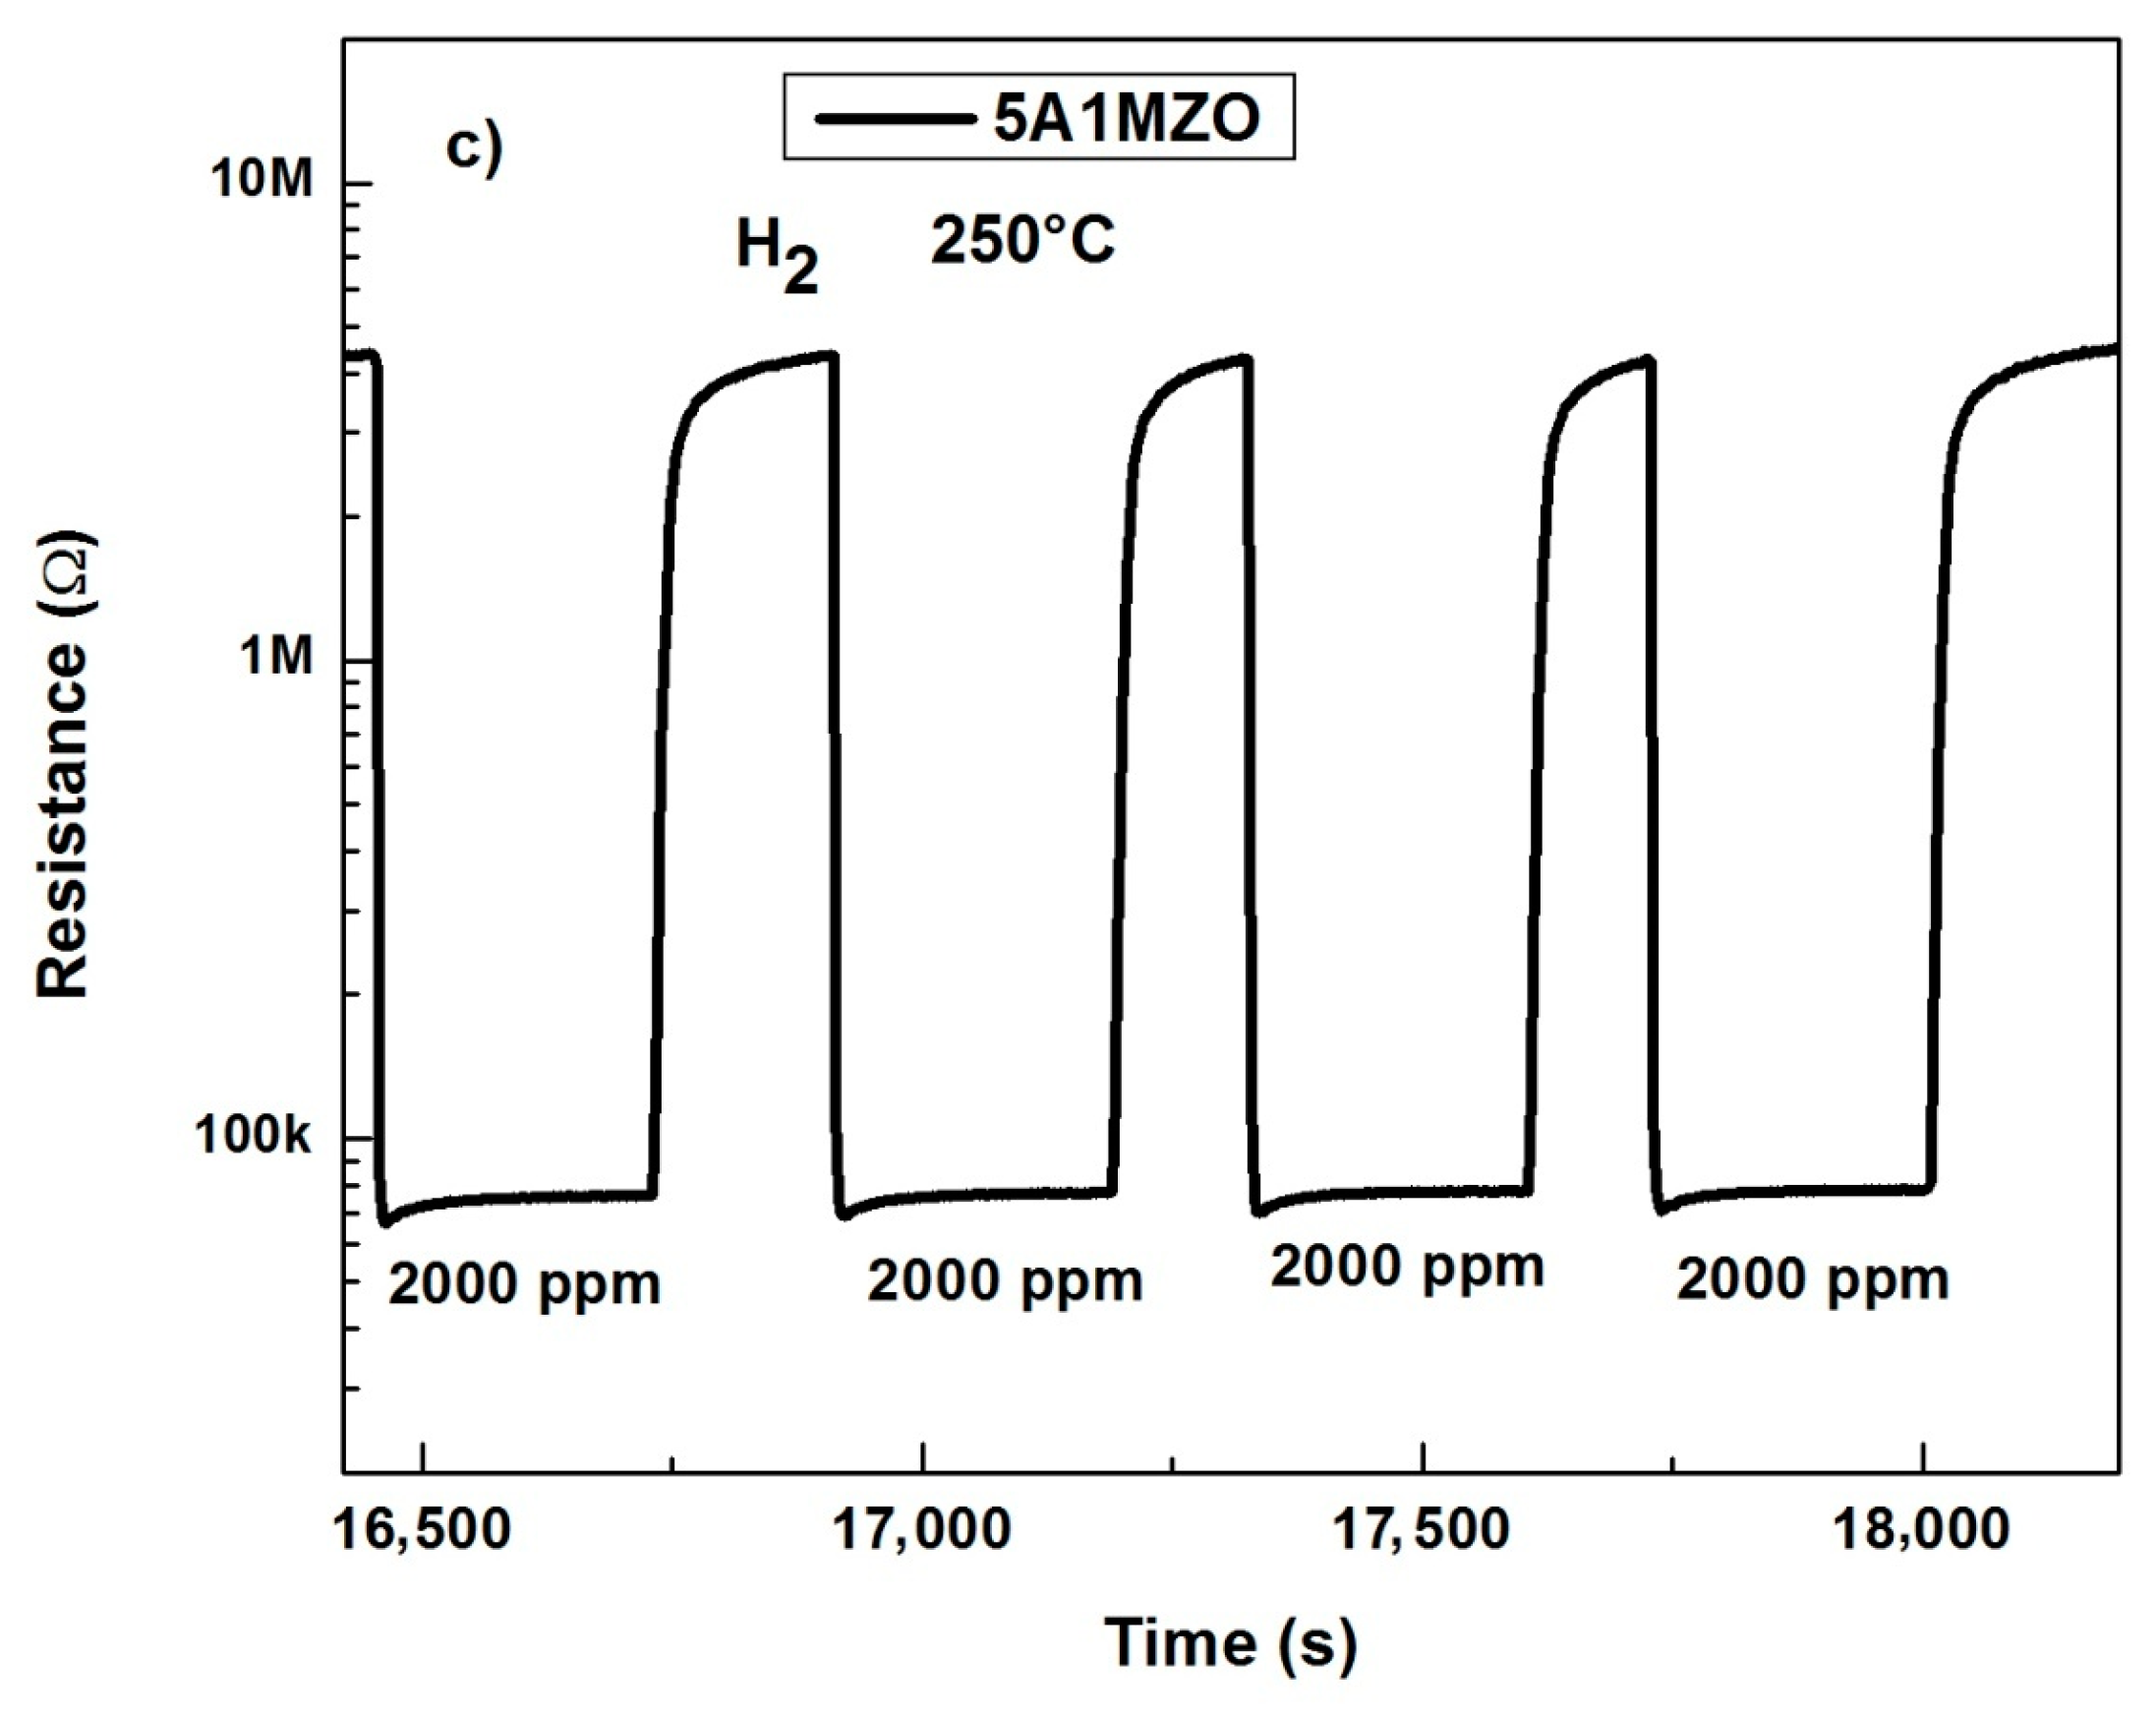
3.2.1. Effect of Al on Mg Doped ZnO NPs-Based Sensor

Hydrogen is an odorless and colorless gas with high flammability and large explosive limits (between 4 and 75% by volume) [42]. Exposure to high concentrations of hydrogen induces an oxygen-depleted environment which can provoke suffocation. Hydrogen may pose risks if not properly controlled and handled. Thus, hydrogen monitoring during its use, production transport and storage is very important for health and safety reasons.
The responses of 1MZO- and 5A1MZO-based sensors towards H2 as function of operating temperature (200–300 °C) are illustrated in Figure 10. For both sensors, the response rises along with the operating temperature. This increase depends on the adsorption of gas molecules as well as the reactivity of the gas with the adsorbed oxygen species. At low temperatures, the sensors do not have sufficient energy to efficaciously absorb H2 onto its surface. Then, the response increases, and this may be assigned to the enhancement of the chemical activity on the sensor’s surface. The doped- and co-doped-based sensors reach high response values at 250 and 300 °C (more than 80 at 300 °C). It can be observed that 5A1MZO sensor shows higher sensitivity than 1MZO-based sensor. Undoubtedly, Al doping has effects on hydrogen sensing property of the Mg doped ZnO based sensor. Indeed, Al doping can change the AMZO acid–base characteristics and thereby its gas sensing aptitude. Additionally, it engenders smaller crystallites the size of the 5A1MZO sample, which provides larger effective surface area to react the gas, and induces higher crystallinity. All of these have a positive effect on sensitivity. These entire factors provided by Al doping may be responsible to the high sensitivity of 5A1MZO sensor [43,44]. On the other hand, Shi et al. [45] have recently reported the effect of doping with metals, such as Mg, Al, Cd, Co, In and Cu, into MOx for H2 sensing. They outlined three main factors that make non-noble metals promising dopants for MOx materials. At first, the doping metal can induce a significant change in the grain size of MOx which increases the specific surface area of the material. The larger specific surface area induces more gas adsorption sites, and hence improves the sensing response capacity. Second, doping elements into the MOx lattice replace the position of the original metal particles and provoke lattice distortion. The lattice distortion can induce an increase in the surface defects of the materials which introduces a wide number of oxygen vacancies. This leads to an increase of the depletion layer on the material surface and a higher barrier. Hence, the sensor will be more sensitive to the targeted gas. At last, the doping metal ions can adjust the energy band structure by affecting the surface potential and the carrier concentration in the host material. This may cause quick charge transfer and the improvement of sensing properties.
Both sensors exhibit comparable response times (around 3 s at 250 °C). However, the recovery time was shorter for the 5A1MZO sensor (70 s at 250 °C) compared to that of 1MZO (>200 s at 250 °C) sensor. The faster recovery time may be assigned to the larger surface area for chemical reaction provided by Al doping [46].

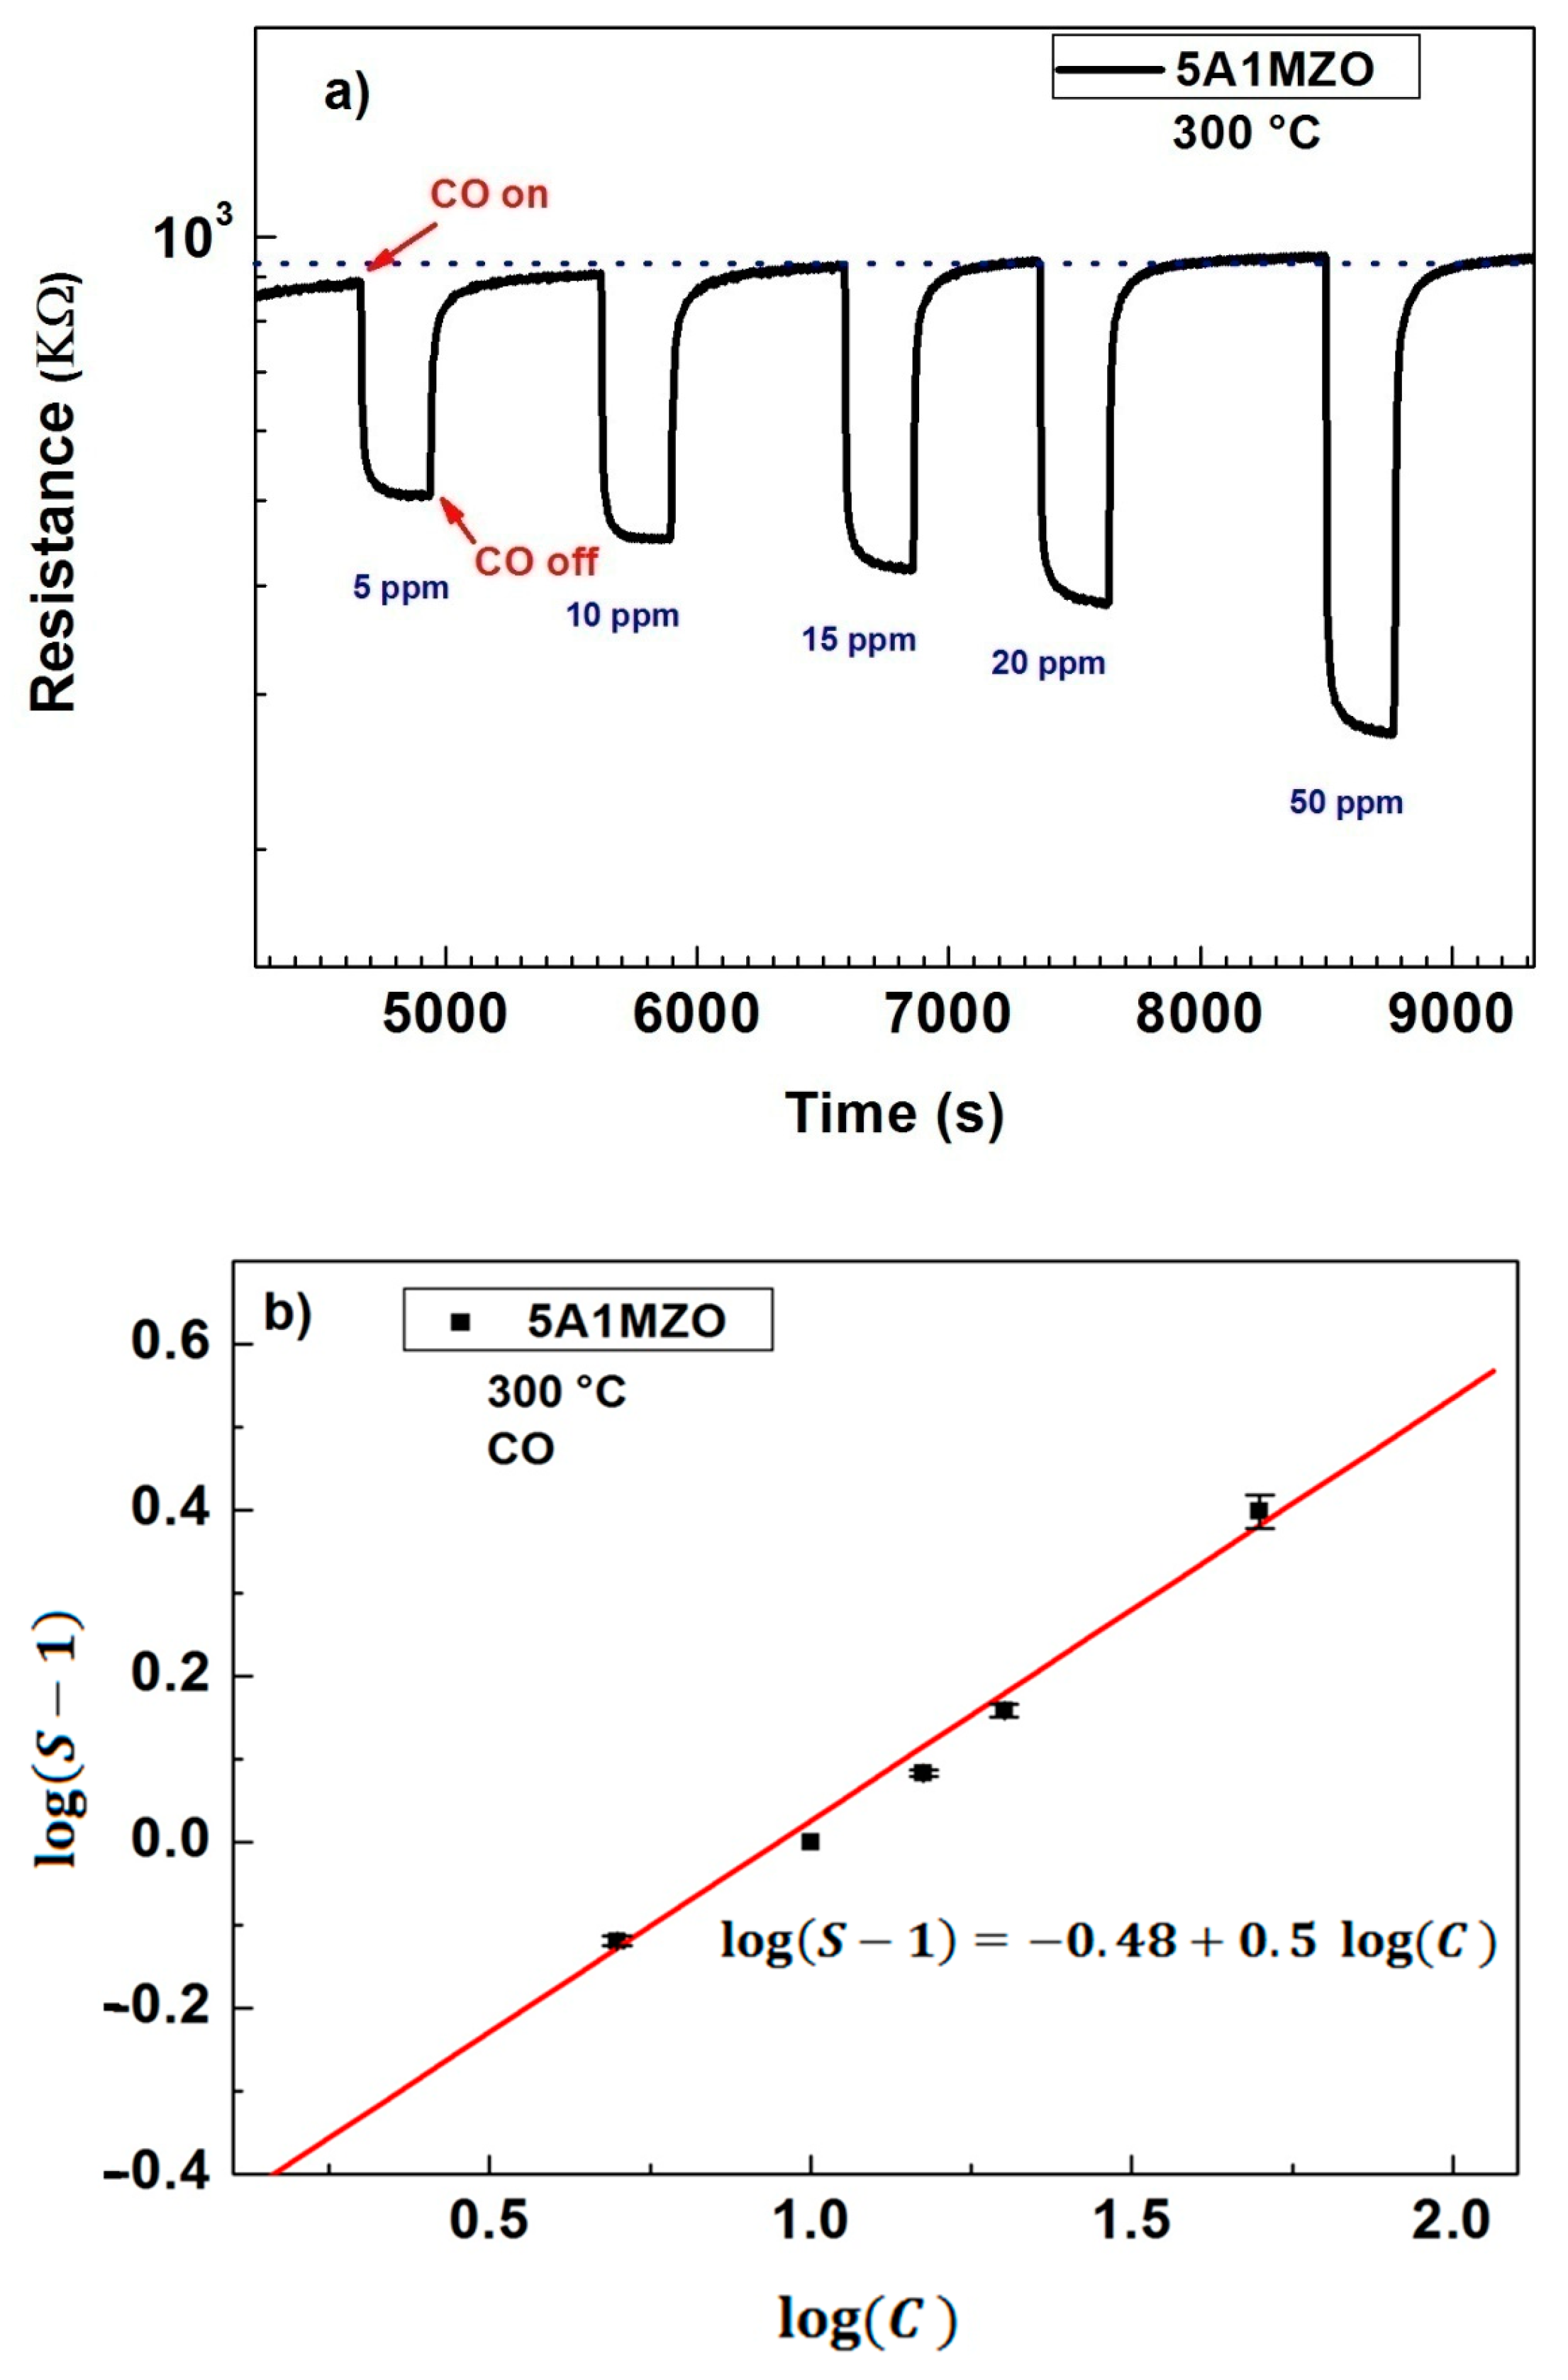
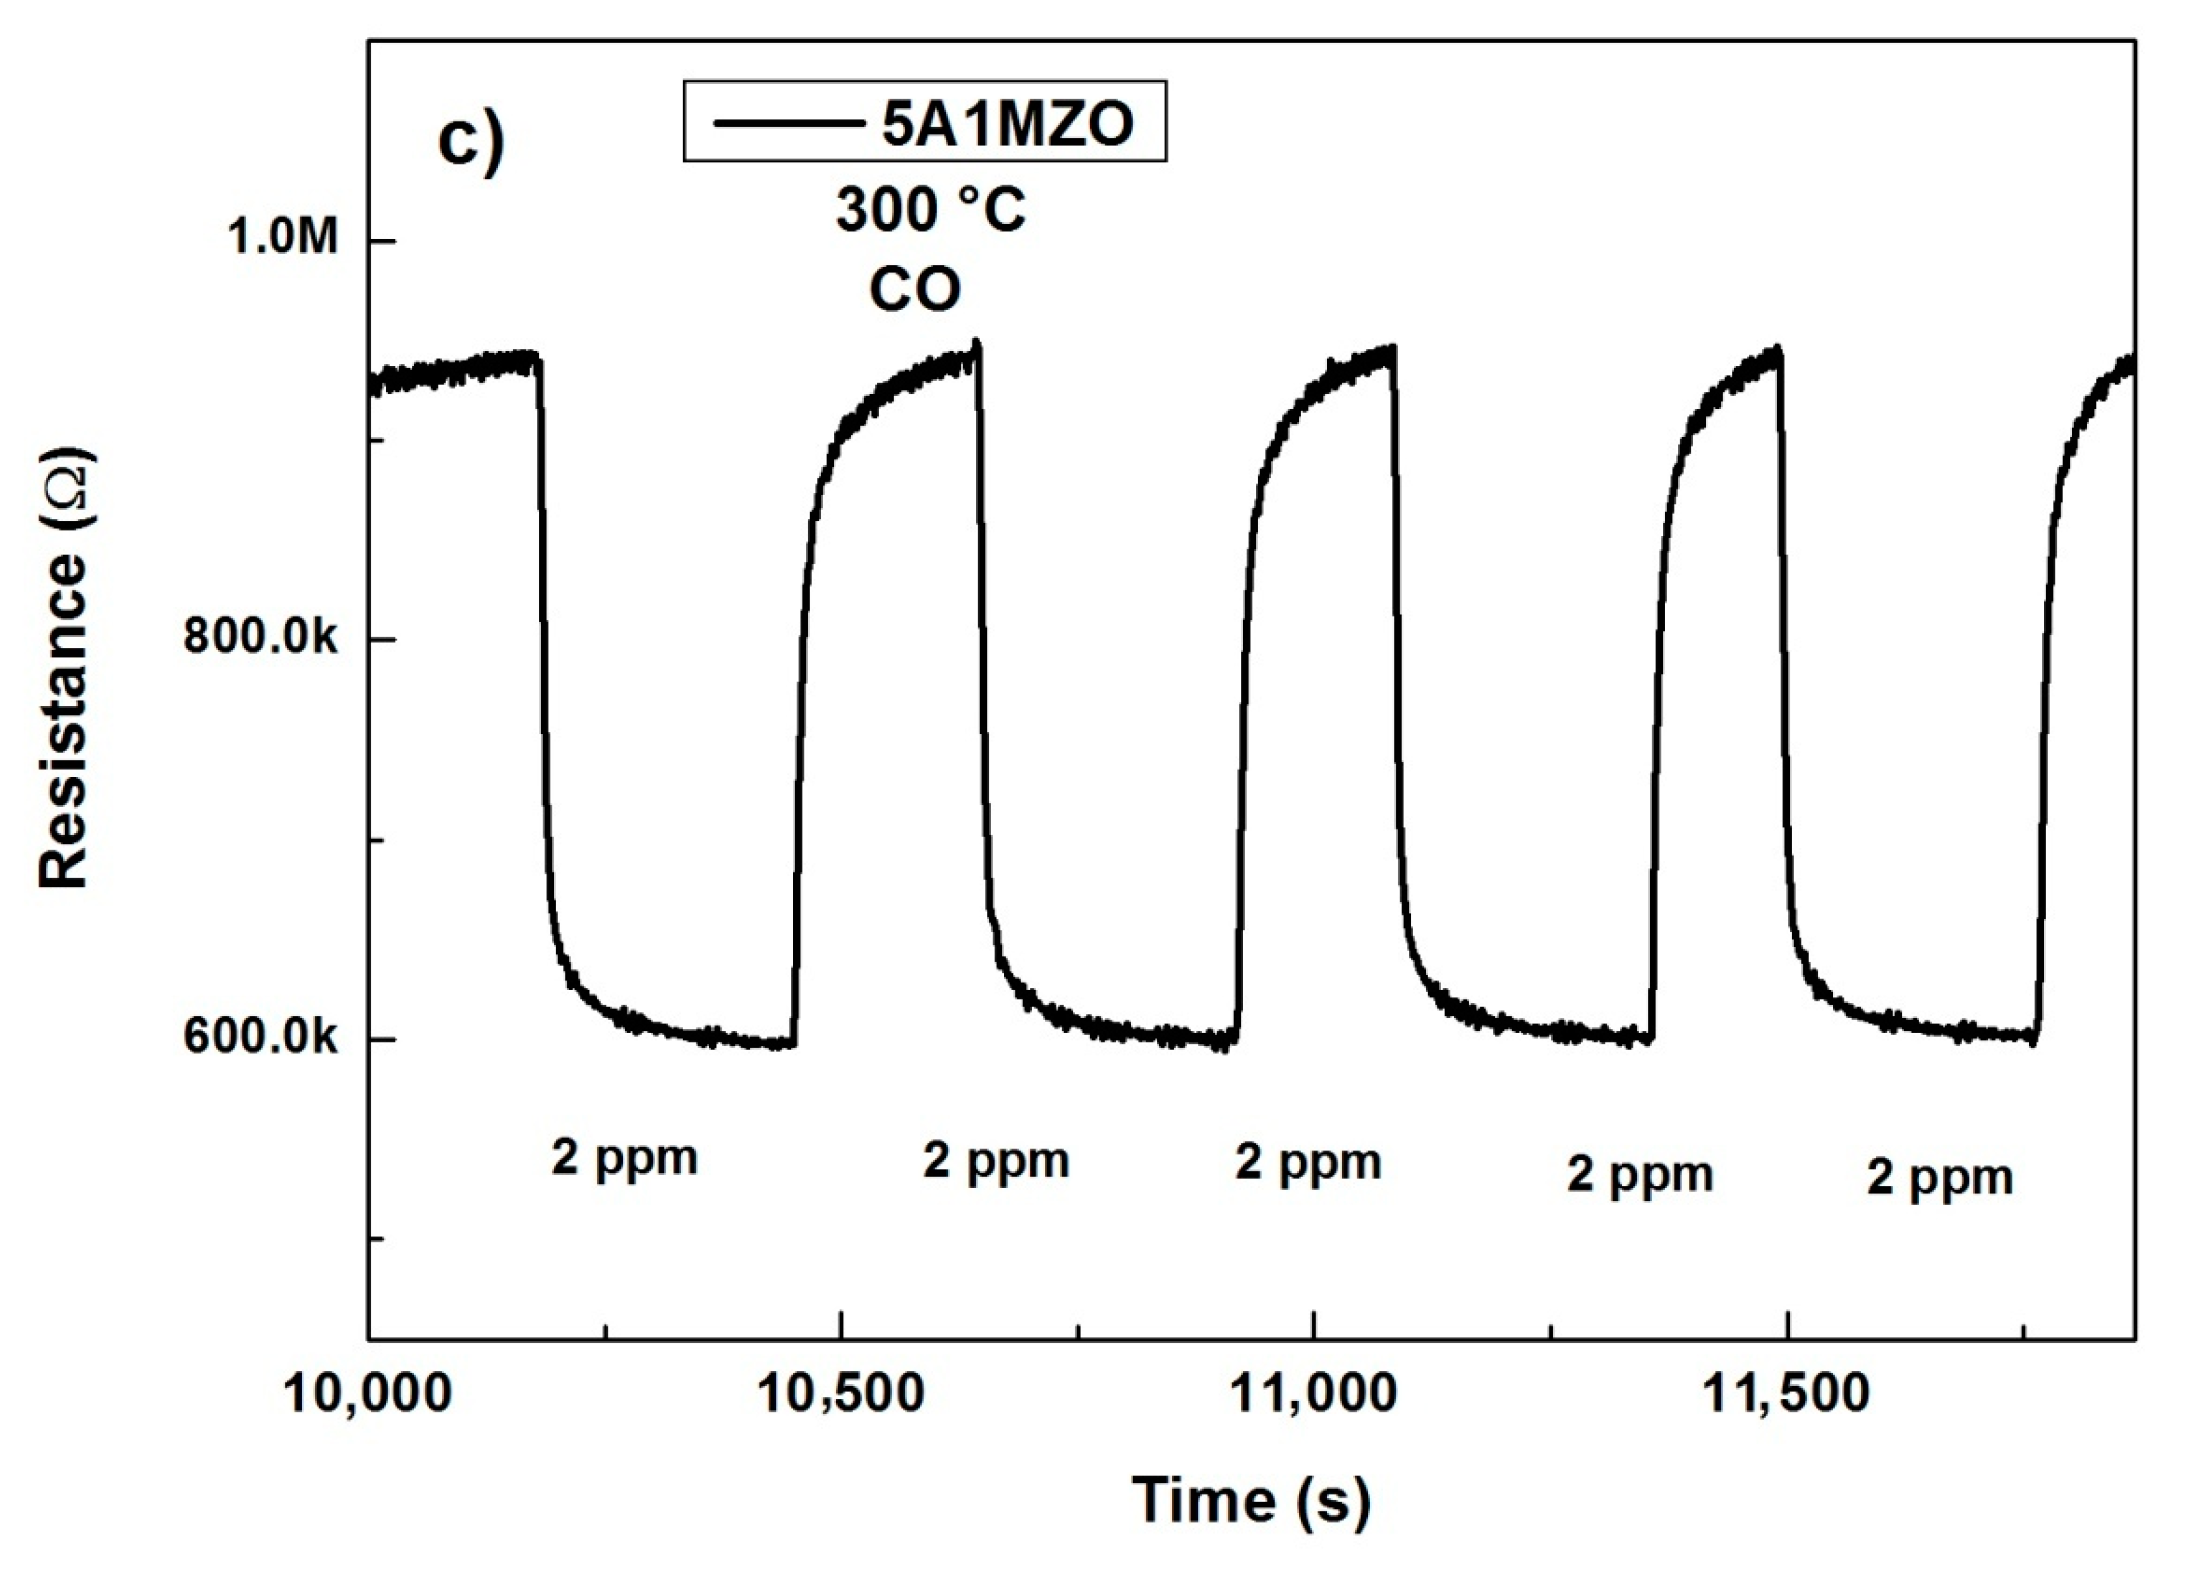
3.2.2. Effect of Mg Doping on Al Doped ZnO NPs-Based Sensor for CO Sensing

Carbon monoxide (CO) is an odorless, colorless, flammable and toxic gas which is produced by fossil fuel combustion, automotive emissions, industrial activities and household fuel-based devices. Exposure to high CO concentrations can provoke disorientation and loss of judgment and even death [47]. Figure 11 presents a histogram for the gas-sensing response of the 5AZO and 5A1MZO nanoparticles-based sensor towards CO gas. It is apparent that 5AZO displays high CO response. Indeed, many studies showed also the positive effect of aluminum doped ZnO on CO sensors [48,49,50]. The improved detection properties of Al-doped ZnO samples is mainly attributed to electronic effects that alter the reactivity of the detection layer’s surface [51]. In addition to this, it can be seen that the 5A1MZO response exhibits higher response compared to 5AZO-based sensor. Therefore, adding magnesium enhances the gas sensing properties of 5AZO sensor. According to work realized by Amin et al., the improvement of gas response may be related to the catalytic effect of magnesium, the provided defects such as oxygen vacancies, and also to the fast chemisorption and desorption of CO gas [52].

3.2.3. Gas Sensing Mechanism

It is known that the gas sensing properties are considerably influenced by the carrier concentration and the chemisorbed oxygen species on the sensing materials surface. During the test process, the detected gas molecules are adsorbed and desorbed on the surface of the n-type semiconductor material and this causes the change of its resistance. When the sensor is exposed to air environment, plenty of oxygen molecules are adsorbed on the material surface. They capture free electrons from the ZnO conduction band and form different oxygen anions like O2, O, O2− as well as a space charge depletion layer. Consequently, this process forms a depletion layer on the metal oxide nanomaterials surface and causes the increase of sensor resistance. The reactions process for the formation of different oxygen anions can be described as following (Equations (4)–(7)) [53].
O 2 ( g a s ) O 2 ( a d s )
O 2 ( a d s ) + e O 2 ( a d s )
O 2 ( a d s ) + e 2 O ( a d s )
O ( a d s ) + e O ( a d s ) 2
After that, when a reducing gas such as H2 or CO is injected into the chamber, the gas molecules react with the oxygen anion and release the trapped electrons back to the ZnO conduction band. The space charge depletion layer on the ZnO surface is reduced and then the sensor resistance decreases. The interaction between the chemisorbed oxygen species and H2 and CO gas in the 200–300 °C range can be described as follows (Equations (8) and (9)):
H 2 + O ( a d s ) H 2 O + e
C O + O C O 2 + e ¯
The effect of changing concentrations of tested gases (H2, CO) on the Al–Mg co-doped ZnO-based sensor was analyzed. Figure 12a represents the concentration sensitivity curve of different H2 concentrations (100 to 30,000 ppm) at the operating temperature of 250 °C. Figure 13a illustrates the sensitivity curves of different concentrations of CO (2–80 ppm) of 5A1MZO-based sensor at 300 °C. It can be seen that the response of both testing gases increases whenever concentrations increase. Over the entire measured concentration range, the fabricated sensor presents a fully reversible response toward tested gas. Indeed, the sensor response decreases from Ra to Rg upon the injection of reducing gas and returns to its initial values (Ra) after ceasing the supply of the target gas. This behavior is attributed to the n-type semiconducting behavior of ZnO and to the reducing nature of the gases [54].
The response of metal oxide semiconductor (MOS) gas sensors can be expressed according to the following relationship (Equation(10)) [44].
S = a[C]b + 1
where S is the gas response, C is the gas concentration, and a and b are constants. Generally, the ideal value of the exponent b is around 1 or 0.5, depending on the charge state of the surface species, the stoichiometry of the elementary surface reactions between oxygen and tested gases, as well as microstructure of the materials [55]. Generally, it is 0.5 and 1 for the adsorbed oxygen ion O and O2−, respectively. The b value can be calculated from the plot log(S-1) versus log(C). Figure 12b and Figure 13b show the log (S-1) versus log(C) plot of 5A1MZO-based sensor toward different gases. As can be seen, there is a linear relationship of gas sensor response and gas concentration. The estimated b values are 0.541 and 0.5 for H2, and CO gas, respectively; indicating that the oxygen ions absorbed on the surface are mainly O. By extrapolating the linear graph, it can be noted a detection limit of few ppm of H2 (<2 ppm) and CO (<1 ppm).
Reproducibility was also studied, as mentioned in Figure 12c and Figure 13c. The sensor showed good reproducibility towards 4 cycles of 2000 ppm H2 and 20 ppm CO. Selectivity was also studied. Figure 14 shows the responses of the 5A1MZO sensor towards 2000 ppm H2, 20 ppm CO and 2000 ppm CO2 at temperature in the range of 200–300 °C. The sensor showed high selectivity towards H2 gas at different temperatures.
Moreover, the performances of 5A1MZO sensor towards H2 and CO are summarized in Table 2 and compared with other resistance-type sensors. It can be seen from this table that 5A1MZO sensor have competitive results towards the reducing gases like H2 and CO.

4. Conclusions

ZnO, 1MZO, 5AZO and 5A1MZO NPs were synthesized by a modified sol-gel technique. XRD study showed the crystallized and hexagonal structure of prepared nanoparticles. TEM images of 5A1MZO and SEM images of 1MZO and 5A1MZO confirmed the nanometric sizes of the NPs. EDX results showed the purity of the 5A1MZO sample and confirmed the presence of Al and Mg in ZnO lattice. Absorbance spectra showed a strong absorption in the UV range. Optical band gaps were determined using Tauc’s plot. The estimated value slightly increased with the addition of Mg loading and decreased with Al content. The effect of Mg and Al on improving the reducing gases H2 and CO was discussed. Sensing results indicated that the ternary 5A1MZO-based sensor is sensitive to the reducing gases with low detection limit. It also showed good reproducibility towards H2 and CO and high selectivity towards H2 gas at different temperatures. Hence, the 5A1MZO sample is an inspiring sensing material for practical applications.

Author Contributions

Conceptualization, S.J., L.E.M., G.N.; Investigation, S.J., Y.A., I.A., I.G., C.B. H.D., G.N., L.E.M.; Writing—Original Draft Preparation, S.J.; Writing—Review & Editing, L.E.M. All authors have read and agreed to the published version of the manuscript.

Funding

This work was funded by the National Plan for Sciences, Technology and innovation (MAARIFAH), King Abdulaziz City for Sciences and Technology, Kingdom of Saudi Arabia, award number: 13-NAN517-08.

Institutional Review Board Statement

Not applicable.

Informed Consent Statement

Not applicable.

Conflicts of Interest

The authors declare no conflict of interest.

References

  1. Manjunath, G.; Nagaraju, P.; Mandal, S. Ultra-sensitive clogging free combustible molecular precursor-based screen-printed ZnO sensors: A detection of ammonia and formaldehyde breath markers. J. Mater. Sci. Mater. Electron. 2021, 32, 5713–5728. [Google Scholar] [CrossRef]
  2. Rosli, N.; Halim, M.M.; Hashim, M.R. Effect of CBD growth times on the ZnO microrods prepared on macroporous silicon. Appl. Phys. A 2021, 127, 1–12. [Google Scholar] [CrossRef]
  3. Que, M.; Lin, C.; Sun, J.; Chen, L.; Sun, X.; Sun, Y. Progress in ZnO Nanosensors. Sensors 2021, 21, 5502. [Google Scholar] [CrossRef]
  4. Nakate, U.; Ahmad, R.; Patil, P.; Bhat, K.S.; Wang, Y.; Mahmoudi, T.; Yu, Y.; Suh, E.-K.; Hahn, Y.-B. High response and low concentration hydrogen gas sensing properties using hollow ZnO particles transformed from polystyrene@ZnO core-shell structures. Int. J. Hydrogen Energy 2019, 44, 15677–15688. [Google Scholar] [CrossRef]
  5. Dhahri, R.; Leonardi, S.; Hjiri, M.; El Mir, L.; Bonavita, A.; Donato, N.; Iannazzo, D.; Neri, G. Enhanced performance of novel calcium/aluminum co-doped zinc oxide for CO2 sensors. Sens. Actuators B Chem. 2016, 239, 36–44. [Google Scholar] [CrossRef]
  6. El Ghoul, J.; Omri, K.; El Mir, L.; Barthou, C.; Alaya, S. Sol-gel synthesis and luminescence properties of SiO2/Zn2SiO4 and SiO2/Zn2SiO4:V composite materials. J. Lumin. 2012, 132, 2288. [Google Scholar] [CrossRef]
  7. Rajput, P.; Vashishtha, P.; Gupta, G.; Kamni. A comparative study on structural and optical properties of ZnO nanoparticles prepared by three different synthesis methods. Mater. Today Proc. 2021, 43, 3856–3861. [Google Scholar] [CrossRef]
  8. Nguyen, H.T.P.; Nguyen, T.M.T.; Hoang, C.N.; Le, T.K.; Lund, T.; Huynh, T.K.X. Characterization and photocatalytic activity of new photocatalysts based on Ag, F-modified ZnO nanoparticles prepared by thermal shock method. Arab. J. Chem. 2020, 13, 1837–1847. [Google Scholar] [CrossRef]
  9. Anugrahwidya, R.; Yudasari, N.; Tahir, D. Optical and structural investigation of synthesis ZnO/Ag Nanoparticles prepared by laser ablation in liquid. Mater. Sci. Semicond. Process. 2019, 105, 104712. [Google Scholar] [CrossRef]
  10. Taha, K.K.; Modwi, A.; Elamin, M.; Arasheed, R.; Al-Fahad, A.J.; Albutairi, I.; Arasheed, H.; Alfaify, M.; Anojaidi, K.; Algethami, F.K.; et al. Impact of Hibiscus extract on the structural and activity of sonochemically fabricated ZnO nanoparticles. J. Photochem. Photobiol. A Chem. 2019, 390, 112263. [Google Scholar] [CrossRef]
  11. Husin, H.; Chen, H.-M.; Su, W.-N.; Pan, C.-J.; Chuang, W.-T.; Sheu, H.-S.; Hwang, B.-J. Green fabrication of La-doped NaTaO3 via H2O2 assisted sol–gel route for photocatalytic hydrogen production. Appl. Catal. B Environ. 2010, 102, 343–351. [Google Scholar] [CrossRef]
  12. Ali, S.; Gupta, A.; Shafiei, M.; Langford, S. Recent Advances in Perylene Diimide-Based Active Materials in Electrical Mode Gas Sensing. Chemosensors 2021, 9, 30. [Google Scholar] [CrossRef]
  13. Singh, E.; Meyyappan, M.; Nalwa, H.S. Flexible graphene-based wearable gas and chemical sensors. ACS Appl. Mater. Interfaces 2017, 9, 34544–34586. [Google Scholar] [CrossRef]
  14. Fazio, E.; Spadaro, S.; Corsaro, C.; Neri, G.; Leonardi, S.G.; Neri, F.; Lavanya, N.; Sekar, C.; Donato, N.; Neri, G. Metal-Oxide Based Nanomaterials: Synthesis, Characterization and Their Applications in Electrical and Electrochemical Sensors. Sensors 2021, 21, 2494. [Google Scholar] [CrossRef] [PubMed]
  15. Wang, Y.; Meng, X.-N.; Cao, J.-l. Rapid detection of low concentration CO using Pt-loaded ZnO nanosheets. J. Hazard. Mater. 2020, 381, 120944. [Google Scholar] [CrossRef]
  16. Ani, A.; Poornesh, P.; Nagaraja, K.; Kolesnikov, E.; Shchetinin, I.V.; Antony, A.; Kulkarni, S.D.; Sanjeev, G.; Petwal, V.C.; Verma, V.P. Tuning of CO gas sensing performance of spray pyrolyzed ZnO thin films by electron beam irradiation. Mater. Sci. Semicond. Process. 2020, 119, 105249. [Google Scholar] [CrossRef]
  17. González-Garnica, M.; Galdámez-Martínez, A.; Malagón, F.; Ramos, C.; Santana, G.; Abolhassani, R.; Panda, P.K.; Kaushik, A.; Mishra, Y.K.; Karthik, T.V. One dimensional Au-ZnO hybrid nanostructures based CO2 detection: Growth mechanism and role of the seed layer on sensing performance. Sens. Actuators B Chem. 2021, 337, 129765. [Google Scholar] [CrossRef]
  18. Nguyen, T.T.O.; Truong, T.H.; Le, A.T.; Dai Nguyen, T. Facile synthesis of different ZnO nanostructures for detecting sub-ppm NO2 gas. Mater. Today Commun. 2020, 22, 100826. [Google Scholar]
  19. Lou, C.; Wang, K.; Mei, H.; Xie, J.; Zheng, W.; Liu, X.; Zhang, J. ZnO nanoarrays via a thermal decomposition–deposition method for sensitive and selective NO2 detection. Cryst. Eng. Comm. 2021, 23, 3654–3663. [Google Scholar] [CrossRef]
  20. Kumar, M.; Bhati, V.S.; Ranwa, S.; Singh, J. Pd/ZnO nanorods based sensor for highly selective detection of extremely low concentration hydrogen. Sci. Rep. 2017, 7, 236. [Google Scholar] [CrossRef]
  21. Yang, Y.; Wang, X.; Yi, G.; Li, H.; Shi, C.; Sun, G.; Zhang, Z. Hydrothermally synthesized porous ZnO nanosheets for methane sensing at lower temperature. J. Porous Mater. 2020, 27, 1363–1368. [Google Scholar] [CrossRef]
  22. Kanaparthi, S.; Singh, S.G. Highly sensitive and ultra-fast responsive ammonia gas sensor based on 2D ZnO nanoflakes. Mater. Sci. Energy Technol. 2020, 3, 91–96. [Google Scholar] [CrossRef]
  23. Nakarungsee, P.; Srirattanapibul, S.; Issro, C.; Tang, I.-M.; Thongmee, S. High performance Cr doped ZnO by UV for NH3 gas sensor. Sens. Actuators A Phys. 2020, 314, 112230. [Google Scholar] [CrossRef]
  24. Vijayalakshmi, K.; Karthick, K. Influence of Mg doping on the morphology and optical properties of ZnO films for enhanced H2 sensing. Microsc. Res. Tech. 2013, 76, 1118–1124. [Google Scholar] [CrossRef] [PubMed]
  25. Agarwal, S.; Kumar, S.; Agrawal, H.; Moinuddin, M.G.; Kumar, M.; Sharma, S.K.; Awasthi, K. An Efficient Hydrogen Gas Sensor Based on Hierarchical Ag/ZnO Hollow Microstructures. Sens. Actuators B Chem. 2021, 130510. [Google Scholar] [CrossRef]
  26. Jaballah, S.; Benamara, M.; Dahman, H.; Ly, A.; Lahem, D.; Debliquy, M.; Mir, L.E. Effect of Mg-doping ZnO nanoparticles on detection of low ethanol concentrations. Mater. Chem. Phys. 2020, 255, 123643. [Google Scholar] [CrossRef]
  27. Jaballah, S.; Benamara, M.; Dahman, H.; Lahem, D.; Debliquy, M.; El Mir, L. Formaldehyde sensing characteristics of calcium-doped zinc oxide nanoparticles-based gas sensor. J. Mater. Sci. Mater. Electron. 2020, 31, 8230–8239. [Google Scholar] [CrossRef]
  28. Samoei, V.K.; Jayatissa, A.H. Aluminum doped zinc oxide (AZO)-based pressure sensor. Sens. Actuators A Phys. 2020, 303, 111816. [Google Scholar] [CrossRef]
  29. El Mir, L.; Ayadi, Z.B.; Saadoun, M.; Djessas, K.; von Bardeleben, H.J.; Alaya, S. Preparation and characterization of n-type conductive (Al, Co) co-doped ZnO thin films deposited by sputtering from aerogel nanopowders. Appl. Surf. Sci. 2007, 254, 570–573. [Google Scholar] [CrossRef]
  30. Omri, K.; Alyamani, A.; El Mir, L. Photoluminescence and cathodoluminescence of Mn doped zinc silicate nanophosphors for green and yellow field emissions displays. Appl. Phys. A Mater. Sci. Process. 2018, 124, 215. [Google Scholar] [CrossRef]
  31. Dhahri, R.; Hjiri, M.; Mir, L.E.; Bonavita, A.; Iannazzo, D.; Leonardi, S.G.; Neri, G. CO sensing properties under UV radiation of Ga-doped ZnO nanopowders. Appl. Surf. Sci. 2015, 355, 1321–1326. [Google Scholar] [CrossRef]
  32. Muthukumaran, S.; Gopalakrishnan, R. Structural, FTIR and photoluminescence studies of Cu doped ZnO nanopowders by co-precipitation method. Opt. Mater. 2012, 34, 1946–1953. [Google Scholar] [CrossRef]
  33. Karthik, S.; Siva, P.; Balu, K.S.; Suriyaprabha, R.; Rajendran, V.; Maaza, M. Acalypha indica–mediated green synthesis of ZnO nanostructures under differential thermal treatment: Effect on textile coating, hydrophobicity, UV resistance, and antibacterial activity. Adv. Powder Technol. 2017, 28, 3184–3194. [Google Scholar] [CrossRef]
  34. Han, B.; Liu, X.; Xing, X.; Chen, N.; Xiao, X.; Liu, S.; Wang, Y. A high response butanol gas sensor based on ZnO hollow spheres. Sens. Actuators B Chem. 2016, 237, 423–430. [Google Scholar] [CrossRef]
  35. Boukhoubza, I.; Khenfouch, M.; Achehboune, M.; Leontie, L.; Galca, A.C.; Enculescu, M.; Carlescu, A.; Guerboub, M.; Mothudi, B.M.; Jorio, A. Graphene Oxide Concentration Effect on the Optoelectronic Properties of ZnO/GO Nanocomposites. Nanomaterials 2020, 10, 1532. [Google Scholar] [CrossRef] [PubMed]
  36. Siregar, N.; Panggabean, J. The effect magnesium (Mg) on structural and optical properties of ZnO: Mg thin film by sol-gel spin coating method. J. Phys. Conf. Ser. 2020, 1428, 012026. [Google Scholar] [CrossRef]
  37. Pradeev Raj, K.; Sadaiyandi, K.; Kennedy, A.; Sagadevan, S.; Chowdhury, Z.Z.; Johan, M.R.B.; Aziz, F.A.; Rafique, R.F.; Thamiz Selvi, R.; Rathina Bala, R. Influence of Mg Doping on ZnO Nanoparticles for Enhanced Photocatalytic Evaluation and Antibacterial Analysis. Nanoscale Res. Lett. 2018, 13, 229. [Google Scholar] [CrossRef] [PubMed]
  38. Dhawan, R.; Panda, E. Mg addition in undoped and Al-doped ZnO films: Fabricating near UV transparent conductor by bandgap engineering. J. Alloy. Compd. 2019, 788, 1037–1047. [Google Scholar] [CrossRef]
  39. Rouchdi, M.; Salmani, E.; Fares, B.; Hassanain, N.; Mzerd, A. Synthesis and characteristics of Mg doped ZnO thin films: Experimental and ab-initio study. Results Phys. 2017, 7, 620–627. [Google Scholar] [CrossRef]
  40. Varudkar, H.; Umadevi, G.; Nagaraju, P.; Dargad, J.; Mote, V. Fabrication of Al-doped ZnO nanoparticles and their application as a semiconductor-based gas sensor for the detection of ammonia. J. Mater. Sci. Mater. Electron. 2020, 31, 12579–12585. [Google Scholar] [CrossRef]
  41. Caglar, Y.; Caglar, M.; Ilican, S. Microstructural, optical and electrical studies on sol gel derived ZnO and ZnO: Al films. Curr. Appl. Phys. 2012, 12, 963–968. [Google Scholar] [CrossRef]
  42. Hübert, T.; Boon-Brett, L.; Black, G.; Banach, U. Hydrogen sensors—A review. Sens. Actuators B Chem. 2011, 157, 329–352. [Google Scholar] [CrossRef]
  43. Al-Asedy, H.J.; Bidin, N.; Al-khafaji, S.A.; Bakhtiar, H. Sol-gel grown aluminum/gallium co-doped ZnO nanostructures: Hydrogen gas sensing attributes. Mater. Sci. Semicond. Process. 2018, 77, 50–57. [Google Scholar] [CrossRef]
  44. Khojier, K. Preparation and investigation of Al-doped ZnO thin films as a formaldehyde sensor with extremely low detection limit and considering the effect of RH. Mater. Sci. Semicond. Process. 2021, 121, 105283. [Google Scholar] [CrossRef]
  45. Shi, Y.; Xu, H.; Liu, T.; Zeb, S.; Nie, Y.; Zhao, Y.; Qin, C.; Jiang, X. Advanced development of metal oxide nanomaterials for H2 gas sensing applications. Mater. Adv. 2021, 2, 1530–1569. [Google Scholar] [CrossRef]
  46. Zhao, M.; Wang, X.; Cheng, J.; Zhang, L.; Jia, J.; Li, X. Synthesis and ethanol sensing properties of Al-doped ZnO nanofibers. Curr. Appl. Phys. 2013, 13, 403–407. [Google Scholar] [CrossRef]
  47. Qin, C.; Wang, B.; Li, P.; Sun, L.; Han, C.; Wu, N.; Wang, Y. Metal-organic framework-derived highly dispersed Pt nanoparticles-functionalized ZnO polyhedrons for ppb-level CO detection. Sens. Actuators B Chem. 2021, 331, 129433. [Google Scholar] [CrossRef]
  48. Zhang, J.; Yang, C.; Li, S.; Yang, P.; Xi, Y.; Cai, C.; Liu, W. Preparation of Al3+-doped ZnO micro–nanospheres for highly sensitive CO gas sensors. Appl. Phys. A 2021, 127, 176. [Google Scholar] [CrossRef]
  49. Lim, S.K.; Hong, S.H.; Hwang, S.-H.; Choi, W.M.; Kim, S.; Park, H.; Jeong, M.G. Synthesis of Al-doped ZnO nanorods via microemulsion method and their application as a CO gas sensor. J. Mater. Sci. Technol. 2015, 31, 639–644. [Google Scholar] [CrossRef]
  50. Hadipour, N.L.; Ahmadi Peyghan, A.; Soleymanabadi, H. Theoretical study on the Al-doped ZnO nanoclusters for CO chemical sensors. J. Phys. Chem. C 2015, 119, 6398–6404. [Google Scholar] [CrossRef]
  51. Dhahri, R.; Hjiri, M.; El Mir, L.; Bonavita, A.; Iannazzo, D.; Latino, M.; Donato, N.; Leonardi, S.G.; Neri, G. Gas sensing properties of Al-doped ZnO for UV-activated CO detection. J. Phys. D Appl. Phys. 2016, 49, 135502. [Google Scholar] [CrossRef]
  52. Amin, M.; Shah, N.A.; Bhatti, A.S.; Malik, M.A. Effects of Mg doping on optical and CO gas sensing properties of sensitive ZnO nanobelts. CrystEngComm 2014, 16, 6080–6088. [Google Scholar] [CrossRef]
  53. Mohamed, R.; Mamat, M.; Ismail, A.; Malek, M.; Zoolfakar, A.; Khusaimi, Z.; Suriani, A.; Mohamed, A.; Ahmad, M.; Rusop, M. Hierarchically assembled tin-doped zinc oxide nanorods using low-temperature immersion route for low temperature ethanol sensing. J. Mater. Sci. Mater. Electron. 2017, 28, 16292–16305. [Google Scholar]
  54. Sen, S.; Kundu, S. Reduced graphene oxide (rGO) decorated ZnO-SnO2: A ternary nanocomposite towards improved low concentration VOC sensing performance. J. Alloys Compd. 2021, 881, 160406. [Google Scholar] [CrossRef]
  55. Zhang, T.; Gu, F.; Han, D.; Wang, Z.; Guo, G. Synthesis, characterization and alcohol-sensing properties of rare earth doped In2O3 hollow spheres. Sens. Actuators B Chem. 2013, 177, 1180–1188. [Google Scholar] [CrossRef]
  56. Kumaresan, M.; Venkatachalam, M.; Saroja, M.; Gowthaman, P. TiO2 nanofibers decorated with monodispersed WO3 heterostruture sensors for high gas sensing performance towards H2 gas. Inorg. Chem. Commun. 2021, 129, 108663. [Google Scholar] [CrossRef]
  57. Han, Z.; Ren, J.; Zhou, J.; Zhang, S.; Zhang, Z.; Yang, L.; Yin, C. Multilayer porous Pd-WO3 composite thin films prepared by sol-gel process for hydrogen sensing. Int. J. Hydrog. Energy 2020, 45, 7223–7233. [Google Scholar] [CrossRef]
  58. Ani, A.; Poornesh, P.; Nagaraja, K.; Hegde, G.; Kolesnikov, E.; Shchetinin, I.V.; Antony, A.; Kulkarni, S.D. Evaluation of spray pyrolysed In: ZnO nanostructures for CO gas sensing at low concentration. J. Mater. Sci. Mater. Electron. 2021, 32, 22599–22616. [Google Scholar] [CrossRef]
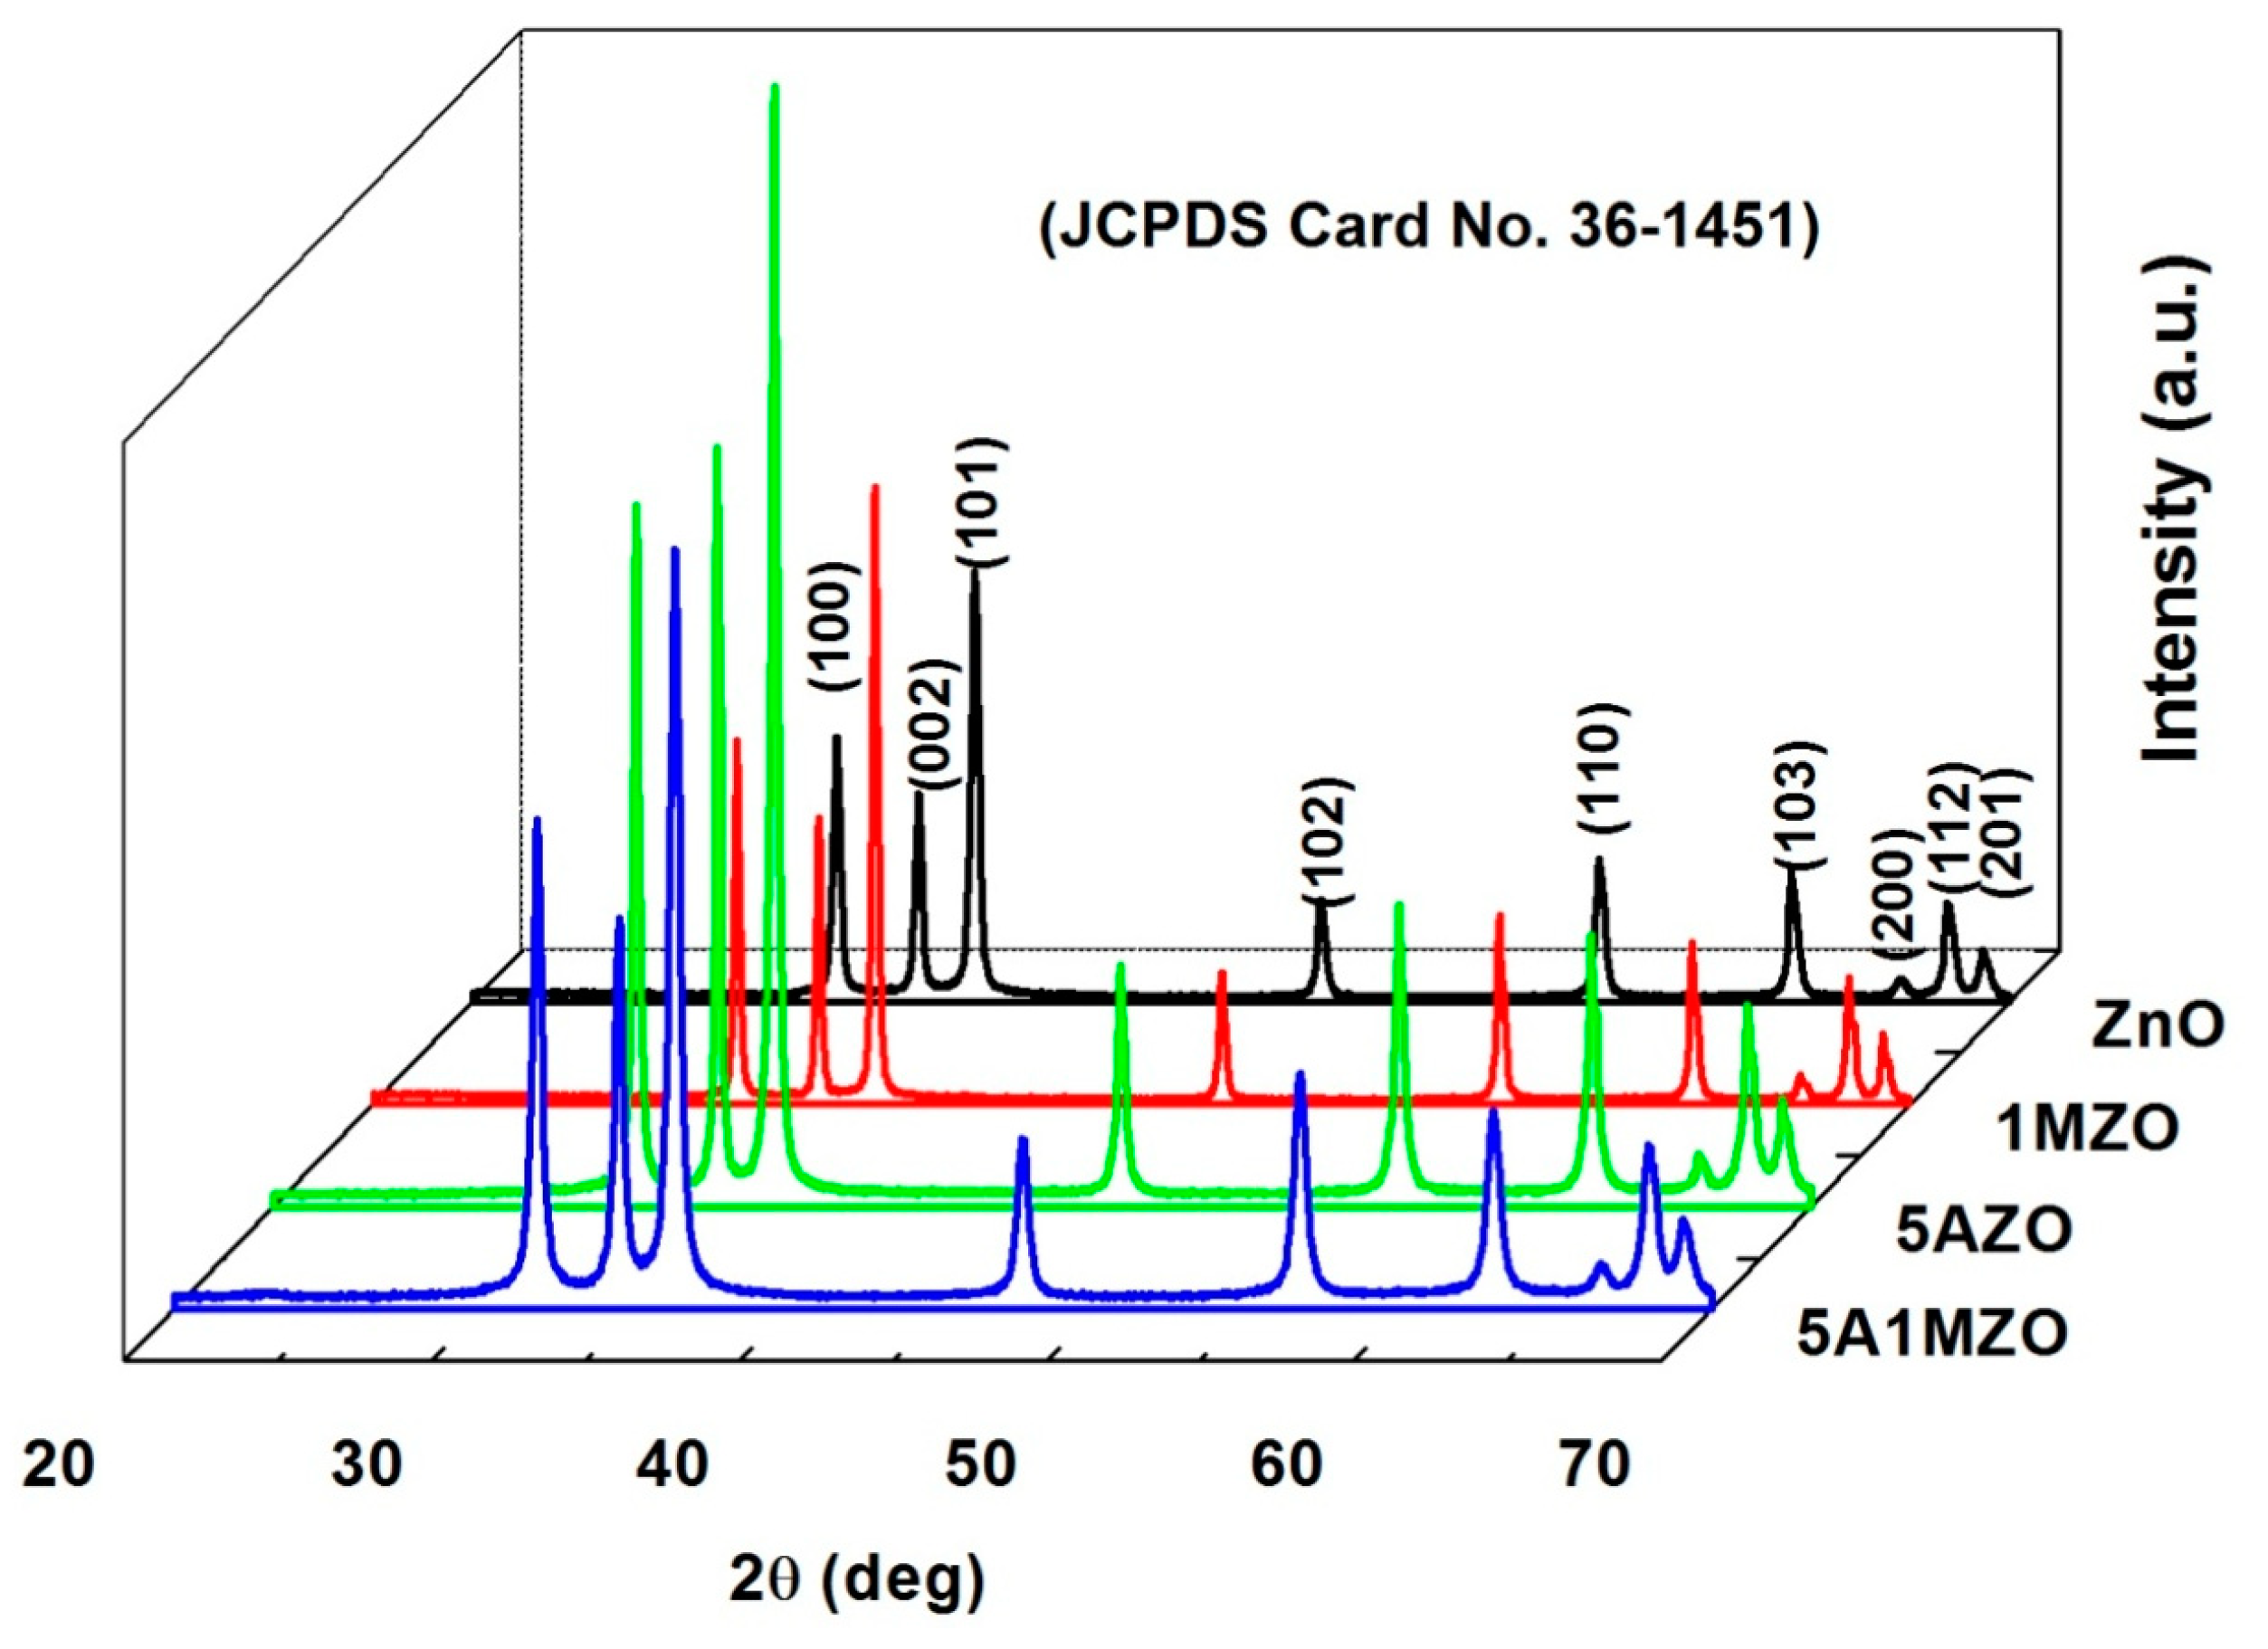
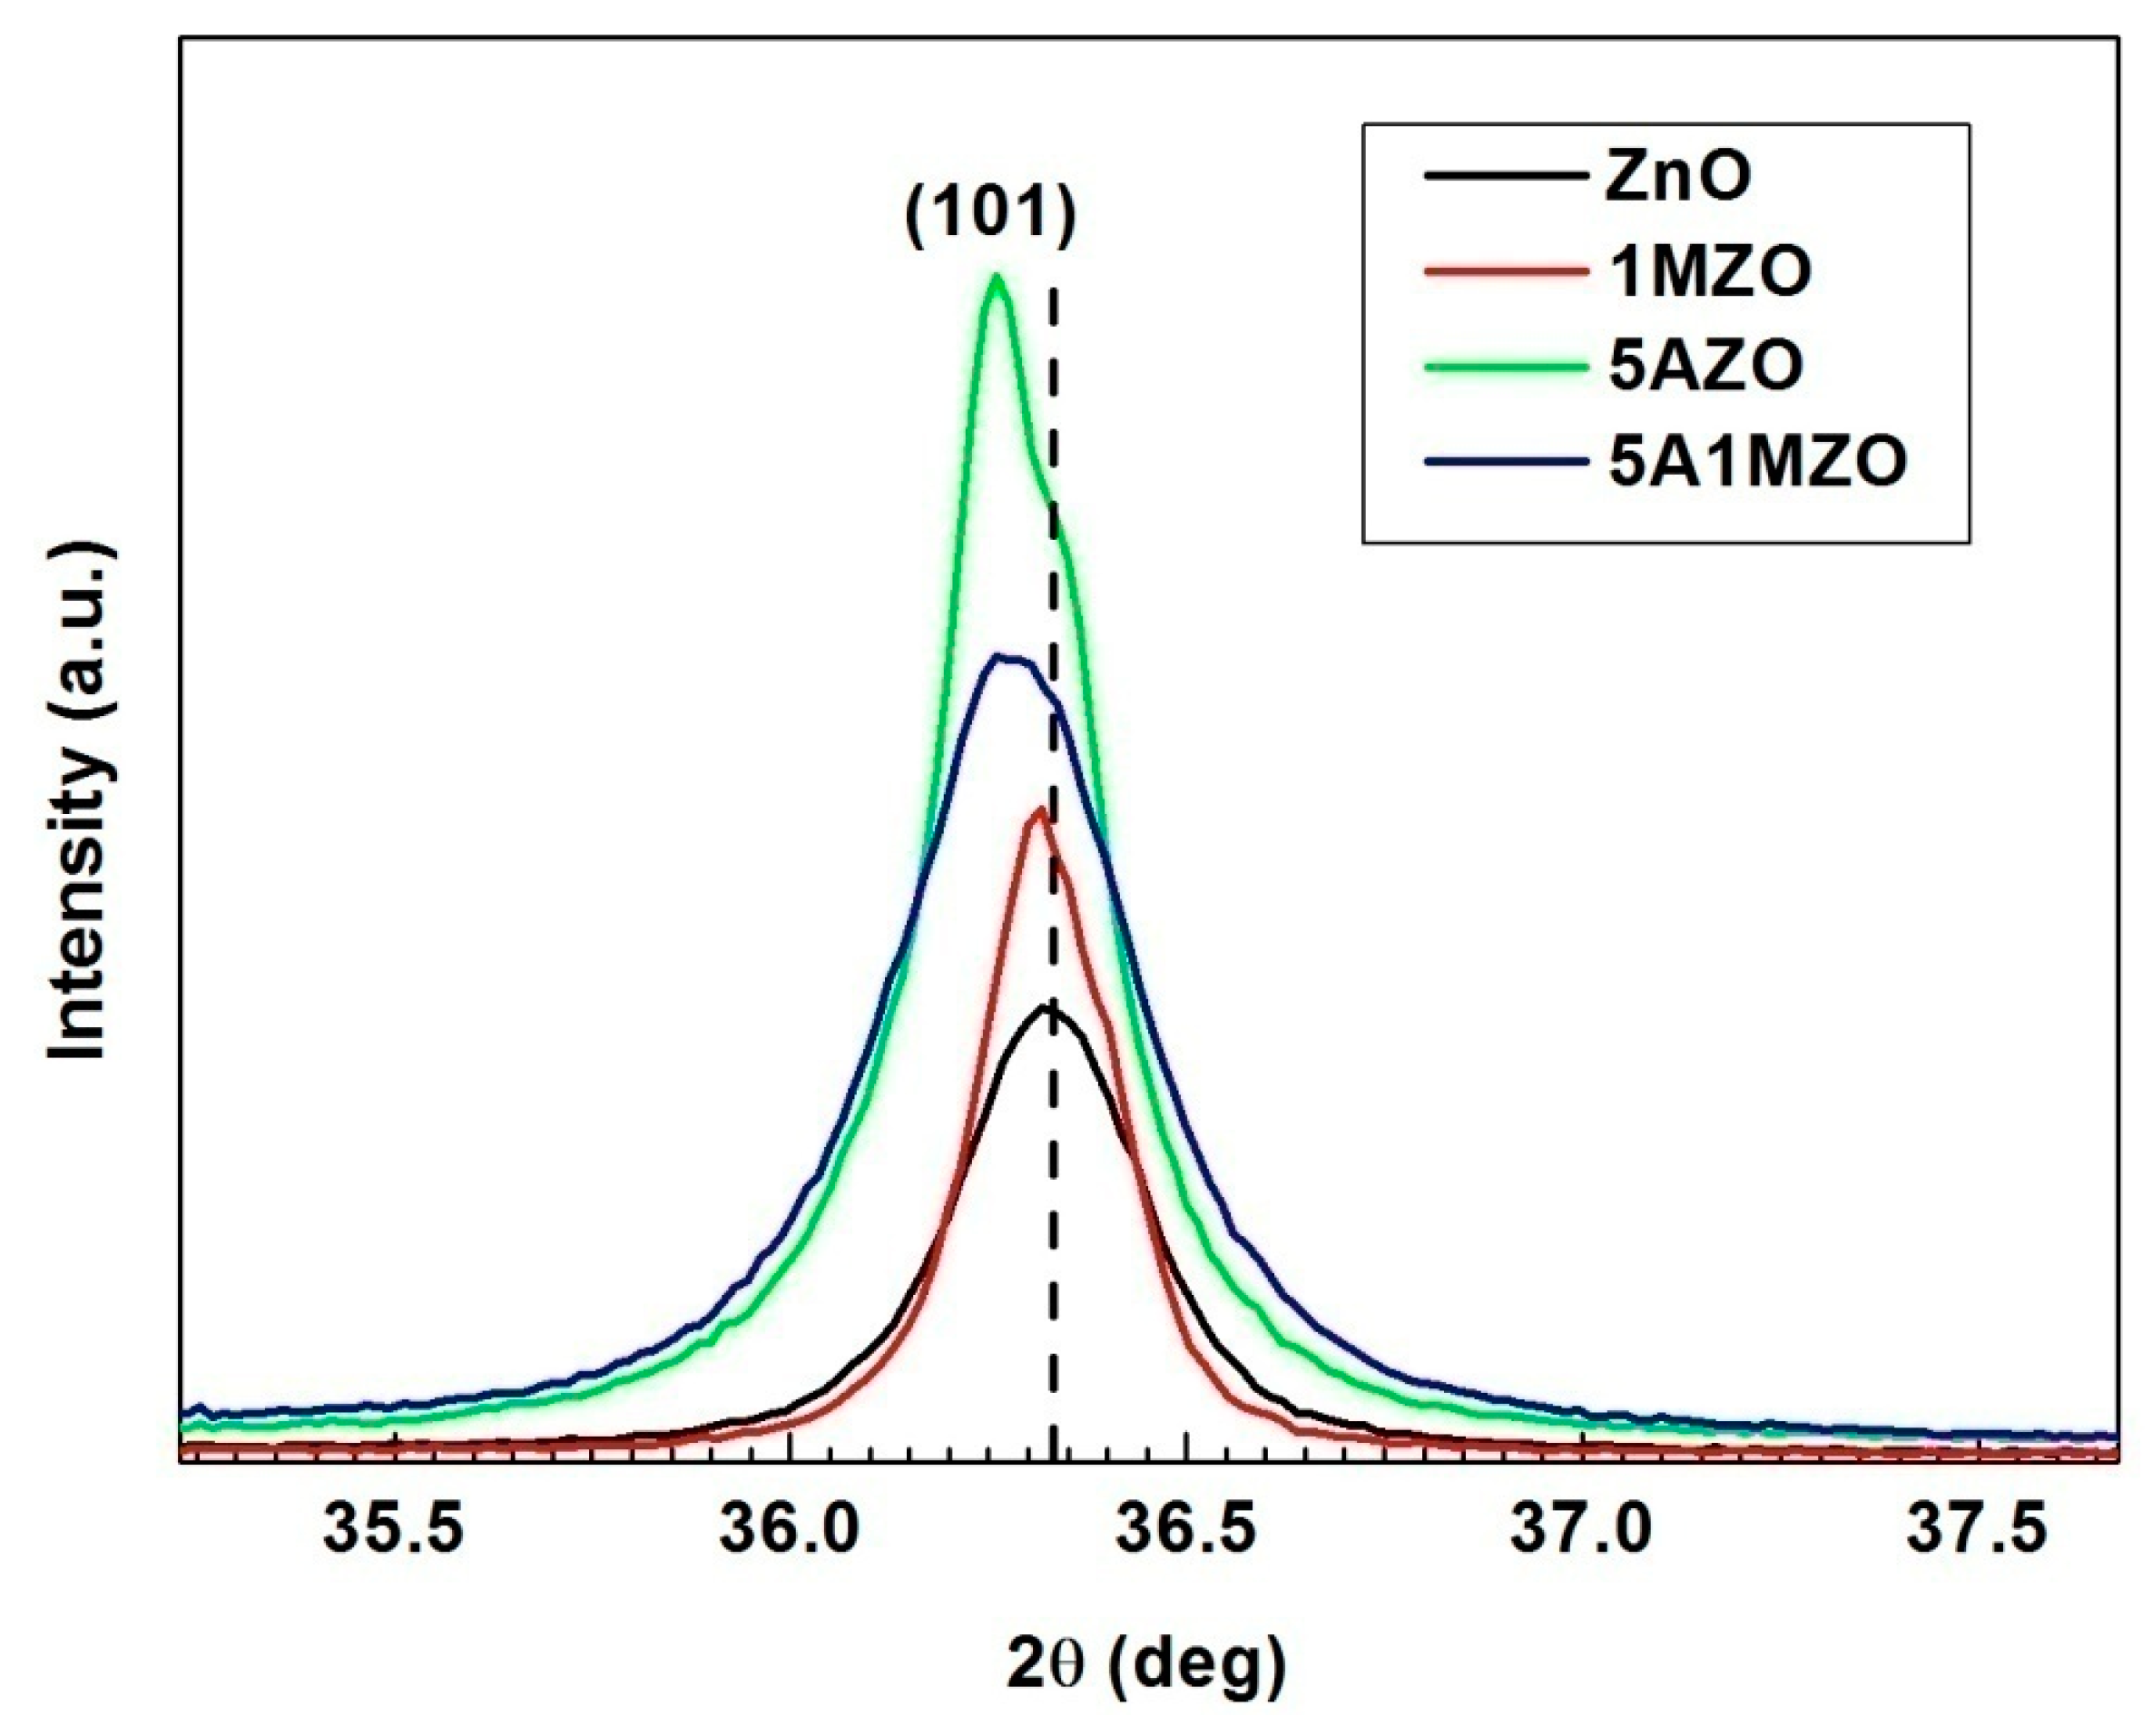
Figure 1. Photo of (a) the sensing device and (b) the measurement system.
Chemosensors 09 00300 g001aChemosensors 09 00300 g001b
Figure 2. XRD diffractograms of ZnO, 1MZO, 5AZO and 5A1MZO samples.
Chemosensors 09 00300 g002
Figure 3. Shift of (101) peak of MZO, 5AZO and 5A1MZO from that of ZnO sample.
Chemosensors 09 00300 g003
Figure 4. Fitted XRD patterns of (a) ZnO, (b) 1MZO, (c) 5AZO and (d) 5A1MZO nanoparticles.
Chemosensors 09 00300 g004
Figure 5. FESEM images of (a) 1MZO and (b) 5A1MZO at different magnifications.
Chemosensors 09 00300 g005aChemosensors 09 00300 g005b
Figure 6. EDX spectrum of 5A1MZO sample.
Chemosensors 09 00300 g006
Figure 7. TEM image of 5A1MZO nanoparticles at 200 nm. The inset presents the HRTEM image at 10 nm.
Chemosensors 09 00300 g007
Figure 8. UV-Vis spectra of ZnO, 1MZO, 5AZO and 5A1MZO samples.
Chemosensors 09 00300 g008
Figure 9. Plots of (αhυ)2 versus photon energy () for (a) ZnO, (b) 1MZO, (c) 5AZO and (d) 5A1MZO samples.
Chemosensors 09 00300 g009
Figure 10. Responses of the 1MZO- and 5A1MZO-based sensors to 2000 ppm hydrogen versus operating temperatures.
Chemosensors 09 00300 g010
Figure 11. Responses of the 5AZO and 5A1MZO based sensors to 20 ppm CO versus operating temperatures.
Chemosensors 09 00300 g011
Figure 12. (a) Dynamic resistance change of 5A1MZO based sensor toward H2 gas, (b) its corresponding calibration curve, and (c) its reproducibility.
Chemosensors 09 00300 g012aChemosensors 09 00300 g012b
Figure 13. (a) Dynamic resistance change of 5A1MZO based sensor toward CO gas, (b) its corresponding calibration curve, and (c) its reproducibility.
Chemosensors 09 00300 g013aChemosensors 09 00300 g013b
Figure 14. Selectivity of the 5A1MZO sensor when exposed to 2000 ppm H2, 20 ppm CO and 2000 ppm CO2 at different temperatures (200–300 °C).
Chemosensors 09 00300 g014
Table 1. Calculated results of crystallite size, lattice parameters and volume of the ZnO, 1MZO, 5AZO and 5A1MZO samples.
SamplesCrystallites Size (nm)Lattice Parameters (Å)Volume (Å3)
ZnO36a = 3.246
c = 5.201
47.47
1MZO57a = 3.249
c = 5.206
47.61
5AZO35a = 3.250
c = 5.206
47.64
5A1MZO27a = 3.249
c = 5.203
47.58
Table 2. Comparison of the results of current work with those recently reported on resistance type sensors for H2 and CO.
GasSampleConcentration (ppm)ResponseTemperature (°C)Response Time (s)Recovery Time (s)Reference
H2WO3/TiO2 nanofibers1000(Rg-Ra)/Ra = 78.21%RT2023[56]
Pd-WO3 composite thin films2000Ra/Rg = 20002507299[57]
5A1MZO NPs2000Ra/Rg = 70250370This work
COIn:ZnO thin films5(Ra-Rg)/Rg = 4.1730024273[58]
Pt@ZnOpolyhedrons50(Ra-Rg)/Ra = 65%125--[47]
5A1MZO NPs50Ra/Rg = 2.013002435This work
Publisher’s Note: MDPI stays neutral with regard to jurisdictional claims in published maps and institutional affiliations.

