Review

The Challenges of Developing Biosensors for Clinical Assessment: A Review

by
Briliant Adhi Prabowo
1,
Patrícia D. Cabral
1,2,
Paulo Freitas
1 and
Elisabete Fernandes
1,*
1
International Iberian Nanotechnology Laboratory, 4715-330 Braga, Portugal
2
Center of Physics, University of Minho, 4710-057 Braga, Portugal
*
Author to whom correspondence should be addressed.
Chemosensors 2021, 9(11), 299; https://doi.org/10.3390/chemosensors9110299
Submission received: 16 September 2021 / Revised: 15 October 2021 / Accepted: 21 October 2021 / Published: 24 October 2021
(This article belongs to the Special Issue Chemical Sensors for Bio-Medical and Environmental Applications)

Abstract

:
Emerging research in biosensors has attracted much attention worldwide, particularly in response to the recent pandemic outbreak of coronavirus disease 2019 (COVID-19). Nevertheless, initiating research in biosensing applied to the diagnosis of diseases is still challenging for researchers, be it in the preferences of biosensor platforms, selection of biomarkers, detection strategies, or other aspects (e.g., cutoff values) to fulfill the clinical purpose. There are two sides to the development of a diagnostic tool: the biosensor development side and the clinical side. From the development side, the research engineers seek the typical characteristics of a biosensor: sensitivity, selectivity, linearity, stability, and reproducibility. On the other side are the physicians that expect a diagnostic tool that provides fast acquisition of patient information to obtain an early diagnosis or an efficient patient stratification, which consequently allows for making assertive and efficient clinical decisions. The development of diagnostic devices always involves assay developer researchers working as pivots to bridge both sides whose role is to find detection strategies suitable to the clinical needs by understanding (1) the intended use of the technology and its basic principle and (2) the preferable type of test: qualitative or quantitative, sample matrix challenges, biomarker(s) threshold (cutoff value), and if the system requires a mono- or multiplex assay format. This review highlights the challenges for the development of biosensors for clinical assessment and its broad application in multidisciplinary fields. This review paper highlights the following biosensor technologies: magnetoresistive (MR)-based, transistor-based, quartz crystal microbalance (QCM), and optical-based biosensors. Its working mechanisms are discussed with their pros and cons. The article also gives an overview of the most critical parameters that are optimized by developing a diagnostic tool.

1. Introduction

Biosensors for clinical application is an emerging research field, particularly for the rapid detection and early screening of biomarkers in the case of an outbreak, such as coronavirus disease 2019 (COVID-19) [1,2]. More than hundreds of thousands of confirmed cases are reported from hundreds of countries around the globe. In this vast increment of the new cases, the paramedics in these countries are overwhelmed with screenings of suspected cases for quarantined patients. The facts brought by the recent pandemic caused by SARS-CoV-2 emphasize the need for early screening methods to interrupt the spread of the disease. Those screening methods can be relevant in airports, seaports, country borders, or among communities. The conventional methods for pathogen detection, such as cell culture systems or reverse transcript polymerase chain reactions (RT-PCRs), are laborious, costly, and time-consuming from sample preparation until signal interpretation.
The definition of a biosensor by the International Union of Pure and Applied Chemistry (IUPAC) is a device or platform that uses specific biochemical reactions mediated by isolated enzymes, immunosystems, tissues, organelles, or whole cells to detect specific biochemical compounds, usually by electrical, thermal, magnetic or optical signals [3]. By its definition, biosensors include three crucial parts: (1) the interesting biomarker to target, (2) the receptor (i.e., the biorecognition element to use in the sensing area that will specifically interact or react with the interested biomarker(s)), and (3) the method to generate the signal response of the biomarker–receptor interaction. Moreover, according to the World Health Organization (WHO), an emerging requirement for biosensor technology features is called ASSURED, which stands from affordable, sensitive, specific, user-friendly, rapid and robust, equipment-free, and deliverable to the end users [4].
This article discusses the state of the art, recent issues, and challenges of biosensor development for clinical applications. Aside from the several existing biosensor platforms available in the market for specific clinical applications, there is still no consensus by the health authorities regarding biosensor utilization, particularly during the outbreak or for screening purposes. The biosensor platform in this article focuses on magnetoresistive-based, field-effect transistor (FET)-based, quartz crystal microbalance (QCM), surface plasmon resonance (SPR)-based, and surface-enhanced Raman spectroscopy (SERS)-based biosensors. The preferred platform in this review represents different transducing mechanisms and working principles from various biosensor platforms in the literature.
Additionally, biomarker preferences are a critical issue from the clinical side. The biomarkers can be proteins, nucleic acids, volatile organic compounds, cells, or particular biochemical substances, either as single biomarkers or combinations of several biomarkers for the detection validity, accuracy, and disease stratification [5]. The preference of a multiplex detection approach can be very challenging because each biomarker has different characteristics in terms of biophysical properties, concentrations, and relevant clinical cutoff values. Aside from the importance of the limit of detection (LoD) and sensitivity performance within the different biosensor technologies, those aspects should be considered in developing biosensors for advanced clinical studies. Finally, this review article provides a comprehensive overview for either early scientists or experts and for engineers or biochemists for their research roadmaps in the clinical applications of the biosensors.
This paper is organized into six sections. Section 1, “Introduction”, discusses the background and challenges behind developing a biosensor for clinical applications. Section 2, “Biosensor Technologies”, focuses on the state of the art of the most common biosensor platforms. Section 3, “Biosensor Analytical Performance”, is related to the parameters that need to be tackled to obtain robust diagnostic devices. Section 4, “Biomarker Strategy,” explains the importance of using individual or multiple biomarkers. Section 5, “Biomarker Clinical Cutoff Value”, explains its role in the detection strategy. The last section, “Conclusion”, will cover the systematic key steps to consider in developing a clinical diagnostic tool in a workflow chart.

2. Biosensor Technologies

Several technologies are reporting their applications in biosensing, either as proofs of concept or as commercial platforms, with their pros and cons. In this section, the current technologies in biosensor development are categorized into the following clusters: (1) magnetoresistive (MR)-based, (2) transistor-based, (3) quartz crystal microbalance (QCM), and (4) optical-based biosensors. These technologies have specific working mechanisms that translate particular challenging physical properties of the biomarkers (e.g., the charge of biomarkers, molecular weight, and refractive indices). These will define which detection strategy to apply in a particular clinical application (e.g., sample matrix or required cutoff value). For example, a magnetoresistive-based biosensor relies on the magnetic field, while a transistor-based biosensor relies on charge transfer mechanisms between the detection sample and the surface. QCM relies on the resonance frequency between piezoelectric materials, and finally, the optical-based biosensor relies on the photon interaction for the sensing region and target sample.

2.1. Magnetoresistive-Based Biosensors

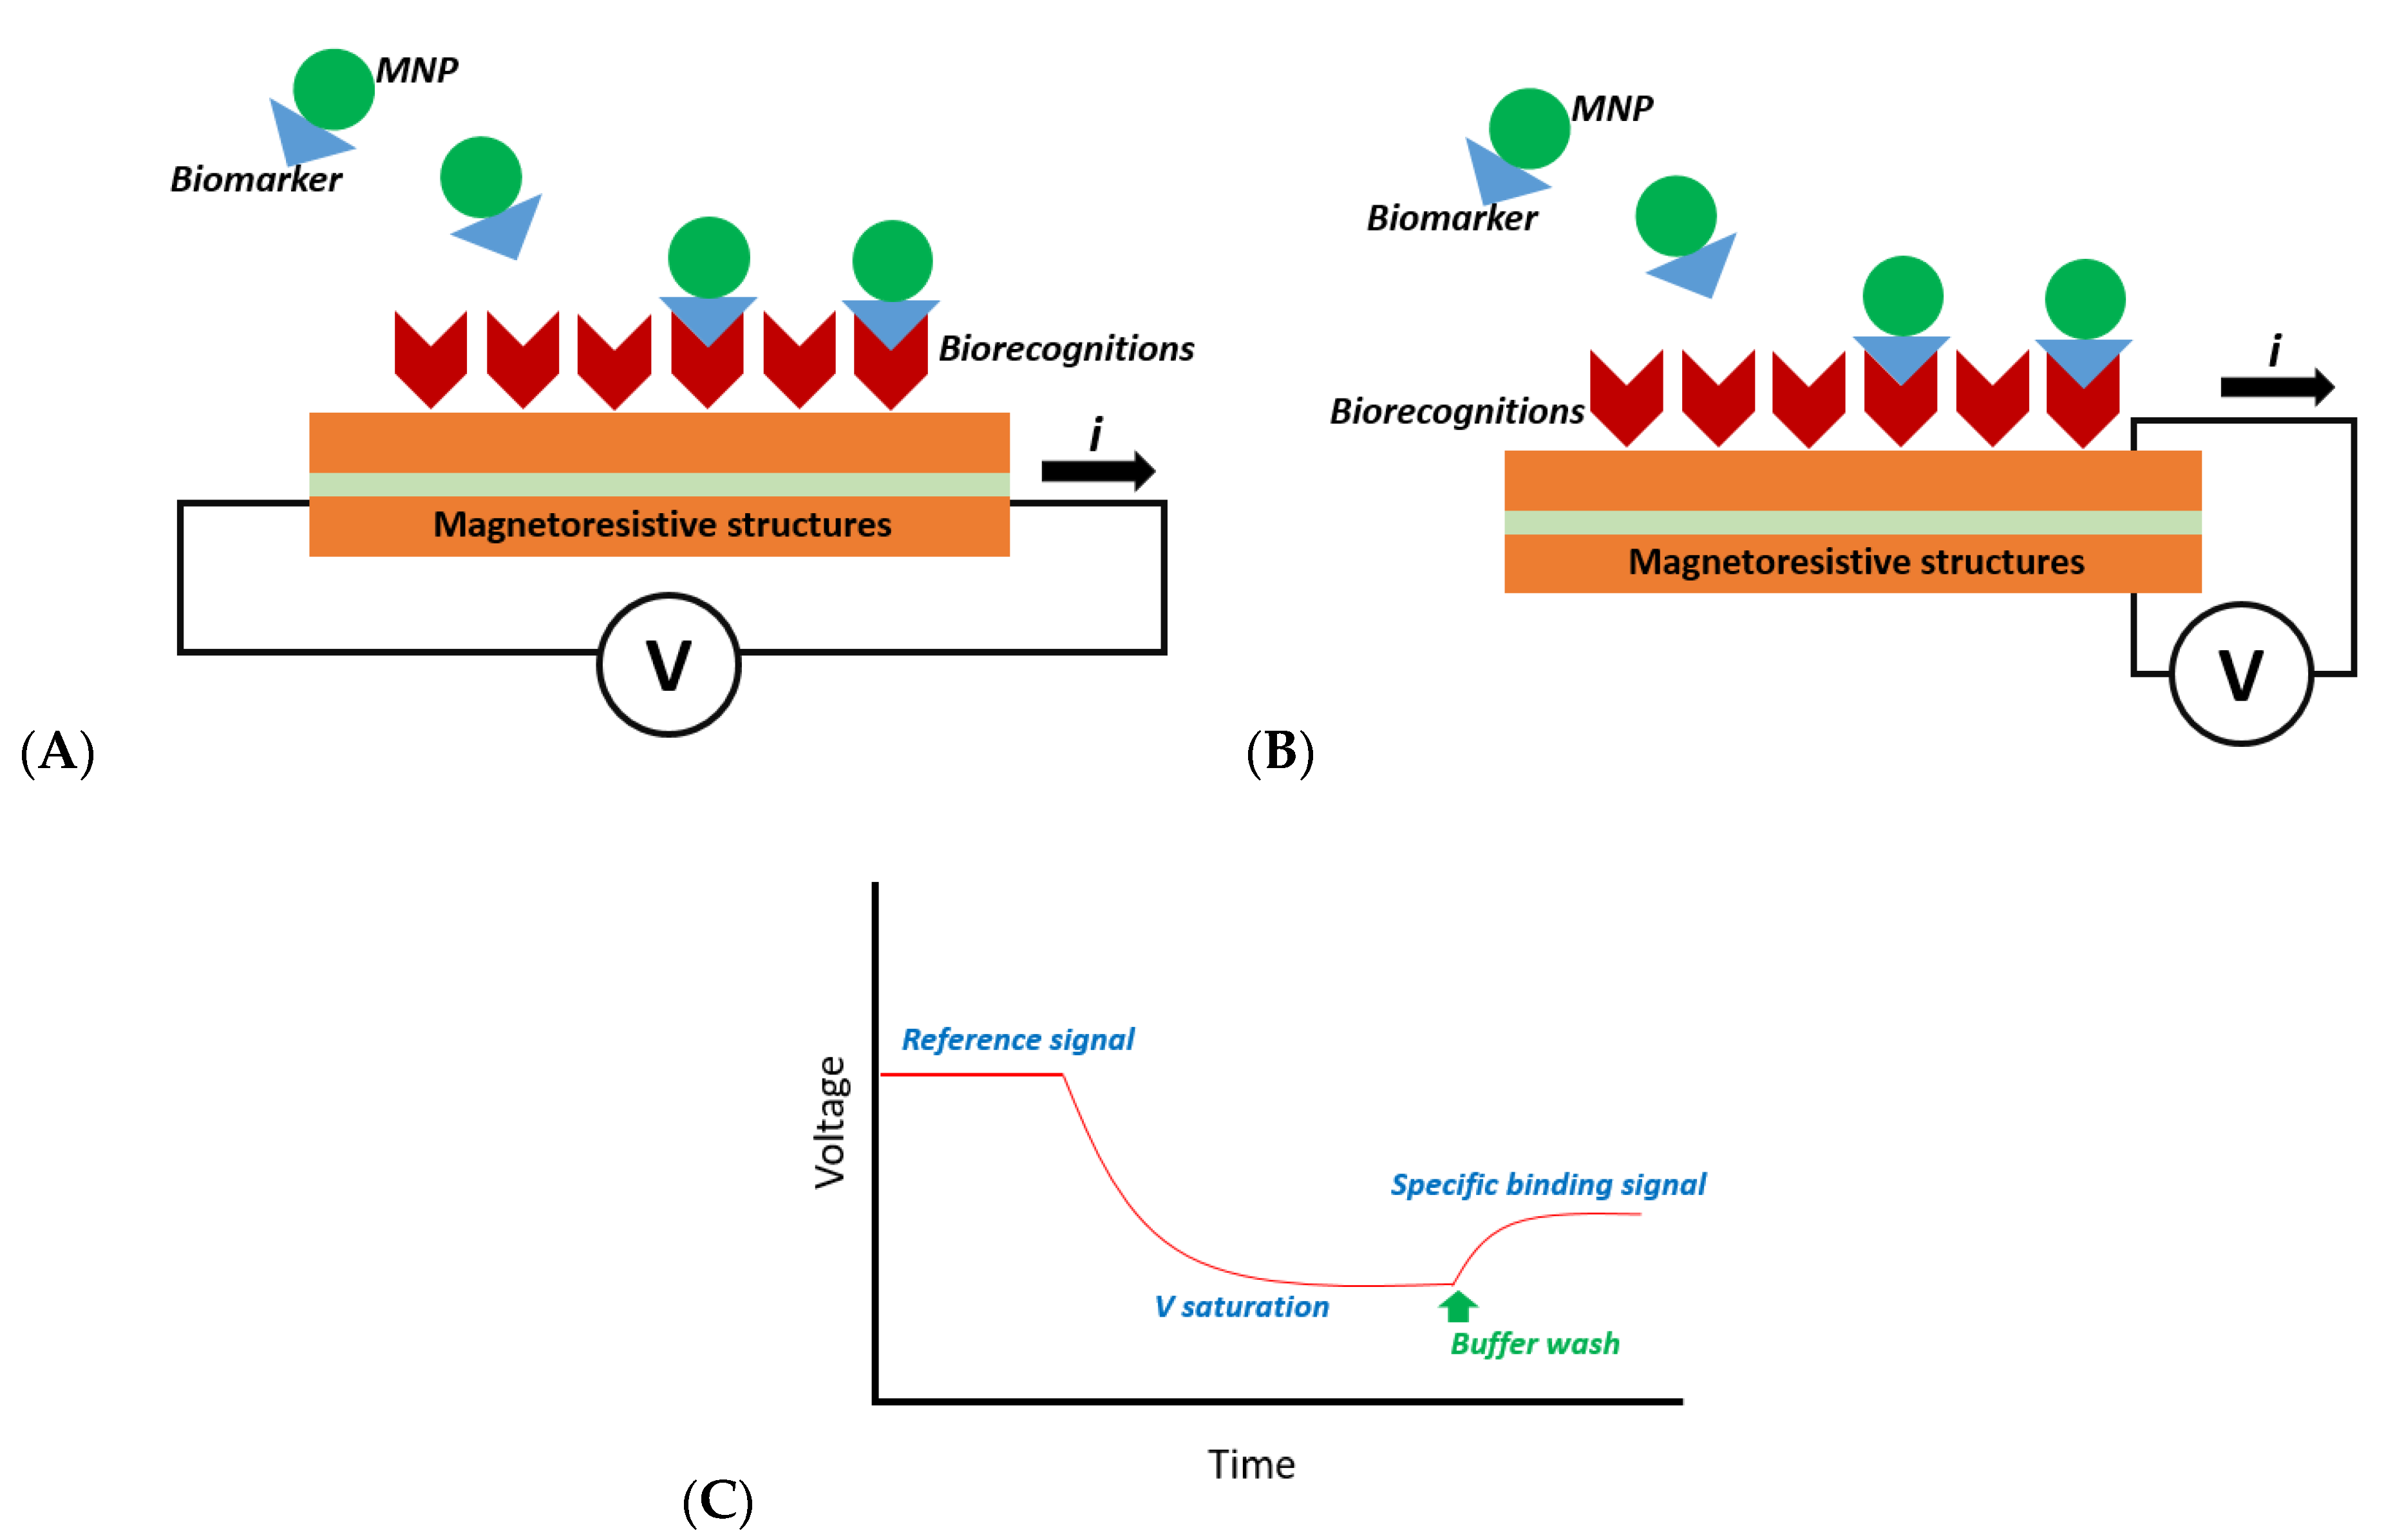
MR-based biosensors make use of a device conventionally used for read heads in hard disk drives. This sensor measures the resistivity of the material or structures by the presence of magnetic fields [6]. In an MR-based biosensor, the magnetic nanoparticles (MNPs) are used to label the interest biomarkers that interact with the biorecognition elements over the magnetoresistive structures [7,8]. Consequently, this induces changes in the resistance value of the structure, which can be measured in real time (Figure 1).
Figure 1A depicts an MR-based sensor measured using the CIP, in which the electrical current flows parallel to the plane of the MR sensor. Moreover, several sensors are constructed using the current-to-perpendicular plane (CPP) as depicted in Figure 1B, where the electrical current flows perpendicular to the plane of the MR structures. Monitoring the voltage value of the MR structures results in a real-time signal (Figure 1C) when the MNP-labeled biomarkers are captured by the biorecognition elements immobilized in the sensing surface. The signal magnitude in the MR biosensor will be the difference between the reference signal (Vs) and the specific binding signal (Vb) such that ΔV = Vs − Vb.
Based on the structure of the materials, the MR-based biosensor can be configured mainly using giant magnetoresistance (GMR) and tunneling magnetoresistance (TMR) [7,9,10]. The main advantages of using an MR biosensor are that the magnetic field through the presence of MNPs is not sensitive to the charge and the mild temperature gradient of the sample. Therefore, the noise in the reference signal is independent of the temperature and charge effect from the sample or target markers [11,12].

2.2. Transistor-Based Biosensors

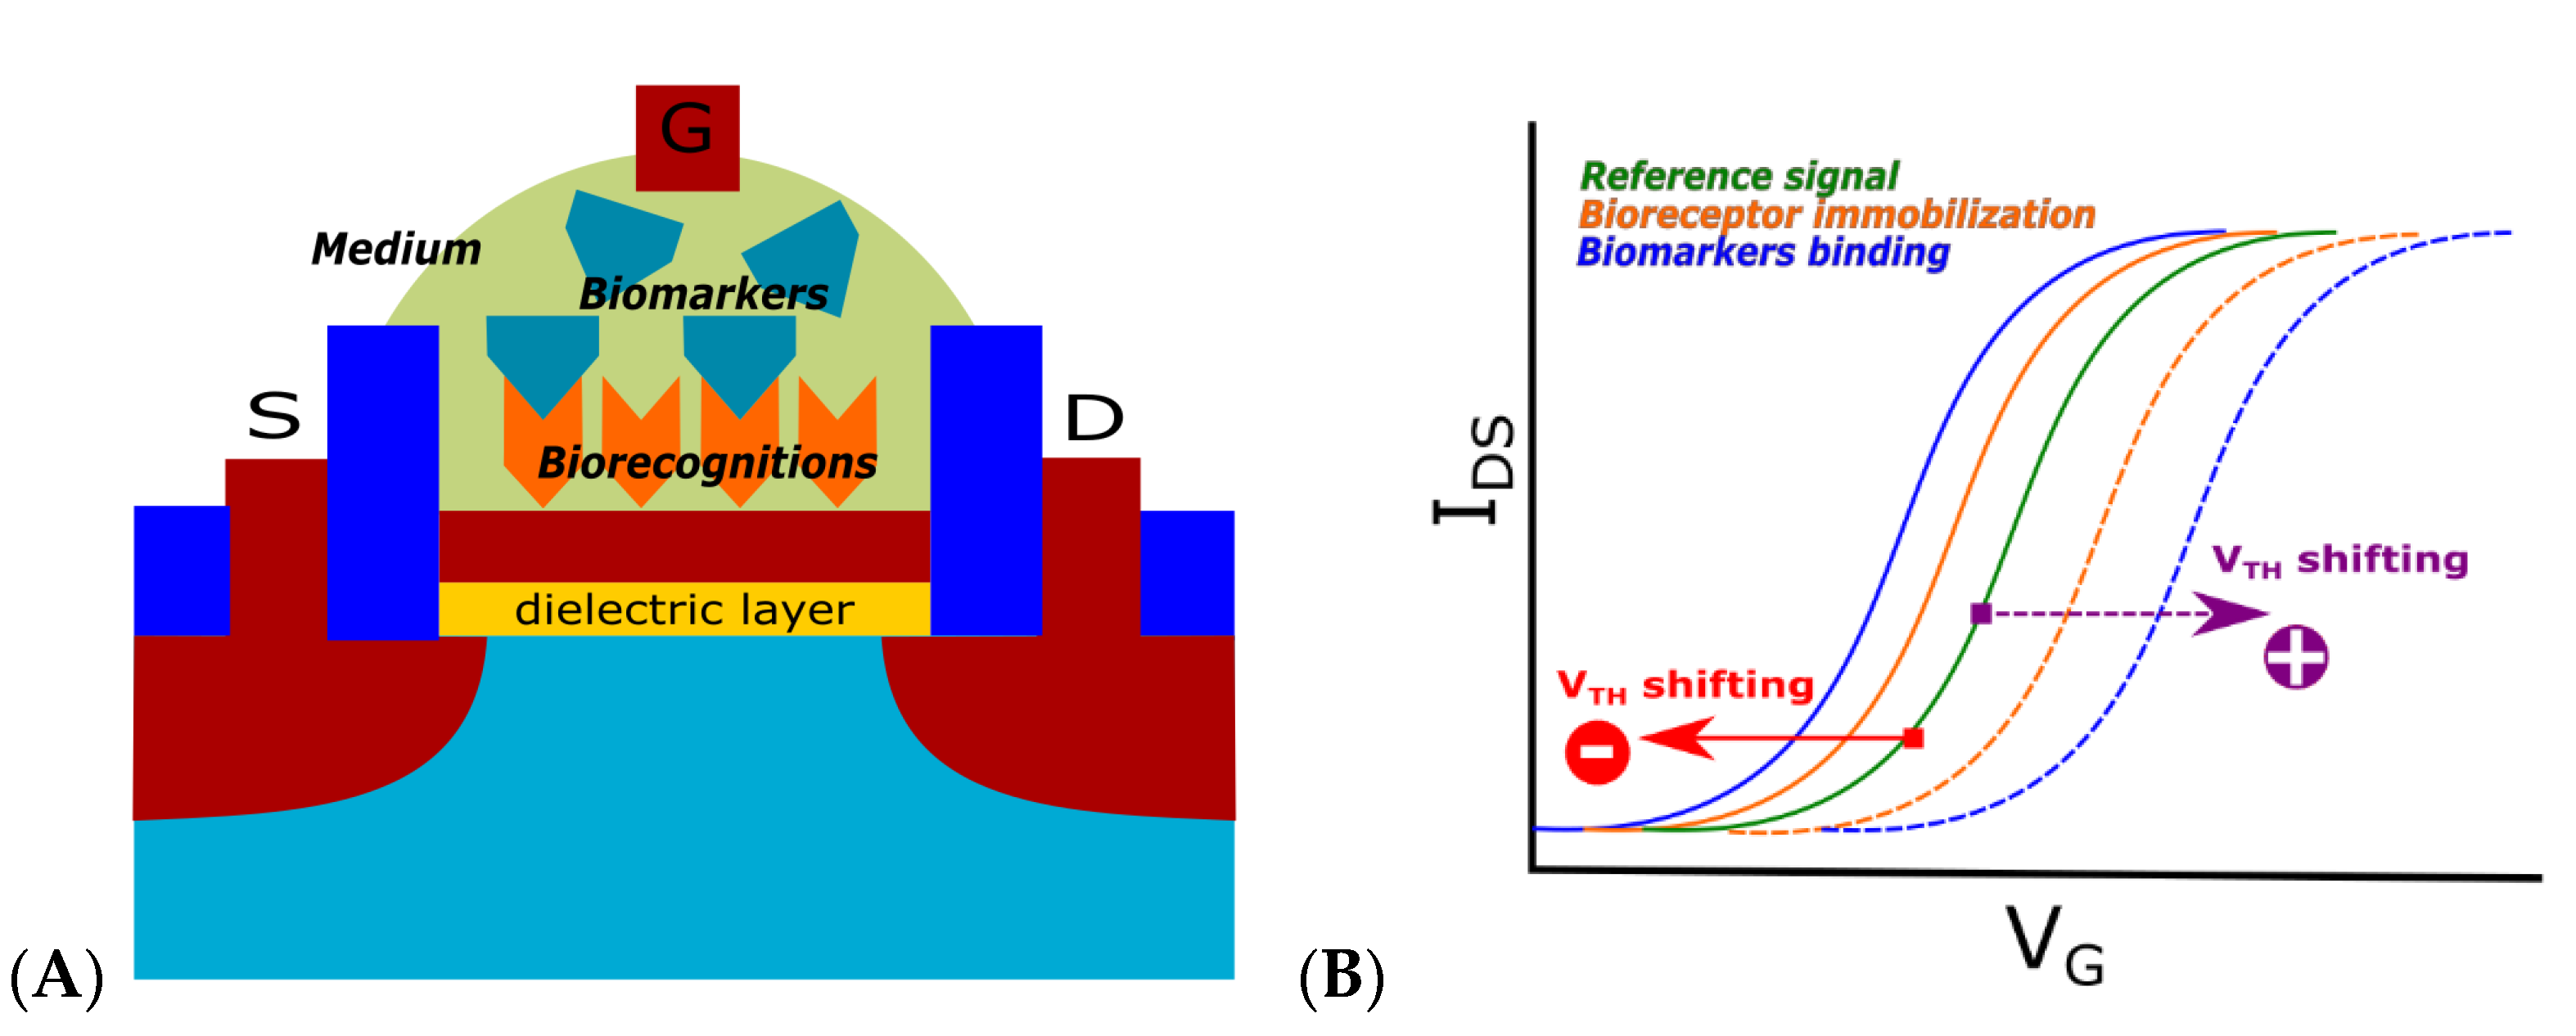
Transistor-based biosensors are dominated by the FET device that uses the gate structure to perform the biomolecular interaction. The detection principle of this biosensor is based on the accumulation of charged biomarkers at the biorecognition surface (e.g., gate oxide) that create changes in the surface potential, leading to variations in the drain current for a fixed gate voltage. This signal can be used to observe biomarker detection in the FET device, and the shift direction is related to the charge of the biomarker in the sample medium.
Figure 2A depicts a typical FET-based biosensor by using the gate of the device as a sensing membrane. The accumulation of the probes or targets will be represented by the charge accumulation on the gate and the shifting of the threshold voltage shifting, as illustrated in Figure 2B. Assuming that the FET device in Figure 2A is an n-type device, the negatively charged samples result in the threshold voltage (VTH) shifting to a lower value, as depicted by the solid lines of Figure 2B. In the case of positively charged targets, the VTH shifts to the higher VG (the dashed line in Figure 2B). The real-time measurement can be performed by monitoring the drain current (ID) at a particular fixed gate voltage (VG) value around the linear region of the Id–Vg curve. Another strategy of signal acquisition will be monitoring the VG at a constant threshold current (typically 1 µA in microelectronics). This signal acquisition in an FET biosensor that utilizes the feedback circuit is called constant voltage constant current (CVCC) [13].
The advantage of the FET biosensor device is that it is label-free. However, several FET technologies keep using labels to enhance the detection signal or to integrate the FET detection simultaneously with other methods, such as electrochemical or optical analyses [14,15,16]. Nevertheless, biomarkers with a neutral charge (e.g., IgG2 and hemoglobin) are challenging to detect using the FET biosensor device [17,18]. FET-based biosensors can be configured as portable and low-power platforms adapted from the integrated circuit (IC) industry, such as well-known FET technologies in microelectronics and microprocessors for digital devices [14,19,20]. Moreover, the use of the commercial FET device for this sensor configuration is also possible to apply by using the extended gate field effect transistor (EGFET) configuration. In the EGFET device, the sensing membrane is connected to the gate, and various treatments of the sensing area can be performed separately from the transistor circuit [21,22,23].

2.3. Quartz Crystal Microbalance Biosensors

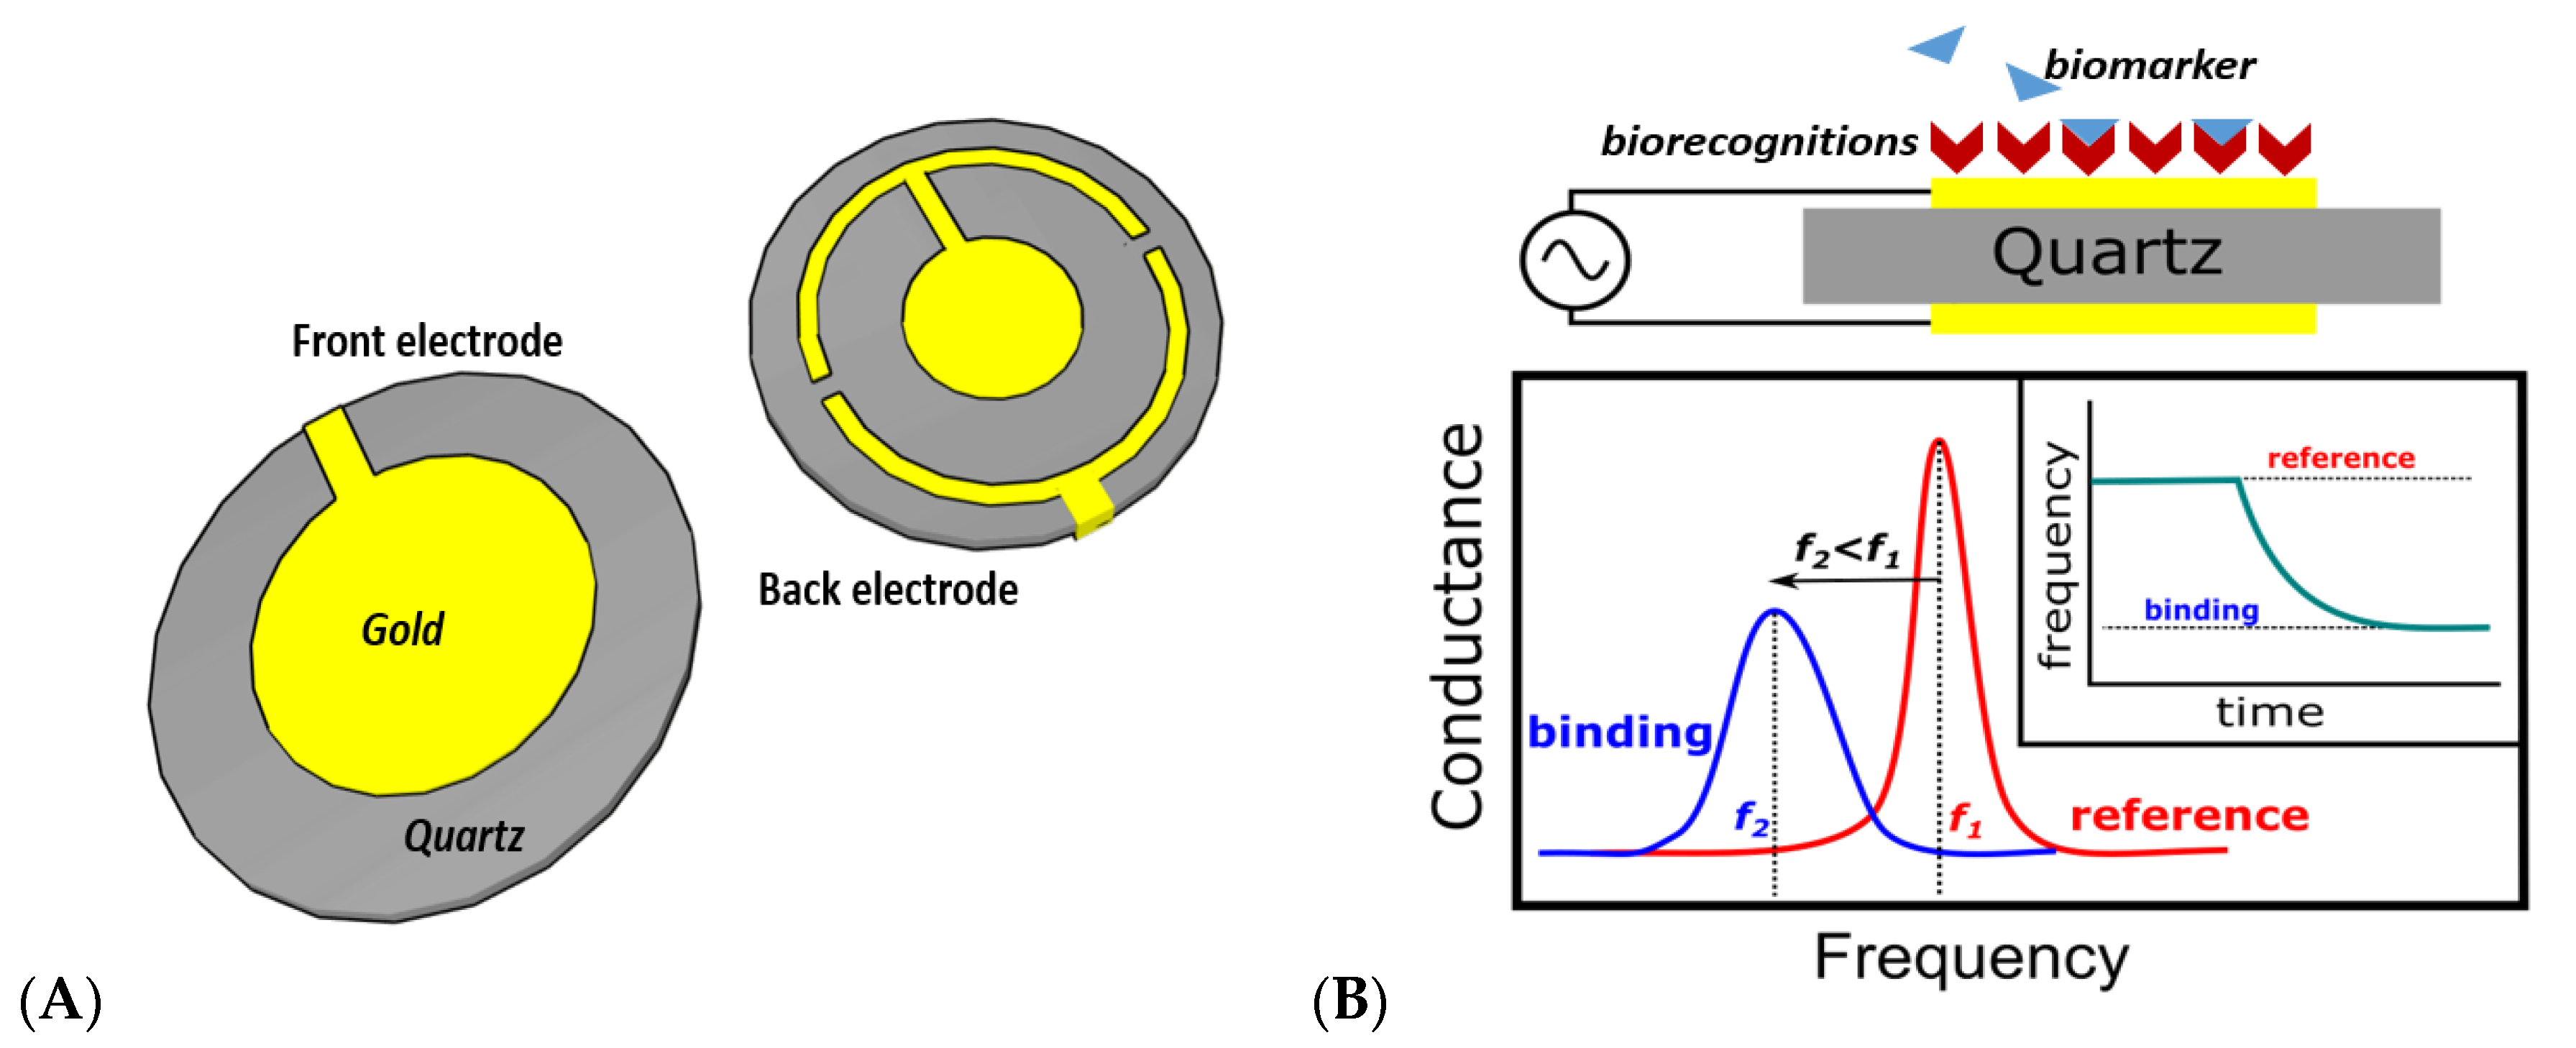
A quartz crystal microbalance (QCM) device is a sensor for the detection of surface binding by monitoring the resonance frequency [24,25,26]. It has two conductive electrodes usually made from gold that are separated by a quartz crystal as a piezoelectric material. This technology is relatively mature because it is well known for monitoring material deposition in microelectronics fabrication. It works by supplying a frequency range from the kHz level to a few MHz to define the resonance state. The higher the thickness of the quartz substrate, the lower the resonance frequency measured. The QCM is well known for the high-quality factor (Q) of the sensor. However, due to the thick substrate (in mm), the only possible frequency operation is in the low range of frequencies. Consequently, this sensing platform has a high detection resolution and a wide dynamic range [27]. The advantage of the biosensing platform using a QCM is that the sample can be used either in the liquid or vapor phase [28].
The principle of signal acquisition on the QCM platform can be illustrated in Figure 3B. The resonance frequency can be shifted to the lower value when the substance or molecules bind to the electrode’s surface. Moreover, real-time signal acquisitions can be applied by monitoring the resonance frequency along with the time domain as depicted in the inset of Figure 3B.

2.4. Optical-Based Biosensors

Optical-based biosensors typically use light in the infrared or visible region as the excitation source for the sensing region. They are sensitive to the refractive index of the surface. In this article, this type of biosensors will be divided into two groups: plasmonic-based and surface-enhanced Raman scattering (SERS)-based platforms.

2.4.1. Plasmonic-Based Biosensors

A plasmonic is an electromagnetic field naturally generated in a noble metal fabricated in nanofilm or nanostructures. In a nanofilm metal structure, the plasmonic field is called surface plasmon resonance (SPR). The existing field is located at the interface of the metal film and the dielectric medium, while in the nanoparticle structures, it is called localized surface plasmon resonance (LSPR). Along with a massive trend in nanotechnology, this technology has gained much attention from scientists due to the plasmonic phenomena that do not exist in bulk structures [29]. The plasmonic phenomena in a metal, due to the sensitivity, have excellent potential for the application of single-molecule detection [30].
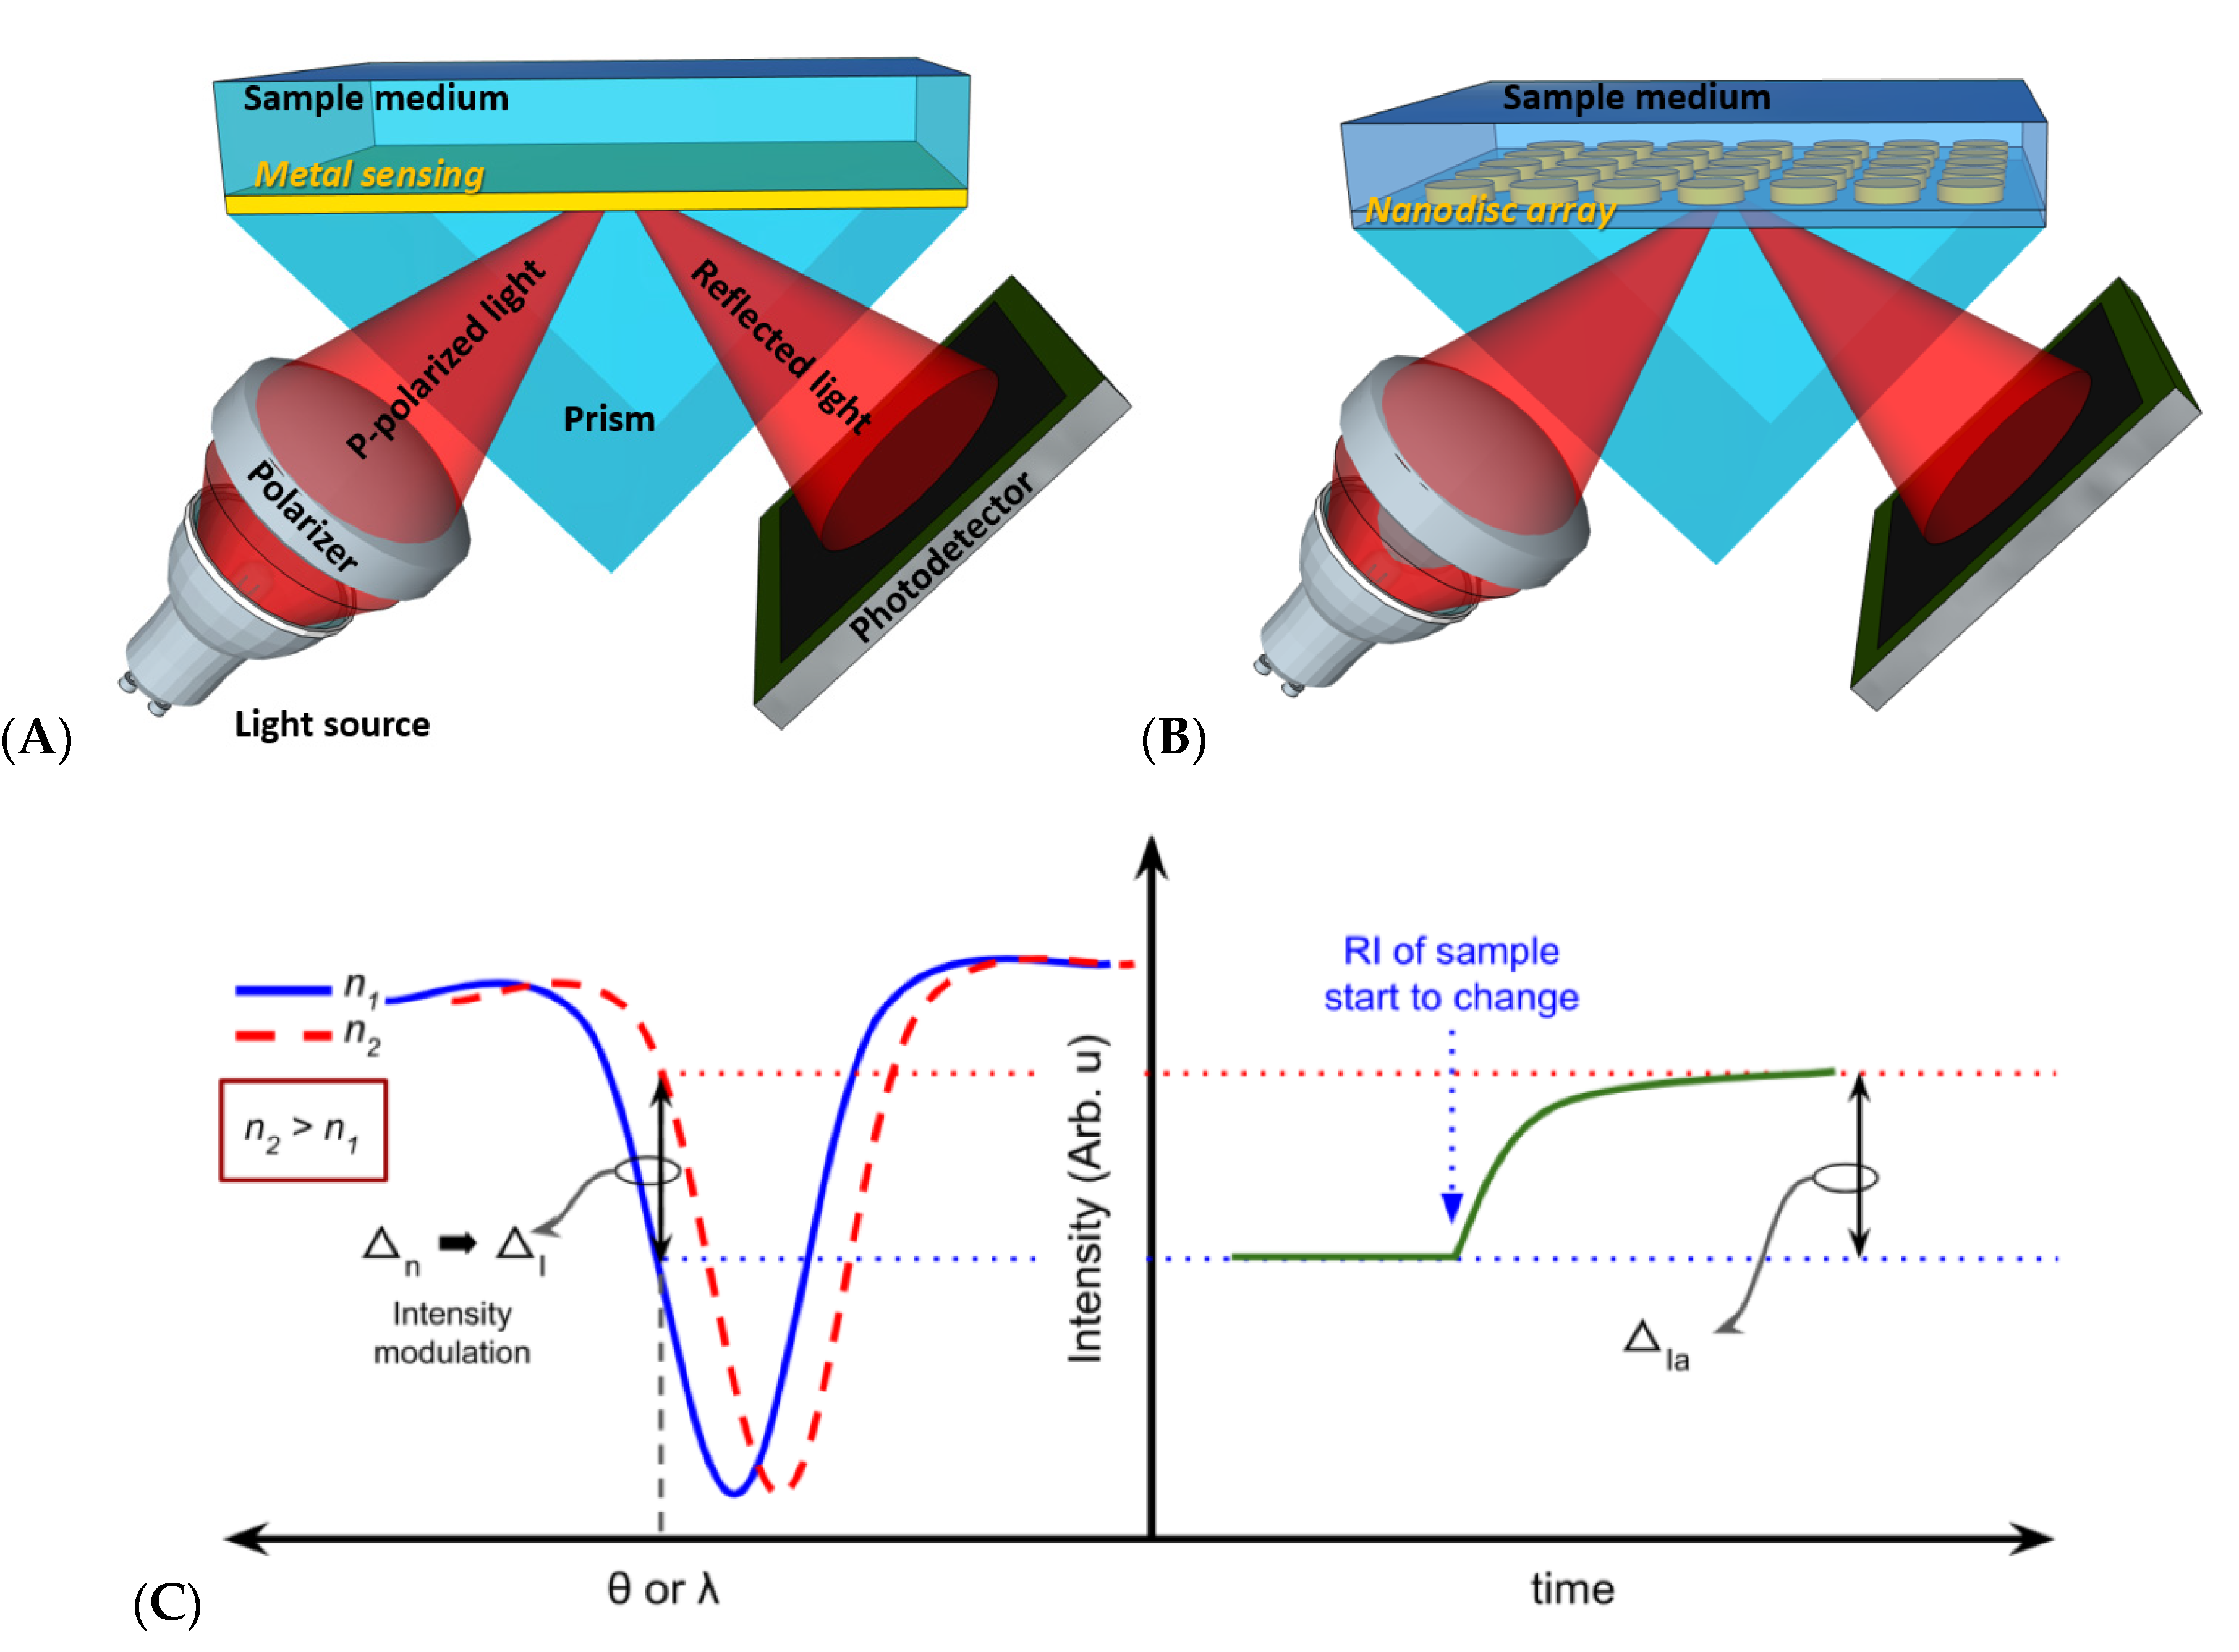
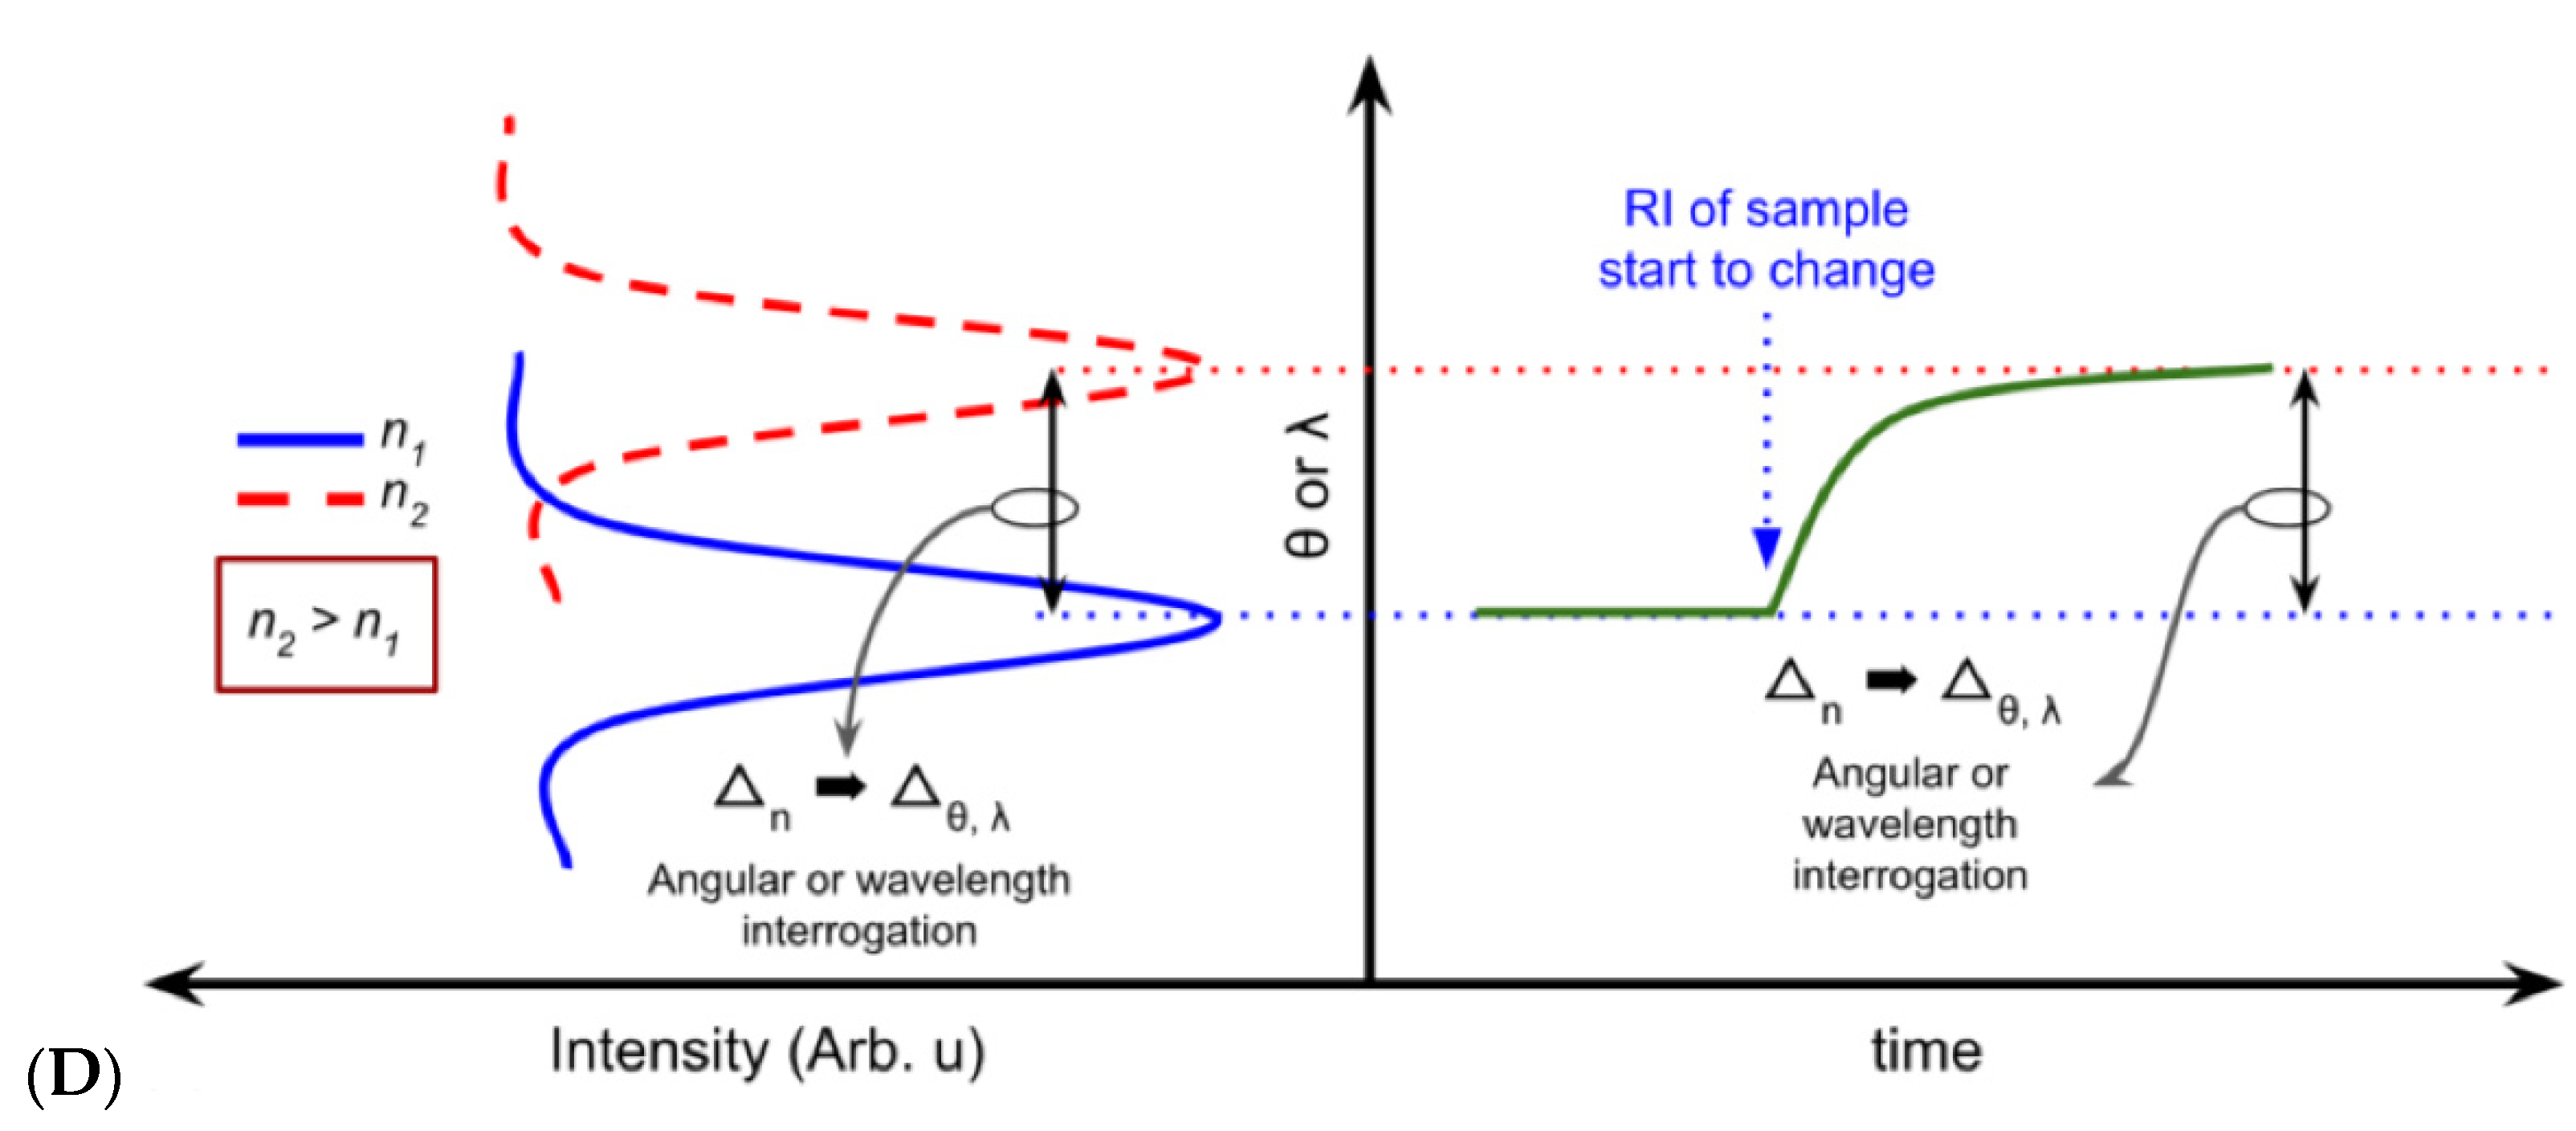
Figure 4A illustrates the SPR sensor using a prism coupler to excite the surface plasmon wave (SPW) in the interface of the thin metal film and sample medium. At a particular angular incident angle (θ) and wavelength (λ), the p-polarized light will be resonated with the SPW. Therefore, a fraction of the incident light will be absorbed into the SPW. Consequently, in the reflectance spectra, the loss of reflected light can be observed as a dark band along with the angular or wavelength domain (Figure 4C,D). This dark band will be the reference point of the sensing. In case the medium shifts to a higher refractive index (n2 > n1) or the sensing metal adsorbs the biomolecules, the resonance condition will be shifting to the higher wavelength (Δn ≅ Δλ) or higher incident angle (Δn ≅ Δθ). The shifting can be tracked as real-time signals from the intensity modulation, angular interrogation, or wavelength interrogation (Figure 4C,D). In Figure 4B, the sensing metal is replaced by the nanodisc array. In this configuration, the plasmonic field oscillates surrounding the discs and also at the interspace between the discs. Theoretically, the plasmonic field in the LSPR configuration is stronger than in the SPR. Thus, the sensing performance can be boosted to achieve smaller detection limits [31,32,33,34,35]. However, the fabrication process can be costly, such as with the nanostructure array with a precise arrangement. Aside from the nanodisc array, various metal nanostructures can be utilized, such as gold or silver nanoparticles, nanoholes, nanostars, nanocubes, nanorods, and other different shapes. The particular metal nanopatterns have specific resonance wavelength regions in the range of visible light, and the shifting of the resonance wavelength leads to the color change. This LSPR behavior can be utilized as a colorimetry sensor [36,37].
The plasmonic-based platforms are well known for the high sensitivity performance of the biosensors [29,38]. Nevertheless, most of the commercial platform in the market requires a very high investment cost [39,40,41]. The drawback of this type of platform is the high sensitivity to temperature gradients. This disadvantage is due to the transducing mechanism’s dependence on the solution’s refractive indices at the sensing interface. Because the refractive indices values of the solution sample entirely depend on the temperature, the accuracy of the measurement can therefore be misinterpreted.

2.4.2. SERS-Based Biosensors

The SERS-based biosensor uses Raman spectroscopy as the central platform. Raman spectroscopy measurements are based on inelastic scattering of light excitation when the light interacts with the vibration of chemical bonds. The scattered light shifts to different wavelengths compared with the incident light. Every chemical bond leads to different wavelength shifting. Therefore, Raman spectroscopy is one of the powerful techniques to observe the chemical fingerprint of materials [42,43,44].
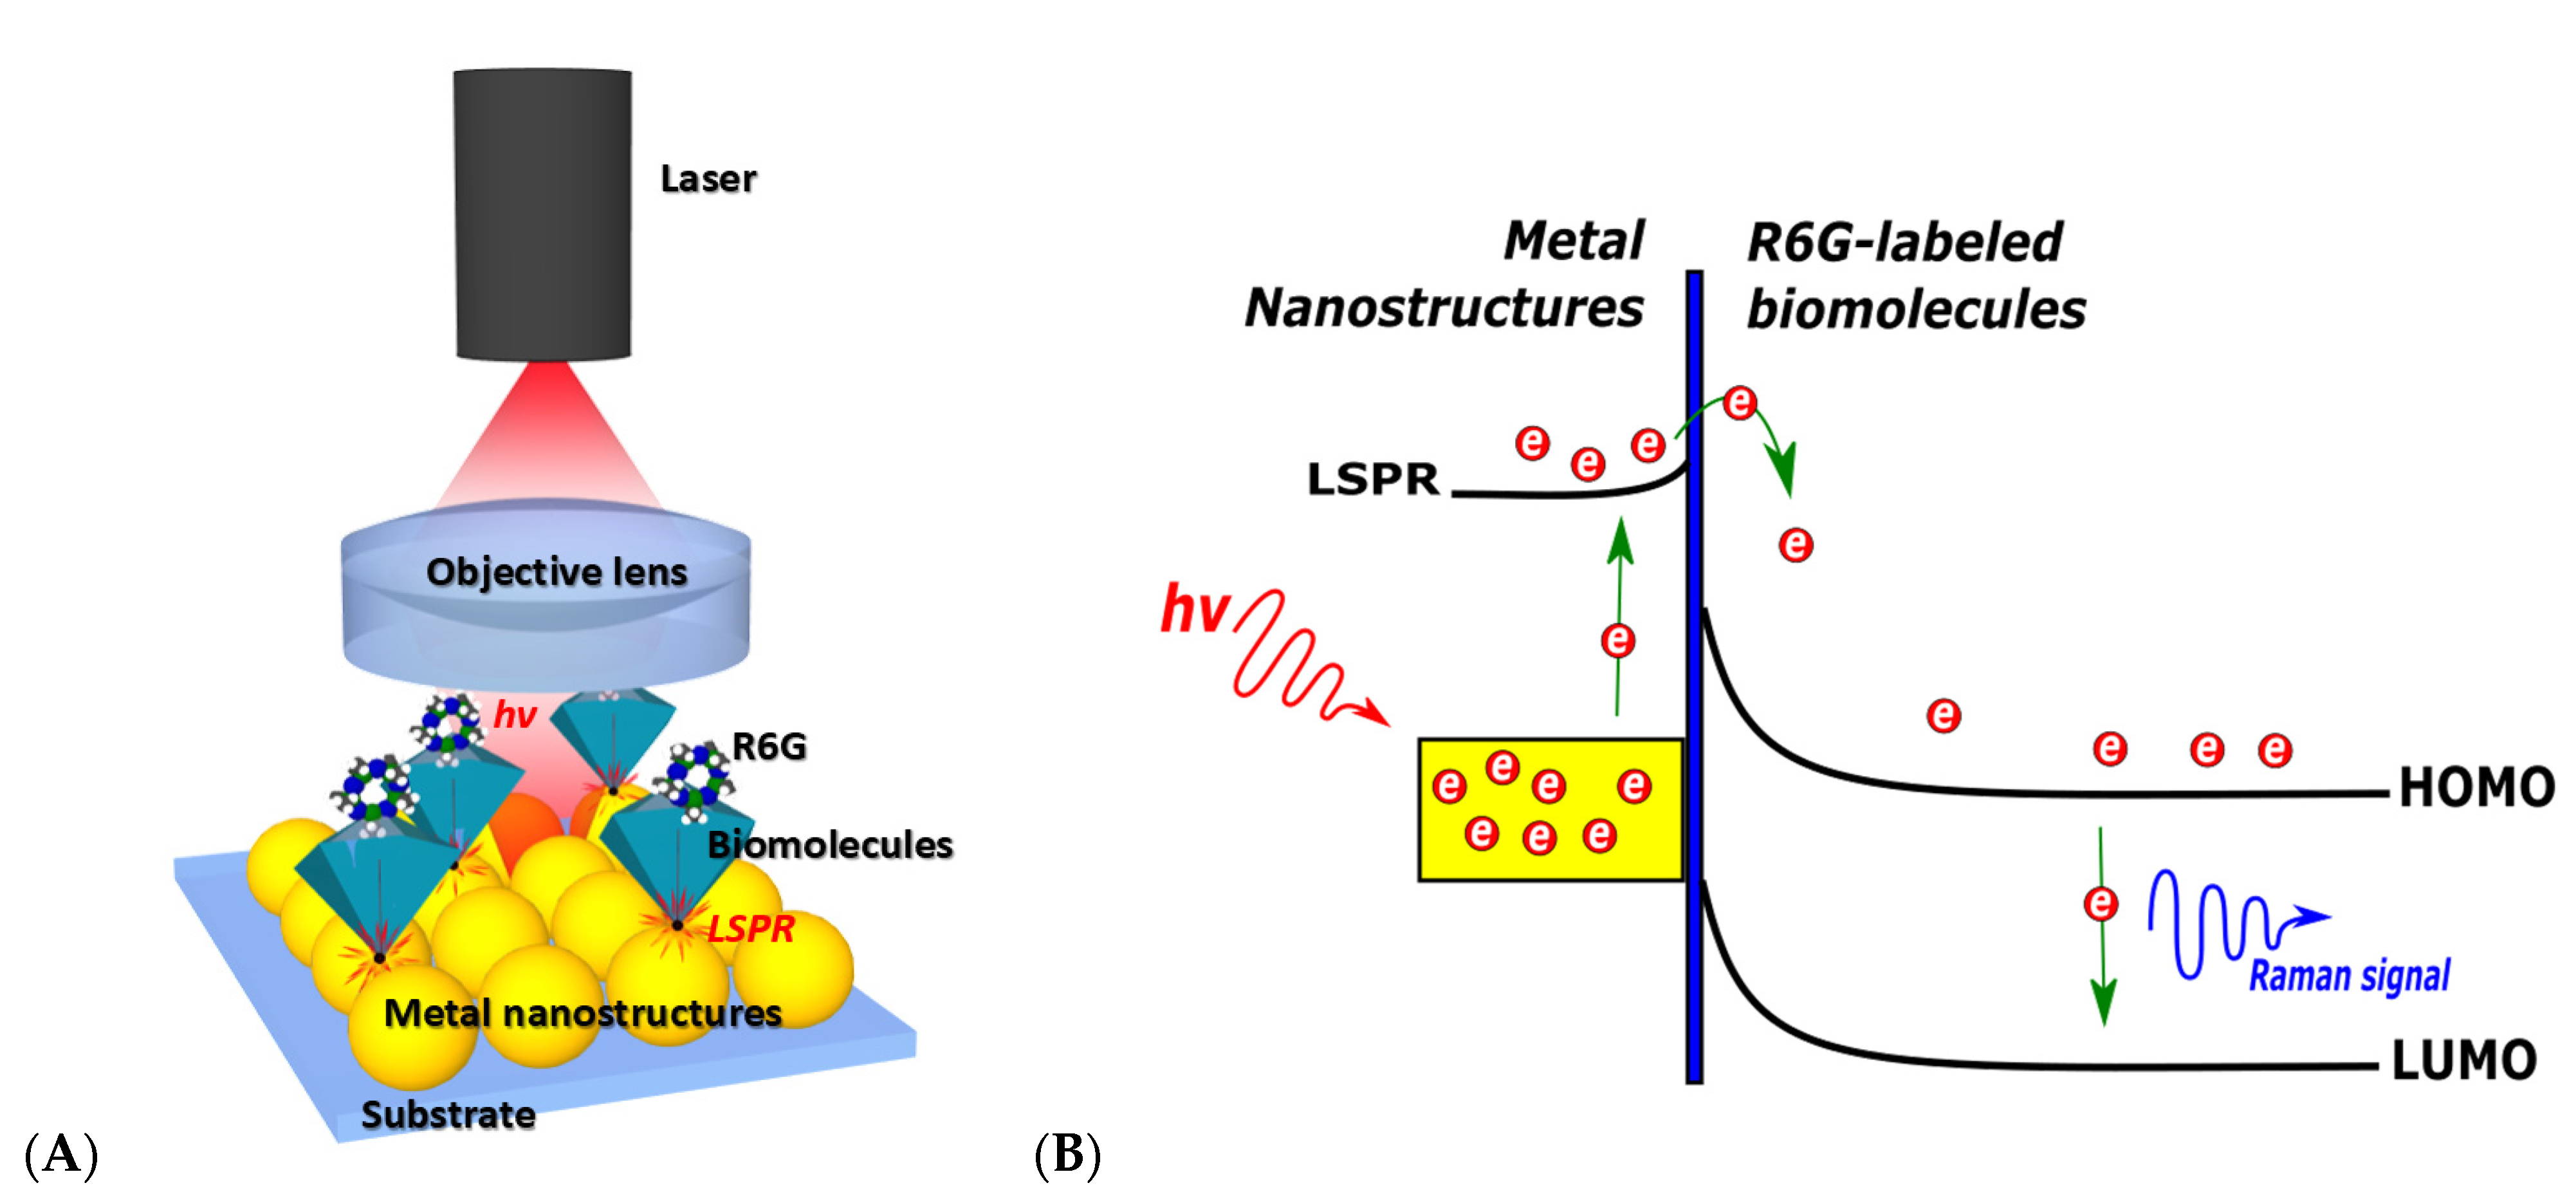
The Raman system can be optimized as a SERS-based biosensor platform by using metallic nanostructures as the sensing region to detect the biomarker binding. The metallic nanostructures confine a strong plasmonic field in the LSPR mode. Next, it interacts with the incident photons to enhance the scattering intensity of the Raman signal [45]. When the immobilized biorecognition elements in the nanostructures capture the target biomarker, the unique Raman fingerprint signal can be obtained. The intensity modulation of the Raman signal can be correlated to the target concentrations. The illustration of the SERS measurement is depicted in Figure 5.
The photons of the laser’s incident light (hv) are exciting the abundance of electrons on the metal surface. The LSPR energy level by the metal nanostructures enhances the electron supply to the HOMO energy level at the Rhodamine 6G (R6G) molecules (Figure 5B). Consequently, a strong Raman signal is generated by the electron transition from the HOMO to the LUMO energy level. Therefore, the Raman signal from the R6G represents the existence of biomolecules on the surface of the nanostructures.
The SERS-based biosensor has been acknowledged for its very high sensitivity performance. This platform is promising for the future advanced study of single-cell detection [46,47]. The performance enhancement factor of SERS was reported to achieve several orders of magnitude [48,49,50,51]. Nevertheless, the SERS platform cannot perform real-time signal acquisition to observe the binding affinity of the biomolecules. In addition, the fabrication cost of the metal nanostructures is high, and electron beam lithography (EBL) in particular is required for high precision of the nanopatterns.
The assay developer researcher needs to identify the biophysical properties of the target sample before the investment of the specific biosensors. For example, for a target sample with a neutral charge (e.g., peptide, IgG2, and hemoglobin) [17,18,52], the decision of using a FET-based platform is not suitable. In addition, in the case of requiring the use of various solutions with significantly different refractive indices values or multiple temperature gradients, it can be challenging to be detected in the plasmonic-based platform (SPR and LSPR biosensors) [53].
Table 1 can be an essential list for potential biosensor users according to their sample characteristics and its biophysical properties. Therefore, the selection of a transducing mechanism can be adequately considered. In addition, the cost and simplicity of the operation are also important factors for the user, whether it requires advanced training for the user or not. In applications such as outbreak diseases, simple operation biosensors can be preferable for early users to perform enormous tests. Moreover, the label-free and real-time features can be another advantage for the user´s consideration. The label-free scheme leads to a straightforward and low-cost assay in practical use, while the real-time signal can be analyzed to see the binding affinity of the target molecules to the receptor, as well as the direct qualitative and quantitative interpretation along with the time domain.

3. Biosensor Analytical Performance

The analytical performance of a clinical biosensor allows us to understand the capabilities and limitations of the technology and essentially analyze if it addresses a specific application or not. Several general parameters indicate the performance of a biosensor, such as the sensitivity, limit of detection (LOD), specificity, reproducibility, and dynamic range (DR). Therefore, before starting to develop a biosensor, it is important to have an intended clinical purpose. For example, the diagnosis of some complex diseases requires the detection of multiple biomarkers with specific cutoff values, meaning that those biomarkers may exist in an ordinary person but at constant or low concentrations. This issue is one of the most challenging aspects to address in developing a diagnostic tool. The device needs to look for multiple rather than individual biomarkers and distinguish between certain levels of those biomarkers, rather than distinguishing a minimal concentration from zero. In this case, the biosensors’ sensitivity, dynamic ranges, and resolutions may be critical parameters to address. Therefore, the detection strategy should be optimized considering the complexity of the biomarker(s), the affinity of the biorecognition elements, the clinical cutoff values, the relevant dynamic range, and the sample matrix. In this section, the essential parameters related to the performance of a clinical biosensor will be described using simple illustrative curves for the detection of a small-to-high target concentration. Some examples of adjusting the parameters to the clinical challenge are also reported.

3.1. Sensitivity

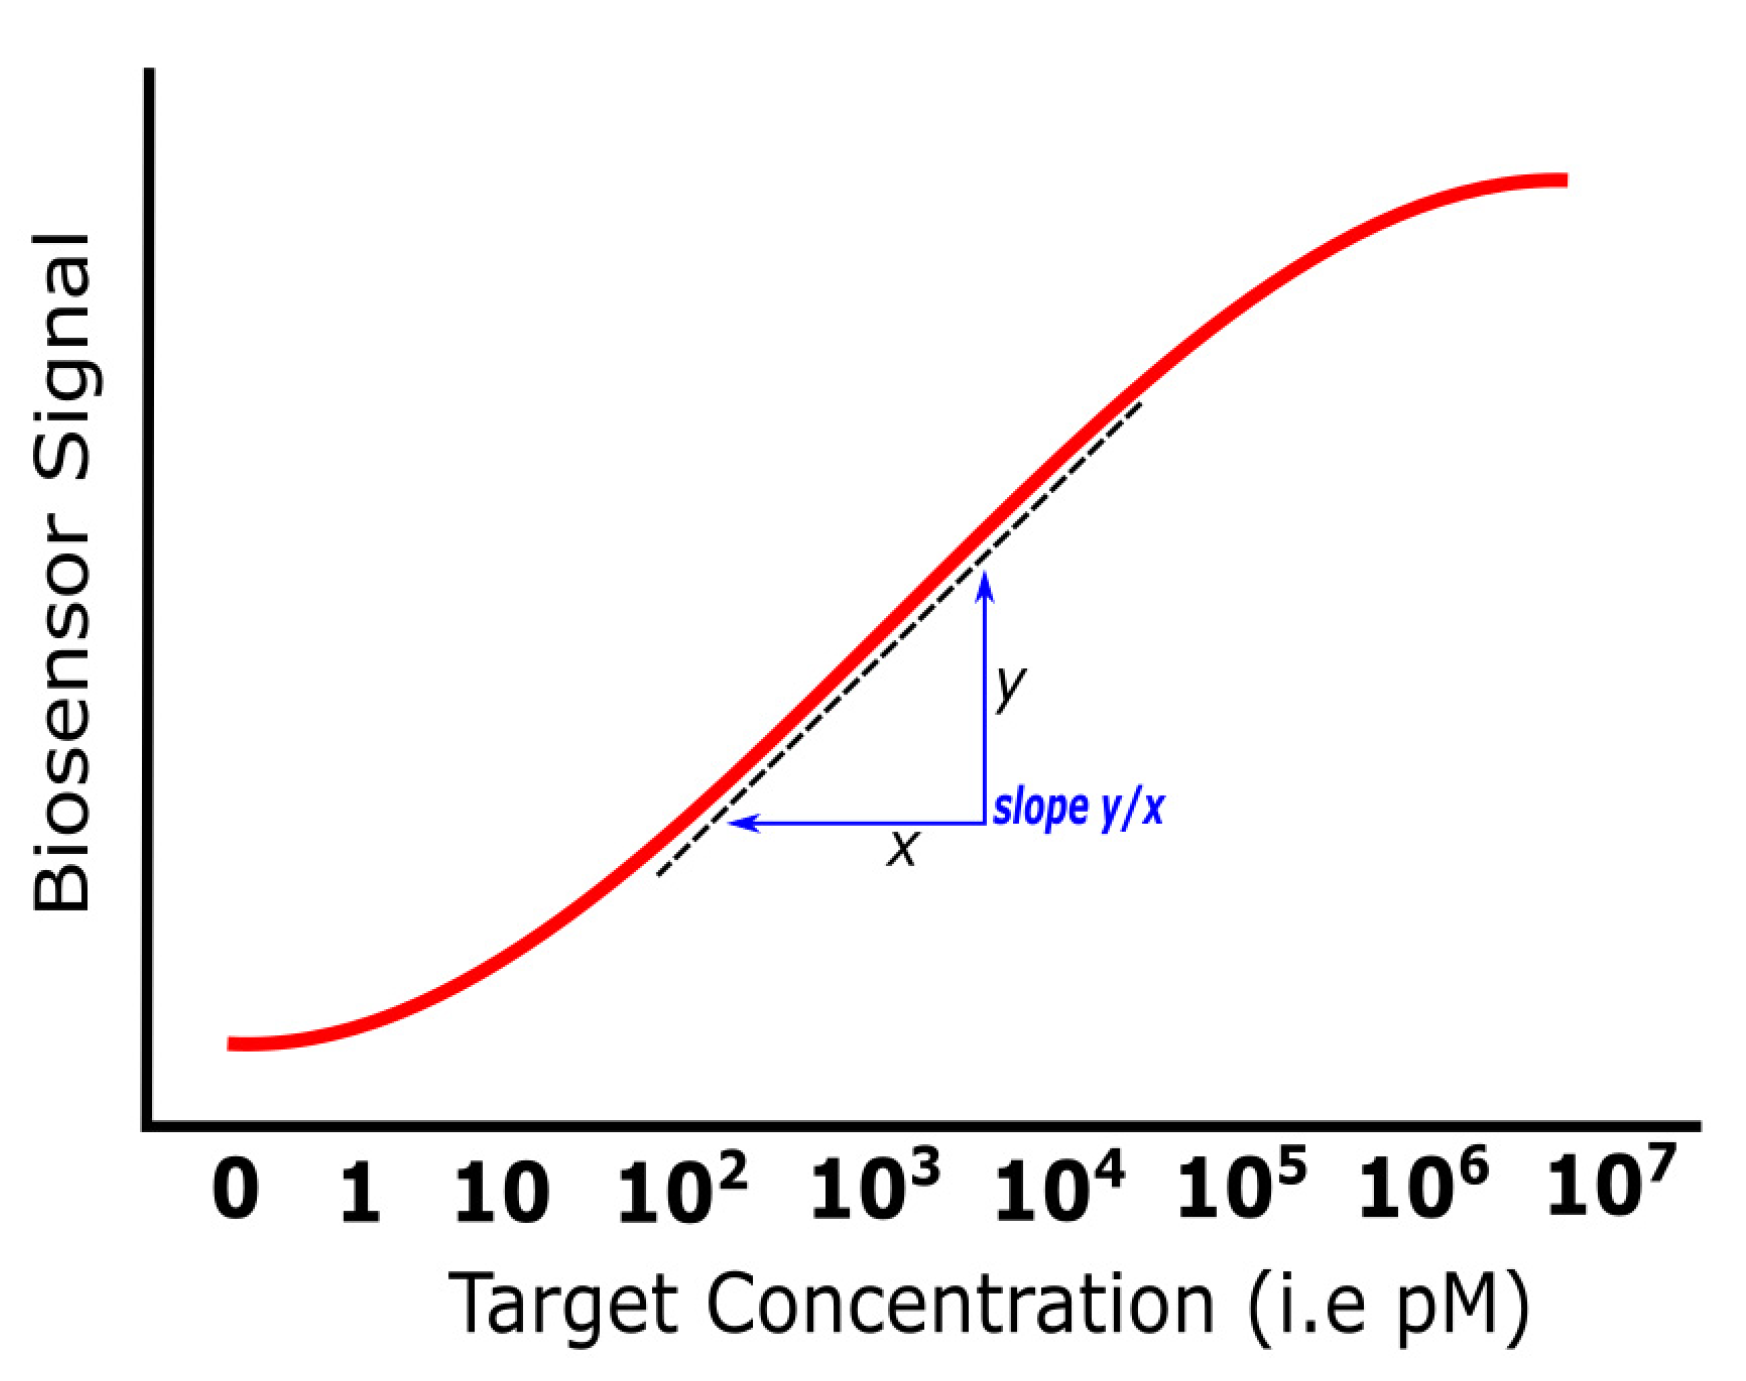
The biosensor sensitivity is defined as the response signal for every unit of the target sample’s concentration. The typical standard curve of the biosensing response for the target detection with a dose–response fitting is depicted in Figure 6. In this curve, a pM unit of concentration is assumed. The slope of the linear region determines the sensitivity (s) in the fitting curve, which is the value of the signal magnitude (y) divided by the unit concentration (x) of the response slope. The higher y value in the response of the similar x value indicates the better sensitivity performance of the biosensor.
In principle, the sensitivity can be enhanced by improving the biosensors’ signal-to-noise ratio (SNR), such as by using sandwich assays [54,55,56] or by utilization of nanoparticle labels in the analytical system [57,58,59]. Other attempts include downscaling the sensing area into two-dimensional (2D) or one-dimensional (1D) structures [60,61,62,63]. The 2D materials for the advanced sensing structure can be graphene [38,64,65], which enhances the detection down to attomolar and femtomolar ranges [66,67,68]. Other 2D materials, such as molybdenum disulfide (MoS2), were reported to be able to boost the detection down to the femtomolar range for protein [69] and DNA detection [70]. Furthermore, the advanced 2D material Mxene was reported to enhance the biosensor detection performance down to 330 fM for the breast cancer marker [71]. While the popular 1D material for biosensing structures can be carbon nanotubes [72,73,74], it was reported to be able to perform the detection down to 10 fM for the trimethylamine target [72], while metal oxide-decorated carbon nanofiber was reported to be able to improve the detection down to 5 fM for the binding of platelet-derived growth factor-BB (PDGF-BB) [75]. Nevertheless, the significant challenges for 1D material sensing are the high fabrication cost for the scaled-up production and the device-to-device variations.

3.2. Dynamic Range

The definition of the dynamic range is the concentration window between the maximum and minimum usable indication of the signal response. Technically, the dynamic range is calculated from the detection limit to the saturation level of the biosensor signal (Figure 7A). Nevertheless, in the dynamic range, the signal response does not always increase proportionally to the target concentration, particularly in the extremely low or high concentration target. Therefore, another term that biosensor experts use is the linear dynamic range to determine the biosensor signal response in the linear region of the fitting curve (Figure 7B). Consequently, the linear range is a trade-off parameter compared with the sensitivity (i.e., when the sensitivity value is high, the detection range will be small, since the saturation level will be reached at a lower target concentration). On the other hand, if the application requires a large linear range performance, the sensitivity of the biosensor will be lower [76,77].
The dynamic range can be enhanced by increasing the surface area of the sensing. The larger surface area can be engineered by using three-dimensional (3D) sensing structures, such as nanopillar or nanoflower arrays, to improve the area for the occupancy of the biorecognition elements [78,79,80], thereby improving the probability to detect high concentrations of the target. However, when developing detection strategies for clinical biomarkers, what will determine the valid dynamic range is the cutoff value (threshold) of the interested biomarkers (explained in detail in Section 4). Technology may allow a log-linear range, but depending on the device’s intended use, the researcher may need to adjust several parameters (if possible) to obtain a narrower dynamic range. The use of different structures of sensing [77,81], diluted and label tailoring [82], varying the concentration of biorecognition elements [83], and the use of antibodies with different affinities [84] are some of the parameters that can be manipulated to achieve the pretended sensitivity and dynamic range. Several strategies for dynamic range enhancements are listed in Table 2.

3.3. Limit of Detection

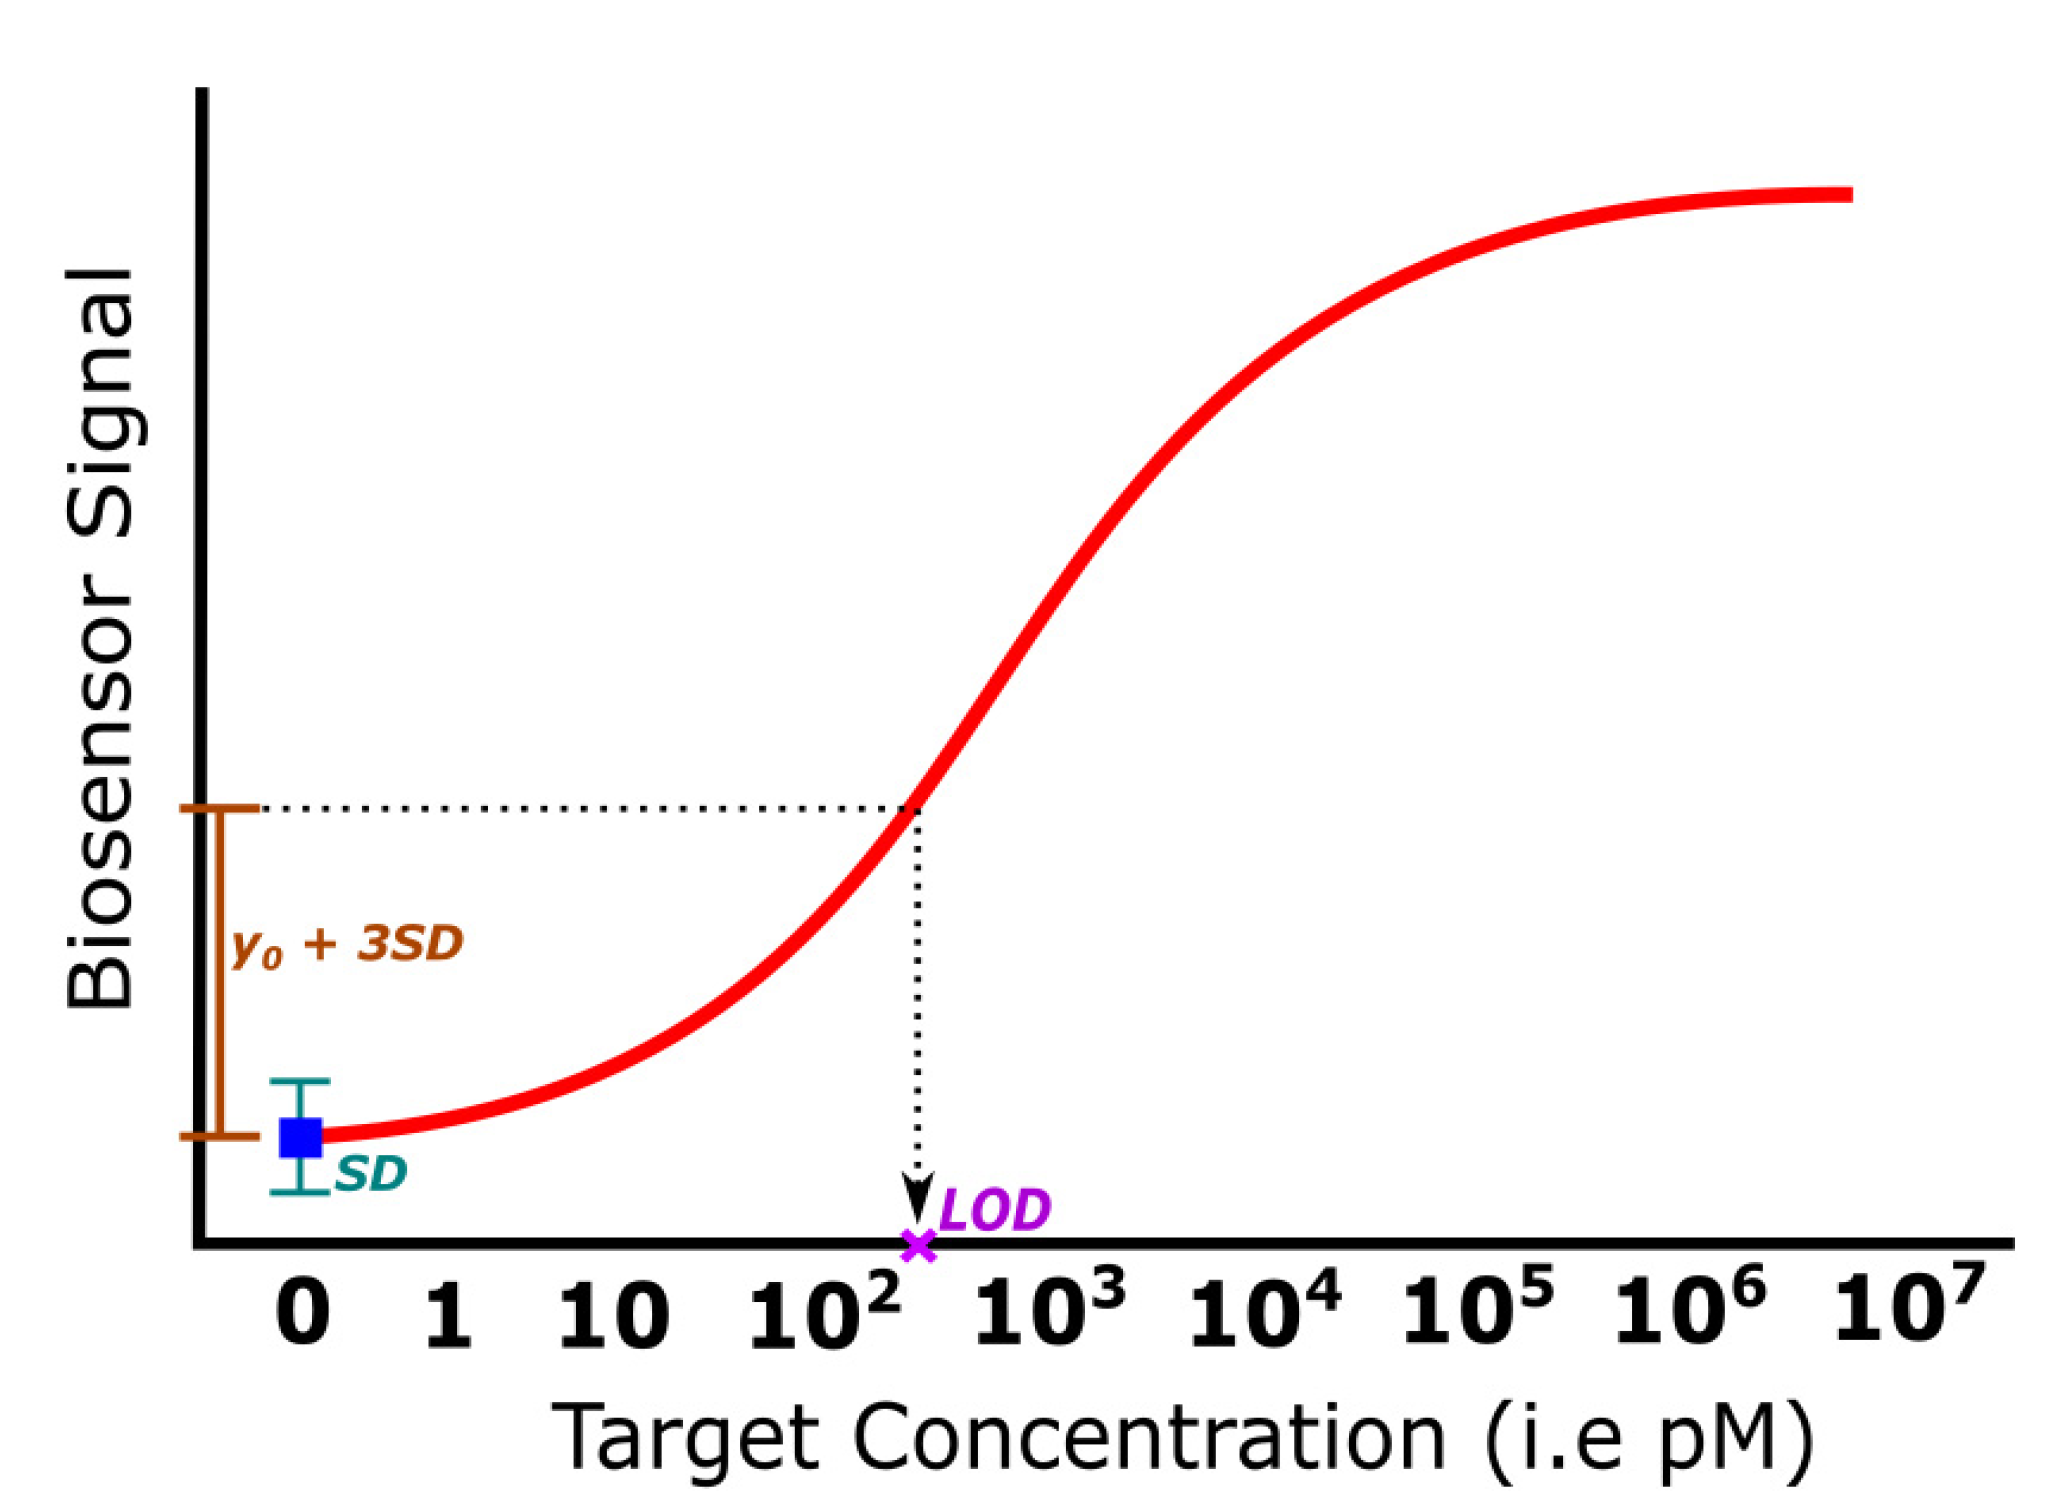
Based on the IUPAC, the definition of the LOD is the value expressed by the smallest concentration (x) that can be detected with a reasonable certainty confidence level [85]. Figure 8 shows a common LOD concept in biosensor application. The lowest response signal is obtained by three times the standard deviation (3SD) from the mean value of a blank measurement (y0). However, another article reported using different confidence level values instead of three times the standard deviation, such as 3.29 times the SD, to obtain a 95% confidence interval of the smallest signal from the blank measurement [86]. For the simplicity of the illustration, in Figure 8, a confidence level of 3 is applied. The magnitude of 3SD from the reference signal can be plotted to find the concentration value of the LOD. Therefore, to define a valid LOD value, the measurement of the zero-concentration target as the reference signal is mandatory. The accurate value of the LOD (x), can be calculated by the known value (y0 + 3SD) on the fitting curve’s (red) formula. Based on this definition, the SD of the blank measurement is the most critical factor in obtaining the LOD value. The measurement uncertainty will determine the accuracy of the LOD. Moreover, if the linear sensitivity slope is higher, a lower LOD can be obtained (in the case of an identical SD value). Therefore, for early detection purposes, the high sensitivity value is preferable to achieve a lower LOD.

3.4. Specificity

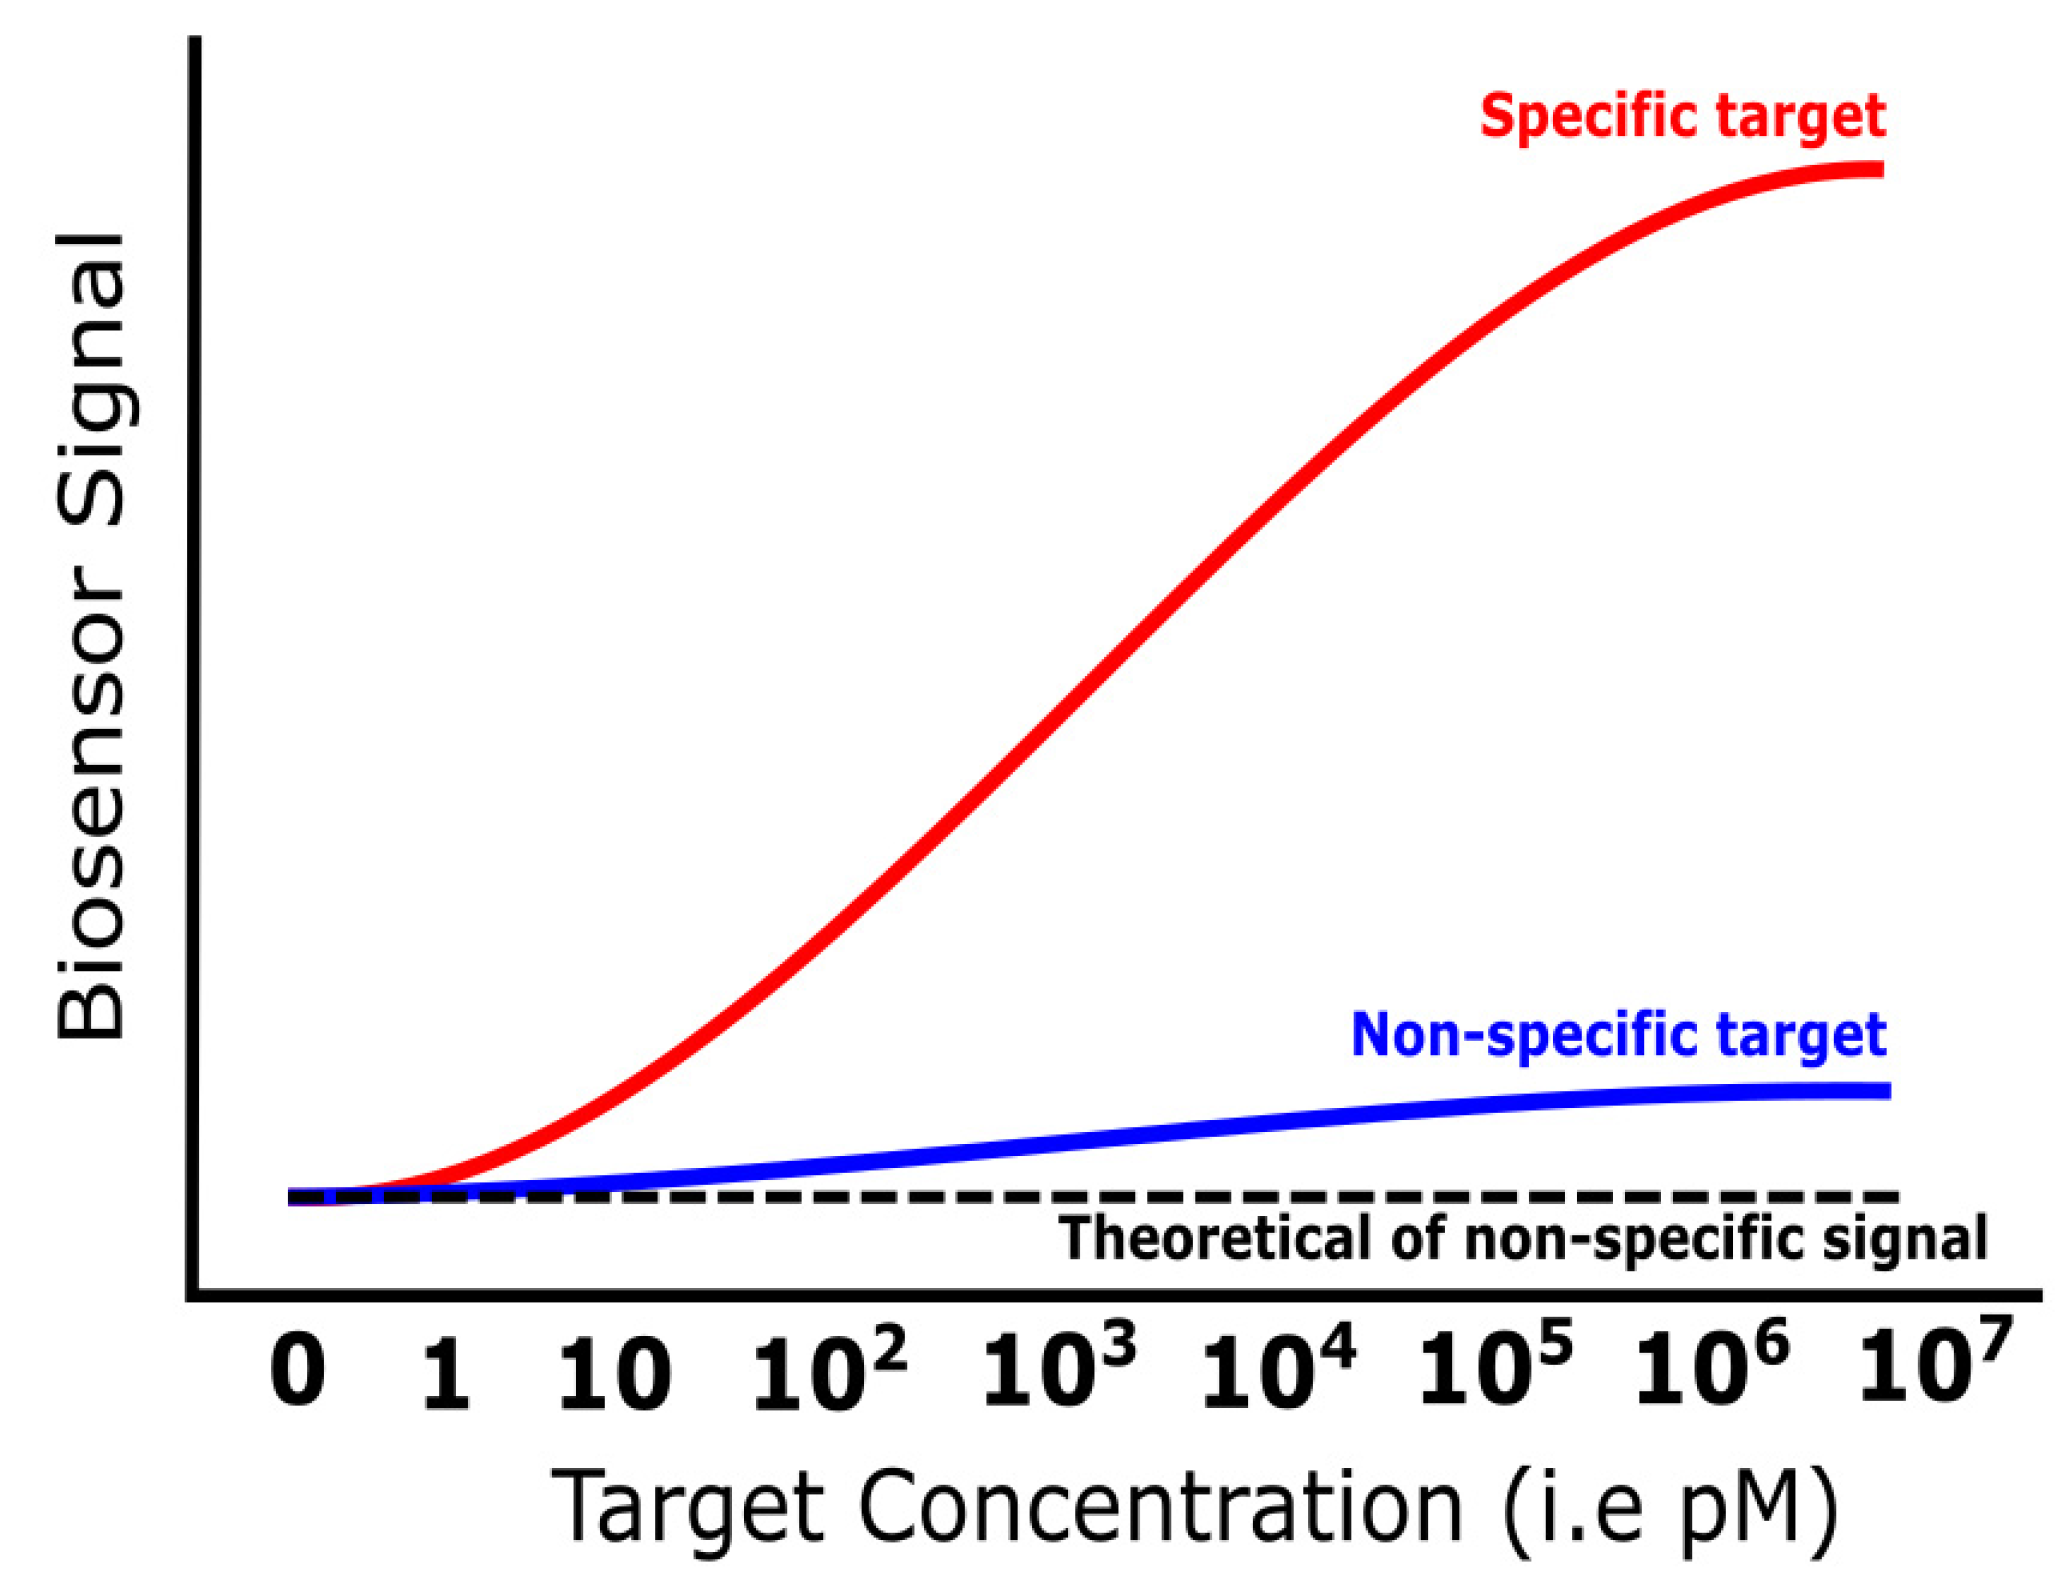
The general concept of sensing is distinguishing a particular substance from others (selective) and capturing a particular target (specific). Therefore, the biosensing system should be configured to detect a specific target by binding with the specific biorecognition element through strong and selective affinity. The quality of the biological components will determine the specificity and, consequently, the sensitivity of the developed detection strategy. Moreover, complex samples may require two labels (dual labeling) to increase the assay specificity [87]. For the evaluation of the specificity performance, the measurement of the non-complementary samples should be compared to the specific target. A functional biosensor should be able to distinguish these different samples producing significantly different response signals. Ideally, the non-specific target’s resulting signal level is similar to the zero-concentration measurement of the biosensor. Nevertheless, in the high concentration of non-specific targets, the false positive or drift signal can appear due to non-specific bindings and interferences. The illustration of the specificity performance in biosensors can be depicted in Figure 9.
Several attempts have been reported to improve the specificity and low-fouling binding during the biosensing measurements, either using a competitive assay or complex media such as serum or whole blood, as well as blocking assays [88,89,90], a polymer brush, and a zwitterionic functionalization surface [91,92,93,94], or by using label and sandwich assays to obtain a specific signal [95,96,97]. In immunoassays, monoclonal antibodies are also recommended to obtain high specificity and lower cross-reactivity events [98]. The summary of specificity strategies is listed in Table 3.

3.5. Reproducibility

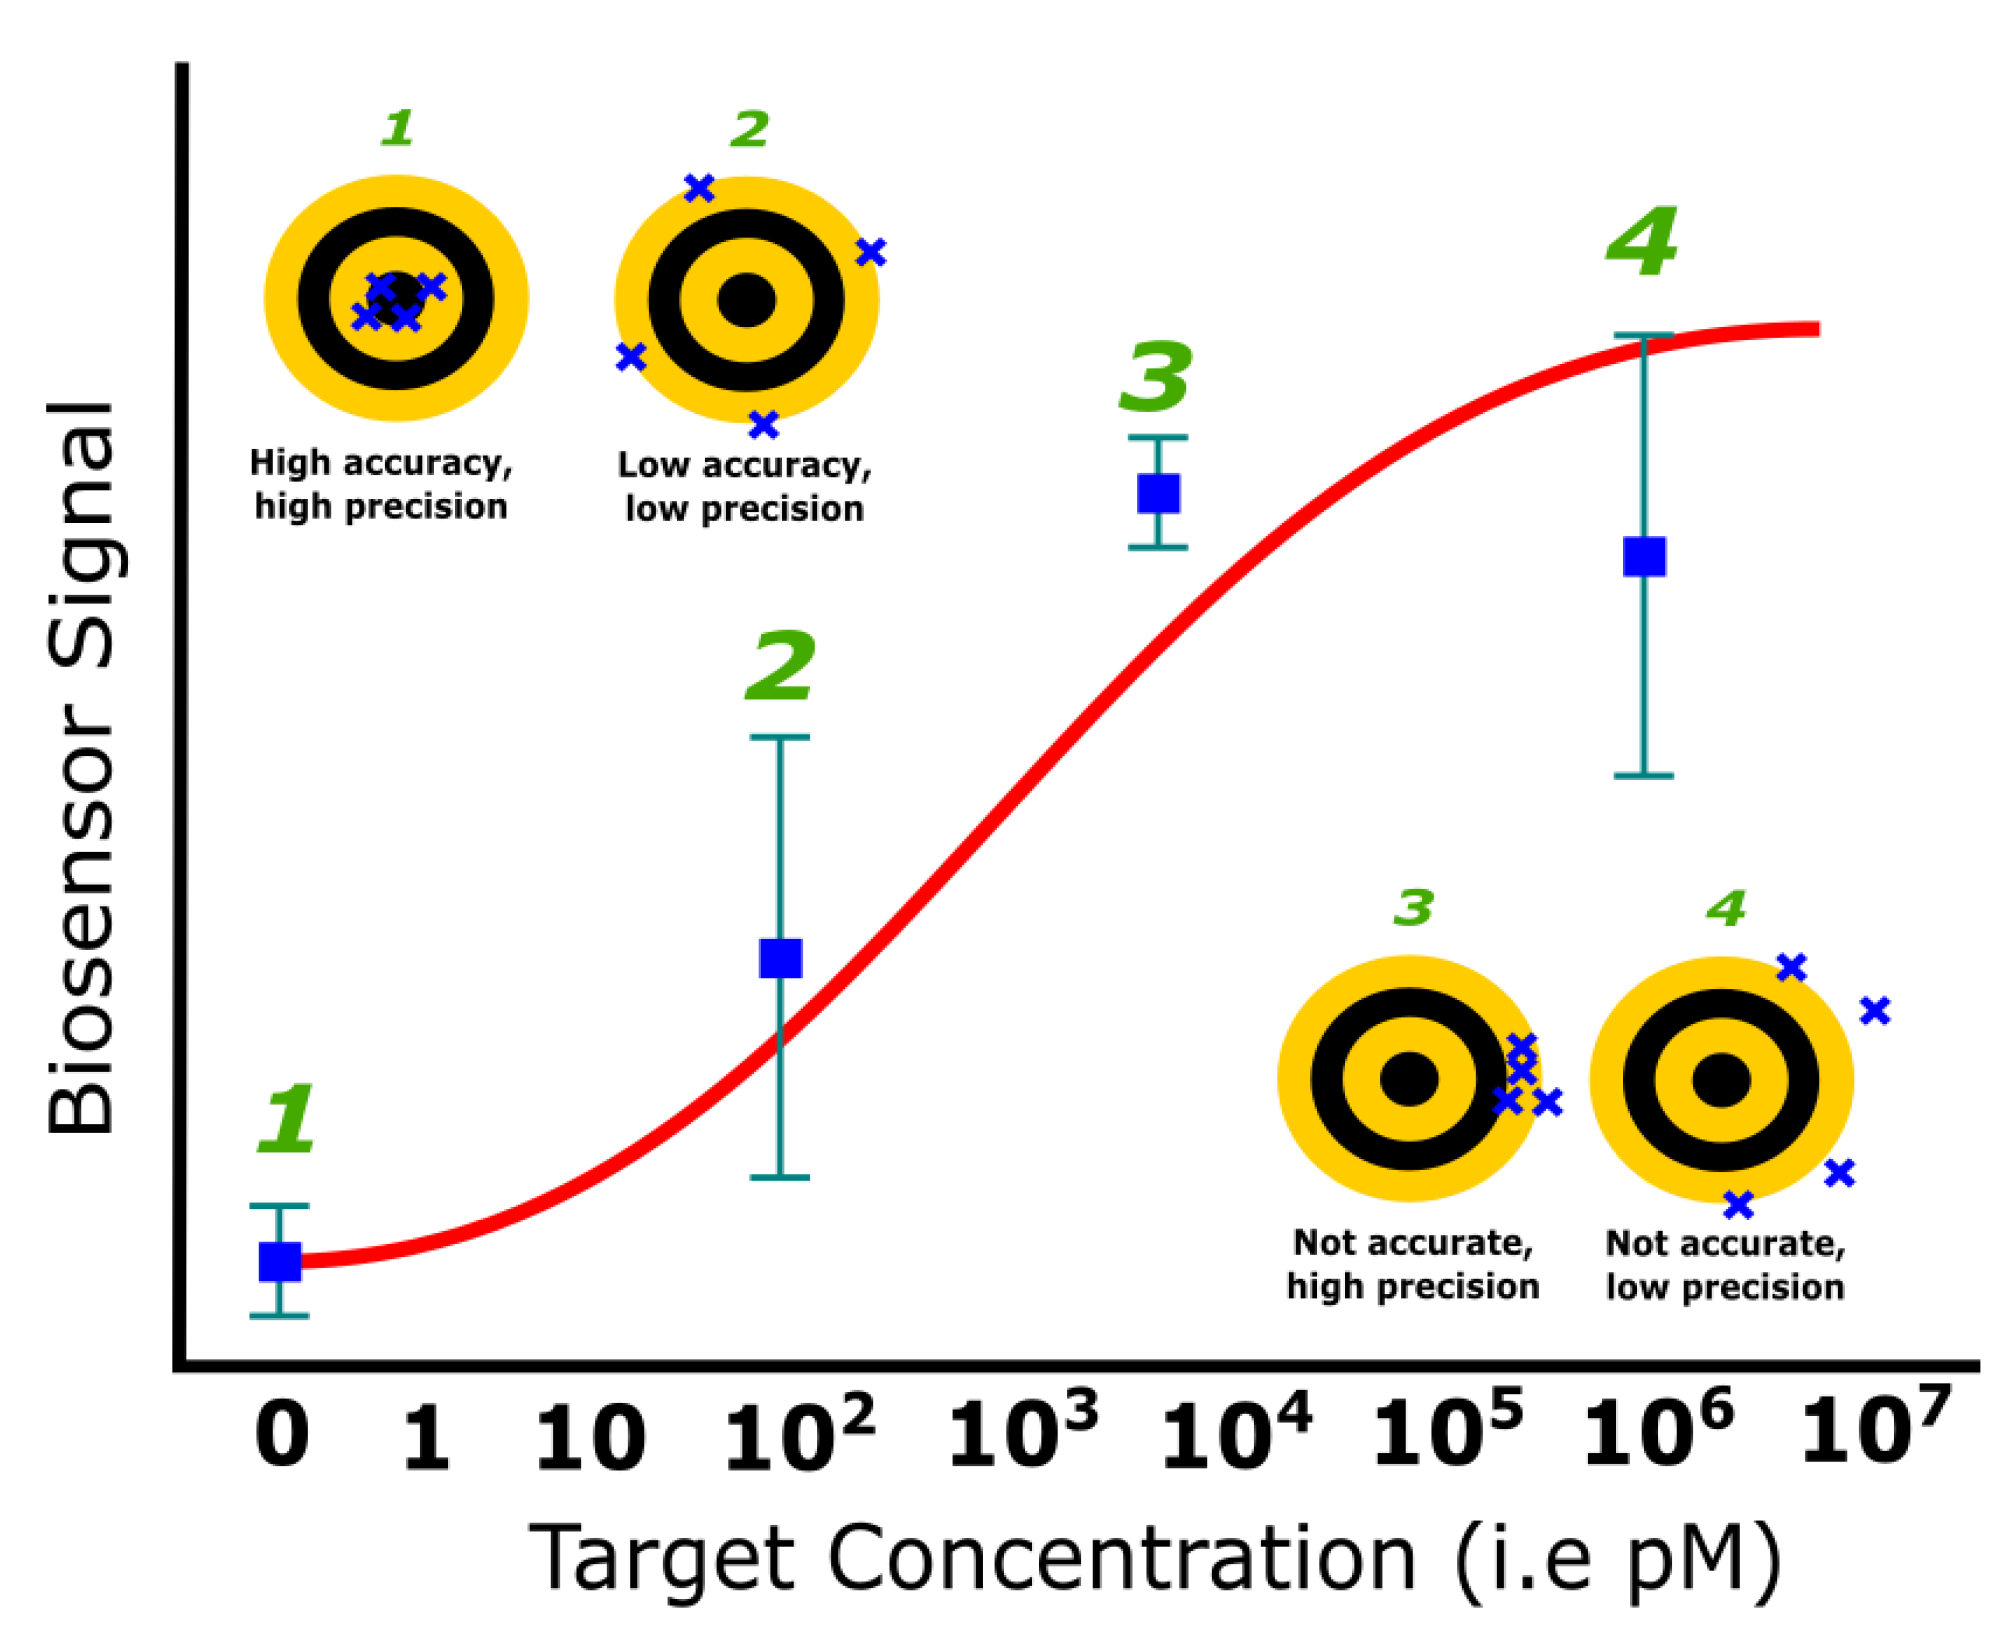
Reproducibility is characterized by the accuracy and precision of the biosensor. It is essential to determine the degree of agreement between independent measurements under slightly different circumstances (or different users) for similar samples and concentrations (a mean value close to the true value). Meanwhile, for precision performance for identical circumstances (or same user), such as experiments on the same day, this can be considered repeatability [99]. Therefore, measuring each sample several times is essential to obtain the SD value in the standard curve, such as in Figure 10. Later, the accuracy and precision of the measurement can be determined. The illustrations of accuracy and precision are depicted in Figure 10.
The first inset illustration (1) represents the excellent accuracy and precision performance of a biosensor. The repetition of the measurements results in an accurate average value and low SD in the signal response. The second illustration (2) of low-accuracy and low-precision measurements leads to a valid average value but a high SD value. For the next illustration (3) for the low-accuracy and high-precision measurement, an inaccurate average value with a small SD is obtained in the standard curve. In this case of the biosensor performance, a calibration protocol is required before measuring the target. The last illustration (4) of the low-accuracy and low-precision measurement is an example of the biosensor’s poor repeatability or reproducibility performance. A high-accuracy and high-precision platform typically requires complicated, bulky, and non-portable instruments [10,100,101]. Still, another method to improve the accuracy and precision of the biosensor signal is advanced signal processing [102,103,104,105,106]. One aspect that is sometimes undervalued is the operator. The detection system should avoid operator interference as much as possible during the measurements. Therefore, robust, portable, and autonomous technology will benefit the reproducibility of the technology for border applications. The main analytical parameters of a biosensor that should be considered when developing a diagnostic device are summarized in Table 4.

4. Biomarker Strategy

A biological marker or biomarker is an objective indicator or parameter of biological conditions to assess the normal biological processes, pathogenic processes, or pharmacologic responses to a therapeutic intervention [107,108]. Generally, the biomarkers are categorized as molecular biomarkers, cellular biomarkers, or imaging biomarkers. The molecular biomarkers commonly used in biosensors are proteins (such as IgG, IgM, antibodies, and proteins) and nucleic acid-based markers (such as RNA, DNA, or KRAS genes) [109,110,111,112,113,114]. The biomarker identification methods based on protein biomarkers and nucleic acids are called proteomics and transcriptomics, respectively [115]. Cellular-based biomarkers are very popular for cancer studies, such as detecting circulating tumor cells (CTCs) [116]. An imaging biomarker is a biological characteristic that is detectable on an image, such as bone, tissue, and tumor cells in diagnostics using, for example, magnetic resonance image (MRI) or computed tomography (CT) scans [117,118,119]. In the biosensors field, the biomarker characteristics lead to biorecognition preferences, such as the immobilization method on the sensing area, to configure the detection strategy. In this section, biosensors for the detection of individual and multiple biomarkers are discussed.

4.1. Single Biomarker

Sequence-based biomarkers mainly dominate the single (or simplex)-biomarker strategy in biosensing detection due to their specific correlation with pathogen species or cells. The detection method in biosensing studies can either monitor DNA hybridization directly [23,34,120] or in combination with the DNA amplification method, such as by polymerase chain reactions (PCRs) and loop-mediated isothermal amplification (LAMP) [102,121]. Recently, potential biomarkers have been proposed using microRNA (miRNA) for several diseases, where miRNA consists of 19–23 nucleotide-long, noncoding, ribonucleic acid (RNA) molecules that are highly conserved across species [115]. In addition, the use of aptamers (synthetically processed single-stranded DNA or RNA) in the biosensing field has also gained much attention from researchers. The simplicity of the aptamer is that the required sequence can be customized to the specific purpose of the sensing method, either to direct detection of the complementary sequence or to utilize it as the biorecognition element for other biomolecules or toxins [122,123,124,125].
Although sequence-based biomarkers are widely available and suitable for multiple diseases, protein biomarkers are of paramount importance in clinical settings [126]. A well-known protein biomarker for the early screening of prostate cancer is the prostate-specific antigen (PSA). It is a typical glycoprotein produced by the prostate epithelium, which is secreted in the disruption of the ductal lumen and basement membrane disorder [127]. Several biosensor applications and methods have been reported utilizing PSA as a biomarker, such as in the nanowire FET-based devices [61,128], SERS platform [129], piezoelectric-based device [130], and SPR sensors [131,132].
Another acknowledged simplex biomarker in trophoblastic tumors is human chorionic gonadotropin (hCG) [133]. Recent studies found the hCG can be used as a biomarker for multiple diseases [134]. The hCG is a hormone present in healthy pregnant women. Nevertheless, in the patient with the trophoblastic tumor, the hCG secretion can increase up to 10,000 mIU/mL at 5 weeks, 1000 mIU/mL at 8 weeks, or detectable at 24 weeks after the evacuation of the mole, at which point is recommended for the patient to undergo chemotherapy [133,135]. Several studies reported the detection of hCG in biosensor platforms, such as in magnetometer-based biosensor [8,136,137,138], plasmonic-based biosensor [139,140], QCM platform [141], and FET-based device [142].
Cardiac troponins (cTn) that are part of the contractile apparatus proteins are specific to the heart, indicating they can be applied as biomarkers for cardiovascular diseases [143,144]. Various detection techniques and biosensor platforms have been proposed for the detection of cTn biomarkers, such as in piezoelectric platforms [145], plasmonic sensor platforms [146,147,148,149,150,151], and FET-based biosensors [152,153,154,155]. A resume of different biomarkers detected with the single biomarker strategy is presented in Table 5.

4.2. Multiple Biomarkers

In the case of complex diseases in medical science, analyzing a single biomarker is not enough to evaluate the biological or pathogenic process. Therefore, assessing a panel of biomarkers is required to improve the specificity and accuracy of the diagnosis. For example, Duffy 2020 [157] noted that PSA single biomarker detection is not enough to assess the prostate cancer state. Their study proposed additional biomarkers such as (Prostate Health Index) PHI, 4K score, and prostate cancer gene 3 (PCA3) as the panel biomarkers. The 4K score itself contains the total PSA, free PSA, intact PSA (a form of free PSA), and human kallikrein 2 (hK2) [157]. Another panel of biomarkers has been proposed for the evaluation of colorectal cancer (CRC). In clinical practice, the RAS gene family (KRAS and NRAS), BRAF, HER2, and microsatellite instability (MSI) have been reported as candidates for the panel of biomarkers [158]. A panel of biomarkers has also been proposed for ovarian cancer assessment [159]. These findings in medical sciences can be a valuable milestone for the clinical application of biosensors to perform panel biomarkers simultaneously.
An example of the biosensing application of the multiplex strategy was reported by Katchman 2016 [160] using the flexible display of organic-light emitting diodes (OLED). This study demonstrated an application for multiplex detection of the HPV16 proteins E2, E6, and E7, which are known as biomarkers for cervical, head, and neck cancer. A detection limit of 10 pg/mL was achieved [160]. Qureshi et al. proposed a sensing array using a capacitor-based biosensor for high-throughput measurements. Gold interdigitated electrodes (GID) are configured to detect a panel of inflammation and cardiovascular risk biomarkers, including C-reactive protein (CRP), TNFα, and IL6. A dynamic range performance was presented from 25 pg/ml to 25 ng/ml [161]. Another proof-of-concept of multiplex biosensor for the detection of cardiovascular diseases was reported by Shanmugam et al. The troponin markers group (cTnI and cTnT) were detected simultaneously in human serum, using Electrochemical Impedance Spectroscopy (EIS) and Mott-Schottky methods [162]. A GMR-based biosensor was reported to detect a panel of cardiovascular biomarkers: PAPP-A, PCSK9, and ST2. A LOD of 40 pg/mL for the ST2 antigen was achieved, which the dynamic range is going up four orders of magnitude [7]. A magnetoresistive-based biosensor was demonstrated for the detection of rare cell biomarkers: epithelial cell adhesion molecule (EpCAM), human epidermal growth factor receptor 2 (HER2), and epidermal growth factor receptor (EGFR) on individual cells. The accuracy was claimed to be 96%, compared to the 15% obtained with the Cell-Search method, while the throughput sample achieved was up to ~107 cells/min [163].
Multi-analyte detection to assess Salmonella infection was demonstrated by Ewald et al. using an optical biosensor reflectometer. Anti-Salmonella antibodies and CRP were detected simultaneously, with a dynamic range from 5.74 to 122.52 mg/L [164]. Fountoglou et al. reported an LSPR sensor using colorimetric-induced gold nanoparticles as a multi-allele DNA biosensor to detect thrombosis biomarkers. DNA amplification using PCR was performed before the colorimetric detection, and 100% accuracy was reported with this methodology [165]. A nanoparticle-based LSPR sensor was also proposed by Lee et al. to detect a panel of cancer biomarkers, such as α-fetoprotein (AFP), carcinoembryonic antigen (CEA), and PSA. The reported detection limit performances from the analytes in patient-mimicked serums were 91 fM for AFP, 94 fM for CEA, and 10 fM for PSA [166]. Another colorimetric sensor utilizing AuNP and aptamer probes was reported to detect multiple proteins on the exosome surface [167]. A photonic crystal biosensor achieved the multiplex detection of exosome vesicles (EV) released by macrophages. A panel of seven biomarkers was used, including CD9, CD63, CD68, CD80, CD81, CD86, and I-A/I-E. A dynamic range of EVs detection from 2×10¹¹ particles/mL to 2×10⁹ particles/mL was achieved [168].
Multiplex detection of sepsis biomarkers was reported in a modular electrochemical biosensor. The sensing layer used a nanoporous nylon membrane integrated onto the microelectrode. The LOD was of 0.1 ng/mL for procalcitonin (PCT), and 1 µg/mL for lipoteichoic acid (LTA) and lipopolysaccharide (LPS) and LTA, while the dynamic ranges achieved were from 0.1 ng/mL to 10 µg/mL for PCT and from 1 µg/mL to 1000 µg/mL for LPS and LTA biomarkers [169]. Multiplex measurement of physiological body fluid biomarkers was demonstrated in a wearable biosensor by Yokus et al. This research reported a wireless, real-time, and high-throughput measurement of glucose, lactate, pH, and temperature. The wearable sensors demonstrated sensitivity performance of 26.31 μA/mM·cm2 for glucose, 1.49 μA/mM·cm2 for lactate, 54 mV/pH for pH, and 0.002 °C-1 for temperature [170]. Some biosensors studies for multiplex biomarkers assessment are summarized in Table 6.

5. Biomarker Clinical Cut-Off Value

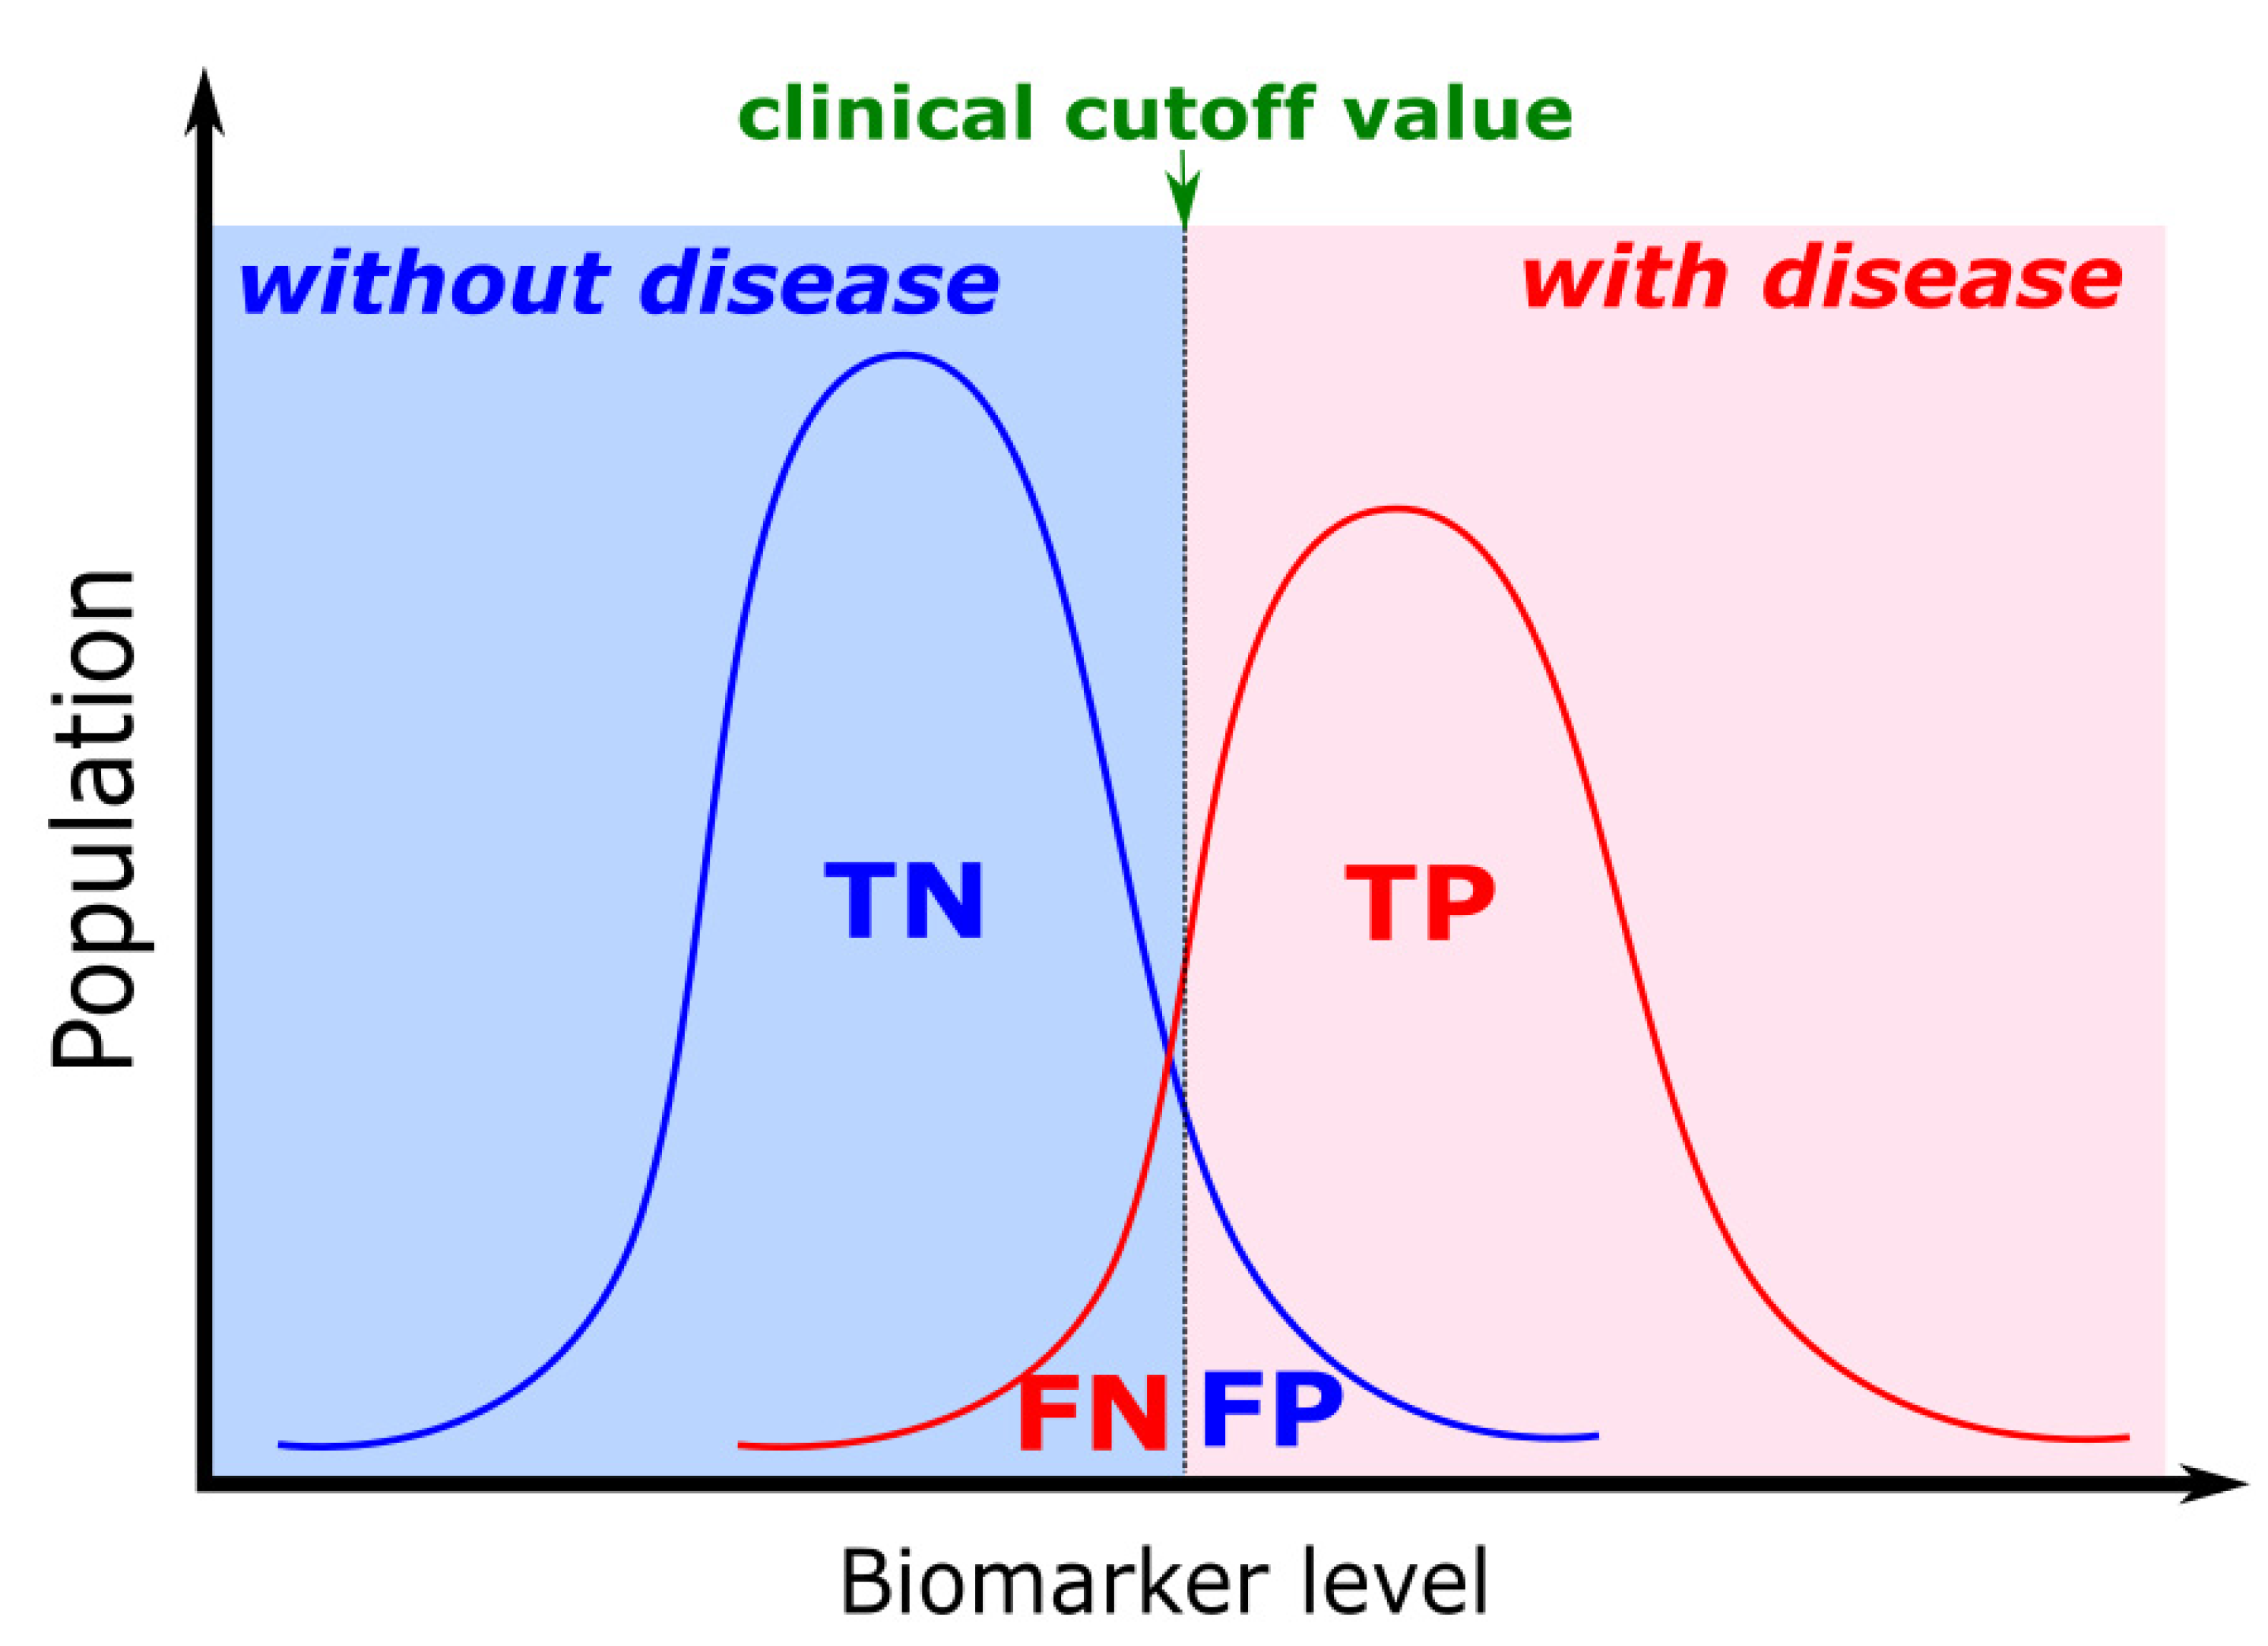
The cutoff value is an important element to be considered in the development of a diagnostic tool. In principle, the clinical cutoff is a threshold value of the biomarker concentration that distinguishes the clinical condition from the healthy patient. Therefore, the precision and accuracy of quantifying this type of value play a significant role in biosensor research. The typical illustration of the biomarker clinical cutoff value is depicted in Figure 11. The use of cutoff value can help to provide the stage or diagnosis of the disease. However, a fraction of the population fits in the false negative or false positive region, and to overcome this issue, the use of a panel of biomarkers can enhance the analytical performance of the biosensor. Therefore, a comprehensive analysis of the biomarkers in the context of the clinical diagnostic is critical for the development of a biosensing method able to improve clinical decisions.
For example, in the case of prostate cancer, a study suggested a clinical cutoff value for the PSA biomarker of 4 ng/ml in blood. In patients, the PSA concentration can reach up to 104 ng/mL, while it is usually below 0.1 ng/mL in healthy people. As such, patients with a PSA concentration higher than 4 ng/mL are required to perform a biopsy analysis. Another study recommended that the range of 2–4 ng/mL be considered the grey area, although it will decrease the TP rate [127]. Although only one biomarker is detected, if the biosensor is sensitive enough (LoD below 4 ng/mL), it can increase the chance for diagnostic of prostate cancer at an earlier stage of the disease, improving the chances of a positive outcome for the patient. Another option could be the inclusion of multiple biomarkers in the initial analysis as suggested by Duffy 2020 [157], which proposed the use of additional biomarkers such as prostate cancer gene 3 (PCA3), and the Prostate Health Index (PHI), 4K score. These biomarkers must be thoughtfully studied to determine a cutoff value and the entire panel for clinical analysis.
For ovarian cancer, the biomarker CA-125 is a peptide epitope with a molecular weight of 3–5 MDa mucin, MUC16. This biomarker is present in healthy individuals in the range of 0-35 U/mL, while it is overexpressed in ovarian cancer patients. As such, some studies suggest a clinical cutoff level around 30-35 U/mL [171,172]. In addition, CRP is a well-known biomarker for cardiovascular disease and general inflammation, including bacterial and viral infections, such as Salmonella and COVID-19 [161,164,173,174]. The WHO reported this biomarker also for the nutrition state assessment. The CRP clinical cutoff concentration in blood is around 10 ng/mL. This concentration rapidly increases several hours after the inflammatory disease onset and can reach up to 350–400 ng/mL in 2 days [175]. Consequently, for this biomarker, a biosensor platform with a dynamic range from less than 10 ng/mL to 400 ng/mL, would be necessary for inflammatory disease assessment. Nevertheless, CRP is a general inflammatory marker; a biosensor for single biomarker CRP detection cannot distinguish the origin of the disease. Therefore this scenario will be challenging for a clinical decision.
To obtain a full picture of complex diseases, the cutoff value for multiple biomarkers must be determined to achieve precision and accuracy in the clinical diagnostic tools. One such example can be seen for stratification ischemic stroke patients for tPA (tissue Plasminogen Activator) therapy. A group of researchers from clinical neurosciences proposed a panel of biomarkers that reflect patients undergoing ischemic stroke [176]. It was proposed that for levels of cellular-Fibronectin above 3.6 µg/mL [177,178], Matrix Metalloproteinase-9 above 140 ng/mL [177,178], Platelet-derived Growth Factor-CC above 175 ng/mL [179], Neuroserpin below 70 ng/mL [180], and the calcium-binding protein S100β above 230 ng/mL [177,181], the patients can be at a higher risk on developing a hemorrhagic transformation (HT) after tPA treatment. Although the detection of each biomarker is not specific for HT risk, the combination of at least two biomarkers (c-Fn and MMP9) can provide a detection specificity of 87%, increasing the chances of a safe diagnosis and improving clinical decision [178].
It is also essential to notice that the same biomarkers could be used to diagnose other diseases as long as the cutoff values and biomarker combination considered are adjusted to the clinical condition at study. Wood et al [182] also report optimizing multiples parameters in a particle-based platform to achieve detection of 3 different analytes (multiplex assay) with different ranges of relevant concentrations. Parameters such as particle concentration [82,182], capture antibody affinity [82,182], measuring conditions [82], and sample preparation (e.g., dilutions) [82,182] affect the outcome of the developed assay and can be tuned to fit the necessary cutoff value for the clinical application being targeted.
As such, biosensor platform application to the clinical environment depends on adjusting its dynamic range to cover the clinical cutoff concentration of the biomarkers and the ability to provide multiple biomarker detection to provide specific diagnostics.

6. Conclusions

In conclusion, to initiate multidisciplinary research in the biosensors field, several steps should be considered systematically, which are illustrated in Figure 12.
The sequential concept from biomarker preferences allows the assay developer to choose the platform and detection methods with broader options.
Moreover, the future outlook and challenges of the development biosensor platform will be for high-throughput samples that will be an essential feature for panel biomarker study. Nevertheless, if the biomarkers in the panel contain different structures or physical properties, a different dynamic range for the biosensor platform could be required, such as if the panel biomarkers consist of nucleic acid sequences, proteins, and cells. Another case is if the panel biomarkers consist of sequences of nucleic acid with different lengths. Therefore, each marker may require different clinical cutoff values, detection methods, and dynamic ranges of biosensor performance. In these cases, each channel of the high-throughput biosensors will be excellent if it can be adjustable for the different dynamic range performances to comply with the biomarker properties. In addition, in the high-throughput biosensors for panel biomarker analysis, advanced signal processing and integration with a machine learning algorithm to improve the detection accuracy will be a remarkable trend in the future.

Author Contributions

Conceptualization, B.A.P. and E.F.; investigation, B.A.P.; writing—original draft preparation, B.A.P.; writing—review and editing, B.A.P., P.D.C., E.F. and P.F.; illustrations and visualization, B.A.P.; supervision, E.F. and P.F.; project administration, E.F.; funding acquisition, E.F. and P.F. All authors have read and agreed to the published version of the manuscript.

Funding

The authors thank the Fundação para a Ciência e a Tecnologia (FCT) through project FIM4Stroke (reference PTDC/MEC-URG/29561/2017). Patrícia D. Cabral acknowledges the FCT for PhD grant SFRH/BD/128579/2017.

Conflicts of Interest

The authors declare no conflict of interest.

References

  1. Ward, M.P.; Li, X.; Tian, K. Novel coronavirus 2019, an emerging public health emergency. Transbound. Emerg. Dis. 2020, 67, 469–470. [Google Scholar] [CrossRef] [PubMed]
  2. Udugama, B.; Kadhiresan, P.; Kozlowski, H.N.; Malekjahani, A.; Osborne, M.; Li, V.Y.C.; Chen, H.; Mubareka, S.; Gubbay, J.B.; Chan, W.C.W. Diagnosing COVID-19: The Disease and Tools for Detection. ACS Nano 2020, 14, 3822–3835. [Google Scholar] [CrossRef] [Green Version]
  3. Nagel, B.; Dellweg, H.; Gierasch, L. Glossary for chemists of terms used in biotechnology (IUPAC Recommendations 1992). Pure Appl. Chem. 2009, 64, 143–168. [Google Scholar] [CrossRef] [Green Version]
  4. Puiu, M.; Bala, C. Microfluidics-integrated biosensing platforms as emergency tools for on-site field detection of foodborne pathogens. TrAC Trends Anal. Chem. 2020, 125, 115831. [Google Scholar] [CrossRef]
  5. Selleck, M.J.; Senthil, M.; Wall, N.R. Making Meaningful Clinical Use of Biomarkers. Biomark. Insights 2017, 12, 1177271917715236. [Google Scholar] [CrossRef] [PubMed] [Green Version]
  6. Fullerton, E.E.; Childress, J.R. Spintronics, Magnetoresistive Heads, and the Emergence of the Digital World. Proc. IEEE 2016, 104, 1787–1795. [Google Scholar] [CrossRef]
  7. Wang, Y.; Wang, W.; Yu, L.; Tu, L.; Feng, Y.; Klein, T.; Wang, J.-P.J.P. Giant magnetoresistive-based biosensing probe station system for multiplex protein assays. Biosens. Bioelectron. 2015, 70, 61–68. [Google Scholar] [CrossRef] [PubMed]
  8. Marquina, C.; De Teresa, J.M.; Serrate, D.; Marzo, J.; Cardoso, F.A.; Saurel, D.; Cardoso, S.; Freitas, P.P.; Ibarra, M.R. GMR sensors and magnetic nanoparticles for immuno-chromatographic assays. J. Magn. Magn. Mater. 2012, 324, 3495–3498. [Google Scholar] [CrossRef] [Green Version]
  9. Wu, K.; Su, D.; Liu, J.; Saha, R.; Wang, J.P. Magnetic nanoparticles in nanomedicine: A review of recent advances. Nanotechnology 2019, 30, 502003. [Google Scholar] [CrossRef] [PubMed] [Green Version]
  10. Mu, X.H.; Liu, H.F.; Tong, Z.Y.; Du, B.; Liu, S.; Liu, B.; Liu, Z.W.; Gao, C.; Wang, J.; Dong, H. A new rapid detection method for ricin based on tunneling magnetoresistance biosensor. Sens. Actuators B Chem. 2019, 284, 638–649. [Google Scholar] [CrossRef]
  11. Kim, K.; Hall, D.A.; Yao, C.; Lee, J.R.; Ooi, C.C.; Bechstein, D.J.B.; Guo, Y.; Wang, S.X. Magnetoresistive biosensors with on-chip pulsed excitation and magnetic correlated double sampling. Sci. Rep. 2018, 8, 16493. [Google Scholar] [CrossRef]
  12. Hall, D.A.; Gaster, R.S.; Osterfeld, S.J.; Murmann, B.; Wang, S.X. GMR biosensor arrays: Correction techniques for reproducibility and enhanced sensitivity. Biosens. Bioelectron. 2010, 25, 2177–2181. [Google Scholar] [CrossRef] [Green Version]
  13. Purwidyantri, A.; Tian, Y.; Muhammad, G.; Saputra, A.; Prabowo, B.A. Gold Nanoframe Array Electrode for Straightforward Detection of Hydrogen Peroxide. Chemosensors 2021, 9, 37. [Google Scholar] [CrossRef]
  14. Bhattacharyya, I.M.; Cohen, S.; Shalabny, A.; Bashouti, M.; Akavayov, B.; Shalev, G. Specific and label-free immunosensing of protein-protein interactions with silicon-based immunoFETs. Biosens. Bioelectron. 2019, 132, 143–161. [Google Scholar] [CrossRef] [PubMed]
  15. Danielson, E.; Sontakke, V.A.; Porkovich, A.J.; Wang, Z.; Kumar, P.; Ziadi, Z.; Yokobayashi, Y.; Sowwan, M. Graphene based field-effect transistor biosensors functionalized using gas-phase synthesized gold nanoparticles. Sens. Actuators B Chem. 2020, 320, 128432. [Google Scholar] [CrossRef]
  16. Kuznetsov, A.E.; Komarova, N.V.; Kuznetsov, E.V.; Andrianova, M.S.; Grudtsov, V.P.; Rybachek, E.N.; Puchnin, K.V.; Ryazantsev, D.V.; Saurov, A.N. Integration of a field effect transistor-based aptasensor under a hydrophobic membrane for bioelectronic nose applications. Biosens. Bioelectron. 2019, 129, 29–35. [Google Scholar] [CrossRef] [PubMed]
  17. Park, S.; Kim, M.; Kim, D.; Kang, S.H.; Lee, K.H.; Jeong, Y. Interfacial charge regulation of protein blocking layers in transistor biosensor for direct measurement in serum. Biosens. Bioelectron. 2020, 147, 111737. [Google Scholar] [CrossRef] [PubMed]
  18. Pletinck, A.; Van Biesen, W.; Dequidt, C.; Eloot, S. Transport of neutral IgG2 versus anionic IgG4 in PD: Implications on the electrokinetic model. BMC Nephrol. 2018, 19, 299. [Google Scholar] [CrossRef] [PubMed]
  19. Pillarisetty, R. Academic and industry research progress in germanium nanodevices. Nature 2011, 479, 324–328. [Google Scholar] [CrossRef]
  20. Jing, X.; Illarionov, Y.; Yalon, E.; Zhou, P.; Grasser, T.; Shi, Y.; Lanza, M. Engineering Field Effect Transistors with 2D Semiconducting Channels: Status and Prospects. Adv. Funct. Mater. 2020, 30, 1–21. [Google Scholar] [CrossRef]
  21. Jang, H.J.; Gu, J.G.; Cho, W.J. Sensitivity enhancement of amorphous InGaZnO thin film transistor based extended gate field-effect transistors with dual-gate operation. Sens. Actuators B Chem. 2013, 181, 880–884. [Google Scholar] [CrossRef]
  22. Guan, W.; Duan, X.; Reed, M.A. Highly specific and sensitive non-enzymatic determination of uric acid in serum and urine by extended gate field effect transistor sensors. Biosens. Bioelectron. 2014, 51, 225–231. [Google Scholar] [CrossRef]
  23. Purwidyantri, A.; Kamajaya, L.; Chen, C.-H.; Luo, J.-D.; Chiou, C.-C.; Tian, Y.-C.; Lin, C.-Y.; Yang, C.-M.; Lai, C.-S. A Colloidal Nanopatterning and Downscaling of a Highly Periodic Au Nanoporous EGFET Biosensor. J. Electrochem. Soc. 2018, 165, H3170–H3177. [Google Scholar] [CrossRef]
  24. Fohlerová, Z.; Turánek, J.; Skládal, P. The cell adhesion and cytotoxicity effects of the derivate of vitamin e compared for two cell lines using a piezoelectric biosensor. Sens. Actuators B Chem. 2012, 174, 153–157. [Google Scholar] [CrossRef]
  25. Bianco, M.; Vergara, D.; De Domenico, S.; Maffia, M.; Gaballo, A.; Arima, V. Quartz Crystal Microbalance as Cell-Based Biosensor to Detect and Study Cytoskeletal Alterations and Dynamics. Biotechnol. J. 2018, 13, 1700699. [Google Scholar] [CrossRef]
  26. Xu, L.; Wang, R.; Kelso, L.C.; Ying, Y.; Li, Y. A target-responsive and size-dependent hydrogel aptasensor embedded with QD fluorescent reporters for rapid detection of avian influenza virus H5N1. Sens. Actuators B Chem. 2016, 234, 98–108. [Google Scholar] [CrossRef]
  27. Jean, H.; Saha, T.; Tey, T.; Siang, W.; Wei, C. Quartz crystal microbalance-based biosensors as rapid diagnostic devices for infectious diseases. Biosens. Bioelectron. 2020, 168, 112513. [Google Scholar] [CrossRef]
  28. Fu, Y.Q.; Luo, J.K.; Nguyen, N.T.; Walton, A.J.; Flewitt, A.J.; Zu, X.T.; Li, Y.; McHale, G.; Matthews, A.; Iborra, E.; et al. Advances in piezoelectric thin films for acoustic biosensors, acoustofluidics and lab-on-chip applications. Prog. Mater. Sci. 2017, 89, 31–91. [Google Scholar] [CrossRef] [Green Version]
  29. Prabowo, B.A.; Purwidyantri, A.; Liu, K.-C.C. Surface Plasmon Resonance Optical Sensor: A Review on Light Source Technology. Biosensors 2018, 8, 80. [Google Scholar] [CrossRef] [PubMed] [Green Version]
  30. Taylor, A.B.; Zijlstra, P. Single-Molecule Plasmon Sensing: Current Status and Future Prospects. ACS Sens. 2017, 2, 1103–1122. [Google Scholar] [CrossRef] [Green Version]
  31. Long, Y.-T.; Jing, C. Localized Surface Plasmon Resonance based Nanobiosensors.; Springer: Berlin/Heidelberg, Germany, 2014; ISBN 978-3-642-54795-9. [Google Scholar] [CrossRef]
  32. Szunerits, S.; Spadavecchia, J.; Boukherroub, R. Surface plasmon resonance: Signal amplification using colloidal gold nanoparticles for enhanced sensitivity. Rev. Anal. Chem. 2014, 33, 153–164. [Google Scholar] [CrossRef] [Green Version]
  33. Lin, H.T.-H.; Yang, C.-K.; Lin, C.-C.; Wu, A.M.-H.; Wang, L.A.; Huang, N.-T. A Large-Area Nanoplasmonic Sensor Fabricated by Rapid Thermal Annealing Treatment for Label-Free and Multi-Point Immunoglobulin Sensing. Nanomaterials 2017, 7, 100. [Google Scholar] [CrossRef] [Green Version]
  34. Adegoke, O.; Morita, M.; Kato, T.; Ito, M.; Suzuki, T.; Park, E.Y. Localized surface plasmon resonance-mediated fluorescence signals in plasmonic nanoparticle-quantum dot hybrids for ultrasensitive Zika virus RNA detection via hairpin hybridization assays. Biosens. Bioelectron. 2017, 94, 513–522. [Google Scholar] [CrossRef]
  35. Gupta, A.K.; Hsu, C.-H.; Purwidyantri, A.; Prabowo, B.A.; Chiu, K.-P.; Chen, C.-H.; Tian, Y.-C.; Lai, C.-S. ZnO-Nanorod processed PC-SET as the light-harvesting model for plasmontronic fluorescence Sensor. Sens. Actuators B Chem. 2020, 307, 127597. [Google Scholar] [CrossRef]
  36. Su, S.; Sun, Q.; Gu, X.; Xu, Y.; Shen, J.; Zhu, D.; Chao, J.; Fan, C.; Wang, L. Two-dimensional nanomaterials for biosensing applications. TrAC Trends Anal. Chem. 2019, 119, 115610. [Google Scholar] [CrossRef]
  37. Wang, G.; Wang, Y.; Chen, L.; Choo, J. Nanomaterial-assisted aptamers for optical sensing. Biosens. Bioelectron. 2010, 25, 1859–1868. [Google Scholar] [CrossRef] [PubMed]
  38. Prabowo, B.A.; Purwidyantri, A.; Liu, B.; Lai, H.C.; Liu, K.C. Gold nanoparticle-assisted plasmonic enhancement for DNA detection on a graphene-based portable surface plasmon resonance sensor. Nanotechnology 2021, 32, 095503. [Google Scholar] [CrossRef] [PubMed]
  39. Rossi, G.; Real-Fernández, F.; Panza, F.; Barbetti, F.; Pratesi, F.; Rovero, P.; Migliorini, P. Biosensor analysis of anti-citrullinated protein/peptide antibody affinity. Anal. Biochem. 2014, 465C, 96–101. [Google Scholar] [CrossRef]
  40. Gopinath, S.C.B. Biosensing applications of surface plasmon resonance-based Biacore technology. Sens. Actuators B 2010, 150, 722–733. [Google Scholar] [CrossRef]
  41. Guner, H.; Ozgur, E.; Kokturk, G.; Celik, M.; Esen, E.; Topal, A.E.; Ayas, S.; Uludag, Y.; Elbuken, C.; Dana, A. A smartphone based surface plasmon resonance imaging (SPRi) platform for on-site biodetection. Sens. Actuators B Chem. 2017, 239, 571–577. [Google Scholar] [CrossRef]
  42. Wuytens, P.C.; Skirtach, A.G.; Baets, R. On-chip surface-enhanced Raman spectroscopy using nanosphere-lithography patterned antennas on silicon nitride waveguides. Opt. Express 2017, 25, 12926–12934. [Google Scholar] [CrossRef] [PubMed] [Green Version]
  43. Anker, J.N.; Hall, W.P.; Lyandres, O.; Shah, N.C.; Zhao, J.; Van Duyne, R.P. Biosensing with plasmonic nanosensors. Nat. Mater. 2008, 7, 442–453. [Google Scholar] [CrossRef]
  44. Zheng, Z.; Cong, S.; Gong, W.; Xuan, J.; Li, G.; Lu, W.; Geng, F.; Zhao, Z. Semiconductor SERS enhancement enabled by oxygen incorporation. Nat. Commun. 2017, 8, 1993. [Google Scholar] [CrossRef] [PubMed] [Green Version]
  45. Purwidyantri, A.; Hsu, C.-H.H.; Yang, C.-M.M.; Prabowo, B.A.; Tian, Y.-C.C.; Lai, C.-S.S. Plasmonic nanomaterial structuring for SERS enhancement. RSC Adv. 2019, 9, 4982–4992. [Google Scholar] [CrossRef] [Green Version]
  46. Köker, T.; Tang, N.; Tian, C.; Zhang, W.; Wang, X.; Martel, R.; Pinaud, F. Cellular imaging by targeted assembly of hot-spot SERS and photoacoustic nanoprobes using split-fluorescent protein scaffolds. Nat. Commun. 2018, 9, 607. [Google Scholar] [CrossRef]
  47. Gong, T.; Cui, Y.; Goh, D.; Voon, K.K.; Shum, P.P.; Humbert, G.; Auguste, J.L.; Dinh, X.Q.; Yong, K.T.; Olivo, M. Highly sensitive SERS detection and quantification of sialic acid on single cell using photonic-crystal fiber with gold nanoparticles. Biosens. Bioelectron. 2015, 64, 227–233. [Google Scholar] [CrossRef]
  48. Kang, M.; Park, S.-G.G.; Jeong, K.-H.H. Repeated Solid-state Dewetting of Thin Gold Films for Nanogap-rich Plasmonic Nanoislands. Sci. Rep. 2015, 5, 14790. [Google Scholar] [CrossRef] [PubMed]
  49. Kim, D.; Ko, Y.; Kwon, G.; Choo, Y.-M.; You, J. Low-cost, high-performance plasmonic nanocomposites for hazardous chemical detection using surface enhanced Raman scattering. Sens. Actuators B Chem. 2018, 274, 30–36. [Google Scholar] [CrossRef]
  50. Yang, S.; Dai, X.; Stogin, B.B.; Wong, T.-S. Ultrasensitive surface-enhanced Raman scattering detection in common fluids. Proc. Natl. Acad. Sci. USA 2015, 113, 268–273. [Google Scholar] [CrossRef] [Green Version]
  51. Zhang, Q.; Li, X.; Ma, Q.; Zhang, Q.; Bai, H.; Yi, W.; Liu, J.; Han, J.; Xi, G. A metallic molybdenum dioxide with high stability for surface enhanced Raman spectroscopy. Nat. Commun. 2017, 8, 14903. [Google Scholar] [CrossRef] [Green Version]
  52. Liu, N.; Xu, Z.; Morrin, A.; Luo, X. Low fouling strategies for electrochemical biosensors targeting disease biomarkers. Anal. Methods 2019, 11, 702–711. [Google Scholar] [CrossRef]
  53. Liu, B.; Liu, X.; Shi, S.; Huang, R.; Su, R.; Qi, W.; He, Z. Design and mechanisms of antifouling materials for surface plasmon resonance sensors. Acta Biomater. 2016, 40, 100–118. [Google Scholar] [CrossRef]
  54. Qian, H.; Huang, Y.; Duan, X.; Wei, X.; Fan, Y.; Gan, D.; Yue, S.; Cheng, W.; Chen, T. Fiber optic surface plasmon resonance biosensor for detection of PDGF-BB in serum based on self-assembled aptamer and antifouling peptide monolayer. Biosens. Bioelectron. 2019, 140, 111350. [Google Scholar] [CrossRef]
  55. Zhang, J.; Yuan, Y.; biXie, S.; Chai, Y.; Yuan, R. Amplified amperometric aptasensor for selective detection of protein using catalase-functional DNA-PtNPs dendrimer as a synergetic signal amplification label. Biosens. Bioelectron. 2014, 60, 224–230. [Google Scholar] [CrossRef]
  56. Park, J.-W.; Jin Lee, S.; Choi, E.-J.; Kim, J.; Song, J.-Y.; Bock Gu, M. An ultra-sensitive detection of a whole virus using dual aptamers developed by immobilization-free screening. Biosens. Bioelectron. 2014, 51, 324–329. [Google Scholar] [CrossRef]
  57. Chang, T.-C.; Wu, C.-C.; Wang, S.-C.; Chau, L.-K.; Hsieh, W.-H. Using a fiber optic particle plasmon resonance biosensor to determine kinetic constants of antigen-antibody binding reaction. Anal. Chem. 2013, 85, 245–250. [Google Scholar] [CrossRef] [PubMed]
  58. Ali, M.M.; Kang, D.-K.; Tsang, K.; Fu, M.; Karp, J.M.; Zhao, W. Cell-surface sensors: Lighting the cellular environment. Wiley Interdiscip. Rev. Nanomed. Nanobiotechnol. 2012, 4, 547–561. [Google Scholar] [CrossRef] [Green Version]
  59. Chen, Y.; Ren, R.; Pu, H.; Chang, J.; Mao, S.; Chen, J. Field-effect transistor biosensors with two-dimensional black phosphorus nanosheets. Biosens. Bioelectron. 2017, 89, 505–510. [Google Scholar] [CrossRef] [PubMed] [Green Version]
  60. Naylor, C.H.; Kybert, N.J.; Schneier, C.; Xi, J.; Romero, G.; Saven, G.; Liu, R.; Johnson, A.T.C. Scalable Production of Molybdenum Disul fi de Based Biosensors. ACS Nano 2016, 10, 6173–6179. [Google Scholar] [CrossRef] [Green Version]
  61. Gao, X.P.A.; Zheng, G.; Lieber, C.M. Subthreshold Regime has the Optimal Sensitivity for Nanowire FET Biosensors. Nano Lett. 2010, 10, 547–552. [Google Scholar] [CrossRef] [Green Version]
  62. Mao, S.; Chang, J.; Pu, H.; Lu, G.; He, Q.; Zhang, H.; Chen, J. Two-dimensional nanomaterial-based field-effect transistors for chemical and biological sensing. Chem. Soc. Rev. 2017, 46, 6872–6904. [Google Scholar] [CrossRef]
  63. Comini, E.; Baratto, C.; Faglia, G.; Ferroni, M.; Vomiero, A.; Sberveglieri, G. Quasi-one dimensional metal oxide semiconductors: Preparation, characterization and application as chemical sensors. Prog. Mater. Sci. 2009, 54, 1–67. [Google Scholar] [CrossRef]
  64. Ramnani, P.; Saucedo, N.M.; Mulchandani, A. Carbon nanomaterial-based electrochemical biosensors for label-free sensing of environmental pollutants. Chemosphere 2016, 143, 85–98. [Google Scholar] [CrossRef] [PubMed] [Green Version]
  65. Afsahi, S.; Lerner, M.B.; Goldstein, J.M.; Lee, J.; Tang, X.; Bagarozzi, D.A.; Pan, D.; Locascio, L.; Walker, A.; Barron, F.; et al. Novel graphene-based biosensor for early detection of Zika virus infection. Biosens. Bioelectron. 2018, 100, 85–88. [Google Scholar] [CrossRef]
  66. Xu, G.; Abbott, J.; Qin, L.; Yeung, K.Y.M.; Song, Y.; Yoon, H.; Kong, J.; Ham, D. Electrophoretic and field-effect graphene for all-electrical DNA array technology. Nat. Commun. 2014, 5, 4866. [Google Scholar] [CrossRef] [PubMed] [Green Version]
  67. Mao, S.; Lu, G.; Yu, K.; Bo, Z.; Chen, J. Specific protein detection using thermally reduced graphene oxide sheet decorated with gold nanoparticle-antibody conjugates. Adv. Mater. 2010, 22, 3521–3526. [Google Scholar] [CrossRef] [PubMed]
  68. Purwidyantri, A.; Domingues, T.; Guerreiro, J.R.; Ipatov, A.; Abreu, C.M.; Martins, M.; Alpuim, P.; Prado, M. Influence of the Electrolyte Salt Concentration on DNA Detection with Graphene Transistors. Biosensors 2021, 11, 24. [Google Scholar] [CrossRef] [PubMed]
  69. Sarkar, D.; Liu, W.; Xie, X.; Anselmo, A.C.; Mitragotri, S.; Banerjee, K. MoS2 field-effect transistor for next-generation label-free biosensors. ACS Nano 2014, 8, 3992–4003. [Google Scholar] [CrossRef] [PubMed]
  70. Lee, D.-W.; Lee, J.; Sohn, I.Y.; Kim, B.-Y.; Son, Y.M.; Bark, H.; Jung, J.; Choi, M.; Kim, T.H.; Lee, C.; et al. Field-effect transistor with a chemically synthesized MoS2 sensing channel for label-free and highly sensitive electrical detection of DNA hybridization. Nano Res. 2015, 8, 2340–2350. [Google Scholar] [CrossRef]
  71. Wang, H.; Sun, J.; Lu, L.; Yang, X.; Xia, J.; Zhang, F.; Wang, Z. Competitive electrochemical aptasensor based on a cDNA-ferrocene/MXene probe for detection of breast cancer marker Mucin1. Anal. Chim. Acta 2020, 1094, 18–25. [Google Scholar] [CrossRef]
  72. Lim, J.H.; Park, J.; Ahn, J.H.; Jin, H.J.; Hong, S.; Park, T.H. A peptide receptor-based bioelectronic nose for the real-time determination of seafood quality. Biosens. Bioelectron. 2013, 39, 244–249. [Google Scholar] [CrossRef]
  73. Lee, D.; Cui, T. Low-cost, transparent, and flexible single-walled carbon nanotube nanocomposite based ion-sensitive field-effect transistors for pH/glucose sensing. Biosens. Bioelectron. 2010, 25, 2259–2264. [Google Scholar] [CrossRef]
  74. Park, S.J.; Song, H.S.; Kwon, O.S.; Chung, J.H.; Lee, S.H.; An, J.H. Human dopamine receptor nanovesicles for gate-potential modulators in high-performance field-effect transistor biosensors. Sci. Rep. 2014, 4, 4342. [Google Scholar] [CrossRef] [PubMed]
  75. Jun, J.; Lee, J.S.; Shin, D.H.; Jang, J. Aptamer-Functionalized Hybrid Carbon Nano fi ber FET-Type Electrode for a Highly Sensitive and Selective Platelet-Derived Growth Factor Biosensor. Appl. Mater. Interface 2014, 6, 13859–13865. [Google Scholar] [CrossRef]
  76. Chen, P.; Shu, X.; Cao, H.; Sugden, K. High-sensitivity and large-dynamic-range refractive index sensors employing weak composite Fabry-Perot cavities. Opt. Lett. 2017, 42, 3145–3148. [Google Scholar] [CrossRef]
  77. Prabowo, B.A.; Hermida, I.D.P.; Manurung, R.V.; Purwidyantri, A.; Liu, K.-C. Nano-film aluminum-gold for ultra-high dynamic-range surface plasmon resonance chemical sensor. Front. Optoelectron. 2019, 12, 286–295. [Google Scholar] [CrossRef]
  78. Chou, Y.N.; Sun, F.; Hung, H.C.; Jain, P.; Sinclair, A.; Zhang, P.; Bai, T.; Chang, Y.; Wen, T.C.; Yu, Q.; et al. Ultra-low fouling and high antibody loading zwitterionic hydrogel coatings for sensing and detection in complex media. Acta Biomater. 2016, 40, 31–37. [Google Scholar] [CrossRef] [PubMed] [Green Version]
  79. Singha, S.S.; Mondal, S.; Bhattacharya, T.S.; Das, L.; Sen, K.; Satpati, B.; Das, K.; Singha, A. Au nanoparticles functionalized 3D-MoS2 nanoflower: An efficient SERS matrix for biomolecule sensing. Biosens. Bioelectron. 2018, 119, 10–17. [Google Scholar] [CrossRef] [PubMed]
  80. Purwidyantri, A.; Chen, C.; Chen, L.; Chen, C.; Luo, J.; Chiou, C.; Tian, Y.; Lin, C. Speckled ZnO Nanograss Electrochemical Sensor for Staphylococcus epidermidis Detection. J. Electrochem. Soc. 2017, 164, B205–B211. [Google Scholar] [CrossRef]
  81. Prabowo, B.A. The Trade-Off Performance of Surface Plasmon Resonance Sensing Utilizing Thin Layer Oxide under the Metal Layer. In Proceedings of the 2019 International Conference on Radar, Antenna, Microwave, Electronics, and Telecommunications (ICRAMET), Serpong, Indonesia, 23–24 October 2019. [Google Scholar]
  82. Fernandes, E.; Sobrino, T.; Martins, V.C.; Lopez-loureiro, I.; Campos, F.; Germano, J.; Rodríguez-Pérez, M.; Cardoso, S.; Petrovykh, D.Y.; Castillo, J.; et al. Point-of-care quantification of serum cellular fibronectin levels for stratification of ischemic stroke patients. Nanomed. Nanotechnol. Biol. Med. 2020, 30, 102287. [Google Scholar] [CrossRef] [PubMed]
  83. Kamat, V.; Rafique, A. Designing binding kinetic assay on the bio-layer interferometry (BLI) biosensor to characterize antibody-antigen interactions. Anal. Biochem. 2017, 536, 16–31. [Google Scholar] [CrossRef]
  84. Sharma, S.; Byrne, H.; O’Kennedy, R.J. Antibodies and antibody-derived analytical biosensors. Essays Biochem. 2016, 60, 9–18. [Google Scholar] [CrossRef] [PubMed]
  85. Long, G.L.; Winefordner, J.D. Limit of Detection a Closer Look at the IUPAC Definition. Anal. Chem. 1983, 55, 712A–724A. [Google Scholar] [CrossRef]
  86. Currie, L.A. Nomenclature in evaluation of analytical methods including detection and quantification capabilities. Adapted from the International Union of Pure and Applied Chemistry (IUPAC) document “Nomenclature in Evaluation of Analytical Methods including Detection. Anal. Chim. Acta 1999, 391, 105–126. [Google Scholar] [CrossRef]
  87. Stroot, J.M.; Leach, K.M.; Stroot, P.G.; Lim, D.V. Capture antibody targeted fluorescence in situ hybridization (CAT-FISH): Dual labeling allows for increased specificity in complex samples. J. Microbiol. Methods 2012, 88, 275–284. [Google Scholar] [CrossRef] [PubMed]
  88. Duman, M.; Piskin, E. Detection of Mycobacterium tuberculosis complex and Mycobacterium gordonae on the same portable surface plasmon resonance sensor. Biosens. Bioelectron. 2010, 26, 908–912. [Google Scholar] [CrossRef] [PubMed]
  89. Chauhan, D.; Nirbhaya, V.; Srivastava, C.M.; Chandra, R.; Kumar, S. Nanostructured transition metal chalcogenide embedded on reduced graphene oxide based highly efficient biosensor for cardiovascular disease detection. Microchem. J. 2020, 155, 104697. [Google Scholar] [CrossRef]
  90. Deng, K.; Xiang, Y.; Zhang, L.; Chen, Q.; Fu, W. An aptamer-based biosensing platform for highly sensitive detection of platelet-derived growth factor via enzyme-mediated direct electrochemistry. Anal. Chim. Acta 2013, 759, 61–65. [Google Scholar] [CrossRef]
  91. Xie, B.P.; Qiu, G.H.; Hu, P.P.; Liang, Z.; Liang, Y.M.; Sun, B.; Bai, L.P.; Jiang, Z.H.; Chen, J.X. Simultaneous detection of Dengue and Zika virus RNA sequences with a three-dimensional Cu-based zwitterionic metal–organic framework, comparison of single and synchronous fluorescence analysis. Sens. Actuators B Chem. 2018, 254, 1133–1140. [Google Scholar] [CrossRef]
  92. Sin, M.-C.; Chen, S.-H.; Chang, Y. Hemocompatibility of zwitterionic interfaces and membranes. Polym. J. 2014, 46, 436–443. [Google Scholar] [CrossRef]
  93. Chen, H.; Zhang, M.; Yang, J.; Zhao, C.; Hu, R.; Chen, Q.; Chang, Y.; Zheng, J. Synthesis and characterization of antifouling poly(N-acryloylaminoethoxyethanol) with ultralow protein adsorption and cell attachment. Langmuir 2014, 30, 10398–10409. [Google Scholar] [CrossRef]
  94. Riedel, T.; Rodriguez-Emmenegger, C.; de los Santos Pereira, A.; Bědajánková, A.; Jinoch, P.; Boltovets, P.M.; Brynda, E. Diagnosis of Epstein-Barr virus infection in clinical serum samples by an SPR biosensor assay. Biosens. Bioelectron. 2014, 55, 278–284. [Google Scholar] [CrossRef]
  95. Špringer, T.; Homola, J. Biofunctionalized gold nanoparticles for SPR-biosensor-based detection of CEA in blood plasma. Anal. Bioanal. Chem. 2012, 404, 2869–2875. [Google Scholar] [CrossRef]
  96. Liu, G.; Gurung, A.S.; Qiu, W. Lateral flow aptasensor for simultaneous detection of platelet-derived growth factor-BB (PDGF-BB) and thrombin. Molecules 2019, 24, 756. [Google Scholar] [CrossRef] [PubMed] [Green Version]
  97. Chen, J.; Kong, L.; Sun, X.; Feng, J.; Chen, Z.; Fan, D.; Wei, Q. Ultrasensitive photoelectrochemical immunosensor of cardiac troponin I detection based on dual inhibition effect of Ag@Cu2O core-shell submicron-particles on CdS QDs sensitized TiO2 nanosheets. Biosens. Bioelectron. 2018, 117, 340–346. [Google Scholar] [CrossRef]
  98. Averseng, O.; Hagège, A.; Taran, F.; Vidaud, C. Surface plasmon resonance for rapid screening of uranyl affine proteins. Anal. Chem. 2010, 82, 9797–9802. [Google Scholar] [CrossRef] [PubMed]
  99. Bartlett, J.W.; Frost, C. Reliability, repeatability and reproducibility: Analysis of measurement errors in continuous variables. Ultrasound Obstet. Gynecol. 2008, 31, 466–475. [Google Scholar] [CrossRef]
  100. Cipriani, V.; Lorés-Motta, L.; He, F.; Fathalla, D.; Tilakaratna, V.; McHarg, S.; Bayatti, N.; Acar, İ.E.; Hoyng, C.B.; Fauser, S.; et al. Increased circulating levels of Factor H-Related Protein 4 are strongly associated with age-related macular degeneration. Nat. Commun. 2020, 11, 778. [Google Scholar] [CrossRef] [PubMed] [Green Version]
  101. Gu, X.; Trujillo, M.J.; Olson, J.E.; Camden, J.P. SERS Sensors: Recent Developments and a Generalized Classification Scheme Based on the Signal Origin. Annu. Rev. Anal. Chem. 2018, 11, 147–169. [Google Scholar] [CrossRef]
  102. Prabowo, B.A.; Chang, Y.-F.F.; Lai, H.-C.C.; Alom, A.; Pal, P.; Lee, Y.-Y.Y.; Chiu, N.-F.F.; Hatanaka, K.; Su, L.-C.C.; Liu, K.-C.C. Rapid screening of Mycobacterium tuberculosis complex (MTBC) in clinical samples by a modular portable biosensor. Sens. Actuators B Chem. 2018, 254, 742–748. [Google Scholar] [CrossRef]
  103. Prabowo, B.A.; Wang, R.Y.L.L.; Secario, M.K.; Ou, P.-T.T.; Alom, A.; Liu, J.-J.J.; Liu, K.-C.C. Rapid detection and quantification of Enterovirus 71 by a portable surface plasmon resonance biosensor. Biosens. Bioelectron. 2017, 92, 186–191. [Google Scholar] [CrossRef]
  104. Chen, H.; Wang, X. Study on the performance promotion of the surface plasmon resonance analytical system. Instrum. Sci. Technol. 2012, 40, 226–237. [Google Scholar] [CrossRef]
  105. Wang, X.; Dong, L.; Zhan, S. Without-baseline centroid algorithm for surface plasmon resonance spectra. Chin. J. Sens. Actuators 2012, 25, 365–369. [Google Scholar] [CrossRef]
  106. Dong, L.; Yin, W.; Ma, W.; Zhang, L.; Jia, S. High-sensitivity, large dynamic range, auto-calibration methane optical sensor using a short confocal Fabry-Perot cavity. Sens. Actuators B Chem. 2007, 127, 350–357. [Google Scholar] [CrossRef]
  107. Atkinson, A.J.; Colburn, W.A.; DeGruttola, V.G.; DeMets, D.L.; Downing, G.J.; Hoth, D.F.; Oates, J.A.; Peck, C.C.; Schooley, R.T.; Spilker, B.A.; et al. Biomarkers and surrogate endpoints: Preferred definitions and conceptual framework. Clin. Pharmacol. Ther. 2001, 69, 89–95. [Google Scholar] [CrossRef]
  108. Strimbu, K.; Tavel, J.A. What are biomarkers? Curr. Opin. HIV AIDS 2010, 5, 463–466. [Google Scholar] [CrossRef] [PubMed]
  109. Moroncini, G.; Cuccioloni, M.; Mozzicafreddo, M.; Pozniak, K.N.; Grieco, A.; Paolini, C.; Tonnini, C.; Spadoni, T.; Svegliati, S.; Funaro, A.; et al. Characterization of binding and quantification of human autoantibodies to PDGFRα using a biosensor-based approach. Anal. Biochem. 2017, 528, 26–33. [Google Scholar] [CrossRef] [Green Version]
  110. Yakhno, T.; Sanin, A.; Pelyushenko, A.; Kazakov, V.; Shaposhnikova, O.; Chernov, A.; Yakhno, V.; Vacca, C.; Falcione, F.; Johnson, B. Uncoated quartz resonator as a universal biosensor. Biosens. Bioelectron. 2007, 22, 2127–2131. [Google Scholar] [CrossRef] [Green Version]
  111. Babaki, M.K.Z.; Soleimanpour, S.; Rezaee, S.A. Antigen 85 complex as a powerful Mycobacterium tuberculosis immunogene: Biology, immune-pathogenicity, applications in diagnosis, and vaccine design. Microb. Pathog. 2017, 112, 20–29. [Google Scholar] [CrossRef]
  112. Rodríguez, J.A.; Sobrino, T.; Orbe, J.; Purroy, A.; Martínez-Vila, E.; Castillo, J.; Páramo, J.A. Prometalloproteinase-10 is associated with brain damage and clinical outcome in acute ischemic stroke. J. Thromb. Haemost. 2013, 11, 1464–1473. [Google Scholar] [CrossRef]
  113. Saberian-Borujeni, M.; Johari-Ahar, M.; Hamzeiy, H.; Barar, J.; Omidi, Y. Nanoscaled aptasensors for multi-analyte sensing. BioImpacts 2014, 4, 205–215. [Google Scholar] [CrossRef]
  114. Sefah, K.; Phillips, J.A.; Xiong, X.; Meng, L.; Van Simaeys, D.; Chen, H.; Martin, J.; Tan, W. Nucleic acid aptamers for biosensors and bio-analytical applications. Analyst 2009, 134, 1765–1775. [Google Scholar] [CrossRef] [PubMed]
  115. Oyejide, L.; Mendes, O.R.; Mikaelian, I. Molecular Pathology: Applications in Nonclinical Drug Development. In A Comprehensive Guide to Toxicology in Nonclinical Drug Development; Elsevier Inc.: Amsterdam, The Netherlands, 2017; pp. 407–445. ISBN 9780128036204. [Google Scholar] [CrossRef]
  116. Lee, E.Y.; Kulkarni, R.P. Circulating biomarkers predictive of tumor response to cancer immunotherapy. Expert Rev. Mol. Diagn. 2019, 19, 895–904. [Google Scholar] [CrossRef] [Green Version]
  117. Rodríguez-Yáñez, M.; Sobrino, T.; Arias, S.; Vázquez-Herrero, F.; Brea, D.; Blanco, M.; Leira, R.; Castellanos, M.; Serena, J.; Vivancos, J.; et al. Early biomarkers of clinical-diffusion mismatch in acute ischemic stroke. Stroke 2011, 42, 2813–2818. [Google Scholar] [CrossRef] [Green Version]
  118. Shaqdan, K.; Aran, S.; Thrall, J.; Abujudeh, H. Incidence of contrast medium extravasation for CT and MRI in a large academic medical centre: A report on 502,391 injections. Clin. Radiol. 2014, 69, 1264–1272. [Google Scholar] [CrossRef]
  119. Seher, A.; Nicke, J.; Mueller, T.D.; Kneitz, S.; Gebhardt, S.; Vehn, T.M.T.; Schlunck, G.; Sebald, W. Gene expression profiling of connective tissue growth factor (CTGF) stimulated primary human tenon fibroblasts reveals an inflammatory and wound healing response in vitro. Mol. Vis. 2011, 17, 53–62. [Google Scholar] [PubMed]
  120. Green, N.S.; Norton, M.L. Interactions of DNA with graphene and sensing applications of graphene field-effect transistor devices: A review. Anal. Chim. Acta 2015, 853, 127–142. [Google Scholar] [CrossRef]
  121. Yu, Y.; Su, G.; Zhu, H.; Zhu, Q.; Chen, Y.; Xu, B.; Li, Y.; Zhang, W. Proximity hybridization-mediated isothermal exponential amplification for ultrasensitive electrochemical protein detection. Int. J. Nanomed. 2017, 12, 5903–5914. [Google Scholar] [CrossRef] [Green Version]
  122. Razmi, N.; Baradaran, B.; Hejazi, M.; Hasanzadeh, M.; Mosafer, J.; Mokhtarzadeh, A.; de la Guardia, M. Recent advances on aptamer-based biosensors to detection of platelet-derived growth factor. Biosens. Bioelectron. 2018, 113, 58–71. [Google Scholar] [CrossRef] [PubMed]
  123. Hong, L.; Zhou, F.; Shi, D.; Zhang, X.; Wang, G. Portable aptamer biosensor of platelet-derived growth factor-BB using a personal glucose meter with triply amplified. Biosens. Bioelectron. 2017, 95, 152–159. [Google Scholar] [CrossRef]
  124. Sameiyan, E.; Bagheri, E.; Ramezani, M.; Alibolandi, M.; Abnous, K.; Taghdisi, S.M. DNA origami-based aptasensors. Biosens. Bioelectron. 2019, 143, 111662. [Google Scholar] [CrossRef]
  125. Bagheri, E.; Abnous, K.; Alibolandi, M.; Ramezani, M.; Taghdisi, S.M. Triple-helix molecular switch-based aptasensors and DNA sensors. Biosens. Bioelectron. 2018, 111, 1–9. [Google Scholar] [CrossRef]
  126. Rifai, N.; Gillette, M.A.; Carr, S.A. Protein biomarker discovery and validation: The long and uncertain path to clinical utility. Nat. Biotechnol. 2006, 24, 971–983. [Google Scholar] [CrossRef]
  127. Gilgunn, S.; Conroy, P.J.; Saldova, R.; Rudd, P.M.; O’Kennedy, R.J. Aberrant PSA glycosylation—A sweet predictor of prostate cancer. Nat. Rev. Urol. 2013, 10, 99–107. [Google Scholar] [CrossRef] [PubMed]
  128. Tzouvadaki, I.; Jolly, P.; Lu, X.; Ingebrandt, S.; De Micheli, G.; Estrela, P.; Carrara, S. Label-free ultrasensitive memristive aptasensor. Nano Lett. 2016, 16, 4472–4476. [Google Scholar] [CrossRef] [Green Version]
  129. Yang, K.; Hu, Y.; Dong, N.; Zhu, G.; Zhu, T.; Jiang, N. A novel SERS-based magnetic aptasensor for prostate specific antigen assay with high sensitivity. Biosens. Bioelectron. 2017, 94, 286–291. [Google Scholar] [CrossRef] [PubMed]
  130. Su, L.; Zou, L.; Fong, C.C.; Wong, W.L.; Wei, F.; Wong, K.Y.; Wu, R.S.S.; Yang, M. Detection of cancer biomarkers by piezoelectric biosensor using PZT ceramic resonator as the transducer. Biosens. Bioelectron. 2013, 46, 155–161. [Google Scholar] [CrossRef]
  131. Su, L.-C.; Chen, R.-C.; Li, Y.-C.; Chang, Y.-F.; Lee, Y.-J.; Lee, C.-C.; Chou, C. Detection of prostate-specific antigen with a paired surface plasma wave biosensor. Anal. Chem. 2010, 82, 3714–3718. [Google Scholar] [CrossRef]
  132. Cao, C.; Kim, J.P.; Kim, B.W.; Chae, H.; Yoon, H.C.; Yang, S.S.; Sim, S.J. A strategy for sensitivity and specificity enhancements in prostate specific antigen-alpha(1)-antichymotrypsin detection based on surface plasmon resonance. Biosens. Bioelectron. 2006, 21, 2106–2113. [Google Scholar] [CrossRef] [PubMed]
  133. Sisinni, L.; Landriscina, M. The Role of Human Chorionic Gonadotropin as Tumor Marker: Biochemical and Clinical Aspects. Adv. Exp. Med. Biol. 2015, 867, 229–244. [Google Scholar] [CrossRef] [Green Version]
  134. Liu, D.; Wu, F.; Zhou, C.; Shen, H.; Yuan, H.; Du, Z.; Ma, L.; Li, L.S. Multiplexed immunoassay biosensor for the detection of serum biomarkers - β-HCG and AFP of Down Syndrome based on photoluminescent water-soluble CdSe/ZnS quantum dots. Sens. Actuators B Chem. 2013, 186, 235–243. [Google Scholar] [CrossRef]
  135. Matsui, H.; Iitsuka, Y.; Yamazawa, K.; Tanaka, N.; Mitsuhashi, A.; Seki, K.; Sekiya, S. Criteria for Initiating Chemotherapy in Patients after Evacuation of Hydatidiform Mole. Tumor Biol. 2003, 24, 140–146. [Google Scholar] [CrossRef] [PubMed]
  136. Lei, H.; Wang, K.; Ji, X.; Cui, D. Contactless measurement of magnetic nanoparticles on lateral flow strips using tunneling magnetoresistance (TMR) sensors in differential configuration. Sensors (Switzerland) 2016, 16, 2130. [Google Scholar] [CrossRef] [Green Version]
  137. Khodadadi, M.; Chang, L.; Trabuco, J.R.C.; Vu, B.V.; Kourentzi, K.; Willson, R.C.; Litvinov, D. PCB-based magnetometer as a platform for quantification of lateral-flow assays. Sensors (Switzerland) 2019, 19, 5433. [Google Scholar] [CrossRef] [Green Version]
  138. Yan, W.; Wang, K.; Xu, H.; Huo, X.; Jin, Q.; Cui, D. Machine Learning Approach to Enhance the Performance of MNP-Labeled Lateral Flow Immunoassay. Nano-Micro Lett. 2019, 11, 7. [Google Scholar] [CrossRef] [Green Version]
  139. Špringer, T.; Piliarik, M.; Homola, J. Real-time monitoring of biomolecular interactions in blood plasma using a surface plasmon resonance biosensor. Anal. Bioanal. Chem. 2010, 398, 1955–1961. [Google Scholar] [CrossRef] [PubMed]
  140. Chang, C.C.; Chen, C.P.; Lee, C.H.; Chen, C.Y.; Lin, C.W. Colorimetric detection of human chorionic gonadotropin using catalytic gold nanoparticles and a peptide aptamer. Chem. Commun. 2014, 50, 14443–14446. [Google Scholar] [CrossRef] [Green Version]
  141. Chung, N.N.; Hamlin, R.E.; Zwang, T.J.; Johal, M.S. Human chorionic gonadotropin interactions with immobilized anti-hCG studied by quartz-crystal microbalance with dissipation monitoring. J. Biomed. Mater. Res. -Part A 2012, 100A, 1600–1604. [Google Scholar] [CrossRef] [PubMed]
  142. Liao, L.-W.; Chen, P.-H.; Wang, Y.-L. Electrical Double Layer Gated Field Effect Transistor Biosensors for the Quantitative Detection of Beta-Human Chorionic Gonadotropin. ECS Trans. 2019, 92, 57–60. [Google Scholar] [CrossRef]
  143. Wu, A.H.B.; Agee, S.J.; Lu, Q.A.; Todd, J.; Jaffe, A.S. Specificity of a High-Sensitivity Cardiac Troponin I Assay Using Single-Molecule–Counting Technology. Clin. Chem. 2009, 55, 196–198. [Google Scholar] [CrossRef]
  144. Kavsak, P.A.; Wang, X.; Ko, D.T.; MacRae, A.R.; Jaffe, A.S. Short- and long-term risk stratification using a next-generation, high-sensitivity research cardiac troponin I (hs-cTnI) assay in an Emergency Department Chest Pain Population. Clin. Chem. 2009, 55, 1809–1815. [Google Scholar] [CrossRef]
  145. Liu, J.; Chen, D.; Wang, P.; Song, G.; Zhang, X.; Li, Z.; Wang, Y.; Wang, J.; Yang, J. A microfabricated thickness shear mode electroacoustic resonator for the label-free detection of cardiac troponin in serum. Talanta 2020, 215, 120890. [Google Scholar] [CrossRef]
  146. Patra, A.; Ding, T.; Hong, M.; Richards, A.M.; Wong, T.I.; Zhou, X.; Drum, C.L. Using extraordinary optical transmission to quantify cardiac biomarkers in human serum. J. Vis. Exp. 2017, 2017, 55597. [Google Scholar] [CrossRef] [PubMed]
  147. Krupin, O.; Berini, P. Long-range surface plasmon-polariton waveguide biosensors for human cardiac troponin I detection. Sensors (Switzerland) 2019, 19, 631. [Google Scholar] [CrossRef] [Green Version]
  148. Han, X.; Shokri Kojori, H.; Leblanc, R.M.; Kim, S.J. Ultrasensitive Plasmonic Biosensors for Real-Time Parallel Detection of Alpha-L-Fucosidase and Cardiac-Troponin-I in Whole Human Blood. Anal. Chem. 2018, 90, 7795–7799. [Google Scholar] [CrossRef]
  149. Wu, Q.; Sun, Y.; Zhang, D.; Li, S.; Zhang, Y.; Ma, P.; Yu, Y.; Wang, X.; Song, D. Ultrasensitive magnetic field-assisted surface plasmon resonance immunoassay for human cardiac troponin I. Biosens. Bioelectron. 2017, 96, 288–293. [Google Scholar] [CrossRef] [PubMed]
  150. Liyanage, T.; Sangha, A.; Sardar, R. Achieving biosensing at attomolar concentrations of cardiac troponin T in human biofluids by developing a label-free nanoplasmonic analytical assay. Analyst 2017, 142, 2442–2450. [Google Scholar] [CrossRef] [PubMed] [Green Version]
  151. Wu, Q.; Li, S.; Sun, Y.; Wang, J. Hollow gold nanoparticle-enhanced SPR based sandwich immunoassay for human cardiac troponin I. Microchim. Acta 2017, 184, 2395–2402. [Google Scholar] [CrossRef]
  152. Sarangadharan, I.; Wang, S.-L.; Sukesan, R.; Chen, P.-C.; Dai, T.-Y.; Pulikkathodi, A.K.; Hsu, C.-P.; Chiang, H.-H.K.; Liu, L.Y.-M.; Wang, Y.-L. Single Drop Whole Blood Diagnostics: Portable Biomedical Sensor for Cardiac Troponin i Detection. Anal. Chem. 2018, 90, 2867–2874. [Google Scholar] [CrossRef]
  153. Sarangadharan, I.; Regmi, A.; Chen, Y.-W.; Hsu, C.-P.; Chen, P.-C.; Chang, W.-H.; Lee, G.-Y.; Chyi, J.-I.; Shiesh, S.-C.; Lee, G.-B.; et al. High sensitivity cardiac troponin I detection in physiological environment using AlGaN/GaN High Electron Mobility Transistor (HEMT) Biosensors. Biosens. Bioelectron. 2018, 100, 282–289. [Google Scholar] [CrossRef] [PubMed]
  154. Sarangadharan, I.; Wang, S.-L.; Sukesan, R.; Tai, T.-Y.; Pulikkathodi, A.K.; Hsu, C.-P.; Wang, Y.-L. Whole blood cvd diagnostics using portable fet biosensor system. ECS Trans. 2018, 85, 25–35. [Google Scholar] [CrossRef]
  155. Huang, S.W.; Sarangadharan, I.; Chen, P.H.; Kuo, W.C.; Wang, Y.L. Study of stability and sensitivity of cardiac troponin I based on FET sensor. ECS Trans. 2019, 89, 57–63. [Google Scholar] [CrossRef]
  156. Cai, B.; Huang, L.; Zhang, H.; Sun, Z.; Zhang, Z.; Zhang, G.J. Gold nanoparticles-decorated graphene field-effect transistor biosensor for femtomolar MicroRNA detection. Biosens. Bioelectron. 2015, 74, 329–334. [Google Scholar] [CrossRef] [PubMed]
  157. Duffy, M.J. Biomarkers for prostate cancer: Prostate-specific antigen and beyond. Clin. Chem. Lab. Med. 2020, 58, 326–339. [Google Scholar] [CrossRef] [Green Version]
  158. Afrǎsânie, V.A.; Marinca, M.V.; Alexa-Stratulat, T.; Gafton, B.; Pǎduraru, M.; Adavidoaiei, A.M.; Miron, L.; Rusu, C. KRAS, NRAS, BRAF, HER2 and microsatellite instability in metastatic colorectal cancer-practical implications for the clinician. Radiol. Oncol. 2019, 53, 265–274. [Google Scholar] [CrossRef] [PubMed] [Green Version]
  159. Muinao, T.; Deka Boruah, H.P.; Pal, M. Multi-biomarker panel signature as the key to diagnosis of ovarian cancer. Heliyon 2019, 5, e02826. [Google Scholar] [CrossRef] [Green Version]
  160. Katchman, B.A.; Smith, J.T.; Obahiagbon, U.; Kesiraju, S.; Lee, Y.-K.; O’Brien, B.; Kaftanoglu, K.; Christen, J.B.; Anderson, K.S. Application of flat panel OLED display technology for the point-of-care detection of circulating cancer biomarkers. Sci. Rep. 2016, 6, 29057. [Google Scholar] [CrossRef] [PubMed] [Green Version]
  161. Qureshi, A.; Niazi, J.H.; Kallempudi, S.; Gurbuz, Y. Label-free capacitive biosensor for sensitive detection of multiple biomarkers using gold interdigitated capacitor arrays. Biosens. Bioelectron. 2010, 25, 2318–2323. [Google Scholar] [CrossRef]
  162. Radha Shanmugam, N.; Muthukumar, S.; Chaudhry, S.; Anguiano, J.; Prasad, S. Ultrasensitive nanostructure sensor arrays on flexible substrates for multiplexed and simultaneous electrochemical detection of a panel of cardiac biomarkers. Biosens. Bioelectron. 2017, 89, 764–772. [Google Scholar] [CrossRef]
  163. Issadore, D.; Chung, J.; Shao, H.; Liong, M.; Ghazani, A.A.; Castro, C.M.; Weissleder, R.; Lee, H. Ultrasensitive clinical enumeration of rare cells ex vivo using a micro-hall detector. Sci. Transl. Med. 2012, 4, 141ra92. [Google Scholar] [CrossRef] [Green Version]
  164. Ewald, M.; Fechner, P.; Gauglitz, G. A multi-analyte biosensor for the simultaneous label-free detection of pathogens and biomarkers in point-of-need animal testing. Anal. Bioanal. Chem. 2020, 407, 4005–4013. [Google Scholar] [CrossRef]
  165. Fountoglou, N.; Petropoulou, M.; Iliadi, A.; Christopoulos, T.K.; Ioannou, P.C. Two-panel molecular testing for genetic predisposition for thrombosis using multi-allele visual biosensors. Anal. Bioanal. Chem. 2016, 408, 1943–1952. [Google Scholar] [CrossRef] [PubMed]
  166. Lee, J.U.; Nguyen, A.H.; Sim, S.J. A nanoplasmonic biosensor for label-free multiplex detection of cancer biomarkers. Biosens. Bioelectron. 2015, 74, 341–346. [Google Scholar] [CrossRef] [PubMed]
  167. Jiang, Y.; Shi, M.; Liu, Y.; Wan, S.; Cui, C.; Zhang, L.; Tan, W. Aptamer/AuNP Biosensor for Colorimetric Profiling of Exosomal Proteins. Angew. Chem. -Int. Ed. 2017, 56, 11916–11920. [Google Scholar] [CrossRef] [PubMed]
  168. Wang, Y.Y.; Yuan, W.; Zhang, Q.; Wang, Y.Y.; Kimber, M.; Dong, L.; Lu, M. Exosome microarray based on label-free imaging biosensor. In Proceedings of the IEEE Sensors; IEEE: Montreal, QC, Canada, 2019; pp. 1–4. [Google Scholar] [CrossRef]
  169. Panneer Selvam, A.; Prasad, S. Companion and Point-of-Care Sensor System for Rapid Multiplexed Detection of a Panel of Infectious Disease Markers. SLAS Technol. Transl. Life Sci. Innov. 2017, 22, 338–347. [Google Scholar] [CrossRef] [Green Version]
  170. Yokus, M.A.; Songkakul, T.; Pozdin, V.A.; Bozkurt, A.; Daniele, M.A. Wearable multiplexed biosensor system toward continuous monitoring of metabolites. Biosens. Bioelectron. 2020, 153, 112038. [Google Scholar] [CrossRef]
  171. Felder, M.; Kapur, A.; Gonzalez-Bosquet, J.; Horibata, S.; Heintz, J.; Albrecht, R.; Fass, L.; Kaur, J.; Hu, K.; Shojaei, H.; et al. MUC16 (CA125): Tumor biomarker to cancer therapy, a work in progress. Mol. Cancer 2014, 13, 129. [Google Scholar] [CrossRef] [Green Version]
  172. Skates, S.J.; Xu, F.-J.; Yu, Y.-H.; Sjövall, K.; Einhorn, N.; Chang, Y.; Bast, R.C.; Knapp, R.C. Toward an optimal algorithm for ovarian cancer screening with longitudinal tumor markers. Cancer 1995, 76, 2004–2010. [Google Scholar] [CrossRef]
  173. Fakanya, W.M.; Tothill, I.E. Detection of the inflammation biomarker C-reactive protein in serum samples: Towards an optimal biosensor formula. Biosensors 2014, 4, 340–357. [Google Scholar] [CrossRef] [PubMed] [Green Version]
  174. Ling, W. C-reactive protein levels in the early stage of COVID-19. Médecine Mal. Infect. 2020, 50, 332–334. [Google Scholar] [CrossRef]
  175. World Health Organization. C-Reactive Protein Concentrations as a Marker of Inflammation or Infection for Interpreting Biomarkers of Micronutrient Status. Available online: http://apps.who.int/iris/bitstream/10665/133708/1/WHO_ NMH_NHD_EPG_14.7_eng.pdf?ua=1 (accessed on 8 October 2021).
  176. Rodríguez-Yáñez, M.; Blanco, M.; Sobrino, T.; Arias-Rivas, S.; Castillo, J. Update on the research of serum biomarkers to assess stroke. Drugs Future 2012, 37, 283. [Google Scholar] [CrossRef]
  177. Jickling, G.C.; Sharp, F.R. Blood Biomarkers of Ischemic Stroke. Neurotherapeutics 2011, 8, 349–360. [Google Scholar] [CrossRef] [Green Version]
  178. Maestrini, I.; Ducroquet, A.; Moulin, S.; Leys, D.; Cordonnier, C.; Bordet, R. Blood biomarkers in the early stage of cerebral ischemia. Rev. Neurol. (Paris) 2016, 172, 198–219. [Google Scholar] [CrossRef] [PubMed]
  179. Rodríguez-González, R.; Blanco, M.; Rodríguez-Yáñez, M.; Moldes, O.; Castillo, J.; Sobrino, T. Platelet derived growth factor-CC isoform is associated with hemorrhagic transformation in ischemic stroke patients treated with tissue plasminogen activator. Atherosclerosis 2013, 226, 165–171. [Google Scholar] [CrossRef] [PubMed]
  180. Rodríguez-González, R.; Sobrino, T.; Rodríguez-Yáñez, M.; Millán, M.; Brea, D.; Miranda, E.; Moldes, O.; Pérez, J.; Lomas, D.A.; Leira, R.; et al. Association between neuroserpin and molecular markers of brain damage in patients with acute ischemic stroke. J. Transl. Med. 2011, 9, 58. [Google Scholar] [CrossRef] [Green Version]
  181. Foerch, C.; Wunderlich, M.T.; Dvorak, F.; Humpich, M.; Kahles, T.; Goertler, M.; Alvarez-Sabín, J.; Wallesch, C.W.; Molina, C.A.; Steinmetz, H.; et al. Elevated serum S100B levels indicate a higher risk of hemorrhagic transformation after thrombolytic therapy in acute stroke. Stroke 2007, 38, 2491–2495. [Google Scholar] [CrossRef] [Green Version]
  182. Wood, B.A.; O’Halloran, K.P.; VandeWoude, S. Development and validation of a multiplex microsphere-based assay for detection of domestic cat (Felis catus) cytokines. Clin. Vaccine Immunol. 2011, 18, 387–392. [Google Scholar] [CrossRef] [PubMed] [Green Version]
Figure 1. The general concept of an MR-based biosensor for the detection of MNP-labeled biomarkers with (A) the current in plane (CIP) of the electrical measurement and (B) the current perpendicular to plane (CPP). (C) The typical real-time response curve of the biomarker binding on the MR-based biosensor.
Chemosensors 09 00299 g001
Figure 2. (A) A typical FET-based biosensor that utilizes the gate as a sensing layer. The biorecognition elements and biomarkers are in the medium solution, while the gate voltage is supplied from an electrode in contact with the medium. (B) The shifting of the threshold voltage (VTH) characteristics in the presence of charge accumulation from biomolecular adsorption in the sensing area.
Chemosensors 09 00299 g002
Figure 3. (A) Typical QCM electrodes. (B) Schematic circuit of a QCM with a frequency supply in the range from kHz to MHz (top). A frequency drop indicates the loaded electrode during the QCM measurement (bottom). The real-time measurement strategy in a QCM monitors the resonance frequency shifting (inset).
Chemosensors 09 00299 g003
Figure 4. (A) SPR sensor configuration using a prism coupler and thin metal film for the sensing layer. (B) LSPR sensor using a nanodisc array. Signal acquisition of SPR sensor performed using (C) intensity modulation and (D) angular or wavelength interrogation. (C,D) are reprinted from [29] under the Creative Commons Attribution (CC BY) license.
Chemosensors 09 00299 g004aChemosensors 09 00299 g004b
Figure 5. (A) Illustration of SERS-based biosensors using Rhodamine 6G (R6G) as the biomolecule label on the sensing structure with a gold nanosphere array. (B) The energy band diagram and electron transition illustration of SERS-based biosensors.
Chemosensors 09 00299 g005
Figure 6. The illustration of sensitivity performance in biosensors.
Chemosensors 09 00299 g006
Figure 7. (A) The illustrated dynamic range in a biosensor standard curve with the dose–response fitting curve. (B) Linear dynamic range.
Chemosensors 09 00299 g007
Figure 8. The basic concept for determination of the LOD in a fitting curve of the biosensor response.
Chemosensors 09 00299 g008
Figure 9. The illustration of the standard curve fitting for the specificity test in biosensors.
Chemosensors 09 00299 g009
Figure 10. Illustration of the accuracy and precision concepts in the biosensor repeatability and its representation in the standard curve.
Chemosensors 09 00299 g010
Figure 11. The clinical cutoff level of the biomarker to determine the physiological state of the patient. (TN: true negative; TP: true positive; FN: false negative; FP: false positive).
Chemosensors 09 00299 g011
Figure 12. The main steps to be considered in the development of a diagnostic tool from biomarker selection, analysis of the biophysical properties, clinical cutoff overview, biosensor preferences, and detection strategy to data analysis.
Chemosensors 09 00299 g012
Table 1. Comparison features and characteristics of biosensor platforms.
Platform CategoryTransducing
Mechanism
Cost of
Equipment, Operation
ProsConsLabel-Free OptionReal-Time, Portability OptionsRef
MagnetoresistiveDetection of magnetic field fringe of MNPHigh, HighRobust, not sensitive to charge and temperature; tailored labelingRequired magnetic labelingNoYes, Yes[6,7,8,9,10,11,12]
FETDetection of sample chargeLow, LowMature technologyDifficulty in detecting neutral charge samples; noise from unstable chargeYesYes, Yes[13,14,15,16,19,20,21,22,23]
QCMDetection of mass coverageLow, LowHigh Q factorLow resolution, potential interference of operational frequencyYesYes, Yes[24,25,26,27,28]
SPRDetection of refractive indices shift or mass coverageHigh, LowHigh sensitivityTemperature-sensitiveYesYes, Yes[29,30,36,37,38,39,40,41]
LSPRDetection of refractive indices shift or mass coverageHigh, HighVery high sensitivityTemperature-sensitive, high-cost nanostructureYesYes, Yes[31,32,33,34,35]
SERSDetection of the energy transition at moleculesHigh, HighVery high sensitivityRequired label, high-cost nanostructureNoNo, No[42,43,44,45,46,47,48,49,50,51]
MNP: magnetic nanoparticles; FET: field effect transistor; QCM: quartz crystal microbalance; Q factor: quality factor; SPR: surface plasmon resonance; LSPR: localized surface plasmon resonance; SERS: surface-enhanced Raman spectroscopy.
Table 2. Summary of the dynamic range enhancement.
PlatformSampleTechnical RemarkDynamic RangeRef.
Dual cavity FPIN/aUtilizing weak composite1.359–1.452[76]
SPRSucrose waterAl/Au sensing structure1.33–1.45 RIU[77]
SPRAntibody loadingZwitterionic hydrogelAntibody capacity up to 693 ng/cm2[78]
SPRN/aTiO2/SiO21.7742–1.9542 RIU[81]
SERSBilirubinAu-MoS2 NFs10−12 to 10−4 M[79]
ElectrochemicalStaphylococcus epidermidisZnO Nanograss10−11–10−4 M[80]
MagnetoresistivecFnDilution MNP1–4 µg/mL[82]
Octet BiosensorHuman mAbVarying biorecognition concentration0.15–40 nM[83]
FPI: Fabry–Perot interferometer; SPR: surface plasmon resonance; SERS: surface-enhanced Raman spectroscopy; cFn: cellular fibronectin; RIU: refractive index unit; Au-MoS2 NFs: gold molybdenum disulfide nanoflowers; MNP: magnetic nanoparticles; mAb: monoclonal antibody.
Table 3. Summary of the specificity enhancement.
StrategyPlatformSampleTechnical RemarkPerformanceRef.
BlockingSPRssODNs of MTBC and M. gordonaeSpacer arms on probe-ssODNs, MCH for blocking and probe orientationRegenerative sensing, up to 12 weeks, RT storage[88]
BlockingElectrochemicalcTnInMo3Se4 embedded on rGO, BSA blockingLDR: 10−6–100 ng/mL; shelf life 35 days[89]
BlockingElectrochemicalPDGFGOD blocking,
P-Gra-GNPs
LOD 1.7 pM
LDR: 0.005–60 nM
[90]
Anti-fouling membraneFluorescenceDENV and ZIKV3D Cu- zwitterionic MOF, simultaneous detectionLOD (in pM):
192 (DENV)
332 (ZIKV)
[91]
Anti-fouling membraneSPRUndiluted human plasma and serum, mammalian cellspolyAAEE brushes on sensingUndetectable protein adsorption (<0.3 ng/cm2)[93]
Anti-fouling membraneSPREpstein-Barr virus in serumLabel-free, regenerative sensorDetection clinical samples in serum[94]
Sandwich assaySPRCEA in plasma bloodbio-AuNPsLOD: 0.1 ng/mL[95]
Sandwich assayLateral flowPDGF-BB and thrombinAu-labeled aptamer probeLOD (in nM): 1.0 (PDGF-BB) and 1.5 (thrombin)[96]
Sandwich assayPhotoelectrochemicalcTnIAg@Cu2O particles on CdS QDsLDR (in ng/mL): 2 × 10⁻⁵–50
LOD: 6.7 fg/mL,
[97]
mAbSPRUranyl affine proteinsTwo-step immunoassaysLOD: 7 nM[98]
SPR: surface plasmon resonance; ssODNs: single-strand oligodeoxynucleotides; MCH: 6-mercaptohexanol; RT: room temperature; cTnI: cardiac troponin I; nMo3Se4: nanostructured metal chalcogenide; rGO: reduced graphene oxide; BSA: bovine serum albumin; PDGF: platelet-derived growth factor; GOD: glucose oxidase; LDR: linear dynamic range; LOD: limit of detection; DENV: dengue virus; ZIKV: Zika virus; 3D Cu: three-dimensional copper, MOF: metal-organic framework; polyAAEE: polymerized acryloylaminoethoxyethanol; CEA: carcinoembryonic antigen; bio-AuNPs: biofunctionalized gold nanoparticles; Ag@Cu2O: silver coated copper oxide; CdS: cadmium sulfide; QDs: quantum dots; mAb: monoclonal antibody.
Table 4. Analytical performance of a biosensor.
Analytical PerformanceDefinitionSignificant FactorImprovement StrategyRef
SensitivityThe signal response in every target concentrationSNR, slopeDownscaling sensing area, sandwich assays, and use of labels (e.g., nanoparticles)[54,55,56,57,58,59,60,61,62,63]
Dynamic rangeThe ratio between the maximum and minimum usable indication of the signal responseLinear range, saturation levelSurface area enhancement, 3D sensing structure, label tailoring, antibodies affinity, concentration[35,76,77,78,79,80]
LODThe value expressed by the smallest concentration that can be detected with a reasonable certainty and confidence levelSensitivity, SD of referenceSensitivity improvement, SNR enhancement, signal stability, instrument calibrations, signal processing[10,54,55,56,57,58,59,60,61,62,63,98,99,100,101,102,103,104]
SpecificityThe sensing ability for capturing a specific target from the other substanceBiomarker preference, low-fouling bindingBlocking assays, advanced surface functionalization, dual-labeling, molecule affinity[88,89,90,91,92,93,94,95,96,97]
ReproducibilityThe accuracy and precision of the measurements by different users using identical samples and concentrationsSD, instrumentationInstrument configuration, signal processing, reduce the number of variables (e.g., operator interference)[10,100,101,102,103,104,105,106]
SNR: signal-to-noise ratio; 3D: three-dimensional; LOD: limit of detection; SD: standard deviation.
Table 5. List of biosensor studies utilizing single-biomarker detection strategy.
BiomarkerPlatformTechnical RemarkPerformanceRef.
16S rRNA gene S. aureusEGFET sensorDirect hybridization, Nanopatterned gold sensingLOD 1 pM[23]
ZIKV RNALSPR mediated fluorescenceHybrid probes NP-qDots-MBLOD 1.7–7.6 copies/mL[34]
DNAFETPNA probe, RGO sensingLOD 100 fM[156]
IS6110 DNA of
M. tuberculosis
SPRAmplified- and labeled-DNA by PCRLOD 63 pg/mL[102]
PSAFET nanowireOperated under the subthreshold regimeLOD 1.5 fM[61]
PSAMemristiveNanowire sensing, aptamer probeLOD 23 aM[128]
PSASERSMNP labeled aptamer probeLOD 5.0 pg/mL
Range: 5–500 pg/mL
[129]
PSAPiezoelectric resonatorDual-channel resonatorLOD: 0.25 ng/mL[130]
PSASPRPaired amplitude and phase degree of the heterodyne signalLOD (in aM): 300 (in buffer); 2000 (in serum)[131]
PSASPRSandwich antibodyLOD: 10.2 ng/ml (in buffer); 18.1 ng/mL (in serum)[132]
hCGGMRMNP-labeled25 mIU/mL[8]
hCGTMRMNP-labeled25 mIU/mL[136]
hCGMagnetometerHybrid to the lateral flow sensor10 pg/mL[137]
hCGMagnetometerHybrid to the lateral flow sensor0.014 mIU/mL[138]
hCGSPRSampling methodLOD: 10 ng/mL (in plasma blood)[139]
hCGColorimetric sensorLSPR colorimetric using AuNP-Aptamer probeLOD: 15 mIU/mL
LDR: up to 1000 mIU/mL
[140]
cTnPiezoelectric sensorZnO piezoelectric filmLOD: 20 pg/mL
LDR: 0.04 to 2 ng/mL
[145]
cTnLSPRNanoimprint lithography sensing0.55 ng/mL[146]
cTnLong Range SPRWaveguide mode SPR at λ=1310 nmLOD: 430 pg/mL (direct); 28 pg/mL (sandwich)[147]
cTnPlasmonic basedIGZO sensing, AuNP assisted LSPR.LOD: 0.1 ng/mL (in blood)[148]
cTnSPRMNP-labelled assisted SPRLOD: 1.25 ng/mL[149]
cTnLSPRAu triangular nanoprisms sensingLOD: 15 aM (in plasma blood)[150]
cTnSPRAuNP assisted amplification, sandwich.LOD: 38 ng/mL
LDR: 1.25–40 μg/mL
[151]
cTnFETSingle drop whole blood sample20 ng/mL[152]
cTnFETAlGaN/GaN HEMTLOD: 250 fM (in buffer)LDR: 0.006–148 ng/mL[153]
rRNA: ribosomal ribonucleic acid; FET: field effect transistor; EGFET: extended gate field effect transistor; ZIKV: Zika virus; RNA: ribonucleic acid; SPR: surface plasmon resonance; LSPR: localized surface plasmon resonance; NP-qDots-MB: nanoparticles-quantum dots-molecular beacon; DNA: deoxyribonucleic acid; PNA: peptide nucleic acid; RGO: reduced graphene oxide; PSA: prostate specific antigen; LOD: limit of detection; LDR: linear dynamic range; hCG: human chorionic gonadotropin; cTn: cardiac troponin; AuNP: gold nanoparticles; ZnO: zinc oxide; IGZO: indium gallium zinc oxide; AlGaN: aluminum gallium nitride; GaN: gallium nitride; HEMT: high-electron mobility transistor.
Table 6. Summary of biosensor studies for multiplex detection of biomarkers.
Disease DiagnosticBiomarkersPlatformTechnical RemarkPerformanceRef.
CardiovascularCRP; TNFα; IL6GID capacitor arraysCo-immobilized chip with equimolar mixtures of antibodiesLDR: 0.025–25 ng/ml[161]
CardiovascularcTnI; cTnTDisposable electrochemical sensorZnO vertical rod sensingLDR: 0.1–1 × 10⁵ pg/mL
LOD (in pg/mL): 1 (cTnI); 0.1 (cTnT)
[162]
CardiovascularPAPP-A; PCSK9; ST2GMR8×8 sensor arrayLDR: 0.04‒400 ng/mL[7]
CancerEpCAM; HER2;
EGFR; CTC
Micro-Hall detector2×4 sensor arrayLDR:10–105 cells[163]
CancerCD9; CD63; CD68; CD80; CD81; CD86;
I-A/I-E.
Photonic crystal12 channelsLDR: 2 × 10¹¹‒2 × 10⁹ particles/mL[168]
CancerAFP; CEA; PSALSPRBiomarkers detected in the human serum sampleLOD (in fM): 91 (AFP), 94 (CEA) and 10 (PSA)[166]
Cancer CD63;
EpCAM; PDGF; PSMA; PTK7
LSPR colorimetricAptamer probes on AuNPProfiling exosomal proteins in minutes[167]
Salmonella infectionCRP; anti-Salmonella (AS)1-lambda-reflectometryLabel-free, portable platformLDR (in ng/mL): 5.74–122.52 (AS); 1.26–29.56 (CRP)
LOD (in ng/mL): 2.21 (AS);
0.72 (CRP)
[164]
ThrombosisDNA sequences from H1299R; A1298C; V34L; 4G/5G polymorphismLSPR colorimetricPCR amplification, dipstick sensingAccuracy: 100% for 15 blind clinical samples[165]
SepsisPCT; LTA; LPSNanochannel electrochemicalDetection in the whole blood sampleLDR (in µg/mL): 0.0001‒10 (PCT); 1‒1000 (LPS and LTA)[169]
Physiological body fluidGlucose, lactate, pH, and temperature from sweatElectrochemicalWearable and wireless deviceSensitivity (in μA/mM·cm2) 26.31 (glucose); 1.49 (lactate); 54 mV/pH (pH); 0.002 °C−1 (temp.)[170]
CRP: C-reactive protein; TNFα: tumor necrosis factor-α; IL6: interleukin 6; GID: gold interdigitated electrodes; cTnI: cardiac troponin I; cTnT: cardiac troponin T; ZNO: zinc oxide; LDR: linear dynamic range; PAPP-A: pregnancy-associated plasma protein A; PCSK9: proprotein convertase subtilisin/kexin type 9; ST2: suppression of tumorigenicity 2; GMR: giant magnetoresistive; EpCAM: epithelial cell adhesion molecule; HER2: human epidermal growth factor receptor 2; EGFR: estimated glomerular filtration rate; CTC: circulated tumor cell; AFP: alpha-fetoprotein; CEA: carcinoembryonic antigen; PSA: prostate-specific antigen; PDGF: platelet-derived growth factor; PSMA: prostate-specific membrane antigen; PTK7: protein tyrosine kinase 7; AuNP: gold nanoparticles; DNA: deoxyribonucleic acid; PCR: polymerase chain reaction; PCT: procalcitonin; LTA: lipoteichoic acid; LPS: lipopolysaccharide.
Publisher’s Note: MDPI stays neutral with regard to jurisdictional claims in published maps and institutional affiliations.