
The Challenges of Developing Biosensors for Clinical Assessment: A Review


Abstract
1. Introduction
2. Biosensor Technologies
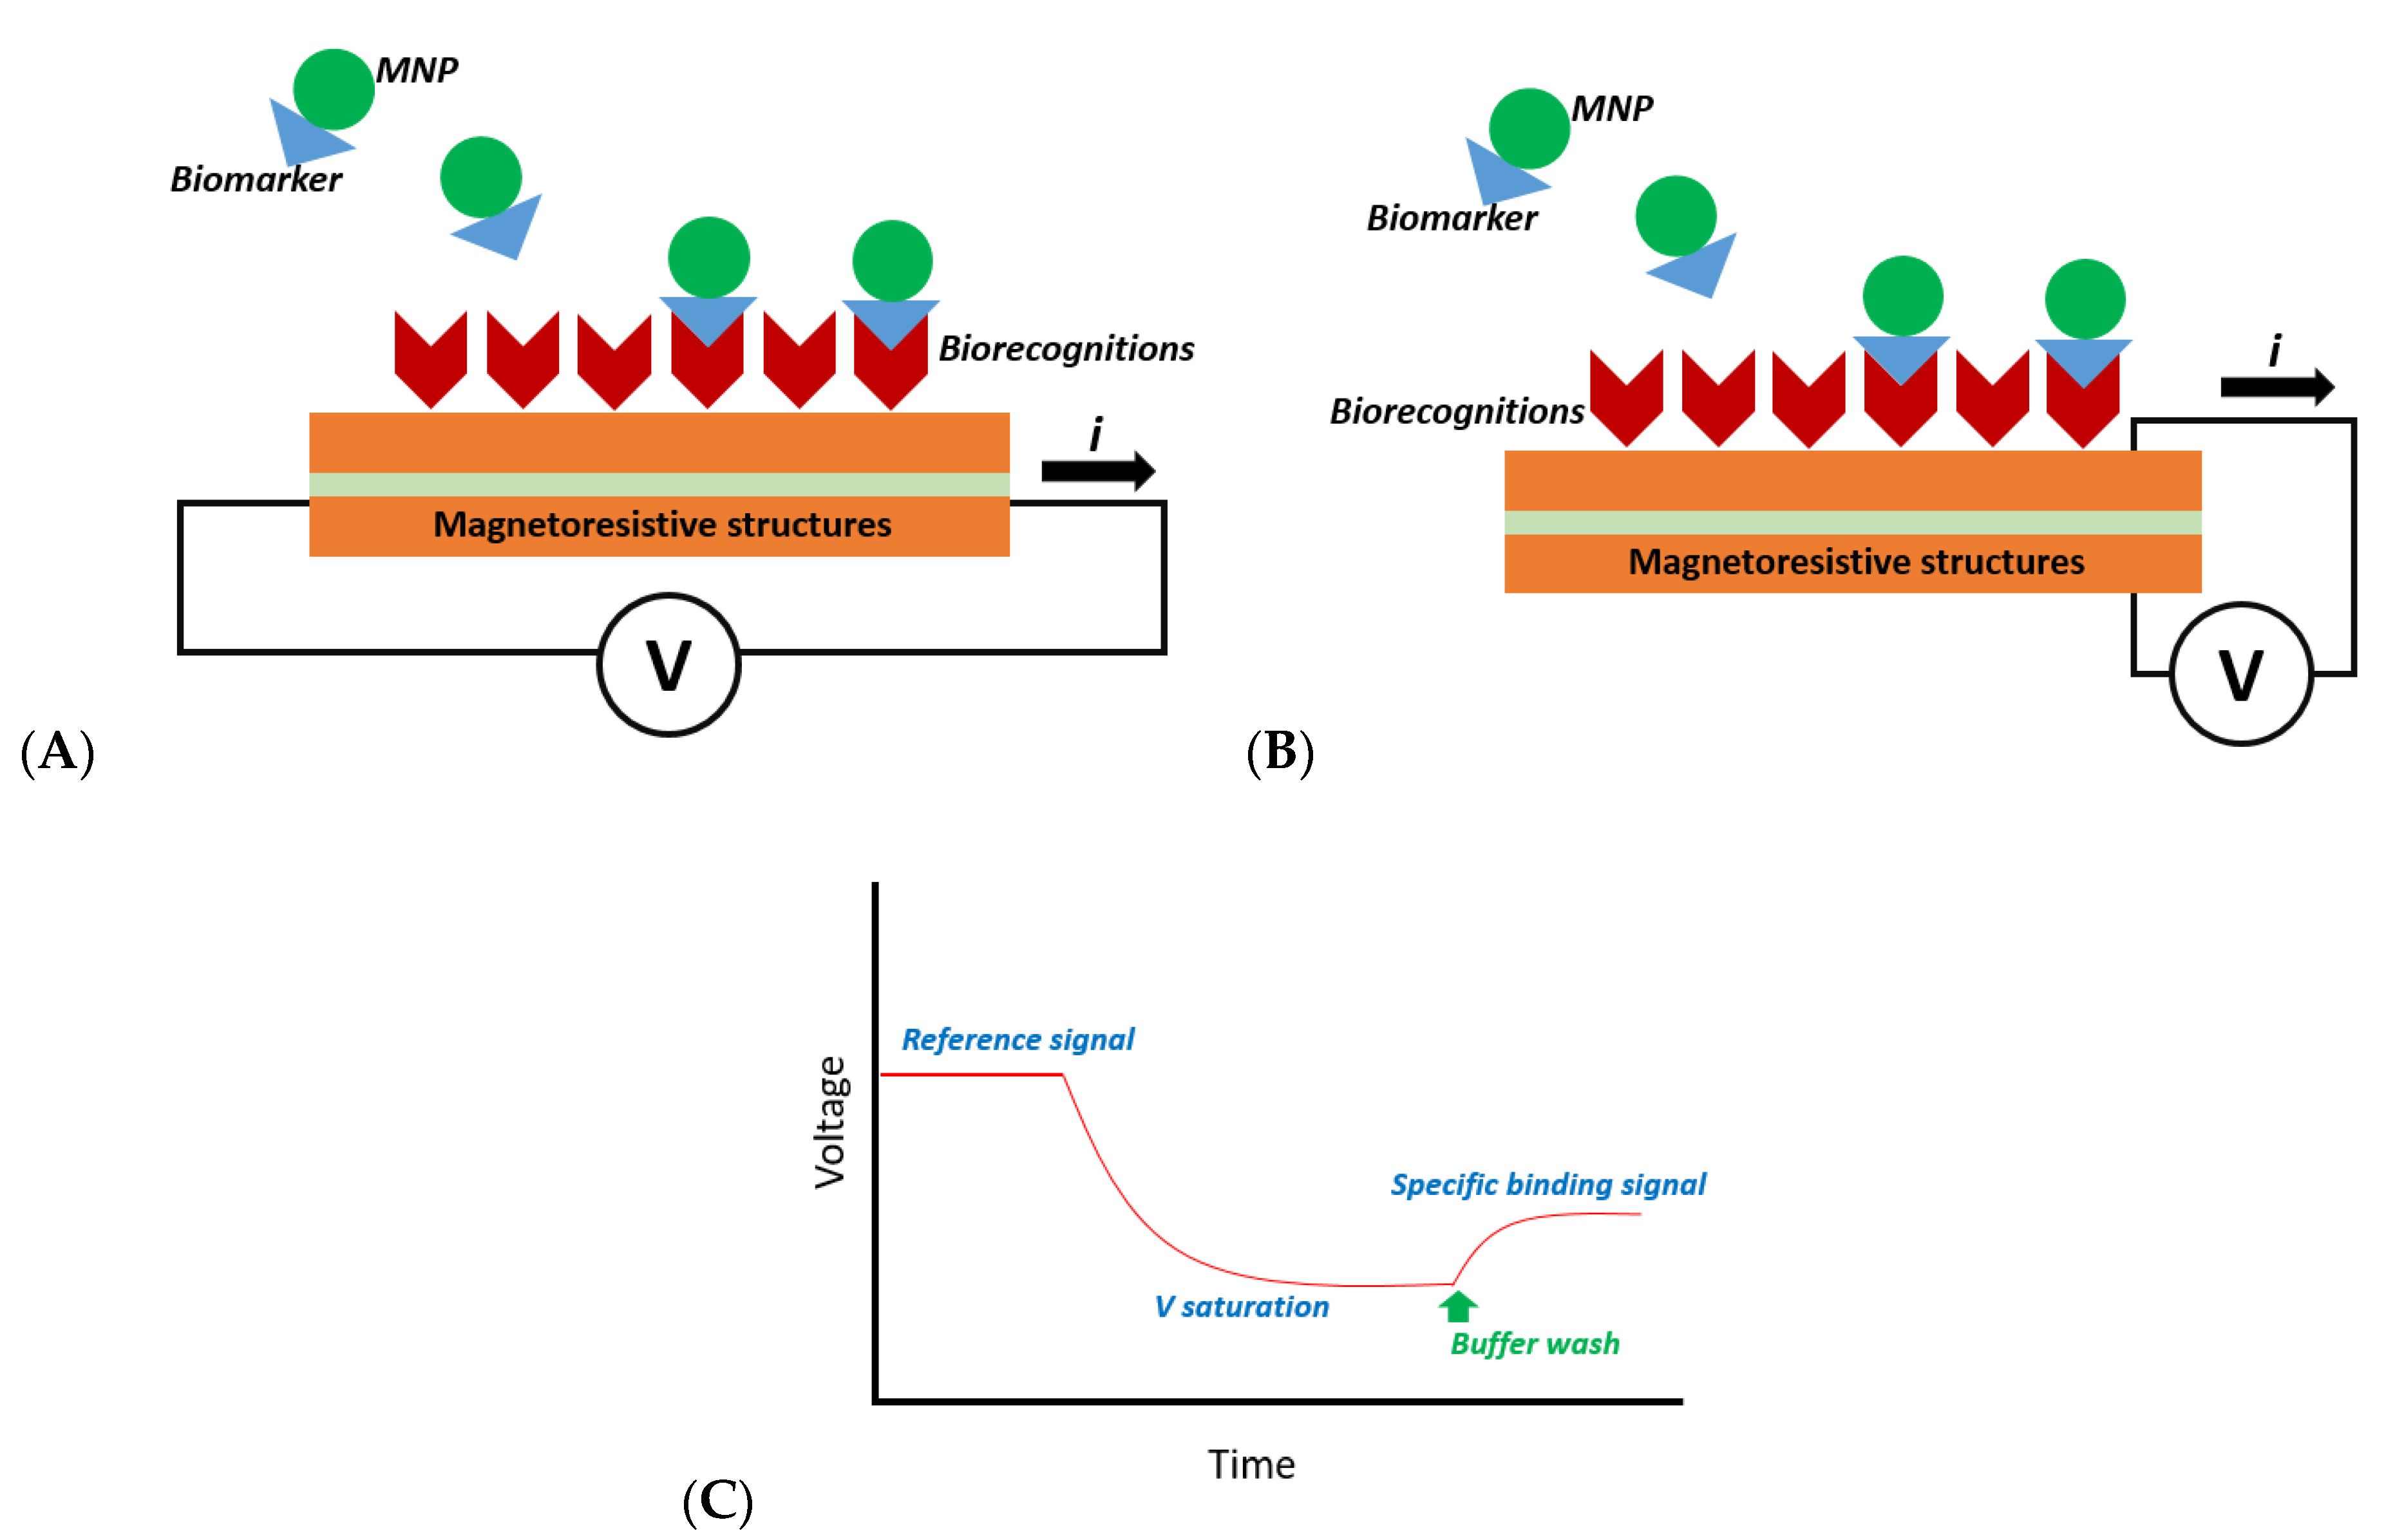
2.1. Magnetoresistive-Based Biosensors
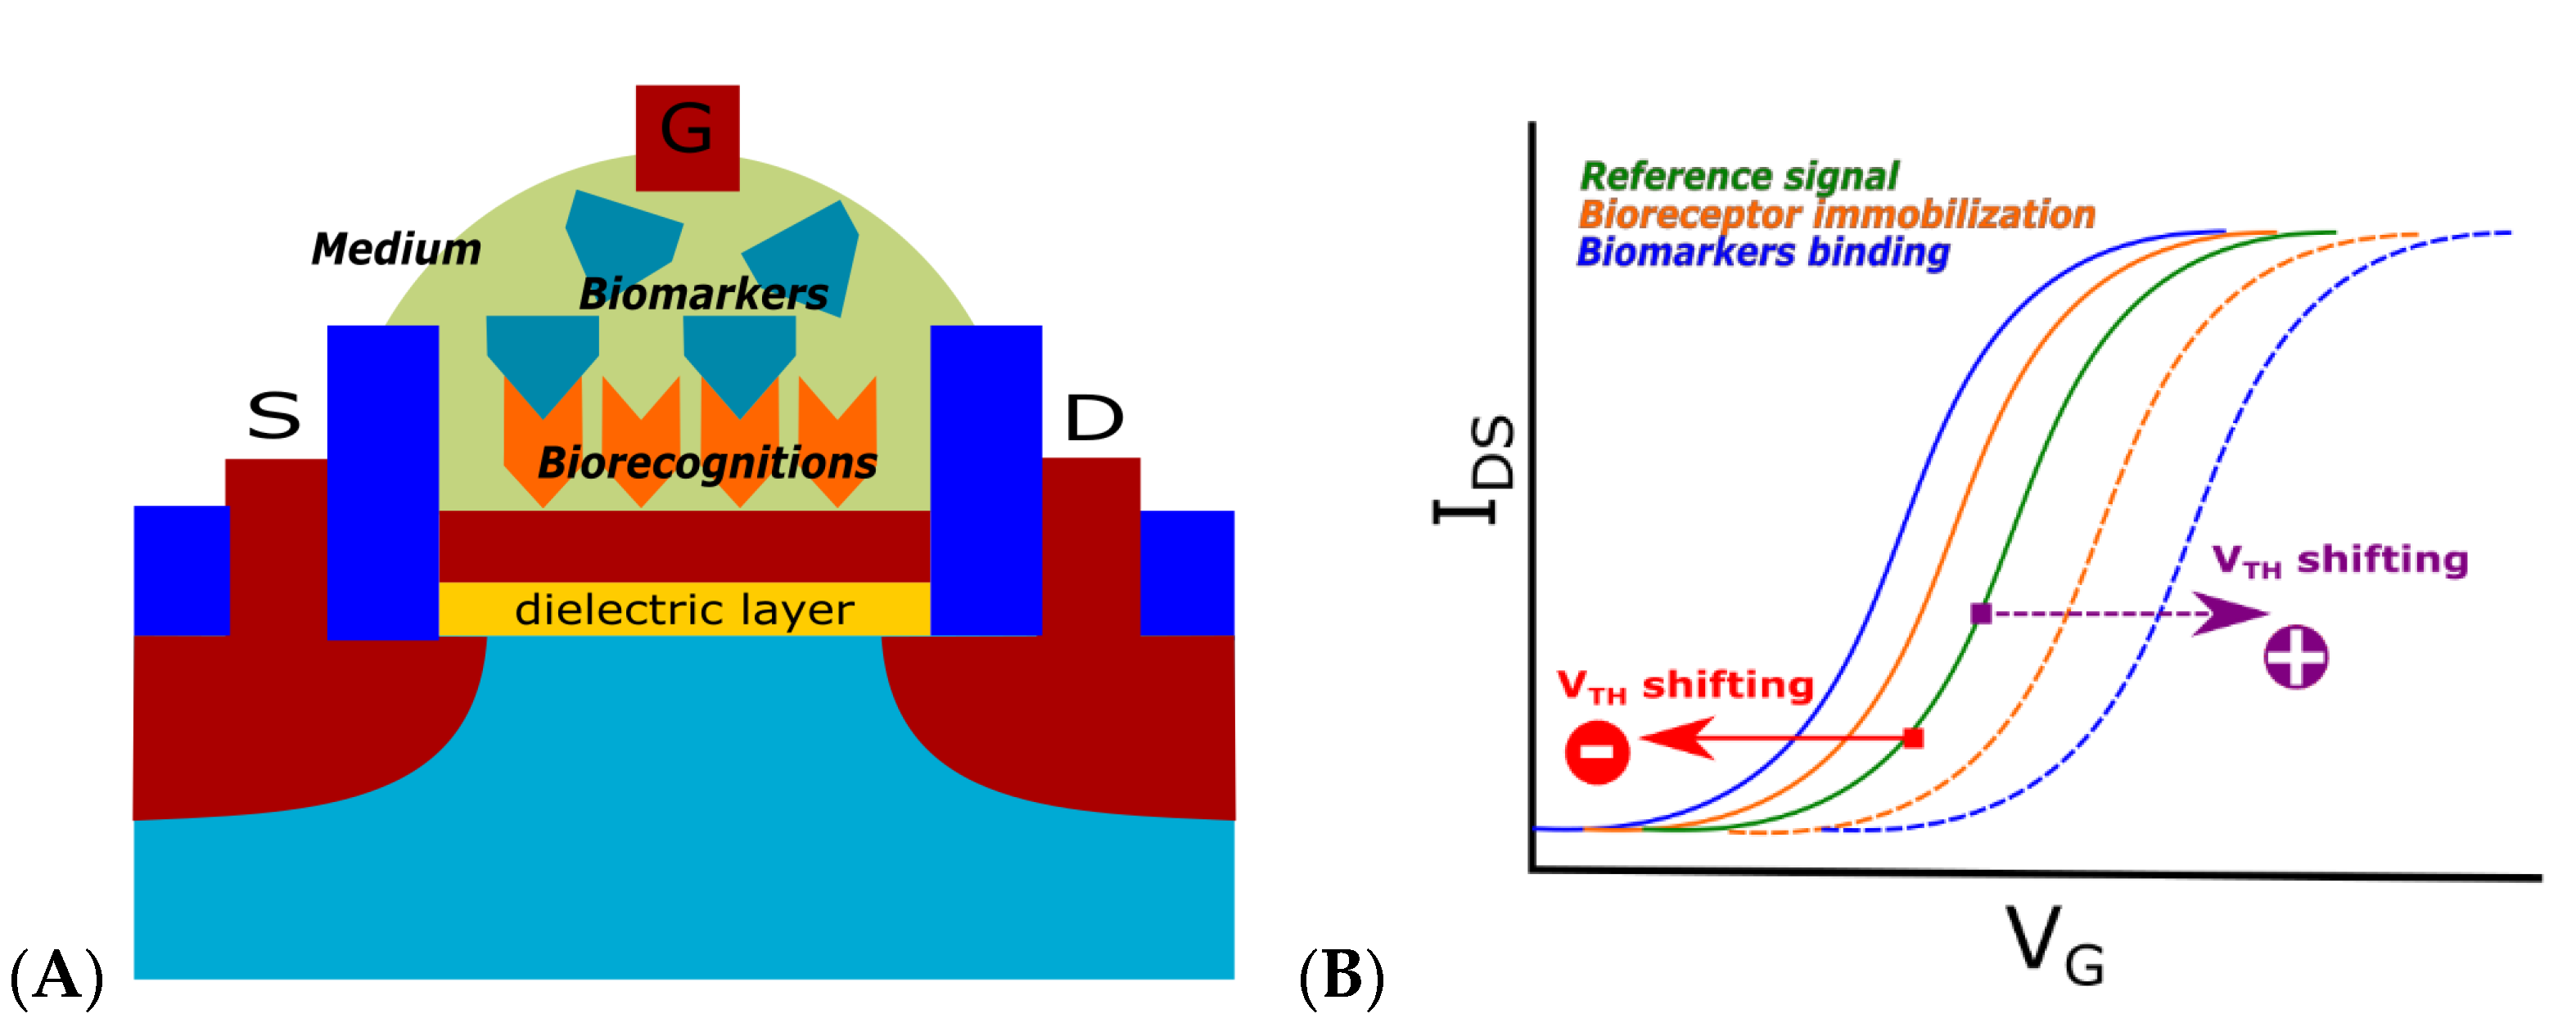
2.2. Transistor-Based Biosensors
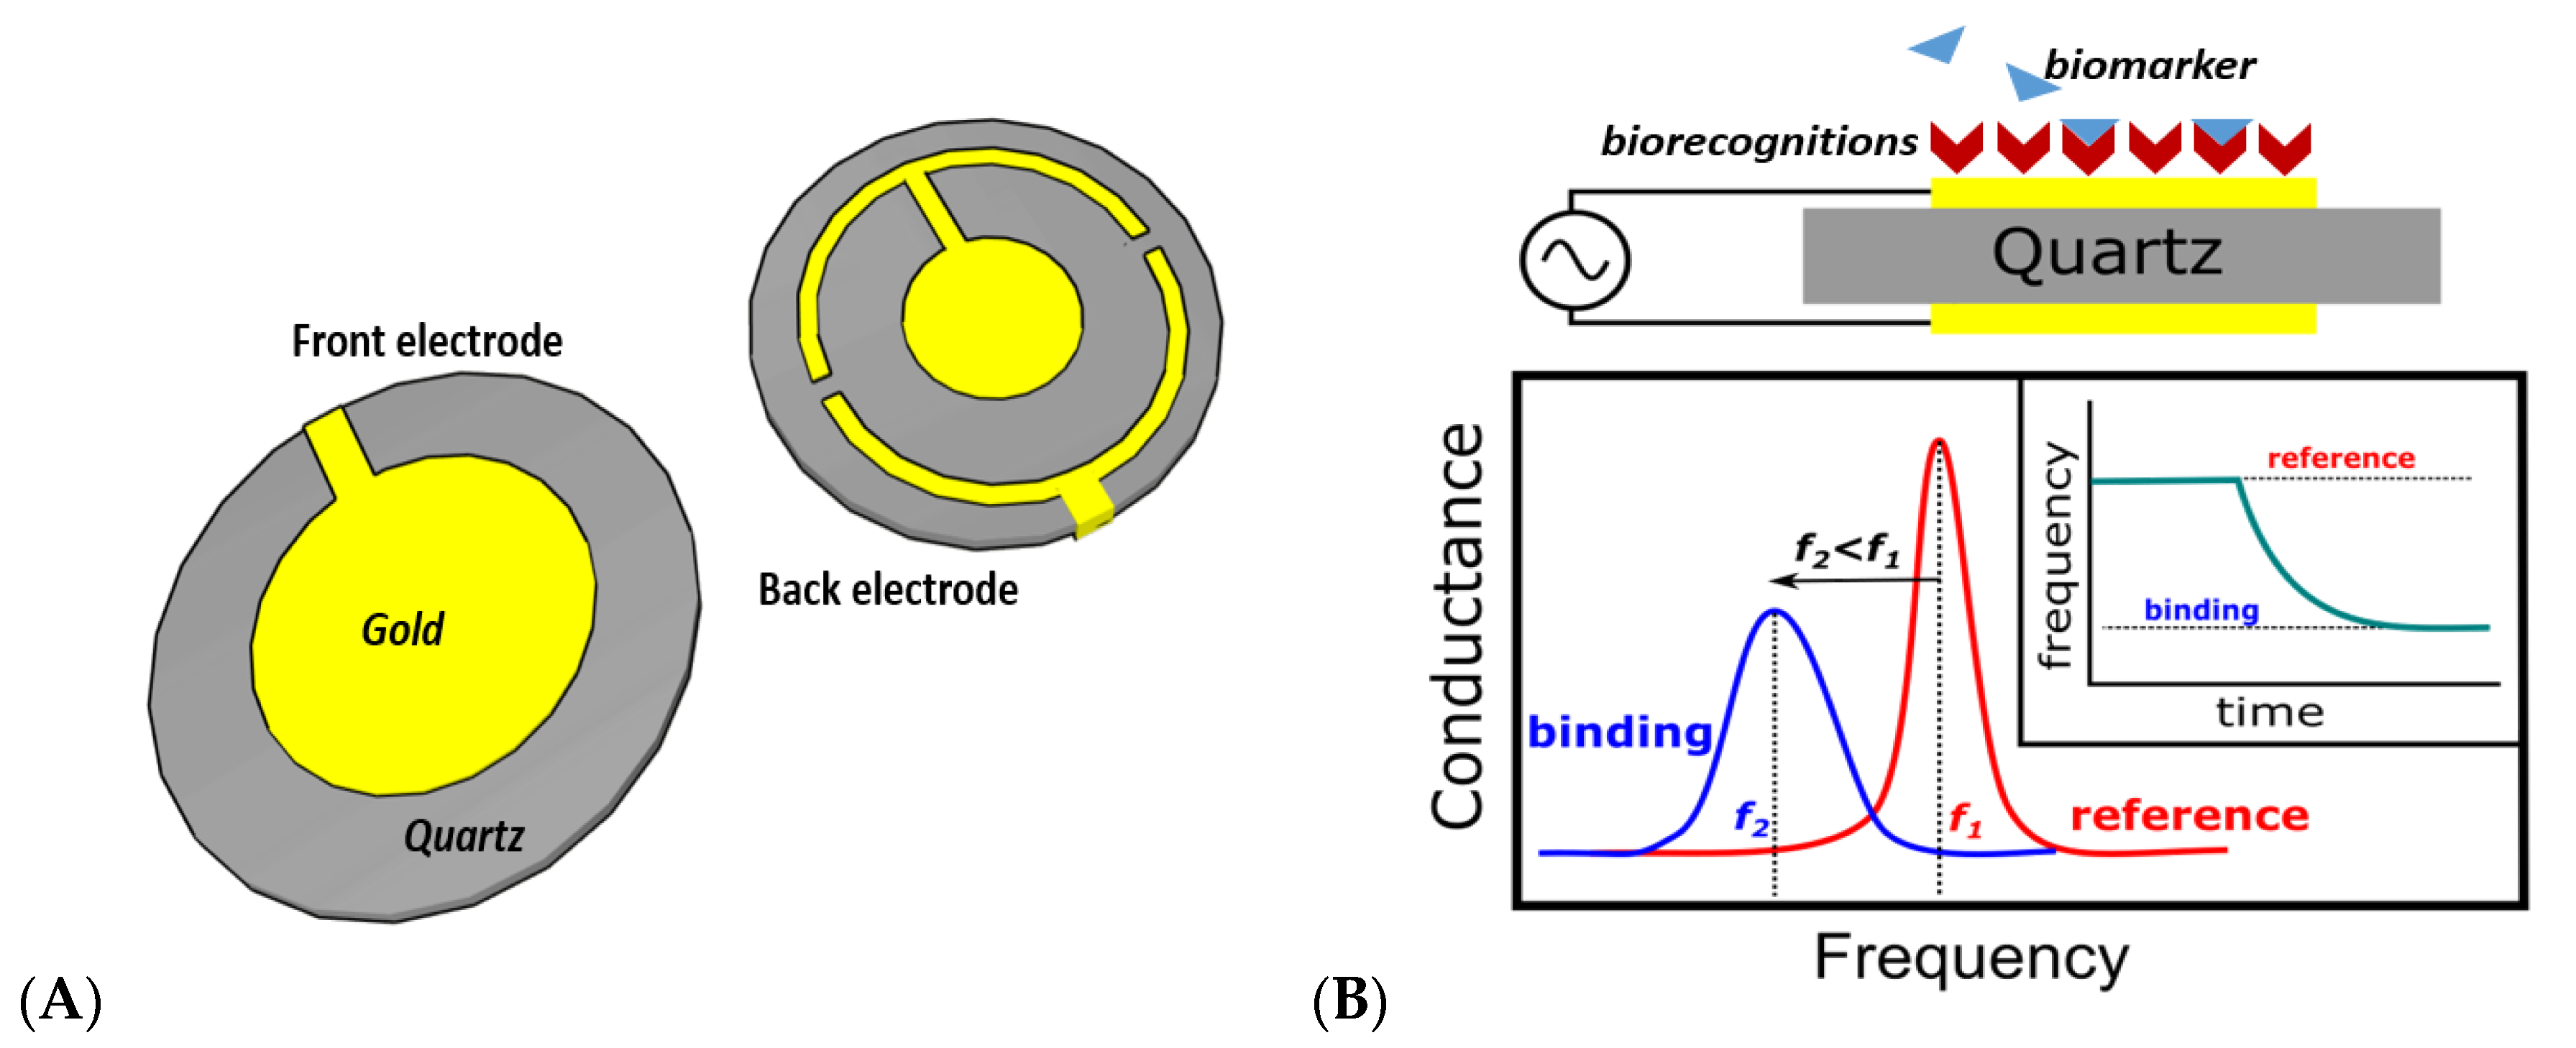
2.3. Quartz Crystal Microbalance Biosensors
2.4. Optical-Based Biosensors
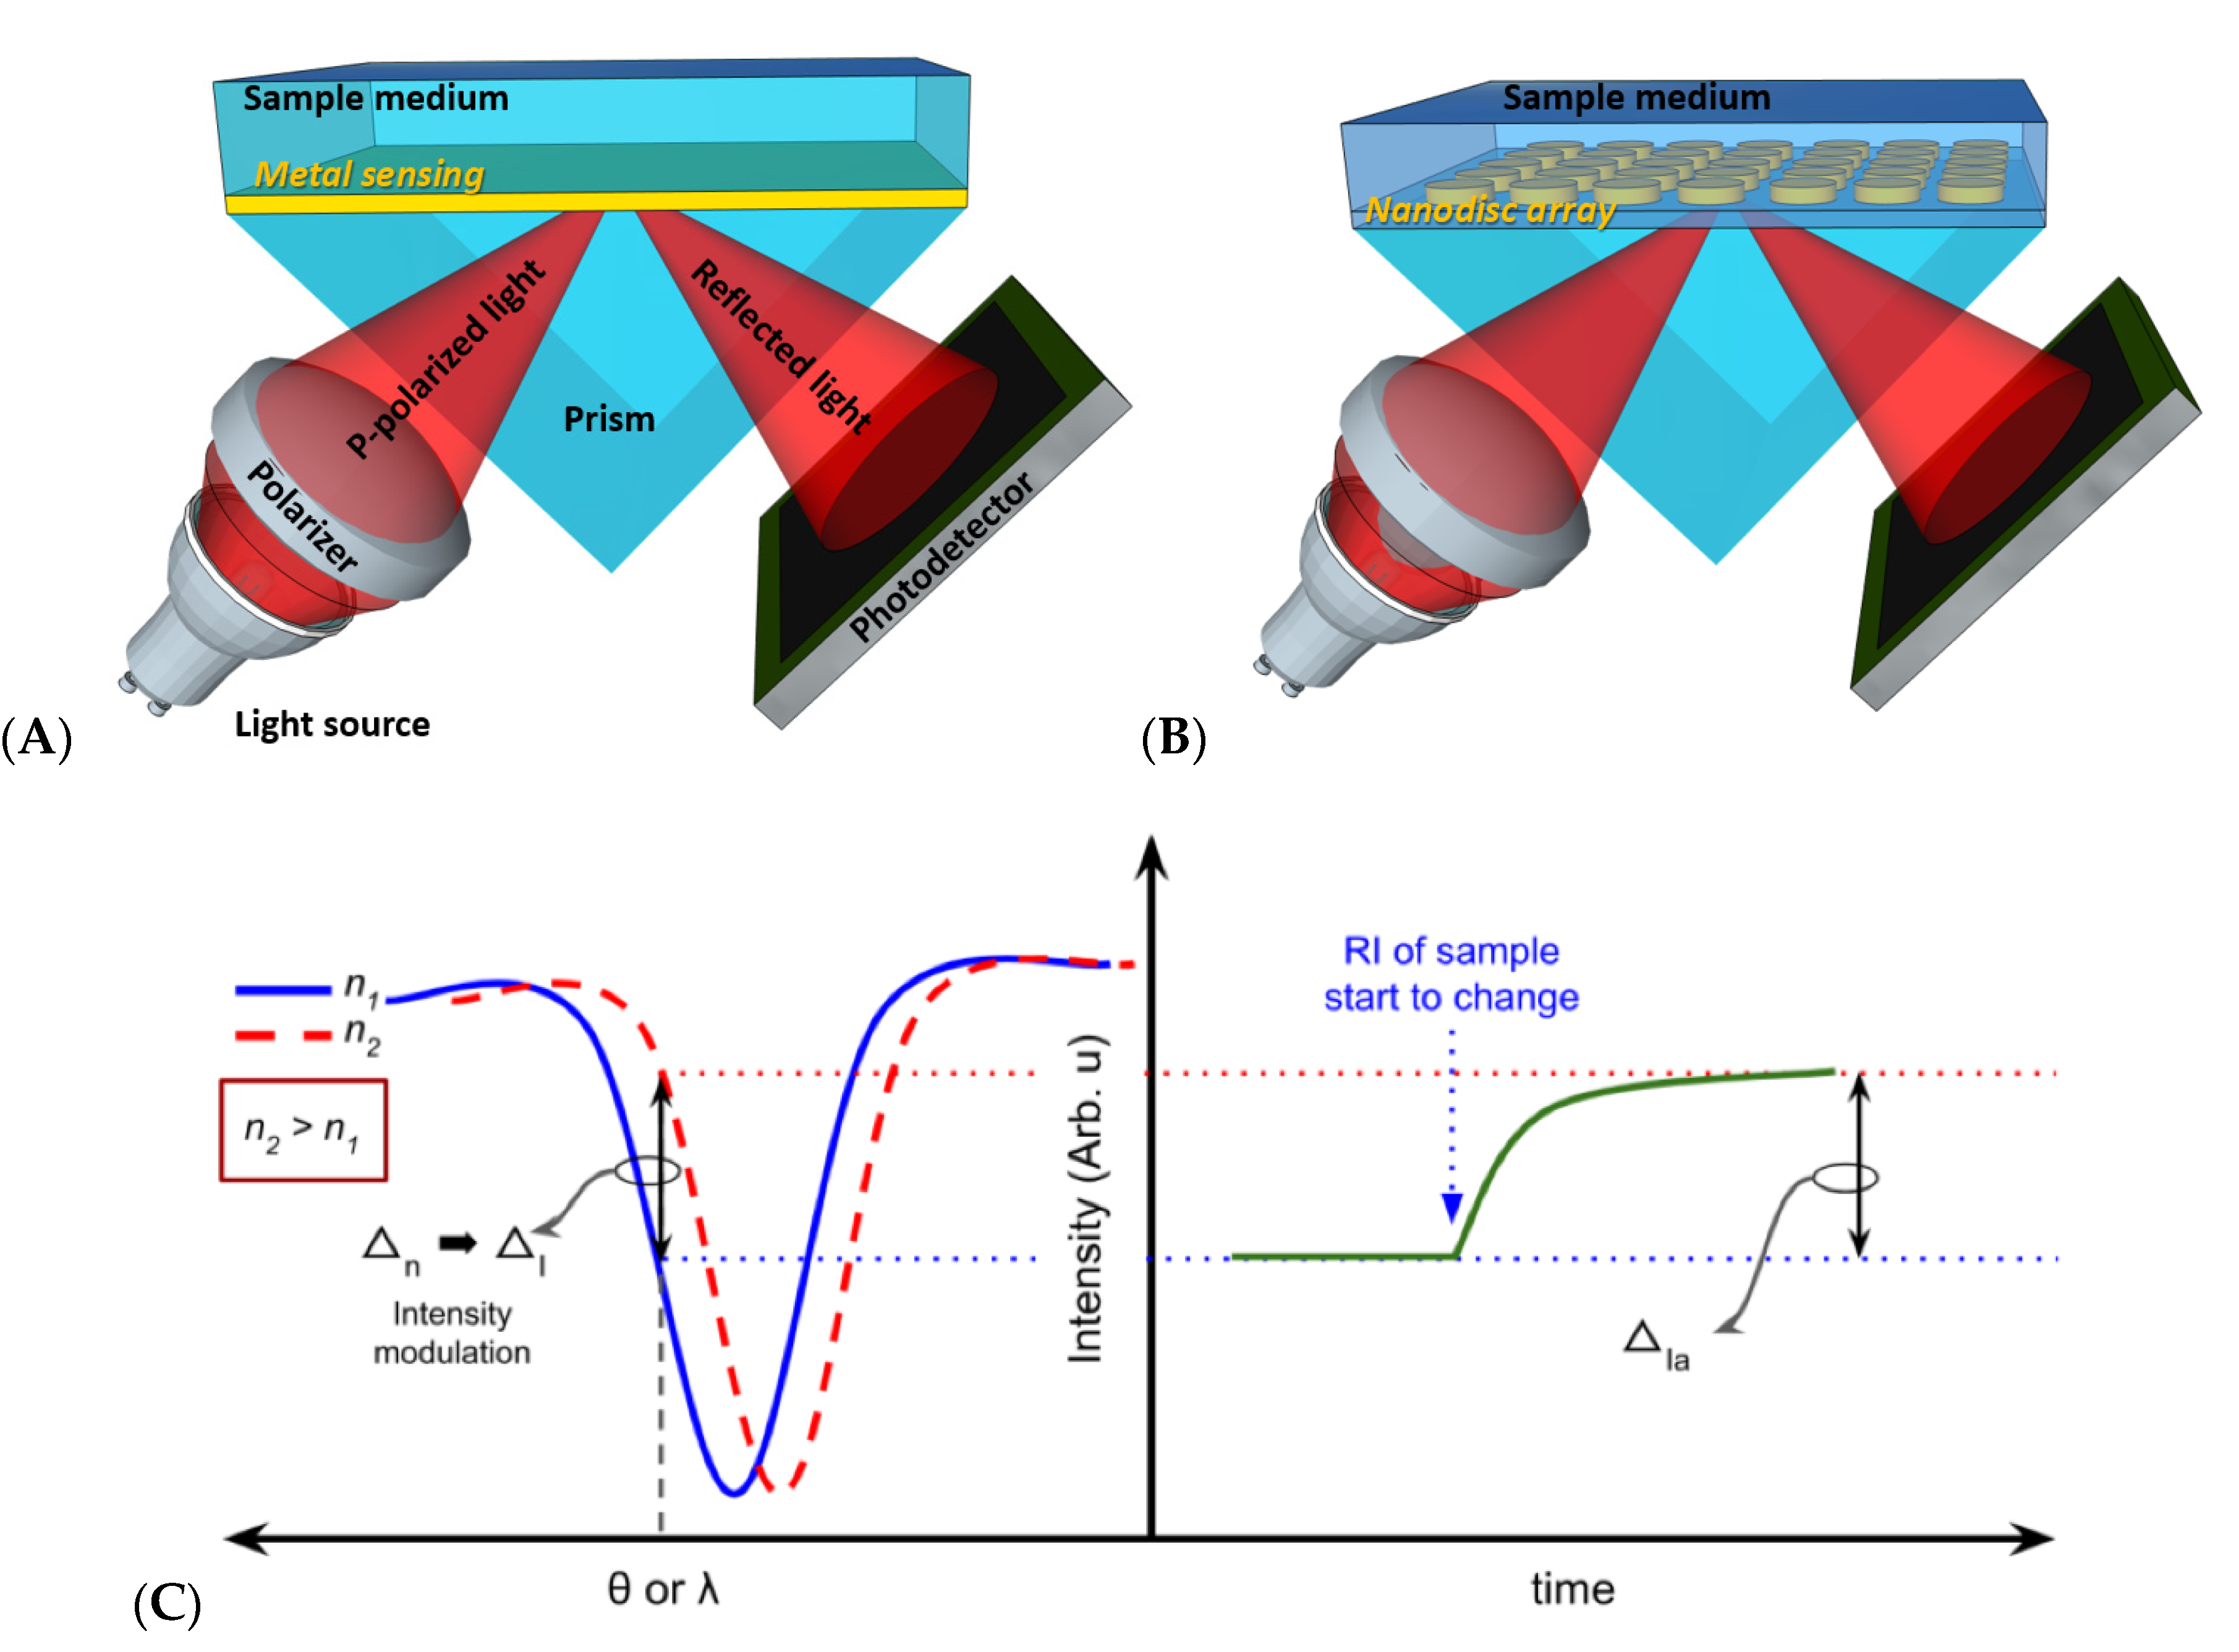
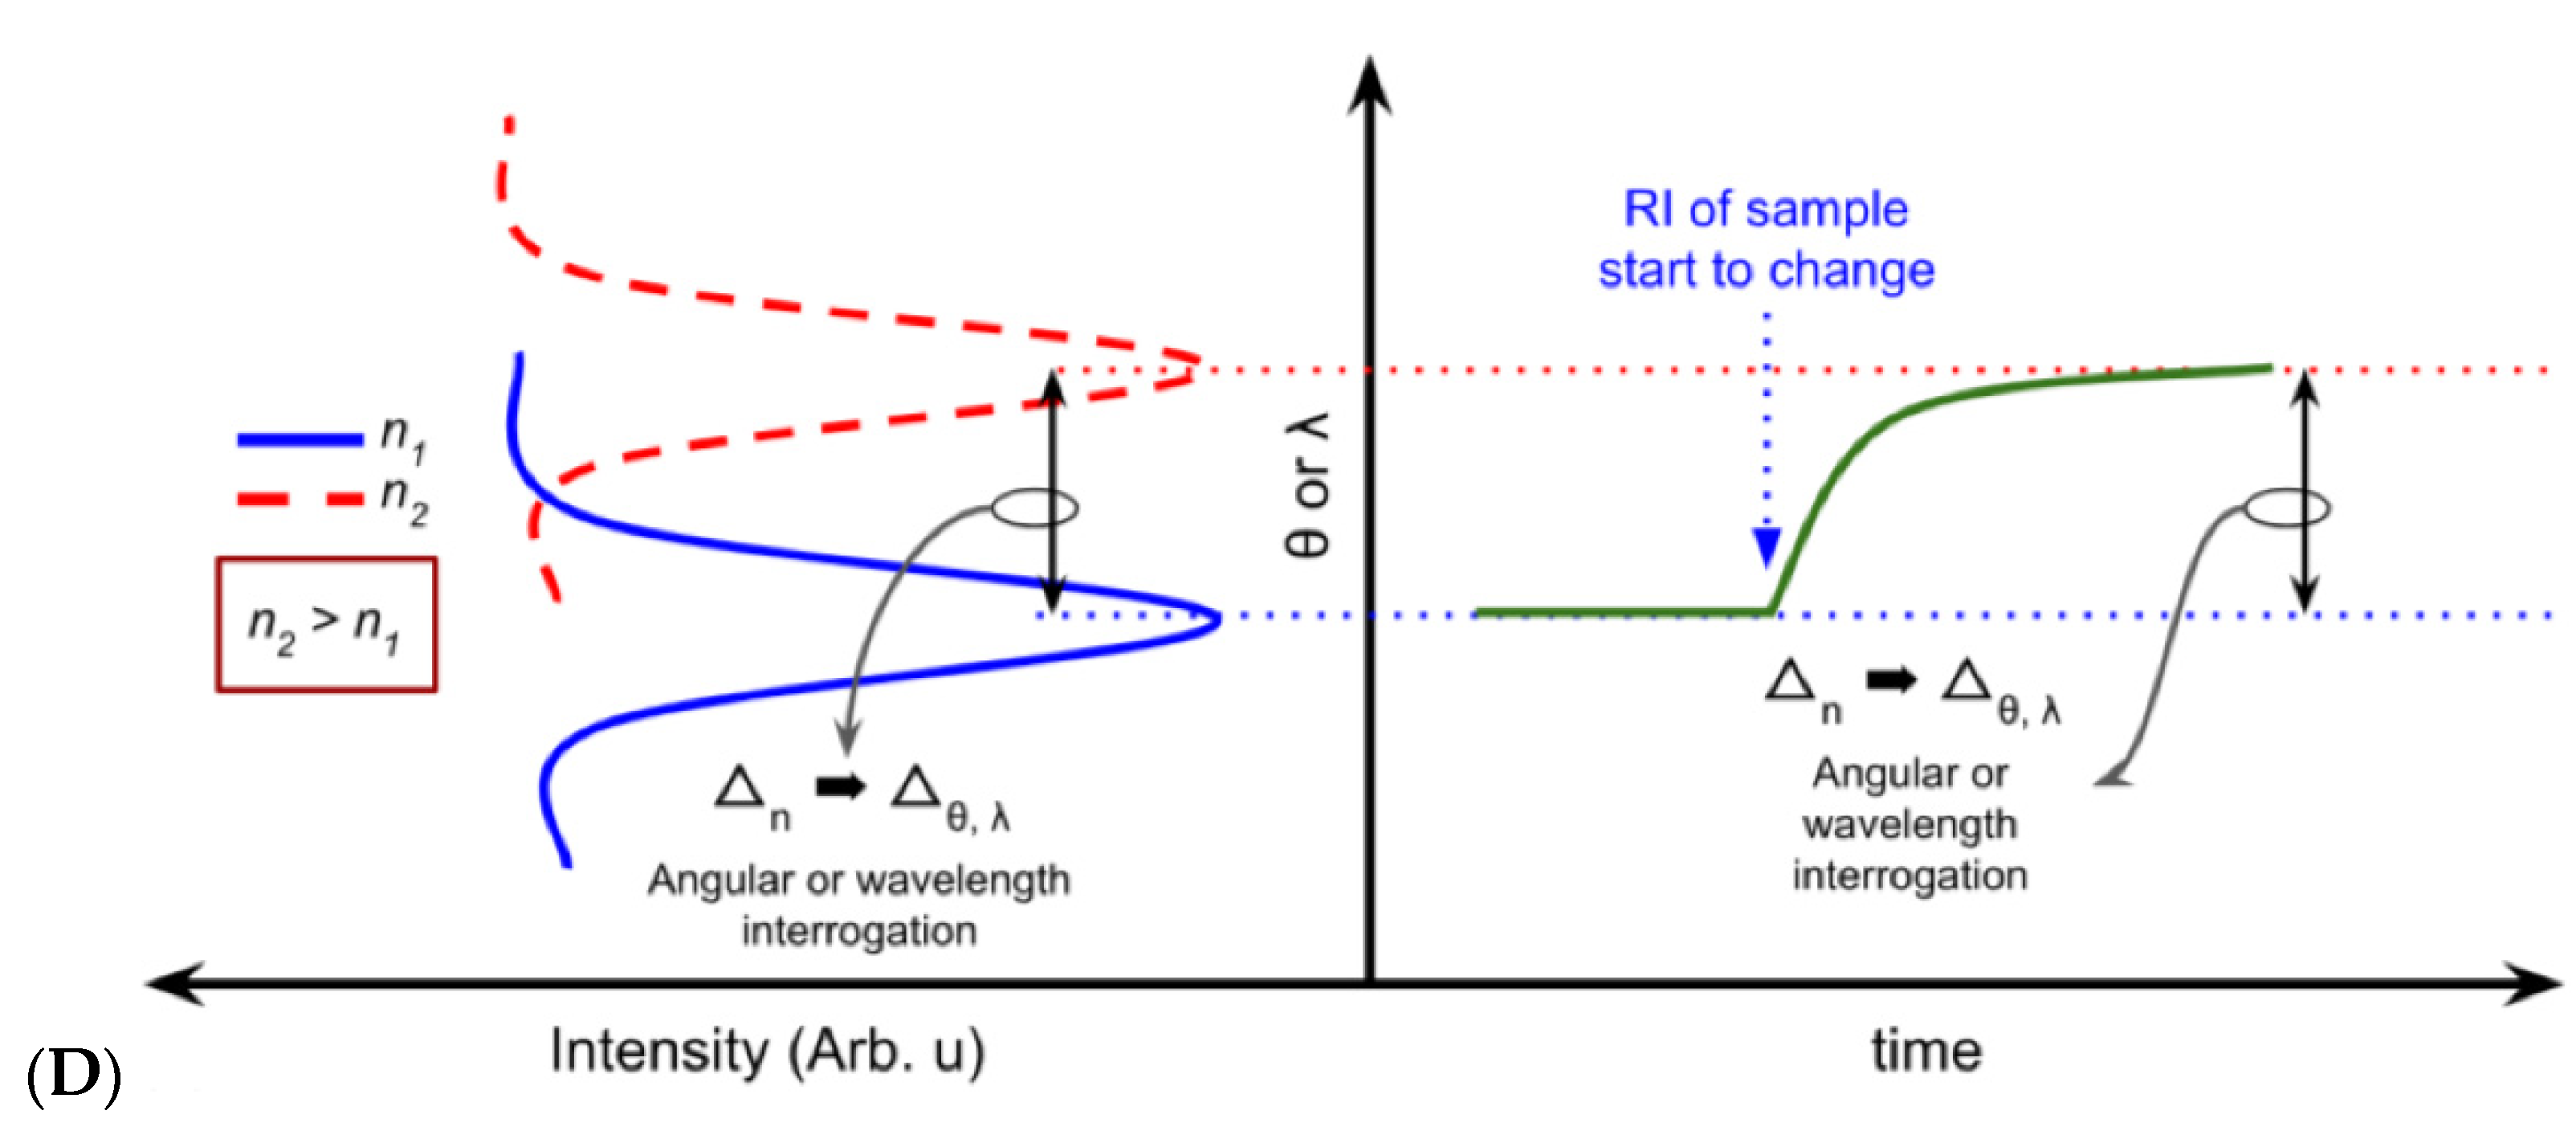
2.4.1. Plasmonic-Based Biosensors
2.4.2. SERS-Based Biosensors
3. Biosensor Analytical Performance
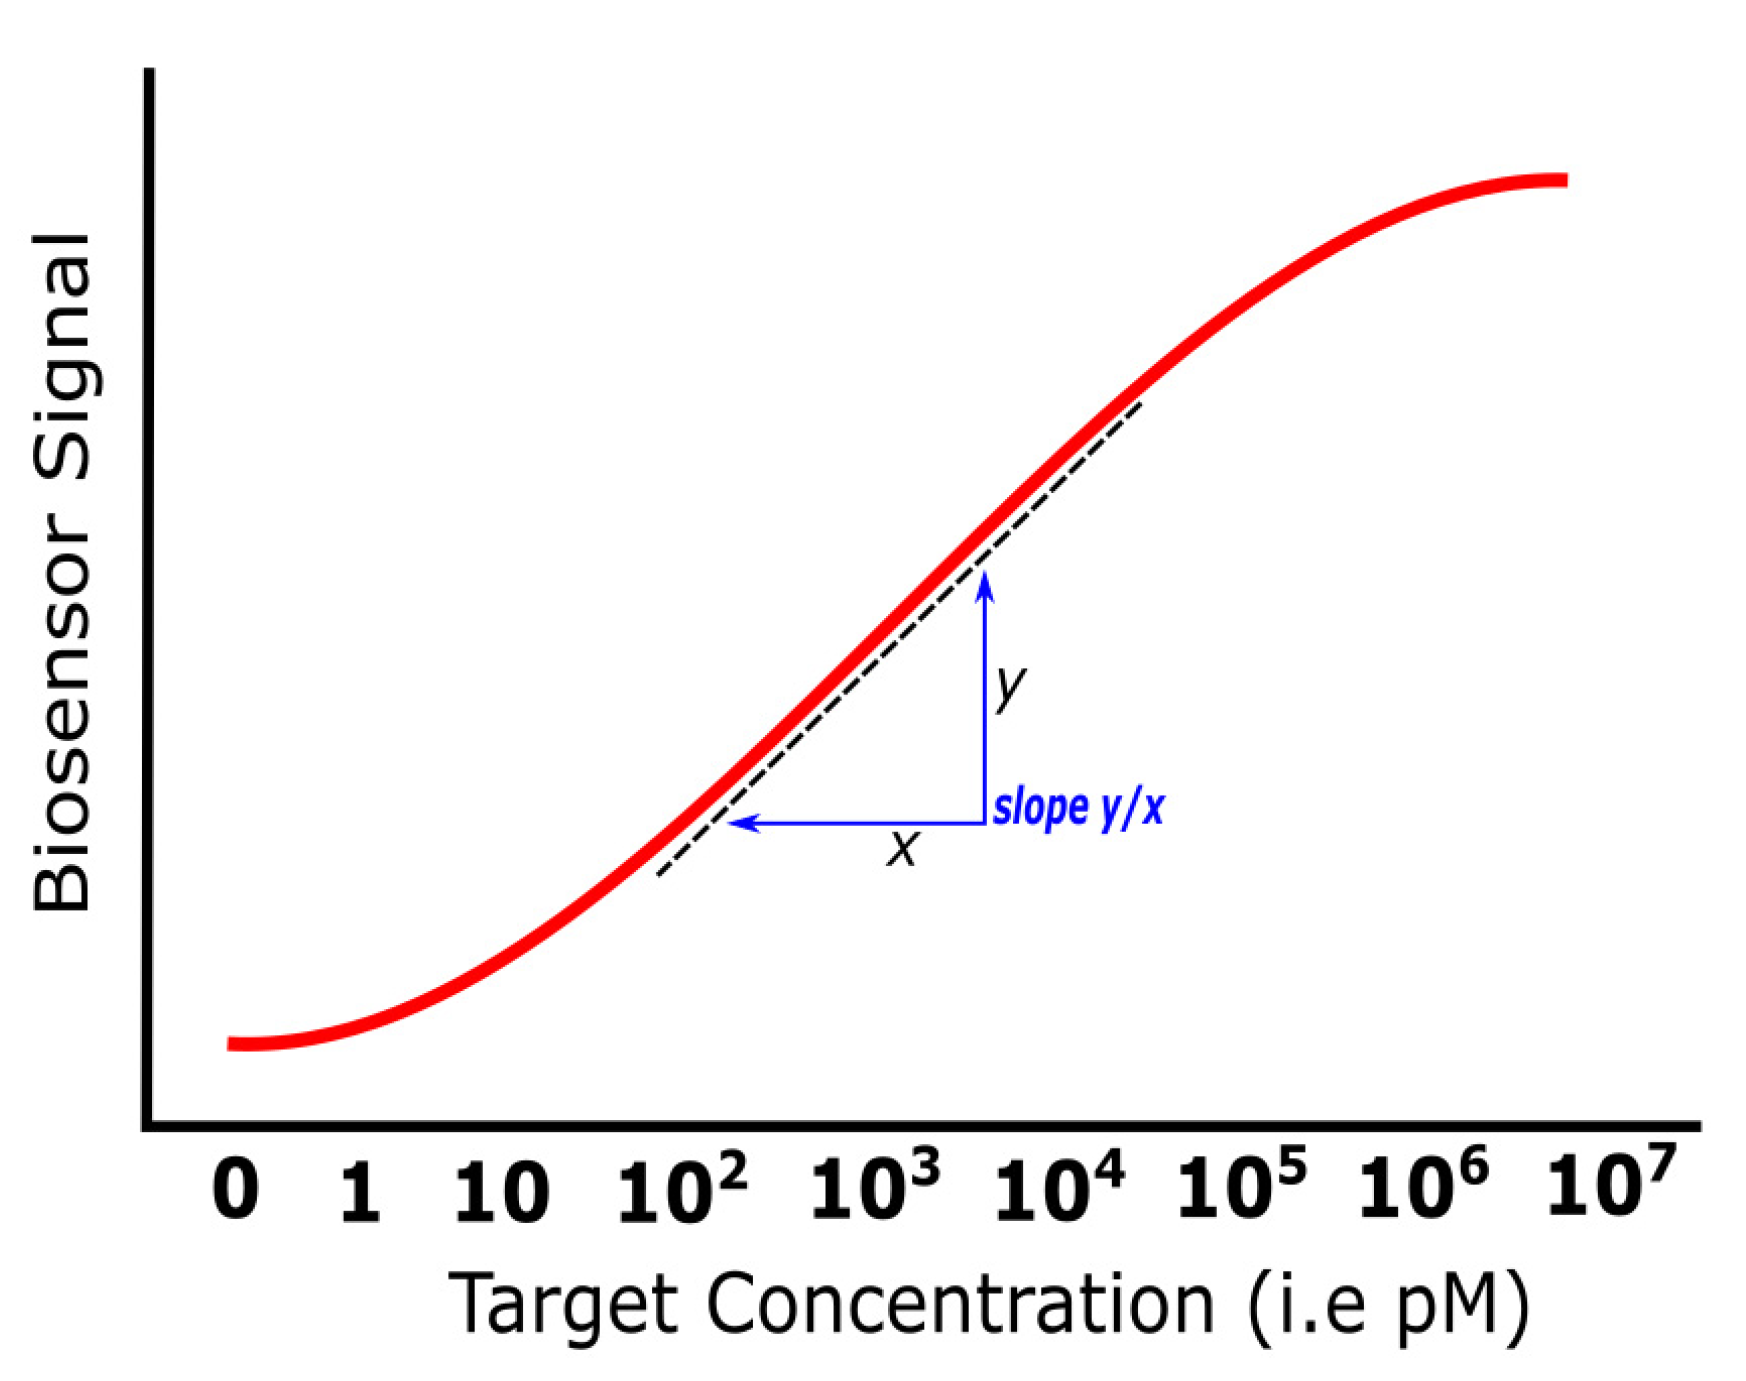
3.1. Sensitivity
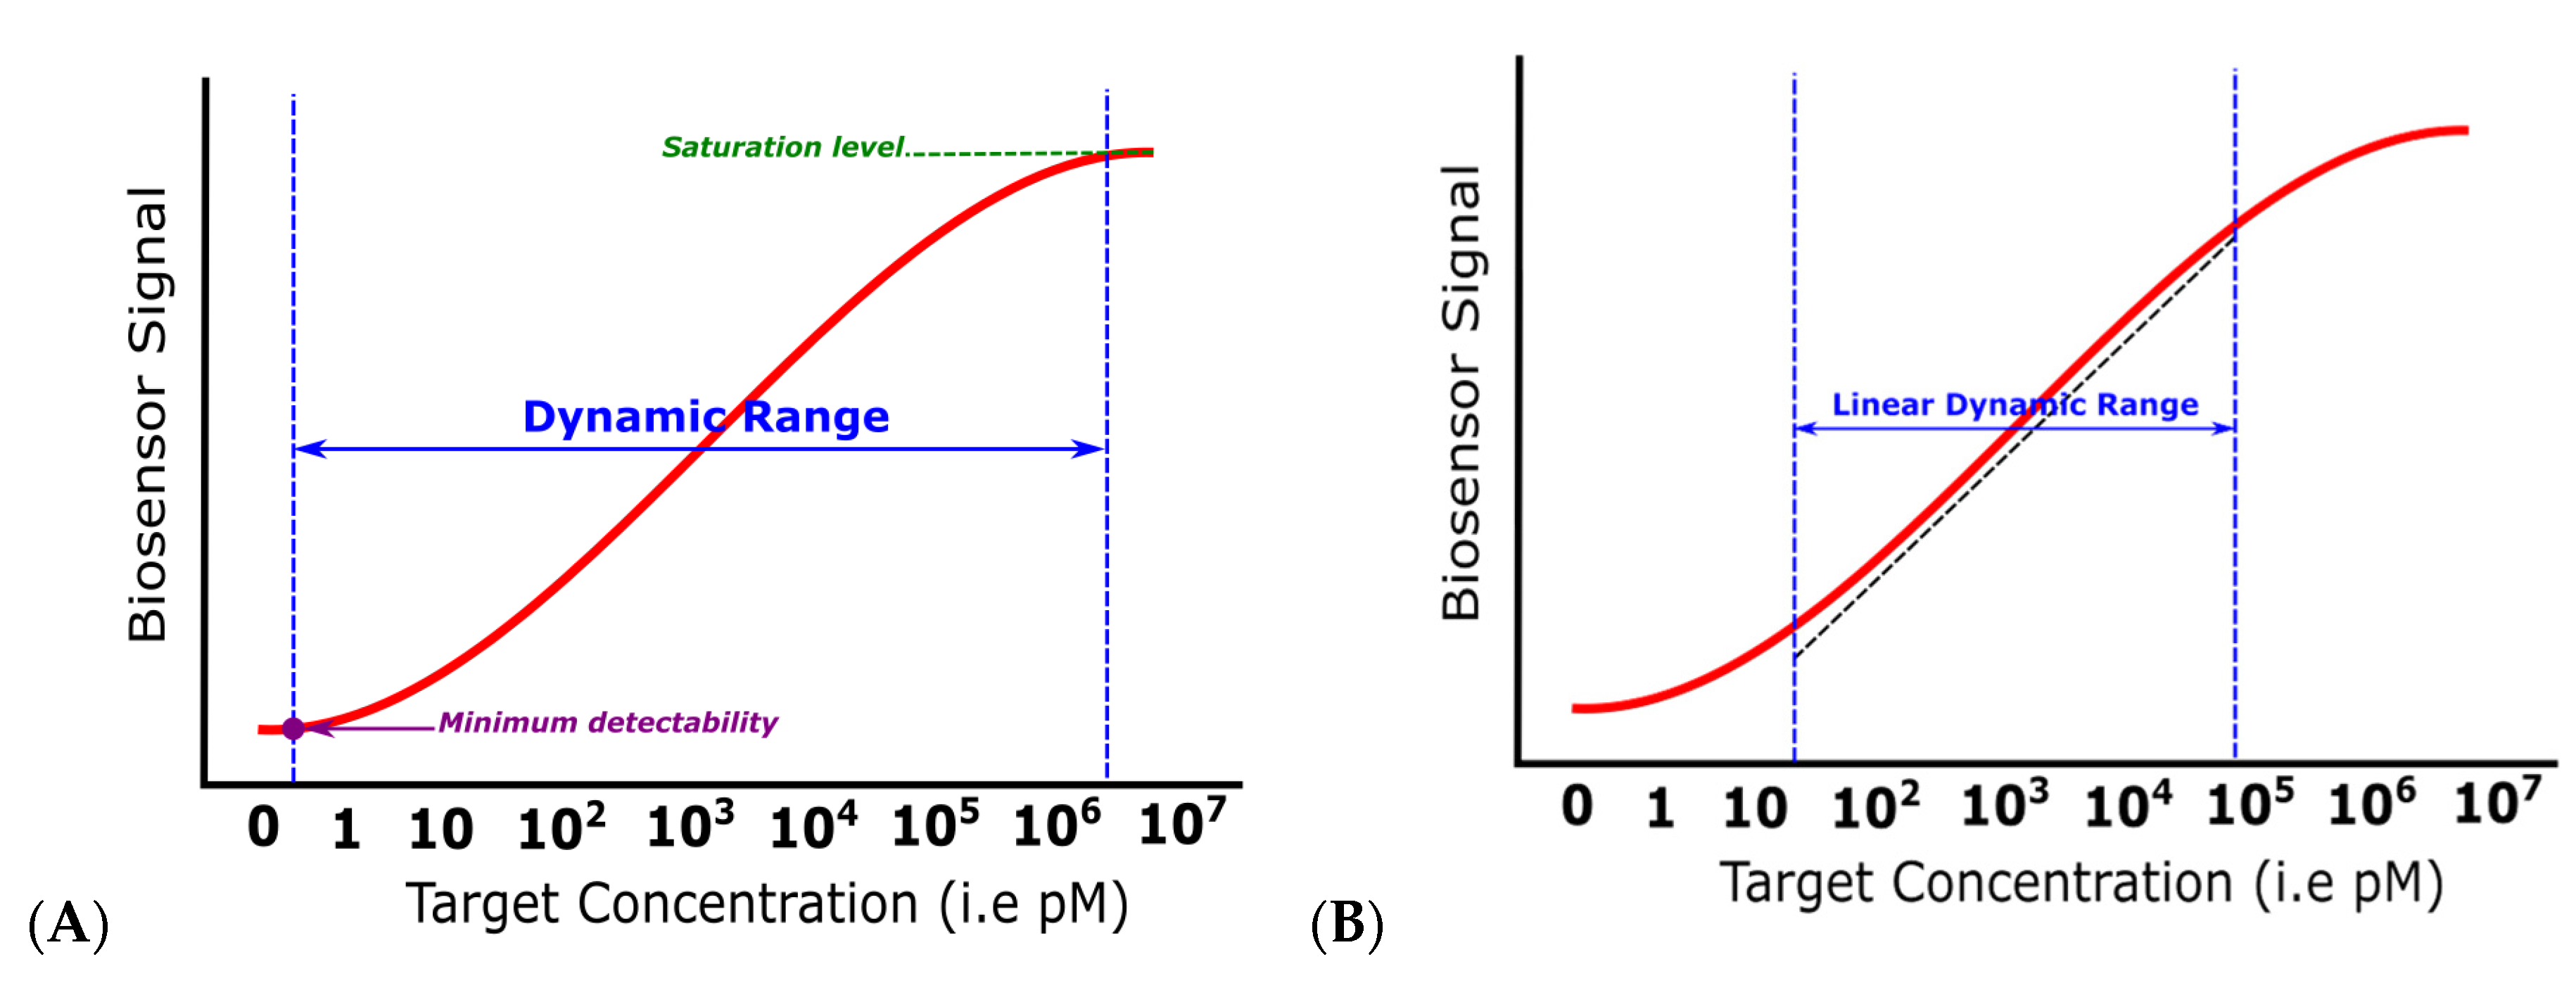
3.2. Dynamic Range
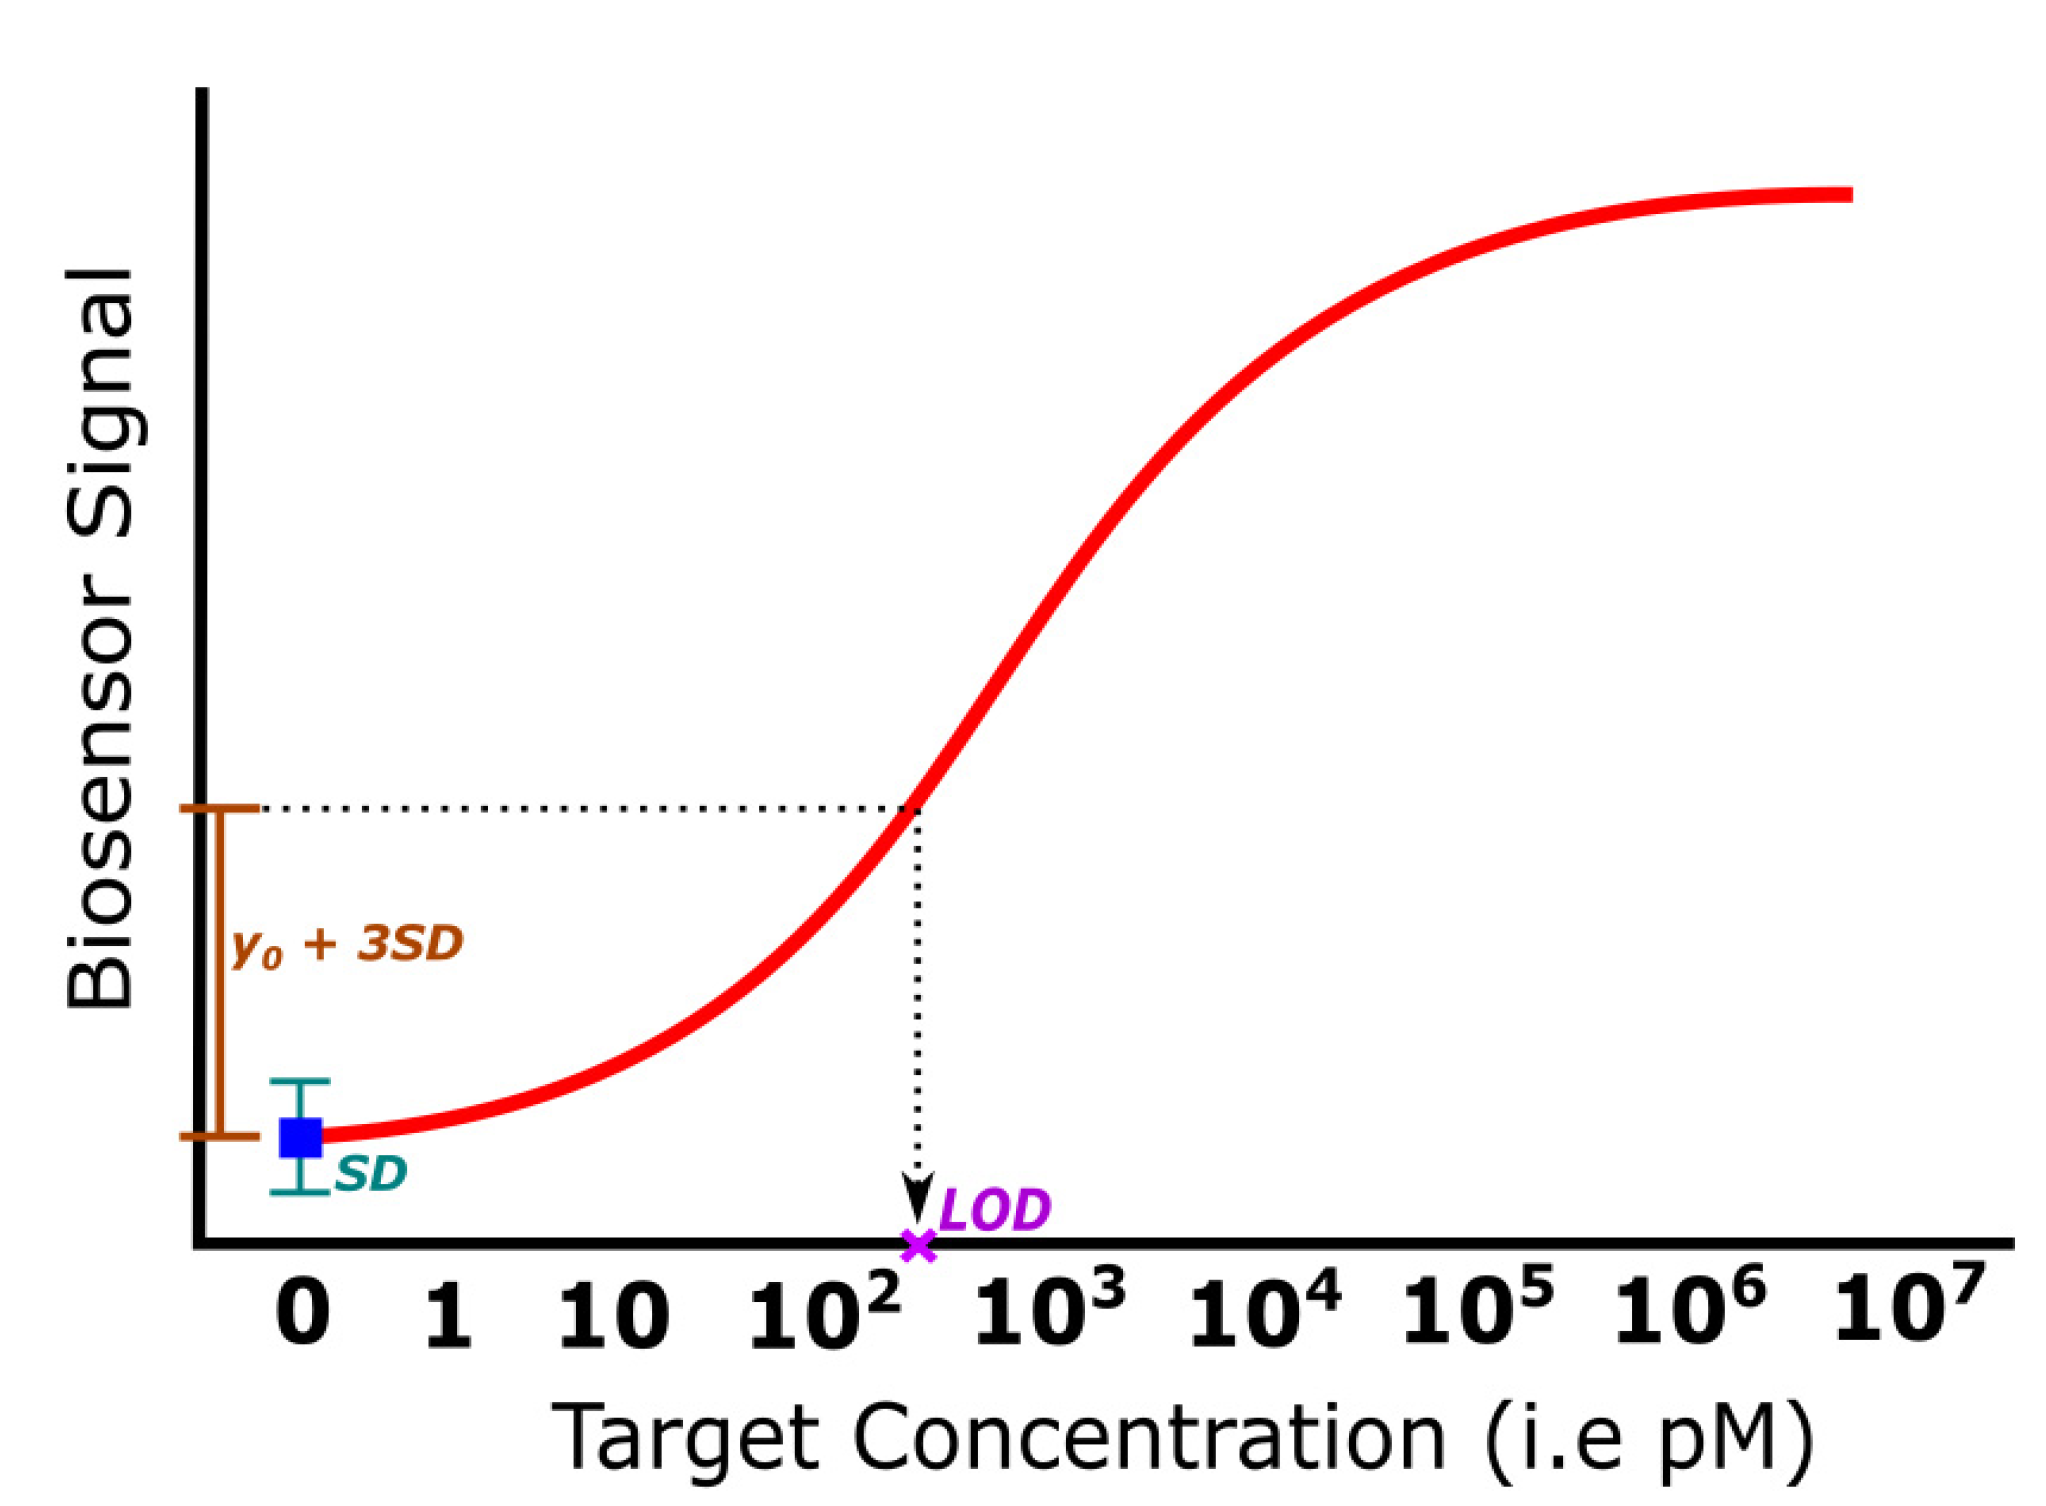
3.3. Limit of Detection
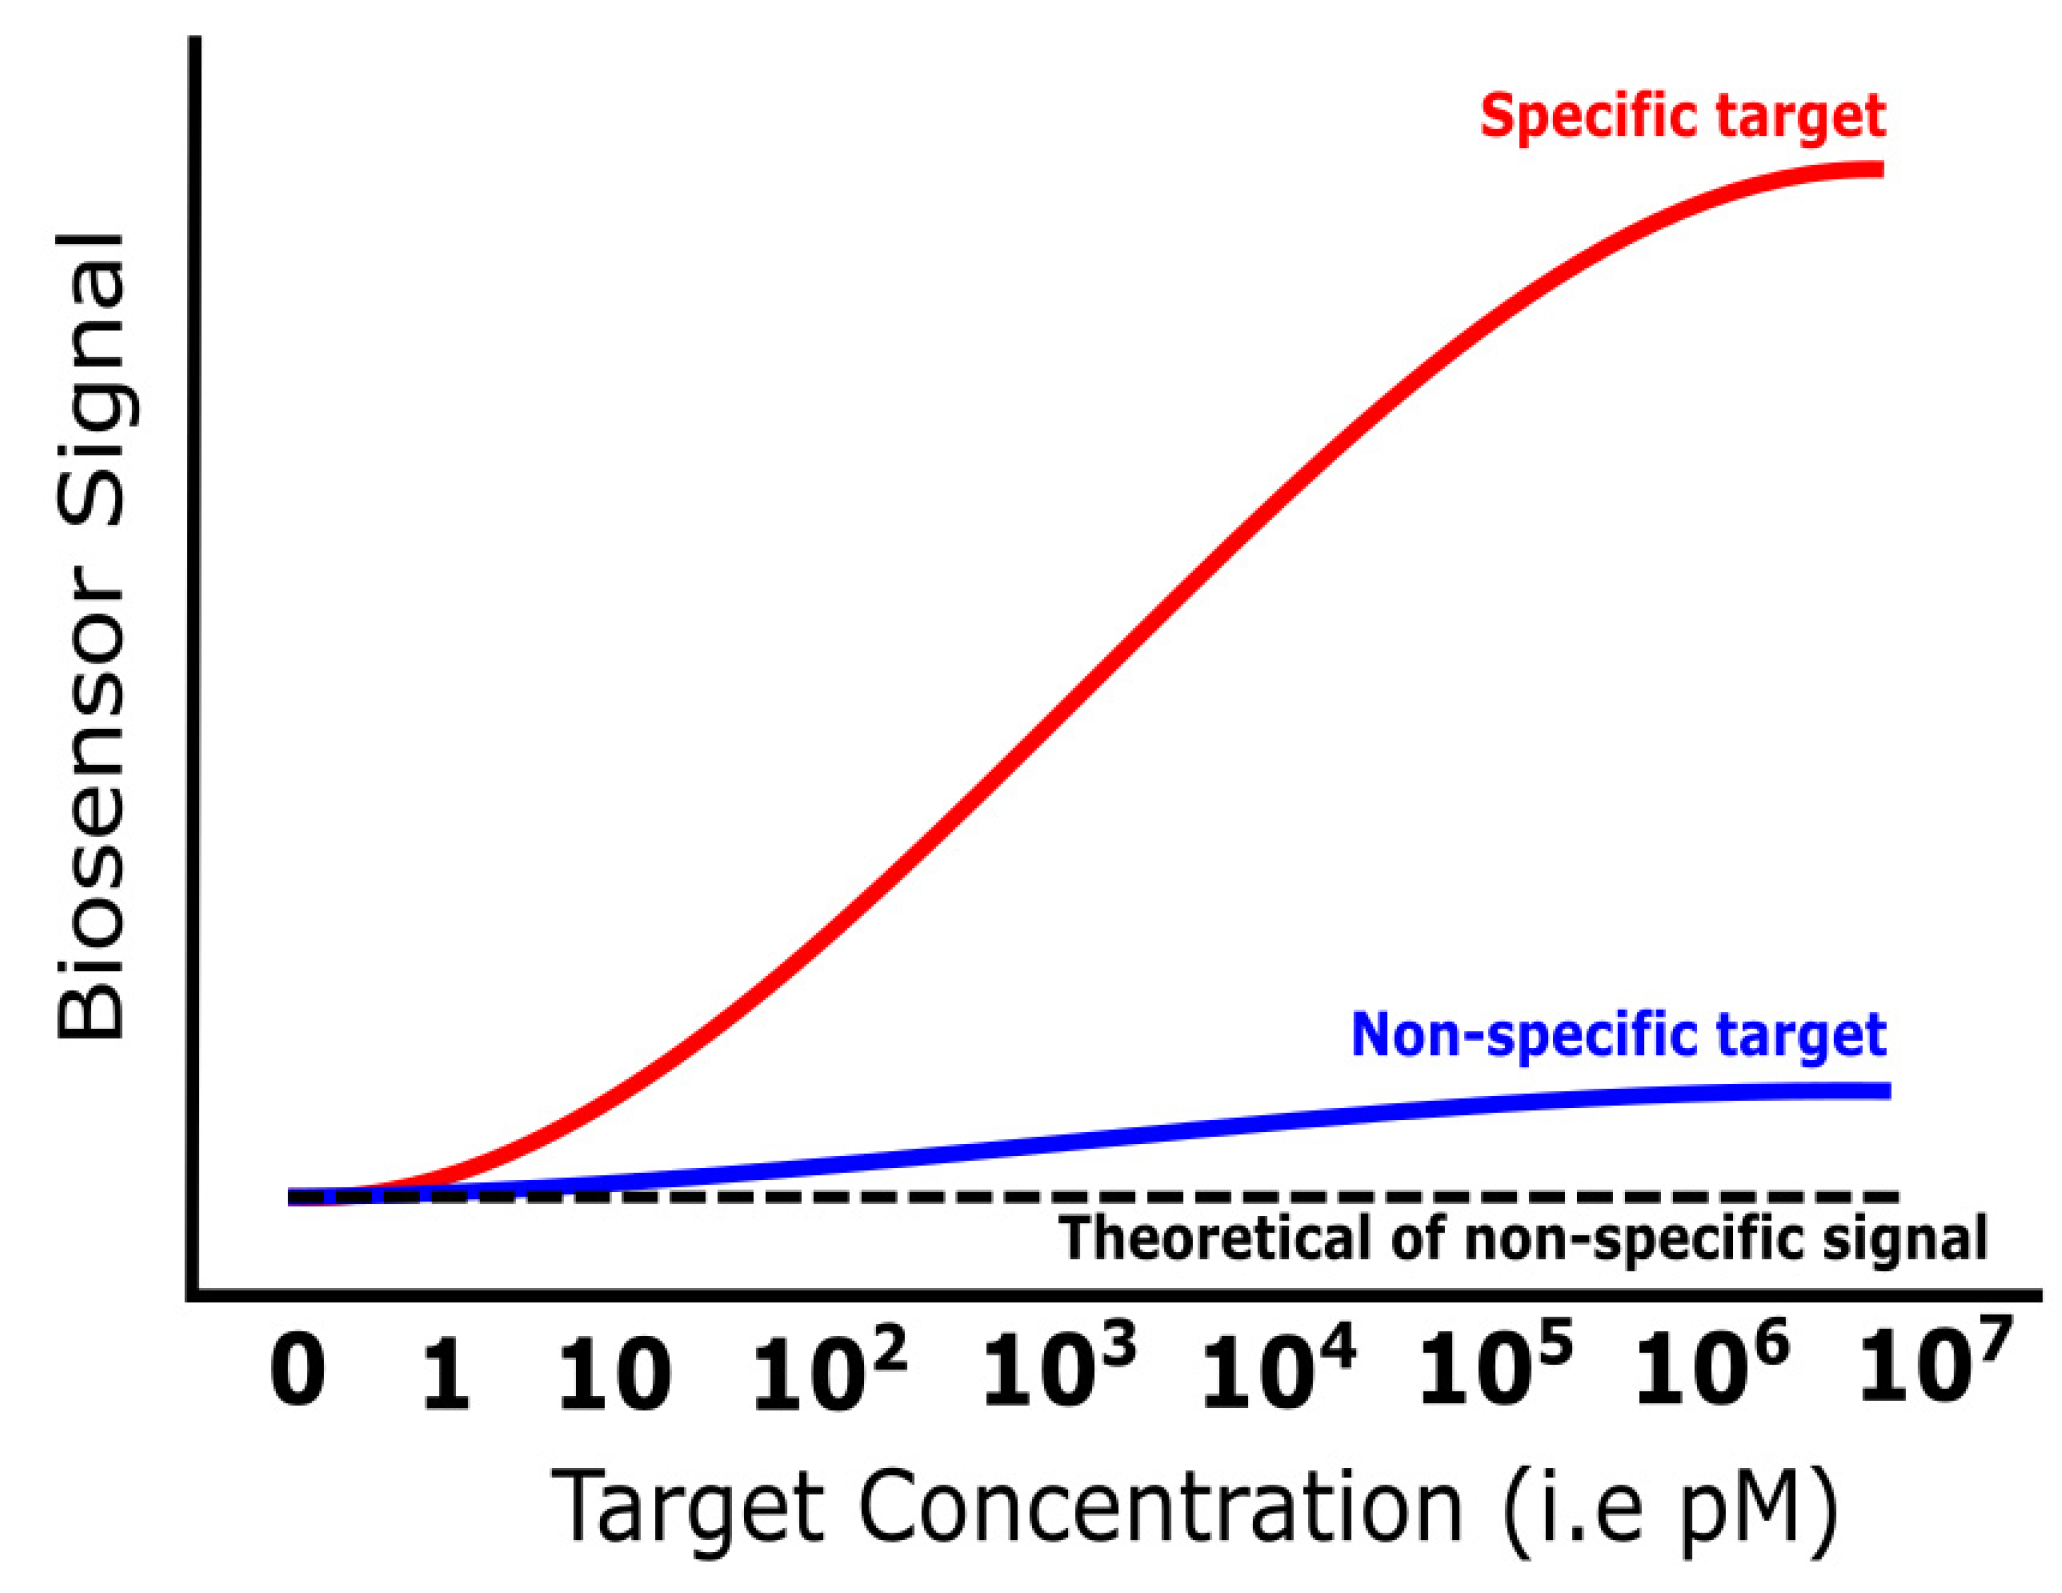
3.4. Specificity
3.5. Reproducibility
4. Biomarker Strategy
4.1. Single Biomarker
4.2. Multiple Biomarkers
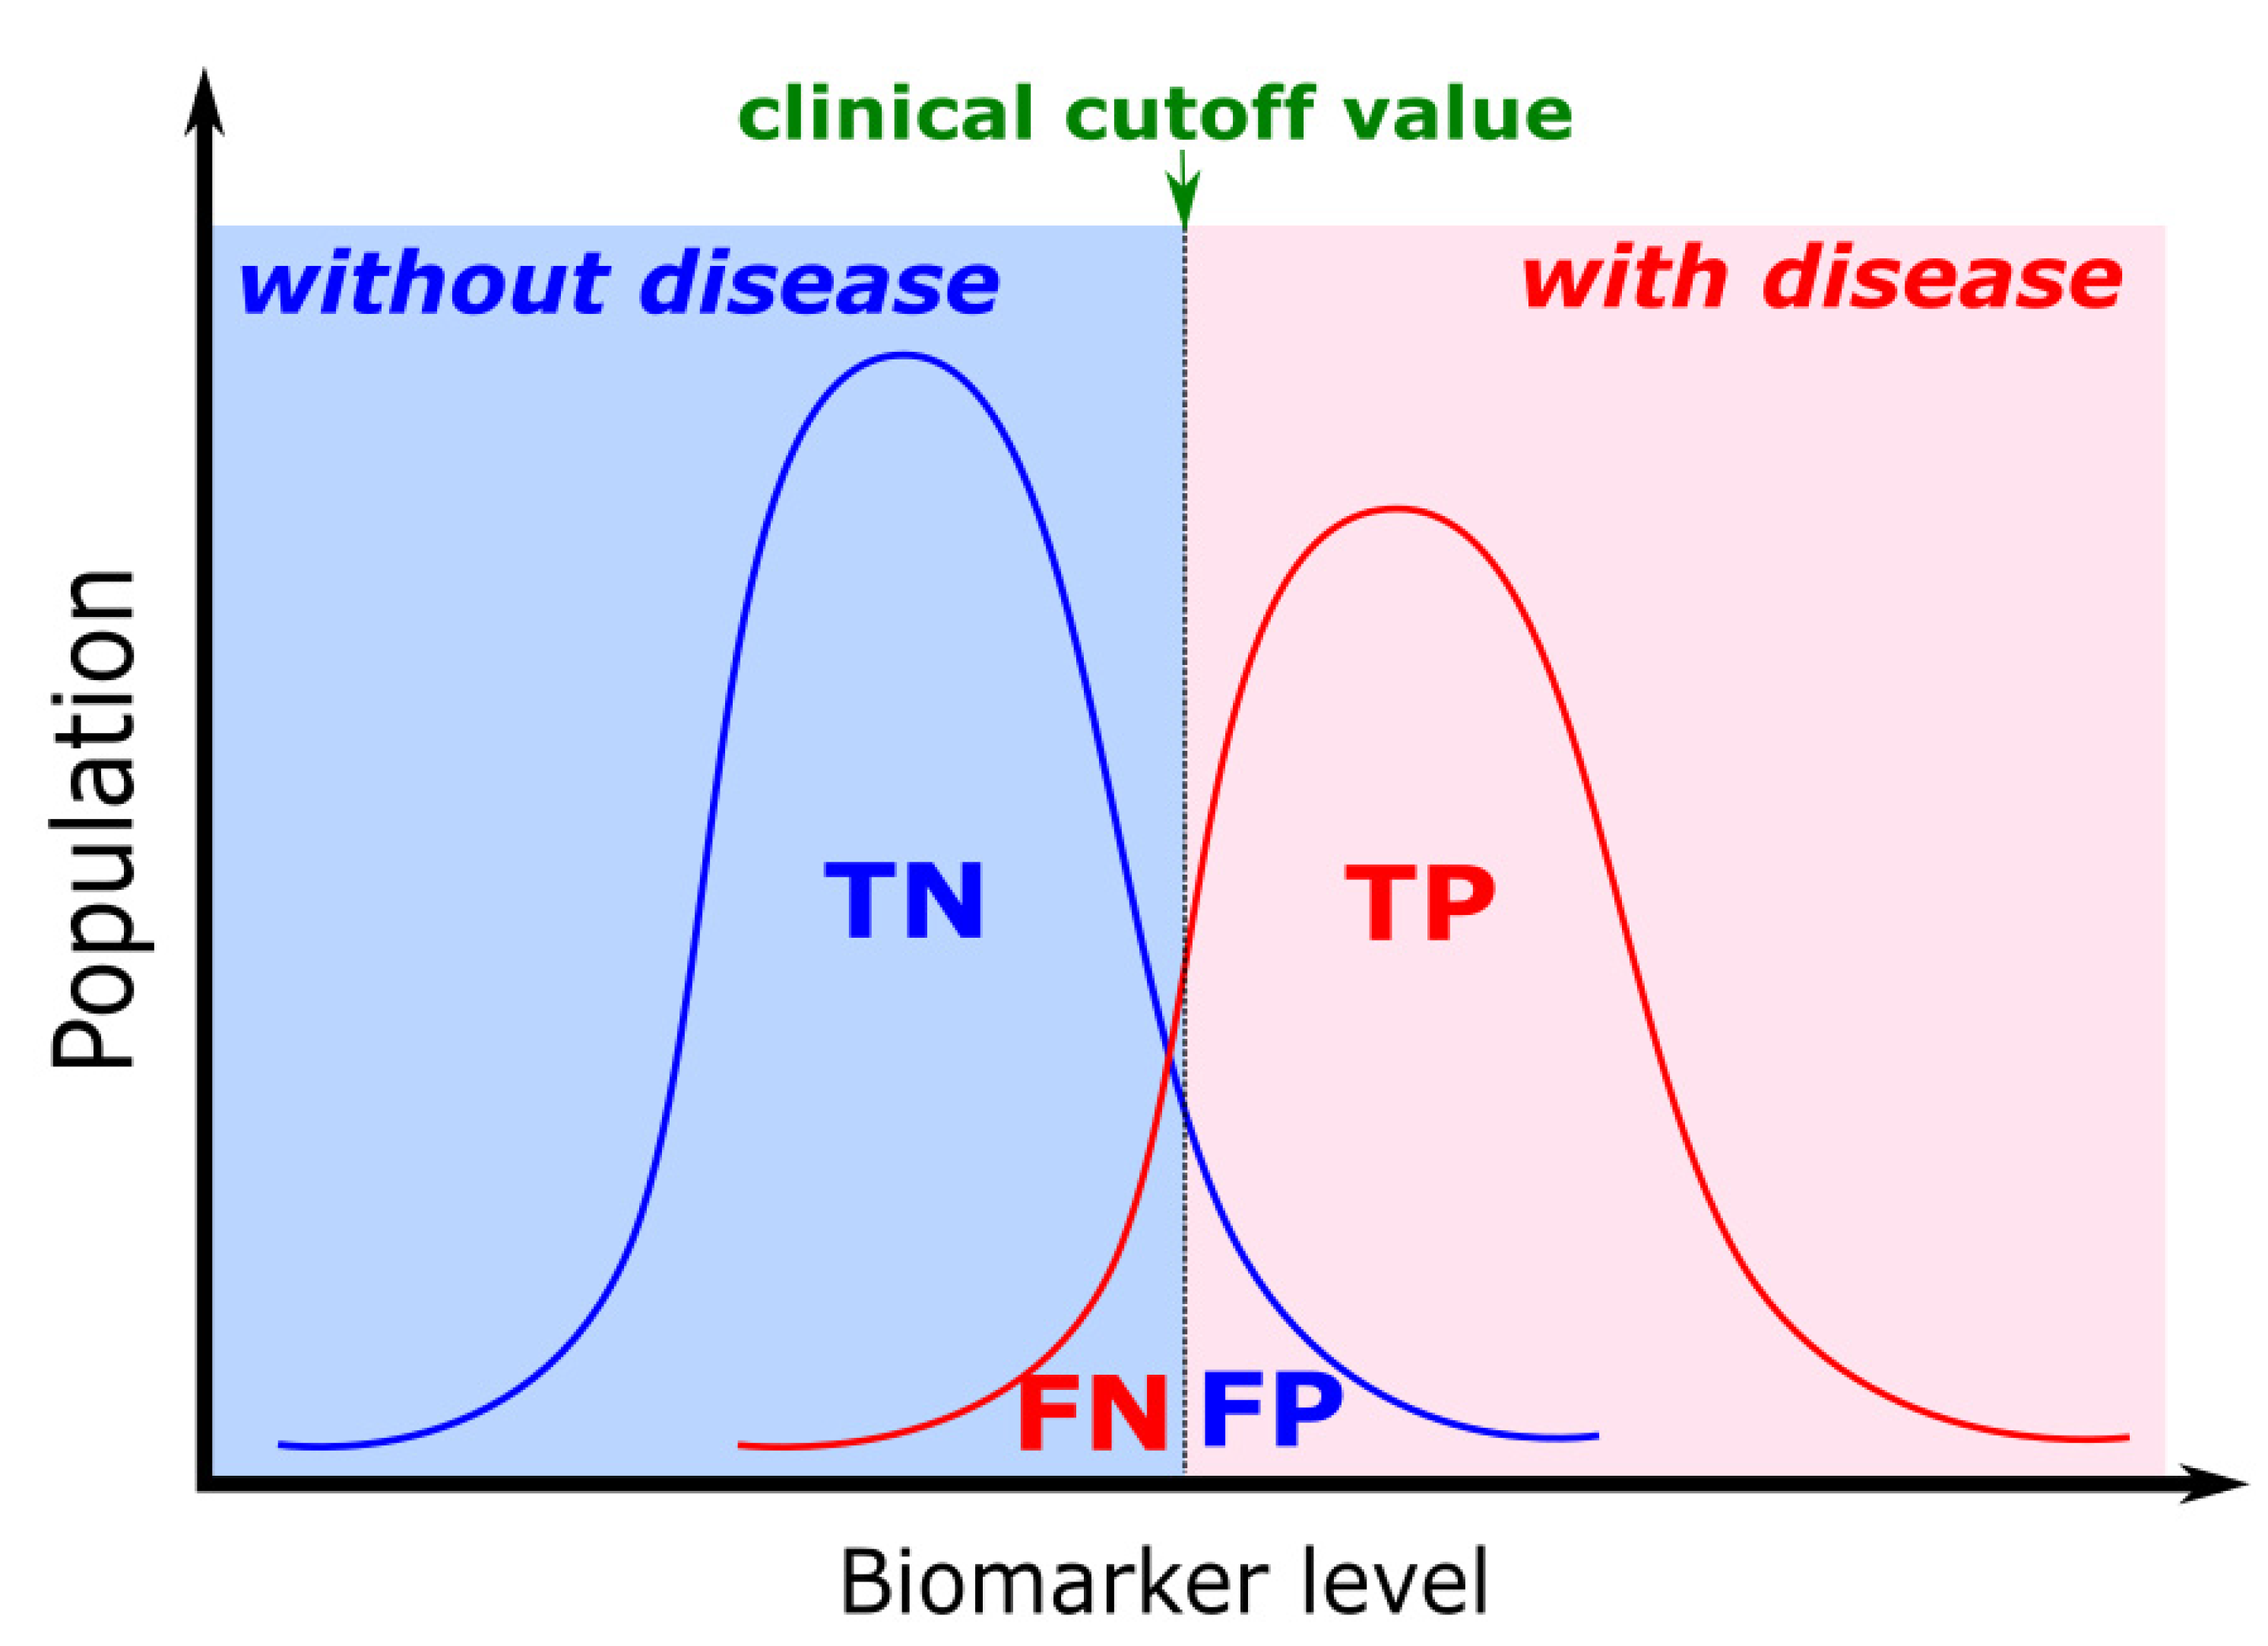
5. Biomarker Clinical Cut-Off Value
6. Conclusions
Author Contributions
Funding
Conflicts of Interest
References
- Ward, M.P.; Li, X.; Tian, K. Novel coronavirus 2019, an emerging public health emergency. Transbound. Emerg. Dis. 2020, 67, 469–470. [Google Scholar] [CrossRef] [PubMed]
- Udugama, B.; Kadhiresan, P.; Kozlowski, H.N.; Malekjahani, A.; Osborne, M.; Li, V.Y.C.; Chen, H.; Mubareka, S.; Gubbay, J.B.; Chan, W.C.W. Diagnosing COVID-19: The Disease and Tools for Detection. ACS Nano 2020, 14, 3822–3835. [Google Scholar] [CrossRef]
- Nagel, B.; Dellweg, H.; Gierasch, L. Glossary for chemists of terms used in biotechnology (IUPAC Recommendations 1992). Pure Appl. Chem. 2009, 64, 143–168. [Google Scholar] [CrossRef]
- Puiu, M.; Bala, C. Microfluidics-integrated biosensing platforms as emergency tools for on-site field detection of foodborne pathogens. TrAC Trends Anal. Chem. 2020, 125, 115831. [Google Scholar] [CrossRef]
- Selleck, M.J.; Senthil, M.; Wall, N.R. Making Meaningful Clinical Use of Biomarkers. Biomark. Insights 2017, 12, 1177271917715236. [Google Scholar] [CrossRef] [PubMed]
- Fullerton, E.E.; Childress, J.R. Spintronics, Magnetoresistive Heads, and the Emergence of the Digital World. Proc. IEEE 2016, 104, 1787–1795. [Google Scholar] [CrossRef]
- Wang, Y.; Wang, W.; Yu, L.; Tu, L.; Feng, Y.; Klein, T.; Wang, J.-P.J.P. Giant magnetoresistive-based biosensing probe station system for multiplex protein assays. Biosens. Bioelectron. 2015, 70, 61–68. [Google Scholar] [CrossRef] [PubMed]
- Marquina, C.; De Teresa, J.M.; Serrate, D.; Marzo, J.; Cardoso, F.A.; Saurel, D.; Cardoso, S.; Freitas, P.P.; Ibarra, M.R. GMR sensors and magnetic nanoparticles for immuno-chromatographic assays. J. Magn. Magn. Mater. 2012, 324, 3495–3498. [Google Scholar] [CrossRef]
- Wu, K.; Su, D.; Liu, J.; Saha, R.; Wang, J.P. Magnetic nanoparticles in nanomedicine: A review of recent advances. Nanotechnology 2019, 30, 502003. [Google Scholar] [CrossRef] [PubMed]
- Mu, X.H.; Liu, H.F.; Tong, Z.Y.; Du, B.; Liu, S.; Liu, B.; Liu, Z.W.; Gao, C.; Wang, J.; Dong, H. A new rapid detection method for ricin based on tunneling magnetoresistance biosensor. Sens. Actuators B Chem. 2019, 284, 638–649. [Google Scholar] [CrossRef]
- Kim, K.; Hall, D.A.; Yao, C.; Lee, J.R.; Ooi, C.C.; Bechstein, D.J.B.; Guo, Y.; Wang, S.X. Magnetoresistive biosensors with on-chip pulsed excitation and magnetic correlated double sampling. Sci. Rep. 2018, 8, 16493. [Google Scholar] [CrossRef]
- Hall, D.A.; Gaster, R.S.; Osterfeld, S.J.; Murmann, B.; Wang, S.X. GMR biosensor arrays: Correction techniques for reproducibility and enhanced sensitivity. Biosens. Bioelectron. 2010, 25, 2177–2181. [Google Scholar] [CrossRef]
- Purwidyantri, A.; Tian, Y.; Muhammad, G.; Saputra, A.; Prabowo, B.A. Gold Nanoframe Array Electrode for Straightforward Detection of Hydrogen Peroxide. Chemosensors 2021, 9, 37. [Google Scholar] [CrossRef]
- Bhattacharyya, I.M.; Cohen, S.; Shalabny, A.; Bashouti, M.; Akavayov, B.; Shalev, G. Specific and label-free immunosensing of protein-protein interactions with silicon-based immunoFETs. Biosens. Bioelectron. 2019, 132, 143–161. [Google Scholar] [CrossRef] [PubMed]
- Danielson, E.; Sontakke, V.A.; Porkovich, A.J.; Wang, Z.; Kumar, P.; Ziadi, Z.; Yokobayashi, Y.; Sowwan, M. Graphene based field-effect transistor biosensors functionalized using gas-phase synthesized gold nanoparticles. Sens. Actuators B Chem. 2020, 320, 128432. [Google Scholar] [CrossRef]
- Kuznetsov, A.E.; Komarova, N.V.; Kuznetsov, E.V.; Andrianova, M.S.; Grudtsov, V.P.; Rybachek, E.N.; Puchnin, K.V.; Ryazantsev, D.V.; Saurov, A.N. Integration of a field effect transistor-based aptasensor under a hydrophobic membrane for bioelectronic nose applications. Biosens. Bioelectron. 2019, 129, 29–35. [Google Scholar] [CrossRef] [PubMed]
- Park, S.; Kim, M.; Kim, D.; Kang, S.H.; Lee, K.H.; Jeong, Y. Interfacial charge regulation of protein blocking layers in transistor biosensor for direct measurement in serum. Biosens. Bioelectron. 2020, 147, 111737. [Google Scholar] [CrossRef] [PubMed]
- Pletinck, A.; Van Biesen, W.; Dequidt, C.; Eloot, S. Transport of neutral IgG2 versus anionic IgG4 in PD: Implications on the electrokinetic model. BMC Nephrol. 2018, 19, 299. [Google Scholar] [CrossRef] [PubMed]
- Pillarisetty, R. Academic and industry research progress in germanium nanodevices. Nature 2011, 479, 324–328. [Google Scholar] [CrossRef]
- Jing, X.; Illarionov, Y.; Yalon, E.; Zhou, P.; Grasser, T.; Shi, Y.; Lanza, M. Engineering Field Effect Transistors with 2D Semiconducting Channels: Status and Prospects. Adv. Funct. Mater. 2020, 30, 1–21. [Google Scholar] [CrossRef]
- Jang, H.J.; Gu, J.G.; Cho, W.J. Sensitivity enhancement of amorphous InGaZnO thin film transistor based extended gate field-effect transistors with dual-gate operation. Sens. Actuators B Chem. 2013, 181, 880–884. [Google Scholar] [CrossRef]
- Guan, W.; Duan, X.; Reed, M.A. Highly specific and sensitive non-enzymatic determination of uric acid in serum and urine by extended gate field effect transistor sensors. Biosens. Bioelectron. 2014, 51, 225–231. [Google Scholar] [CrossRef]
- Purwidyantri, A.; Kamajaya, L.; Chen, C.-H.; Luo, J.-D.; Chiou, C.-C.; Tian, Y.-C.; Lin, C.-Y.; Yang, C.-M.; Lai, C.-S. A Colloidal Nanopatterning and Downscaling of a Highly Periodic Au Nanoporous EGFET Biosensor. J. Electrochem. Soc. 2018, 165, H3170–H3177. [Google Scholar] [CrossRef]
- Fohlerová, Z.; Turánek, J.; Skládal, P. The cell adhesion and cytotoxicity effects of the derivate of vitamin e compared for two cell lines using a piezoelectric biosensor. Sens. Actuators B Chem. 2012, 174, 153–157. [Google Scholar] [CrossRef]
- Bianco, M.; Vergara, D.; De Domenico, S.; Maffia, M.; Gaballo, A.; Arima, V. Quartz Crystal Microbalance as Cell-Based Biosensor to Detect and Study Cytoskeletal Alterations and Dynamics. Biotechnol. J. 2018, 13, 1700699. [Google Scholar] [CrossRef]
- Xu, L.; Wang, R.; Kelso, L.C.; Ying, Y.; Li, Y. A target-responsive and size-dependent hydrogel aptasensor embedded with QD fluorescent reporters for rapid detection of avian influenza virus H5N1. Sens. Actuators B Chem. 2016, 234, 98–108. [Google Scholar] [CrossRef]
- Jean, H.; Saha, T.; Tey, T.; Siang, W.; Wei, C. Quartz crystal microbalance-based biosensors as rapid diagnostic devices for infectious diseases. Biosens. Bioelectron. 2020, 168, 112513. [Google Scholar] [CrossRef]
- Fu, Y.Q.; Luo, J.K.; Nguyen, N.T.; Walton, A.J.; Flewitt, A.J.; Zu, X.T.; Li, Y.; McHale, G.; Matthews, A.; Iborra, E.; et al. Advances in piezoelectric thin films for acoustic biosensors, acoustofluidics and lab-on-chip applications. Prog. Mater. Sci. 2017, 89, 31–91. [Google Scholar] [CrossRef]
- Prabowo, B.A.; Purwidyantri, A.; Liu, K.-C.C. Surface Plasmon Resonance Optical Sensor: A Review on Light Source Technology. Biosensors 2018, 8, 80. [Google Scholar] [CrossRef] [PubMed]
- Taylor, A.B.; Zijlstra, P. Single-Molecule Plasmon Sensing: Current Status and Future Prospects. ACS Sens. 2017, 2, 1103–1122. [Google Scholar] [CrossRef]
- Long, Y.-T.; Jing, C. Localized Surface Plasmon Resonance based Nanobiosensors.; Springer: Berlin/Heidelberg, Germany, 2014; ISBN 978-3-642-54795-9. [Google Scholar] [CrossRef]
- Szunerits, S.; Spadavecchia, J.; Boukherroub, R. Surface plasmon resonance: Signal amplification using colloidal gold nanoparticles for enhanced sensitivity. Rev. Anal. Chem. 2014, 33, 153–164. [Google Scholar] [CrossRef]
- Lin, H.T.-H.; Yang, C.-K.; Lin, C.-C.; Wu, A.M.-H.; Wang, L.A.; Huang, N.-T. A Large-Area Nanoplasmonic Sensor Fabricated by Rapid Thermal Annealing Treatment for Label-Free and Multi-Point Immunoglobulin Sensing. Nanomaterials 2017, 7, 100. [Google Scholar] [CrossRef]
- Adegoke, O.; Morita, M.; Kato, T.; Ito, M.; Suzuki, T.; Park, E.Y. Localized surface plasmon resonance-mediated fluorescence signals in plasmonic nanoparticle-quantum dot hybrids for ultrasensitive Zika virus RNA detection via hairpin hybridization assays. Biosens. Bioelectron. 2017, 94, 513–522. [Google Scholar] [CrossRef]
- Gupta, A.K.; Hsu, C.-H.; Purwidyantri, A.; Prabowo, B.A.; Chiu, K.-P.; Chen, C.-H.; Tian, Y.-C.; Lai, C.-S. ZnO-Nanorod processed PC-SET as the light-harvesting model for plasmontronic fluorescence Sensor. Sens. Actuators B Chem. 2020, 307, 127597. [Google Scholar] [CrossRef]
- Su, S.; Sun, Q.; Gu, X.; Xu, Y.; Shen, J.; Zhu, D.; Chao, J.; Fan, C.; Wang, L. Two-dimensional nanomaterials for biosensing applications. TrAC Trends Anal. Chem. 2019, 119, 115610. [Google Scholar] [CrossRef]
- Wang, G.; Wang, Y.; Chen, L.; Choo, J. Nanomaterial-assisted aptamers for optical sensing. Biosens. Bioelectron. 2010, 25, 1859–1868. [Google Scholar] [CrossRef] [PubMed]
- Prabowo, B.A.; Purwidyantri, A.; Liu, B.; Lai, H.C.; Liu, K.C. Gold nanoparticle-assisted plasmonic enhancement for DNA detection on a graphene-based portable surface plasmon resonance sensor. Nanotechnology 2021, 32, 095503. [Google Scholar] [CrossRef] [PubMed]
- Rossi, G.; Real-Fernández, F.; Panza, F.; Barbetti, F.; Pratesi, F.; Rovero, P.; Migliorini, P. Biosensor analysis of anti-citrullinated protein/peptide antibody affinity. Anal. Biochem. 2014, 465C, 96–101. [Google Scholar] [CrossRef]
- Gopinath, S.C.B. Biosensing applications of surface plasmon resonance-based Biacore technology. Sens. Actuators B 2010, 150, 722–733. [Google Scholar] [CrossRef]
- Guner, H.; Ozgur, E.; Kokturk, G.; Celik, M.; Esen, E.; Topal, A.E.; Ayas, S.; Uludag, Y.; Elbuken, C.; Dana, A. A smartphone based surface plasmon resonance imaging (SPRi) platform for on-site biodetection. Sens. Actuators B Chem. 2017, 239, 571–577. [Google Scholar] [CrossRef]
- Wuytens, P.C.; Skirtach, A.G.; Baets, R. On-chip surface-enhanced Raman spectroscopy using nanosphere-lithography patterned antennas on silicon nitride waveguides. Opt. Express 2017, 25, 12926–12934. [Google Scholar] [CrossRef] [PubMed]
- Anker, J.N.; Hall, W.P.; Lyandres, O.; Shah, N.C.; Zhao, J.; Van Duyne, R.P. Biosensing with plasmonic nanosensors. Nat. Mater. 2008, 7, 442–453. [Google Scholar] [CrossRef]
- Zheng, Z.; Cong, S.; Gong, W.; Xuan, J.; Li, G.; Lu, W.; Geng, F.; Zhao, Z. Semiconductor SERS enhancement enabled by oxygen incorporation. Nat. Commun. 2017, 8, 1993. [Google Scholar] [CrossRef] [PubMed]
- Purwidyantri, A.; Hsu, C.-H.H.; Yang, C.-M.M.; Prabowo, B.A.; Tian, Y.-C.C.; Lai, C.-S.S. Plasmonic nanomaterial structuring for SERS enhancement. RSC Adv. 2019, 9, 4982–4992. [Google Scholar] [CrossRef]
- Köker, T.; Tang, N.; Tian, C.; Zhang, W.; Wang, X.; Martel, R.; Pinaud, F. Cellular imaging by targeted assembly of hot-spot SERS and photoacoustic nanoprobes using split-fluorescent protein scaffolds. Nat. Commun. 2018, 9, 607. [Google Scholar] [CrossRef]
- Gong, T.; Cui, Y.; Goh, D.; Voon, K.K.; Shum, P.P.; Humbert, G.; Auguste, J.L.; Dinh, X.Q.; Yong, K.T.; Olivo, M. Highly sensitive SERS detection and quantification of sialic acid on single cell using photonic-crystal fiber with gold nanoparticles. Biosens. Bioelectron. 2015, 64, 227–233. [Google Scholar] [CrossRef]
- Kang, M.; Park, S.-G.G.; Jeong, K.-H.H. Repeated Solid-state Dewetting of Thin Gold Films for Nanogap-rich Plasmonic Nanoislands. Sci. Rep. 2015, 5, 14790. [Google Scholar] [CrossRef] [PubMed]
- Kim, D.; Ko, Y.; Kwon, G.; Choo, Y.-M.; You, J. Low-cost, high-performance plasmonic nanocomposites for hazardous chemical detection using surface enhanced Raman scattering. Sens. Actuators B Chem. 2018, 274, 30–36. [Google Scholar] [CrossRef]
- Yang, S.; Dai, X.; Stogin, B.B.; Wong, T.-S. Ultrasensitive surface-enhanced Raman scattering detection in common fluids. Proc. Natl. Acad. Sci. USA 2015, 113, 268–273. [Google Scholar] [CrossRef]
- Zhang, Q.; Li, X.; Ma, Q.; Zhang, Q.; Bai, H.; Yi, W.; Liu, J.; Han, J.; Xi, G. A metallic molybdenum dioxide with high stability for surface enhanced Raman spectroscopy. Nat. Commun. 2017, 8, 14903. [Google Scholar] [CrossRef]
- Liu, N.; Xu, Z.; Morrin, A.; Luo, X. Low fouling strategies for electrochemical biosensors targeting disease biomarkers. Anal. Methods 2019, 11, 702–711. [Google Scholar] [CrossRef]
- Liu, B.; Liu, X.; Shi, S.; Huang, R.; Su, R.; Qi, W.; He, Z. Design and mechanisms of antifouling materials for surface plasmon resonance sensors. Acta Biomater. 2016, 40, 100–118. [Google Scholar] [CrossRef]
- Qian, H.; Huang, Y.; Duan, X.; Wei, X.; Fan, Y.; Gan, D.; Yue, S.; Cheng, W.; Chen, T. Fiber optic surface plasmon resonance biosensor for detection of PDGF-BB in serum based on self-assembled aptamer and antifouling peptide monolayer. Biosens. Bioelectron. 2019, 140, 111350. [Google Scholar] [CrossRef]
- Zhang, J.; Yuan, Y.; biXie, S.; Chai, Y.; Yuan, R. Amplified amperometric aptasensor for selective detection of protein using catalase-functional DNA-PtNPs dendrimer as a synergetic signal amplification label. Biosens. Bioelectron. 2014, 60, 224–230. [Google Scholar] [CrossRef]
- Park, J.-W.; Jin Lee, S.; Choi, E.-J.; Kim, J.; Song, J.-Y.; Bock Gu, M. An ultra-sensitive detection of a whole virus using dual aptamers developed by immobilization-free screening. Biosens. Bioelectron. 2014, 51, 324–329. [Google Scholar] [CrossRef]
- Chang, T.-C.; Wu, C.-C.; Wang, S.-C.; Chau, L.-K.; Hsieh, W.-H. Using a fiber optic particle plasmon resonance biosensor to determine kinetic constants of antigen-antibody binding reaction. Anal. Chem. 2013, 85, 245–250. [Google Scholar] [CrossRef] [PubMed]
- Ali, M.M.; Kang, D.-K.; Tsang, K.; Fu, M.; Karp, J.M.; Zhao, W. Cell-surface sensors: Lighting the cellular environment. Wiley Interdiscip. Rev. Nanomed. Nanobiotechnol. 2012, 4, 547–561. [Google Scholar] [CrossRef]
- Chen, Y.; Ren, R.; Pu, H.; Chang, J.; Mao, S.; Chen, J. Field-effect transistor biosensors with two-dimensional black phosphorus nanosheets. Biosens. Bioelectron. 2017, 89, 505–510. [Google Scholar] [CrossRef] [PubMed]
- Naylor, C.H.; Kybert, N.J.; Schneier, C.; Xi, J.; Romero, G.; Saven, G.; Liu, R.; Johnson, A.T.C. Scalable Production of Molybdenum Disul fi de Based Biosensors. ACS Nano 2016, 10, 6173–6179. [Google Scholar] [CrossRef]
- Gao, X.P.A.; Zheng, G.; Lieber, C.M. Subthreshold Regime has the Optimal Sensitivity for Nanowire FET Biosensors. Nano Lett. 2010, 10, 547–552. [Google Scholar] [CrossRef]
- Mao, S.; Chang, J.; Pu, H.; Lu, G.; He, Q.; Zhang, H.; Chen, J. Two-dimensional nanomaterial-based field-effect transistors for chemical and biological sensing. Chem. Soc. Rev. 2017, 46, 6872–6904. [Google Scholar] [CrossRef]
- Comini, E.; Baratto, C.; Faglia, G.; Ferroni, M.; Vomiero, A.; Sberveglieri, G. Quasi-one dimensional metal oxide semiconductors: Preparation, characterization and application as chemical sensors. Prog. Mater. Sci. 2009, 54, 1–67. [Google Scholar] [CrossRef]
- Ramnani, P.; Saucedo, N.M.; Mulchandani, A. Carbon nanomaterial-based electrochemical biosensors for label-free sensing of environmental pollutants. Chemosphere 2016, 143, 85–98. [Google Scholar] [CrossRef] [PubMed]
- Afsahi, S.; Lerner, M.B.; Goldstein, J.M.; Lee, J.; Tang, X.; Bagarozzi, D.A.; Pan, D.; Locascio, L.; Walker, A.; Barron, F.; et al. Novel graphene-based biosensor for early detection of Zika virus infection. Biosens. Bioelectron. 2018, 100, 85–88. [Google Scholar] [CrossRef]
- Xu, G.; Abbott, J.; Qin, L.; Yeung, K.Y.M.; Song, Y.; Yoon, H.; Kong, J.; Ham, D. Electrophoretic and field-effect graphene for all-electrical DNA array technology. Nat. Commun. 2014, 5, 4866. [Google Scholar] [CrossRef] [PubMed]
- Mao, S.; Lu, G.; Yu, K.; Bo, Z.; Chen, J. Specific protein detection using thermally reduced graphene oxide sheet decorated with gold nanoparticle-antibody conjugates. Adv. Mater. 2010, 22, 3521–3526. [Google Scholar] [CrossRef] [PubMed]
- Purwidyantri, A.; Domingues, T.; Guerreiro, J.R.; Ipatov, A.; Abreu, C.M.; Martins, M.; Alpuim, P.; Prado, M. Influence of the Electrolyte Salt Concentration on DNA Detection with Graphene Transistors. Biosensors 2021, 11, 24. [Google Scholar] [CrossRef] [PubMed]
- Sarkar, D.; Liu, W.; Xie, X.; Anselmo, A.C.; Mitragotri, S.; Banerjee, K. MoS2 field-effect transistor for next-generation label-free biosensors. ACS Nano 2014, 8, 3992–4003. [Google Scholar] [CrossRef] [PubMed]
- Lee, D.-W.; Lee, J.; Sohn, I.Y.; Kim, B.-Y.; Son, Y.M.; Bark, H.; Jung, J.; Choi, M.; Kim, T.H.; Lee, C.; et al. Field-effect transistor with a chemically synthesized MoS2 sensing channel for label-free and highly sensitive electrical detection of DNA hybridization. Nano Res. 2015, 8, 2340–2350. [Google Scholar] [CrossRef]
- Wang, H.; Sun, J.; Lu, L.; Yang, X.; Xia, J.; Zhang, F.; Wang, Z. Competitive electrochemical aptasensor based on a cDNA-ferrocene/MXene probe for detection of breast cancer marker Mucin1. Anal. Chim. Acta 2020, 1094, 18–25. [Google Scholar] [CrossRef]
- Lim, J.H.; Park, J.; Ahn, J.H.; Jin, H.J.; Hong, S.; Park, T.H. A peptide receptor-based bioelectronic nose for the real-time determination of seafood quality. Biosens. Bioelectron. 2013, 39, 244–249. [Google Scholar] [CrossRef]
- Lee, D.; Cui, T. Low-cost, transparent, and flexible single-walled carbon nanotube nanocomposite based ion-sensitive field-effect transistors for pH/glucose sensing. Biosens. Bioelectron. 2010, 25, 2259–2264. [Google Scholar] [CrossRef]
- Park, S.J.; Song, H.S.; Kwon, O.S.; Chung, J.H.; Lee, S.H.; An, J.H. Human dopamine receptor nanovesicles for gate-potential modulators in high-performance field-effect transistor biosensors. Sci. Rep. 2014, 4, 4342. [Google Scholar] [CrossRef] [PubMed]
- Jun, J.; Lee, J.S.; Shin, D.H.; Jang, J. Aptamer-Functionalized Hybrid Carbon Nano fi ber FET-Type Electrode for a Highly Sensitive and Selective Platelet-Derived Growth Factor Biosensor. Appl. Mater. Interface 2014, 6, 13859–13865. [Google Scholar] [CrossRef]
- Chen, P.; Shu, X.; Cao, H.; Sugden, K. High-sensitivity and large-dynamic-range refractive index sensors employing weak composite Fabry-Perot cavities. Opt. Lett. 2017, 42, 3145–3148. [Google Scholar] [CrossRef]
- Prabowo, B.A.; Hermida, I.D.P.; Manurung, R.V.; Purwidyantri, A.; Liu, K.-C. Nano-film aluminum-gold for ultra-high dynamic-range surface plasmon resonance chemical sensor. Front. Optoelectron. 2019, 12, 286–295. [Google Scholar] [CrossRef]
- Chou, Y.N.; Sun, F.; Hung, H.C.; Jain, P.; Sinclair, A.; Zhang, P.; Bai, T.; Chang, Y.; Wen, T.C.; Yu, Q.; et al. Ultra-low fouling and high antibody loading zwitterionic hydrogel coatings for sensing and detection in complex media. Acta Biomater. 2016, 40, 31–37. [Google Scholar] [CrossRef] [PubMed]
- Singha, S.S.; Mondal, S.; Bhattacharya, T.S.; Das, L.; Sen, K.; Satpati, B.; Das, K.; Singha, A. Au nanoparticles functionalized 3D-MoS2 nanoflower: An efficient SERS matrix for biomolecule sensing. Biosens. Bioelectron. 2018, 119, 10–17. [Google Scholar] [CrossRef] [PubMed]
- Purwidyantri, A.; Chen, C.; Chen, L.; Chen, C.; Luo, J.; Chiou, C.; Tian, Y.; Lin, C. Speckled ZnO Nanograss Electrochemical Sensor for Staphylococcus epidermidis Detection. J. Electrochem. Soc. 2017, 164, B205–B211. [Google Scholar] [CrossRef]
- Prabowo, B.A. The Trade-Off Performance of Surface Plasmon Resonance Sensing Utilizing Thin Layer Oxide under the Metal Layer. In Proceedings of the 2019 International Conference on Radar, Antenna, Microwave, Electronics, and Telecommunications (ICRAMET), Serpong, Indonesia, 23–24 October 2019. [Google Scholar]
- Fernandes, E.; Sobrino, T.; Martins, V.C.; Lopez-loureiro, I.; Campos, F.; Germano, J.; Rodríguez-Pérez, M.; Cardoso, S.; Petrovykh, D.Y.; Castillo, J.; et al. Point-of-care quantification of serum cellular fibronectin levels for stratification of ischemic stroke patients. Nanomed. Nanotechnol. Biol. Med. 2020, 30, 102287. [Google Scholar] [CrossRef] [PubMed]
- Kamat, V.; Rafique, A. Designing binding kinetic assay on the bio-layer interferometry (BLI) biosensor to characterize antibody-antigen interactions. Anal. Biochem. 2017, 536, 16–31. [Google Scholar] [CrossRef]
- Sharma, S.; Byrne, H.; O’Kennedy, R.J. Antibodies and antibody-derived analytical biosensors. Essays Biochem. 2016, 60, 9–18. [Google Scholar] [CrossRef] [PubMed]
- Long, G.L.; Winefordner, J.D. Limit of Detection a Closer Look at the IUPAC Definition. Anal. Chem. 1983, 55, 712A–724A. [Google Scholar] [CrossRef]
- Currie, L.A. Nomenclature in evaluation of analytical methods including detection and quantification capabilities. Adapted from the International Union of Pure and Applied Chemistry (IUPAC) document “Nomenclature in Evaluation of Analytical Methods including Detection. Anal. Chim. Acta 1999, 391, 105–126. [Google Scholar] [CrossRef]
- Stroot, J.M.; Leach, K.M.; Stroot, P.G.; Lim, D.V. Capture antibody targeted fluorescence in situ hybridization (CAT-FISH): Dual labeling allows for increased specificity in complex samples. J. Microbiol. Methods 2012, 88, 275–284. [Google Scholar] [CrossRef] [PubMed]
- Duman, M.; Piskin, E. Detection of Mycobacterium tuberculosis complex and Mycobacterium gordonae on the same portable surface plasmon resonance sensor. Biosens. Bioelectron. 2010, 26, 908–912. [Google Scholar] [CrossRef] [PubMed]
- Chauhan, D.; Nirbhaya, V.; Srivastava, C.M.; Chandra, R.; Kumar, S. Nanostructured transition metal chalcogenide embedded on reduced graphene oxide based highly efficient biosensor for cardiovascular disease detection. Microchem. J. 2020, 155, 104697. [Google Scholar] [CrossRef]
- Deng, K.; Xiang, Y.; Zhang, L.; Chen, Q.; Fu, W. An aptamer-based biosensing platform for highly sensitive detection of platelet-derived growth factor via enzyme-mediated direct electrochemistry. Anal. Chim. Acta 2013, 759, 61–65. [Google Scholar] [CrossRef]
- Xie, B.P.; Qiu, G.H.; Hu, P.P.; Liang, Z.; Liang, Y.M.; Sun, B.; Bai, L.P.; Jiang, Z.H.; Chen, J.X. Simultaneous detection of Dengue and Zika virus RNA sequences with a three-dimensional Cu-based zwitterionic metal–organic framework, comparison of single and synchronous fluorescence analysis. Sens. Actuators B Chem. 2018, 254, 1133–1140. [Google Scholar] [CrossRef]
- Sin, M.-C.; Chen, S.-H.; Chang, Y. Hemocompatibility of zwitterionic interfaces and membranes. Polym. J. 2014, 46, 436–443. [Google Scholar] [CrossRef]
- Chen, H.; Zhang, M.; Yang, J.; Zhao, C.; Hu, R.; Chen, Q.; Chang, Y.; Zheng, J. Synthesis and characterization of antifouling poly(N-acryloylaminoethoxyethanol) with ultralow protein adsorption and cell attachment. Langmuir 2014, 30, 10398–10409. [Google Scholar] [CrossRef]
- Riedel, T.; Rodriguez-Emmenegger, C.; de los Santos Pereira, A.; Bědajánková, A.; Jinoch, P.; Boltovets, P.M.; Brynda, E. Diagnosis of Epstein-Barr virus infection in clinical serum samples by an SPR biosensor assay. Biosens. Bioelectron. 2014, 55, 278–284. [Google Scholar] [CrossRef]
- Špringer, T.; Homola, J. Biofunctionalized gold nanoparticles for SPR-biosensor-based detection of CEA in blood plasma. Anal. Bioanal. Chem. 2012, 404, 2869–2875. [Google Scholar] [CrossRef]
- Liu, G.; Gurung, A.S.; Qiu, W. Lateral flow aptasensor for simultaneous detection of platelet-derived growth factor-BB (PDGF-BB) and thrombin. Molecules 2019, 24, 756. [Google Scholar] [CrossRef] [PubMed]
- Chen, J.; Kong, L.; Sun, X.; Feng, J.; Chen, Z.; Fan, D.; Wei, Q. Ultrasensitive photoelectrochemical immunosensor of cardiac troponin I detection based on dual inhibition effect of Ag@Cu2O core-shell submicron-particles on CdS QDs sensitized TiO2 nanosheets. Biosens. Bioelectron. 2018, 117, 340–346. [Google Scholar] [CrossRef]
- Averseng, O.; Hagège, A.; Taran, F.; Vidaud, C. Surface plasmon resonance for rapid screening of uranyl affine proteins. Anal. Chem. 2010, 82, 9797–9802. [Google Scholar] [CrossRef] [PubMed]
- Bartlett, J.W.; Frost, C. Reliability, repeatability and reproducibility: Analysis of measurement errors in continuous variables. Ultrasound Obstet. Gynecol. 2008, 31, 466–475. [Google Scholar] [CrossRef]
- Cipriani, V.; Lorés-Motta, L.; He, F.; Fathalla, D.; Tilakaratna, V.; McHarg, S.; Bayatti, N.; Acar, İ.E.; Hoyng, C.B.; Fauser, S.; et al. Increased circulating levels of Factor H-Related Protein 4 are strongly associated with age-related macular degeneration. Nat. Commun. 2020, 11, 778. [Google Scholar] [CrossRef] [PubMed]
- Gu, X.; Trujillo, M.J.; Olson, J.E.; Camden, J.P. SERS Sensors: Recent Developments and a Generalized Classification Scheme Based on the Signal Origin. Annu. Rev. Anal. Chem. 2018, 11, 147–169. [Google Scholar] [CrossRef]
- Prabowo, B.A.; Chang, Y.-F.F.; Lai, H.-C.C.; Alom, A.; Pal, P.; Lee, Y.-Y.Y.; Chiu, N.-F.F.; Hatanaka, K.; Su, L.-C.C.; Liu, K.-C.C. Rapid screening of Mycobacterium tuberculosis complex (MTBC) in clinical samples by a modular portable biosensor. Sens. Actuators B Chem. 2018, 254, 742–748. [Google Scholar] [CrossRef]
- Prabowo, B.A.; Wang, R.Y.L.L.; Secario, M.K.; Ou, P.-T.T.; Alom, A.; Liu, J.-J.J.; Liu, K.-C.C. Rapid detection and quantification of Enterovirus 71 by a portable surface plasmon resonance biosensor. Biosens. Bioelectron. 2017, 92, 186–191. [Google Scholar] [CrossRef]
- Chen, H.; Wang, X. Study on the performance promotion of the surface plasmon resonance analytical system. Instrum. Sci. Technol. 2012, 40, 226–237. [Google Scholar] [CrossRef]
- Wang, X.; Dong, L.; Zhan, S. Without-baseline centroid algorithm for surface plasmon resonance spectra. Chin. J. Sens. Actuators 2012, 25, 365–369. [Google Scholar] [CrossRef]
- Dong, L.; Yin, W.; Ma, W.; Zhang, L.; Jia, S. High-sensitivity, large dynamic range, auto-calibration methane optical sensor using a short confocal Fabry-Perot cavity. Sens. Actuators B Chem. 2007, 127, 350–357. [Google Scholar] [CrossRef]
- Atkinson, A.J.; Colburn, W.A.; DeGruttola, V.G.; DeMets, D.L.; Downing, G.J.; Hoth, D.F.; Oates, J.A.; Peck, C.C.; Schooley, R.T.; Spilker, B.A.; et al. Biomarkers and surrogate endpoints: Preferred definitions and conceptual framework. Clin. Pharmacol. Ther. 2001, 69, 89–95. [Google Scholar] [CrossRef]
- Strimbu, K.; Tavel, J.A. What are biomarkers? Curr. Opin. HIV AIDS 2010, 5, 463–466. [Google Scholar] [CrossRef] [PubMed]
- Moroncini, G.; Cuccioloni, M.; Mozzicafreddo, M.; Pozniak, K.N.; Grieco, A.; Paolini, C.; Tonnini, C.; Spadoni, T.; Svegliati, S.; Funaro, A.; et al. Characterization of binding and quantification of human autoantibodies to PDGFRα using a biosensor-based approach. Anal. Biochem. 2017, 528, 26–33. [Google Scholar] [CrossRef][Green Version]
- Yakhno, T.; Sanin, A.; Pelyushenko, A.; Kazakov, V.; Shaposhnikova, O.; Chernov, A.; Yakhno, V.; Vacca, C.; Falcione, F.; Johnson, B. Uncoated quartz resonator as a universal biosensor. Biosens. Bioelectron. 2007, 22, 2127–2131. [Google Scholar] [CrossRef][Green Version]
- Babaki, M.K.Z.; Soleimanpour, S.; Rezaee, S.A. Antigen 85 complex as a powerful Mycobacterium tuberculosis immunogene: Biology, immune-pathogenicity, applications in diagnosis, and vaccine design. Microb. Pathog. 2017, 112, 20–29. [Google Scholar] [CrossRef]
- Rodríguez, J.A.; Sobrino, T.; Orbe, J.; Purroy, A.; Martínez-Vila, E.; Castillo, J.; Páramo, J.A. Prometalloproteinase-10 is associated with brain damage and clinical outcome in acute ischemic stroke. J. Thromb. Haemost. 2013, 11, 1464–1473. [Google Scholar] [CrossRef]
- Saberian-Borujeni, M.; Johari-Ahar, M.; Hamzeiy, H.; Barar, J.; Omidi, Y. Nanoscaled aptasensors for multi-analyte sensing. BioImpacts 2014, 4, 205–215. [Google Scholar] [CrossRef]
- Sefah, K.; Phillips, J.A.; Xiong, X.; Meng, L.; Van Simaeys, D.; Chen, H.; Martin, J.; Tan, W. Nucleic acid aptamers for biosensors and bio-analytical applications. Analyst 2009, 134, 1765–1775. [Google Scholar] [CrossRef] [PubMed]
- Oyejide, L.; Mendes, O.R.; Mikaelian, I. Molecular Pathology: Applications in Nonclinical Drug Development. In A Comprehensive Guide to Toxicology in Nonclinical Drug Development; Elsevier Inc.: Amsterdam, The Netherlands, 2017; pp. 407–445. ISBN 9780128036204. [Google Scholar] [CrossRef]
- Lee, E.Y.; Kulkarni, R.P. Circulating biomarkers predictive of tumor response to cancer immunotherapy. Expert Rev. Mol. Diagn. 2019, 19, 895–904. [Google Scholar] [CrossRef]
- Rodríguez-Yáñez, M.; Sobrino, T.; Arias, S.; Vázquez-Herrero, F.; Brea, D.; Blanco, M.; Leira, R.; Castellanos, M.; Serena, J.; Vivancos, J.; et al. Early biomarkers of clinical-diffusion mismatch in acute ischemic stroke. Stroke 2011, 42, 2813–2818. [Google Scholar] [CrossRef]
- Shaqdan, K.; Aran, S.; Thrall, J.; Abujudeh, H. Incidence of contrast medium extravasation for CT and MRI in a large academic medical centre: A report on 502,391 injections. Clin. Radiol. 2014, 69, 1264–1272. [Google Scholar] [CrossRef]
- Seher, A.; Nicke, J.; Mueller, T.D.; Kneitz, S.; Gebhardt, S.; Vehn, T.M.T.; Schlunck, G.; Sebald, W. Gene expression profiling of connective tissue growth factor (CTGF) stimulated primary human tenon fibroblasts reveals an inflammatory and wound healing response in vitro. Mol. Vis. 2011, 17, 53–62. [Google Scholar] [PubMed]
- Green, N.S.; Norton, M.L. Interactions of DNA with graphene and sensing applications of graphene field-effect transistor devices: A review. Anal. Chim. Acta 2015, 853, 127–142. [Google Scholar] [CrossRef]
- Yu, Y.; Su, G.; Zhu, H.; Zhu, Q.; Chen, Y.; Xu, B.; Li, Y.; Zhang, W. Proximity hybridization-mediated isothermal exponential amplification for ultrasensitive electrochemical protein detection. Int. J. Nanomed. 2017, 12, 5903–5914. [Google Scholar] [CrossRef]
- Razmi, N.; Baradaran, B.; Hejazi, M.; Hasanzadeh, M.; Mosafer, J.; Mokhtarzadeh, A.; de la Guardia, M. Recent advances on aptamer-based biosensors to detection of platelet-derived growth factor. Biosens. Bioelectron. 2018, 113, 58–71. [Google Scholar] [CrossRef] [PubMed]
- Hong, L.; Zhou, F.; Shi, D.; Zhang, X.; Wang, G. Portable aptamer biosensor of platelet-derived growth factor-BB using a personal glucose meter with triply amplified. Biosens. Bioelectron. 2017, 95, 152–159. [Google Scholar] [CrossRef]
- Sameiyan, E.; Bagheri, E.; Ramezani, M.; Alibolandi, M.; Abnous, K.; Taghdisi, S.M. DNA origami-based aptasensors. Biosens. Bioelectron. 2019, 143, 111662. [Google Scholar] [CrossRef]
- Bagheri, E.; Abnous, K.; Alibolandi, M.; Ramezani, M.; Taghdisi, S.M. Triple-helix molecular switch-based aptasensors and DNA sensors. Biosens. Bioelectron. 2018, 111, 1–9. [Google Scholar] [CrossRef]
- Rifai, N.; Gillette, M.A.; Carr, S.A. Protein biomarker discovery and validation: The long and uncertain path to clinical utility. Nat. Biotechnol. 2006, 24, 971–983. [Google Scholar] [CrossRef]
- Gilgunn, S.; Conroy, P.J.; Saldova, R.; Rudd, P.M.; O’Kennedy, R.J. Aberrant PSA glycosylation—A sweet predictor of prostate cancer. Nat. Rev. Urol. 2013, 10, 99–107. [Google Scholar] [CrossRef] [PubMed]
- Tzouvadaki, I.; Jolly, P.; Lu, X.; Ingebrandt, S.; De Micheli, G.; Estrela, P.; Carrara, S. Label-free ultrasensitive memristive aptasensor. Nano Lett. 2016, 16, 4472–4476. [Google Scholar] [CrossRef]
- Yang, K.; Hu, Y.; Dong, N.; Zhu, G.; Zhu, T.; Jiang, N. A novel SERS-based magnetic aptasensor for prostate specific antigen assay with high sensitivity. Biosens. Bioelectron. 2017, 94, 286–291. [Google Scholar] [CrossRef] [PubMed]
- Su, L.; Zou, L.; Fong, C.C.; Wong, W.L.; Wei, F.; Wong, K.Y.; Wu, R.S.S.; Yang, M. Detection of cancer biomarkers by piezoelectric biosensor using PZT ceramic resonator as the transducer. Biosens. Bioelectron. 2013, 46, 155–161. [Google Scholar] [CrossRef]
- Su, L.-C.; Chen, R.-C.; Li, Y.-C.; Chang, Y.-F.; Lee, Y.-J.; Lee, C.-C.; Chou, C. Detection of prostate-specific antigen with a paired surface plasma wave biosensor. Anal. Chem. 2010, 82, 3714–3718. [Google Scholar] [CrossRef]
- Cao, C.; Kim, J.P.; Kim, B.W.; Chae, H.; Yoon, H.C.; Yang, S.S.; Sim, S.J. A strategy for sensitivity and specificity enhancements in prostate specific antigen-alpha(1)-antichymotrypsin detection based on surface plasmon resonance. Biosens. Bioelectron. 2006, 21, 2106–2113. [Google Scholar] [CrossRef] [PubMed]
- Sisinni, L.; Landriscina, M. The Role of Human Chorionic Gonadotropin as Tumor Marker: Biochemical and Clinical Aspects. Adv. Exp. Med. Biol. 2015, 867, 229–244. [Google Scholar] [CrossRef]
- Liu, D.; Wu, F.; Zhou, C.; Shen, H.; Yuan, H.; Du, Z.; Ma, L.; Li, L.S. Multiplexed immunoassay biosensor for the detection of serum biomarkers - β-HCG and AFP of Down Syndrome based on photoluminescent water-soluble CdSe/ZnS quantum dots. Sens. Actuators B Chem. 2013, 186, 235–243. [Google Scholar] [CrossRef]
- Matsui, H.; Iitsuka, Y.; Yamazawa, K.; Tanaka, N.; Mitsuhashi, A.; Seki, K.; Sekiya, S. Criteria for Initiating Chemotherapy in Patients after Evacuation of Hydatidiform Mole. Tumor Biol. 2003, 24, 140–146. [Google Scholar] [CrossRef] [PubMed]
- Lei, H.; Wang, K.; Ji, X.; Cui, D. Contactless measurement of magnetic nanoparticles on lateral flow strips using tunneling magnetoresistance (TMR) sensors in differential configuration. Sensors (Switzerland) 2016, 16, 2130. [Google Scholar] [CrossRef]
- Khodadadi, M.; Chang, L.; Trabuco, J.R.C.; Vu, B.V.; Kourentzi, K.; Willson, R.C.; Litvinov, D. PCB-based magnetometer as a platform for quantification of lateral-flow assays. Sensors (Switzerland) 2019, 19, 5433. [Google Scholar] [CrossRef]
- Yan, W.; Wang, K.; Xu, H.; Huo, X.; Jin, Q.; Cui, D. Machine Learning Approach to Enhance the Performance of MNP-Labeled Lateral Flow Immunoassay. Nano-Micro Lett. 2019, 11, 7. [Google Scholar] [CrossRef]
- Špringer, T.; Piliarik, M.; Homola, J. Real-time monitoring of biomolecular interactions in blood plasma using a surface plasmon resonance biosensor. Anal. Bioanal. Chem. 2010, 398, 1955–1961. [Google Scholar] [CrossRef] [PubMed]
- Chang, C.C.; Chen, C.P.; Lee, C.H.; Chen, C.Y.; Lin, C.W. Colorimetric detection of human chorionic gonadotropin using catalytic gold nanoparticles and a peptide aptamer. Chem. Commun. 2014, 50, 14443–14446. [Google Scholar] [CrossRef]
- Chung, N.N.; Hamlin, R.E.; Zwang, T.J.; Johal, M.S. Human chorionic gonadotropin interactions with immobilized anti-hCG studied by quartz-crystal microbalance with dissipation monitoring. J. Biomed. Mater. Res. -Part A 2012, 100A, 1600–1604. [Google Scholar] [CrossRef] [PubMed]
- Liao, L.-W.; Chen, P.-H.; Wang, Y.-L. Electrical Double Layer Gated Field Effect Transistor Biosensors for the Quantitative Detection of Beta-Human Chorionic Gonadotropin. ECS Trans. 2019, 92, 57–60. [Google Scholar] [CrossRef]
- Wu, A.H.B.; Agee, S.J.; Lu, Q.A.; Todd, J.; Jaffe, A.S. Specificity of a High-Sensitivity Cardiac Troponin I Assay Using Single-Molecule–Counting Technology. Clin. Chem. 2009, 55, 196–198. [Google Scholar] [CrossRef]
- Kavsak, P.A.; Wang, X.; Ko, D.T.; MacRae, A.R.; Jaffe, A.S. Short- and long-term risk stratification using a next-generation, high-sensitivity research cardiac troponin I (hs-cTnI) assay in an Emergency Department Chest Pain Population. Clin. Chem. 2009, 55, 1809–1815. [Google Scholar] [CrossRef]
- Liu, J.; Chen, D.; Wang, P.; Song, G.; Zhang, X.; Li, Z.; Wang, Y.; Wang, J.; Yang, J. A microfabricated thickness shear mode electroacoustic resonator for the label-free detection of cardiac troponin in serum. Talanta 2020, 215, 120890. [Google Scholar] [CrossRef]
- Patra, A.; Ding, T.; Hong, M.; Richards, A.M.; Wong, T.I.; Zhou, X.; Drum, C.L. Using extraordinary optical transmission to quantify cardiac biomarkers in human serum. J. Vis. Exp. 2017, 2017, 55597. [Google Scholar] [CrossRef] [PubMed]
- Krupin, O.; Berini, P. Long-range surface plasmon-polariton waveguide biosensors for human cardiac troponin I detection. Sensors (Switzerland) 2019, 19, 631. [Google Scholar] [CrossRef]
- Han, X.; Shokri Kojori, H.; Leblanc, R.M.; Kim, S.J. Ultrasensitive Plasmonic Biosensors for Real-Time Parallel Detection of Alpha-L-Fucosidase and Cardiac-Troponin-I in Whole Human Blood. Anal. Chem. 2018, 90, 7795–7799. [Google Scholar] [CrossRef]
- Wu, Q.; Sun, Y.; Zhang, D.; Li, S.; Zhang, Y.; Ma, P.; Yu, Y.; Wang, X.; Song, D. Ultrasensitive magnetic field-assisted surface plasmon resonance immunoassay for human cardiac troponin I. Biosens. Bioelectron. 2017, 96, 288–293. [Google Scholar] [CrossRef] [PubMed]
- Liyanage, T.; Sangha, A.; Sardar, R. Achieving biosensing at attomolar concentrations of cardiac troponin T in human biofluids by developing a label-free nanoplasmonic analytical assay. Analyst 2017, 142, 2442–2450. [Google Scholar] [CrossRef] [PubMed]
- Wu, Q.; Li, S.; Sun, Y.; Wang, J. Hollow gold nanoparticle-enhanced SPR based sandwich immunoassay for human cardiac troponin I. Microchim. Acta 2017, 184, 2395–2402. [Google Scholar] [CrossRef]
- Sarangadharan, I.; Wang, S.-L.; Sukesan, R.; Chen, P.-C.; Dai, T.-Y.; Pulikkathodi, A.K.; Hsu, C.-P.; Chiang, H.-H.K.; Liu, L.Y.-M.; Wang, Y.-L. Single Drop Whole Blood Diagnostics: Portable Biomedical Sensor for Cardiac Troponin i Detection. Anal. Chem. 2018, 90, 2867–2874. [Google Scholar] [CrossRef]
- Sarangadharan, I.; Regmi, A.; Chen, Y.-W.; Hsu, C.-P.; Chen, P.-C.; Chang, W.-H.; Lee, G.-Y.; Chyi, J.-I.; Shiesh, S.-C.; Lee, G.-B.; et al. High sensitivity cardiac troponin I detection in physiological environment using AlGaN/GaN High Electron Mobility Transistor (HEMT) Biosensors. Biosens. Bioelectron. 2018, 100, 282–289. [Google Scholar] [CrossRef] [PubMed]
- Sarangadharan, I.; Wang, S.-L.; Sukesan, R.; Tai, T.-Y.; Pulikkathodi, A.K.; Hsu, C.-P.; Wang, Y.-L. Whole blood cvd diagnostics using portable fet biosensor system. ECS Trans. 2018, 85, 25–35. [Google Scholar] [CrossRef]
- Huang, S.W.; Sarangadharan, I.; Chen, P.H.; Kuo, W.C.; Wang, Y.L. Study of stability and sensitivity of cardiac troponin I based on FET sensor. ECS Trans. 2019, 89, 57–63. [Google Scholar] [CrossRef]
- Cai, B.; Huang, L.; Zhang, H.; Sun, Z.; Zhang, Z.; Zhang, G.J. Gold nanoparticles-decorated graphene field-effect transistor biosensor for femtomolar MicroRNA detection. Biosens. Bioelectron. 2015, 74, 329–334. [Google Scholar] [CrossRef] [PubMed]
- Duffy, M.J. Biomarkers for prostate cancer: Prostate-specific antigen and beyond. Clin. Chem. Lab. Med. 2020, 58, 326–339. [Google Scholar] [CrossRef]
- Afrǎsânie, V.A.; Marinca, M.V.; Alexa-Stratulat, T.; Gafton, B.; Pǎduraru, M.; Adavidoaiei, A.M.; Miron, L.; Rusu, C. KRAS, NRAS, BRAF, HER2 and microsatellite instability in metastatic colorectal cancer-practical implications for the clinician. Radiol. Oncol. 2019, 53, 265–274. [Google Scholar] [CrossRef] [PubMed]
- Muinao, T.; Deka Boruah, H.P.; Pal, M. Multi-biomarker panel signature as the key to diagnosis of ovarian cancer. Heliyon 2019, 5, e02826. [Google Scholar] [CrossRef]
- Katchman, B.A.; Smith, J.T.; Obahiagbon, U.; Kesiraju, S.; Lee, Y.-K.; O’Brien, B.; Kaftanoglu, K.; Christen, J.B.; Anderson, K.S. Application of flat panel OLED display technology for the point-of-care detection of circulating cancer biomarkers. Sci. Rep. 2016, 6, 29057. [Google Scholar] [CrossRef] [PubMed]
- Qureshi, A.; Niazi, J.H.; Kallempudi, S.; Gurbuz, Y. Label-free capacitive biosensor for sensitive detection of multiple biomarkers using gold interdigitated capacitor arrays. Biosens. Bioelectron. 2010, 25, 2318–2323. [Google Scholar] [CrossRef]
- Radha Shanmugam, N.; Muthukumar, S.; Chaudhry, S.; Anguiano, J.; Prasad, S. Ultrasensitive nanostructure sensor arrays on flexible substrates for multiplexed and simultaneous electrochemical detection of a panel of cardiac biomarkers. Biosens. Bioelectron. 2017, 89, 764–772. [Google Scholar] [CrossRef]
- Issadore, D.; Chung, J.; Shao, H.; Liong, M.; Ghazani, A.A.; Castro, C.M.; Weissleder, R.; Lee, H. Ultrasensitive clinical enumeration of rare cells ex vivo using a micro-hall detector. Sci. Transl. Med. 2012, 4, 141ra92. [Google Scholar] [CrossRef]
- Ewald, M.; Fechner, P.; Gauglitz, G. A multi-analyte biosensor for the simultaneous label-free detection of pathogens and biomarkers in point-of-need animal testing. Anal. Bioanal. Chem. 2020, 407, 4005–4013. [Google Scholar] [CrossRef]
- Fountoglou, N.; Petropoulou, M.; Iliadi, A.; Christopoulos, T.K.; Ioannou, P.C. Two-panel molecular testing for genetic predisposition for thrombosis using multi-allele visual biosensors. Anal. Bioanal. Chem. 2016, 408, 1943–1952. [Google Scholar] [CrossRef] [PubMed]
- Lee, J.U.; Nguyen, A.H.; Sim, S.J. A nanoplasmonic biosensor for label-free multiplex detection of cancer biomarkers. Biosens. Bioelectron. 2015, 74, 341–346. [Google Scholar] [CrossRef] [PubMed]
- Jiang, Y.; Shi, M.; Liu, Y.; Wan, S.; Cui, C.; Zhang, L.; Tan, W. Aptamer/AuNP Biosensor for Colorimetric Profiling of Exosomal Proteins. Angew. Chem. -Int. Ed. 2017, 56, 11916–11920. [Google Scholar] [CrossRef] [PubMed]
- Wang, Y.Y.; Yuan, W.; Zhang, Q.; Wang, Y.Y.; Kimber, M.; Dong, L.; Lu, M. Exosome microarray based on label-free imaging biosensor. In Proceedings of the IEEE Sensors; IEEE: Montreal, QC, Canada, 2019; pp. 1–4. [Google Scholar] [CrossRef]
- Panneer Selvam, A.; Prasad, S. Companion and Point-of-Care Sensor System for Rapid Multiplexed Detection of a Panel of Infectious Disease Markers. SLAS Technol. Transl. Life Sci. Innov. 2017, 22, 338–347. [Google Scholar] [CrossRef]
- Yokus, M.A.; Songkakul, T.; Pozdin, V.A.; Bozkurt, A.; Daniele, M.A. Wearable multiplexed biosensor system toward continuous monitoring of metabolites. Biosens. Bioelectron. 2020, 153, 112038. [Google Scholar] [CrossRef]
- Felder, M.; Kapur, A.; Gonzalez-Bosquet, J.; Horibata, S.; Heintz, J.; Albrecht, R.; Fass, L.; Kaur, J.; Hu, K.; Shojaei, H.; et al. MUC16 (CA125): Tumor biomarker to cancer therapy, a work in progress. Mol. Cancer 2014, 13, 129. [Google Scholar] [CrossRef]
- Skates, S.J.; Xu, F.-J.; Yu, Y.-H.; Sjövall, K.; Einhorn, N.; Chang, Y.; Bast, R.C.; Knapp, R.C. Toward an optimal algorithm for ovarian cancer screening with longitudinal tumor markers. Cancer 1995, 76, 2004–2010. [Google Scholar] [CrossRef]
- Fakanya, W.M.; Tothill, I.E. Detection of the inflammation biomarker C-reactive protein in serum samples: Towards an optimal biosensor formula. Biosensors 2014, 4, 340–357. [Google Scholar] [CrossRef] [PubMed]
- Ling, W. C-reactive protein levels in the early stage of COVID-19. Médecine Mal. Infect. 2020, 50, 332–334. [Google Scholar] [CrossRef]
- World Health Organization. C-Reactive Protein Concentrations as a Marker of Inflammation or Infection for Interpreting Biomarkers of Micronutrient Status. Available online: http://apps.who.int/iris/bitstream/10665/133708/1/WHO_ NMH_NHD_EPG_14.7_eng.pdf?ua=1 (accessed on 8 October 2021).
- Rodríguez-Yáñez, M.; Blanco, M.; Sobrino, T.; Arias-Rivas, S.; Castillo, J. Update on the research of serum biomarkers to assess stroke. Drugs Future 2012, 37, 283. [Google Scholar] [CrossRef]
- Jickling, G.C.; Sharp, F.R. Blood Biomarkers of Ischemic Stroke. Neurotherapeutics 2011, 8, 349–360. [Google Scholar] [CrossRef]
- Maestrini, I.; Ducroquet, A.; Moulin, S.; Leys, D.; Cordonnier, C.; Bordet, R. Blood biomarkers in the early stage of cerebral ischemia. Rev. Neurol. (Paris) 2016, 172, 198–219. [Google Scholar] [CrossRef] [PubMed]
- Rodríguez-González, R.; Blanco, M.; Rodríguez-Yáñez, M.; Moldes, O.; Castillo, J.; Sobrino, T. Platelet derived growth factor-CC isoform is associated with hemorrhagic transformation in ischemic stroke patients treated with tissue plasminogen activator. Atherosclerosis 2013, 226, 165–171. [Google Scholar] [CrossRef] [PubMed]
- Rodríguez-González, R.; Sobrino, T.; Rodríguez-Yáñez, M.; Millán, M.; Brea, D.; Miranda, E.; Moldes, O.; Pérez, J.; Lomas, D.A.; Leira, R.; et al. Association between neuroserpin and molecular markers of brain damage in patients with acute ischemic stroke. J. Transl. Med. 2011, 9, 58. [Google Scholar] [CrossRef]
- Foerch, C.; Wunderlich, M.T.; Dvorak, F.; Humpich, M.; Kahles, T.; Goertler, M.; Alvarez-Sabín, J.; Wallesch, C.W.; Molina, C.A.; Steinmetz, H.; et al. Elevated serum S100B levels indicate a higher risk of hemorrhagic transformation after thrombolytic therapy in acute stroke. Stroke 2007, 38, 2491–2495. [Google Scholar] [CrossRef]
- Wood, B.A.; O’Halloran, K.P.; VandeWoude, S. Development and validation of a multiplex microsphere-based assay for detection of domestic cat (Felis catus) cytokines. Clin. Vaccine Immunol. 2011, 18, 387–392. [Google Scholar] [CrossRef] [PubMed][Green Version]


| Platform Category | Transducing Mechanism | Cost of Equipment, Operation | Pros | Cons | Label-Free Option | Real-Time, Portability Options | Ref |
|---|---|---|---|---|---|---|---|
| Magnetoresistive | Detection of magnetic field fringe of MNP | High, High | Robust, not sensitive to charge and temperature; tailored labeling | Required magnetic labeling | No | Yes, Yes | [6,7,8,9,10,11,12] |
| FET | Detection of sample charge | Low, Low | Mature technology | Difficulty in detecting neutral charge samples; noise from unstable charge | Yes | Yes, Yes | [13,14,15,16,19,20,21,22,23] |
| QCM | Detection of mass coverage | Low, Low | High Q factor | Low resolution, potential interference of operational frequency | Yes | Yes, Yes | [24,25,26,27,28] |
| SPR | Detection of refractive indices shift or mass coverage | High, Low | High sensitivity | Temperature-sensitive | Yes | Yes, Yes | [29,30,36,37,38,39,40,41] |
| LSPR | Detection of refractive indices shift or mass coverage | High, High | Very high sensitivity | Temperature-sensitive, high-cost nanostructure | Yes | Yes, Yes | [31,32,33,34,35] |
| SERS | Detection of the energy transition at molecules | High, High | Very high sensitivity | Required label, high-cost nanostructure | No | No, No | [42,43,44,45,46,47,48,49,50,51] |
| Platform | Sample | Technical Remark | Dynamic Range | Ref. |
|---|---|---|---|---|
| Dual cavity FPI | N/a | Utilizing weak composite | 1.359–1.452 | [76] |
| SPR | Sucrose water | Al/Au sensing structure | 1.33–1.45 RIU | [77] |
| SPR | Antibody loading | Zwitterionic hydrogel | Antibody capacity up to 693 ng/cm2 | [78] |
| SPR | N/a | TiO2/SiO2 | 1.7742–1.9542 RIU | [81] |
| SERS | Bilirubin | Au-MoS2 NFs | 10−12 to 10−4 M | [79] |
| Electrochemical | Staphylococcus epidermidis | ZnO Nanograss | 10−11–10−4 M | [80] |
| Magnetoresistive | cFn | Dilution MNP | 1–4 µg/mL | [82] |
| Octet Biosensor | Human mAb | Varying biorecognition concentration | 0.15–40 nM | [83] |
| Strategy | Platform | Sample | Technical Remark | Performance | Ref. |
|---|---|---|---|---|---|
| Blocking | SPR | ssODNs of MTBC and M. gordonae | Spacer arms on probe-ssODNs, MCH for blocking and probe orientation | Regenerative sensing, up to 12 weeks, RT storage | [88] |
| Blocking | Electrochemical | cTnI | nMo3Se4 embedded on rGO, BSA blocking | LDR: 10−6–100 ng/mL; shelf life 35 days | [89] |
| Blocking | Electrochemical | PDGF | GOD blocking, P-Gra-GNPs | LOD 1.7 pM LDR: 0.005–60 nM | [90] |
| Anti-fouling membrane | Fluorescence | DENV and ZIKV | 3D Cu- zwitterionic MOF, simultaneous detection | LOD (in pM): 192 (DENV) 332 (ZIKV) | [91] |
| Anti-fouling membrane | SPR | Undiluted human plasma and serum, mammalian cells | polyAAEE brushes on sensing | Undetectable protein adsorption (<0.3 ng/cm2) | [93] |
| Anti-fouling membrane | SPR | Epstein-Barr virus in serum | Label-free, regenerative sensor | Detection clinical samples in serum | [94] |
| Sandwich assay | SPR | CEA in plasma blood | bio-AuNPs | LOD: 0.1 ng/mL | [95] |
| Sandwich assay | Lateral flow | PDGF-BB and thrombin | Au-labeled aptamer probe | LOD (in nM): 1.0 (PDGF-BB) and 1.5 (thrombin) | [96] |
| Sandwich assay | Photoelectrochemical | cTnI | Ag@Cu2O particles on CdS QDs | LDR (in ng/mL): 2 × 10⁻⁵–50 LOD: 6.7 fg/mL, | [97] |
| mAb | SPR | Uranyl affine proteins | Two-step immunoassays | LOD: 7 nM | [98] |
| Analytical Performance | Definition | Significant Factor | Improvement Strategy | Ref |
|---|---|---|---|---|
| Sensitivity | The signal response in every target concentration | SNR, slope | Downscaling sensing area, sandwich assays, and use of labels (e.g., nanoparticles) | [54,55,56,57,58,59,60,61,62,63] |
| Dynamic range | The ratio between the maximum and minimum usable indication of the signal response | Linear range, saturation level | Surface area enhancement, 3D sensing structure, label tailoring, antibodies affinity, concentration | [35,76,77,78,79,80] |
| LOD | The value expressed by the smallest concentration that can be detected with a reasonable certainty and confidence level | Sensitivity, SD of reference | Sensitivity improvement, SNR enhancement, signal stability, instrument calibrations, signal processing | [10,54,55,56,57,58,59,60,61,62,63,98,99,100,101,102,103,104] |
| Specificity | The sensing ability for capturing a specific target from the other substance | Biomarker preference, low-fouling binding | Blocking assays, advanced surface functionalization, dual-labeling, molecule affinity | [88,89,90,91,92,93,94,95,96,97] |
| Reproducibility | The accuracy and precision of the measurements by different users using identical samples and concentrations | SD, instrumentation | Instrument configuration, signal processing, reduce the number of variables (e.g., operator interference) | [10,100,101,102,103,104,105,106] |
| Biomarker | Platform | Technical Remark | Performance | Ref. |
|---|---|---|---|---|
| 16S rRNA gene S. aureus | EGFET sensor | Direct hybridization, Nanopatterned gold sensing | LOD 1 pM | [23] |
| ZIKV RNA | LSPR mediated fluorescence | Hybrid probes NP-qDots-MB | LOD 1.7–7.6 copies/mL | [34] |
| DNA | FET | PNA probe, RGO sensing | LOD 100 fM | [156] |
| IS6110 DNA of M. tuberculosis | SPR | Amplified- and labeled-DNA by PCR | LOD 63 pg/mL | [102] |
| PSA | FET nanowire | Operated under the subthreshold regime | LOD 1.5 fM | [61] |
| PSA | Memristive | Nanowire sensing, aptamer probe | LOD 23 aM | [128] |
| PSA | SERS | MNP labeled aptamer probe | LOD 5.0 pg/mL Range: 5–500 pg/mL | [129] |
| PSA | Piezoelectric resonator | Dual-channel resonator | LOD: 0.25 ng/mL | [130] |
| PSA | SPR | Paired amplitude and phase degree of the heterodyne signal | LOD (in aM): 300 (in buffer); 2000 (in serum) | [131] |
| PSA | SPR | Sandwich antibody | LOD: 10.2 ng/ml (in buffer); 18.1 ng/mL (in serum) | [132] |
| hCG | GMR | MNP-labeled | 25 mIU/mL | [8] |
| hCG | TMR | MNP-labeled | 25 mIU/mL | [136] |
| hCG | Magnetometer | Hybrid to the lateral flow sensor | 10 pg/mL | [137] |
| hCG | Magnetometer | Hybrid to the lateral flow sensor | 0.014 mIU/mL | [138] |
| hCG | SPR | Sampling method | LOD: 10 ng/mL (in plasma blood) | [139] |
| hCG | Colorimetric sensor | LSPR colorimetric using AuNP-Aptamer probe | LOD: 15 mIU/mL LDR: up to 1000 mIU/mL | [140] |
| cTn | Piezoelectric sensor | ZnO piezoelectric film | LOD: 20 pg/mL LDR: 0.04 to 2 ng/mL | [145] |
| cTn | LSPR | Nanoimprint lithography sensing | 0.55 ng/mL | [146] |
| cTn | Long Range SPR | Waveguide mode SPR at λ=1310 nm | LOD: 430 pg/mL (direct); 28 pg/mL (sandwich) | [147] |
| cTn | Plasmonic based | IGZO sensing, AuNP assisted LSPR. | LOD: 0.1 ng/mL (in blood) | [148] |
| cTn | SPR | MNP-labelled assisted SPR | LOD: 1.25 ng/mL | [149] |
| cTn | LSPR | Au triangular nanoprisms sensing | LOD: 15 aM (in plasma blood) | [150] |
| cTn | SPR | AuNP assisted amplification, sandwich. | LOD: 38 ng/mL LDR: 1.25–40 μg/mL | [151] |
| cTn | FET | Single drop whole blood sample | 20 ng/mL | [152] |
| cTn | FET | AlGaN/GaN HEMT | LOD: 250 fM (in buffer)LDR: 0.006–148 ng/mL | [153] |
| Disease Diagnostic | Biomarkers | Platform | Technical Remark | Performance | Ref. |
|---|---|---|---|---|---|
| Cardiovascular | CRP; TNFα; IL6 | GID capacitor arrays | Co-immobilized chip with equimolar mixtures of antibodies | LDR: 0.025–25 ng/ml | [161] |
| Cardiovascular | cTnI; cTnT | Disposable electrochemical sensor | ZnO vertical rod sensing | LDR: 0.1–1 × 10⁵ pg/mL LOD (in pg/mL): 1 (cTnI); 0.1 (cTnT) | [162] |
| Cardiovascular | PAPP-A; PCSK9; ST2 | GMR | 8×8 sensor array | LDR: 0.04‒400 ng/mL | [7] |
| Cancer | EpCAM; HER2; EGFR; CTC | Micro-Hall detector | 2×4 sensor array | LDR:10–105 cells | [163] |
| Cancer | CD9; CD63; CD68; CD80; CD81; CD86; I-A/I-E. | Photonic crystal | 12 channels | LDR: 2 × 10¹¹‒2 × 10⁹ particles/mL | [168] |
| Cancer | AFP; CEA; PSA | LSPR | Biomarkers detected in the human serum sample | LOD (in fM): 91 (AFP), 94 (CEA) and 10 (PSA) | [166] |
| Cancer |
CD63; EpCAM; PDGF; PSMA; PTK7 | LSPR colorimetric | Aptamer probes on AuNP | Profiling exosomal proteins in minutes | [167] |
| Salmonella infection | CRP; anti-Salmonella (AS) | 1-lambda-reflectometry | Label-free, portable platform | LDR (in ng/mL): 5.74–122.52 (AS); 1.26–29.56 (CRP) LOD (in ng/mL): 2.21 (AS); 0.72 (CRP) | [164] |
| Thrombosis | DNA sequences from H1299R; A1298C; V34L; 4G/5G polymorphism | LSPR colorimetric | PCR amplification, dipstick sensing | Accuracy: 100% for 15 blind clinical samples | [165] |
| Sepsis | PCT; LTA; LPS | Nanochannel electrochemical | Detection in the whole blood sample | LDR (in µg/mL): 0.0001‒10 (PCT); 1‒1000 (LPS and LTA) | [169] |
| Physiological body fluid | Glucose, lactate, pH, and temperature from sweat | Electrochemical | Wearable and wireless device | Sensitivity (in μA/mM·cm2) 26.31 (glucose); 1.49 (lactate); 54 mV/pH (pH); 0.002 °C−1 (temp.) | [170] |
Publisher’s Note: MDPI stays neutral with regard to jurisdictional claims in published maps and institutional affiliations. |
© 2021 by the authors. Licensee MDPI, Basel, Switzerland. This article is an open access article distributed under the terms and conditions of the Creative Commons Attribution (CC BY) license (https://creativecommons.org/licenses/by/4.0/).
Share and Cite
Prabowo, B.A.; Cabral, P.D.; Freitas, P.; Fernandes, E. The Challenges of Developing Biosensors for Clinical Assessment: A Review. Chemosensors 2021, 9, 299. https://doi.org/10.3390/chemosensors9110299
Prabowo BA, Cabral PD, Freitas P, Fernandes E. The Challenges of Developing Biosensors for Clinical Assessment: A Review. Chemosensors. 2021; 9(11):299. https://doi.org/10.3390/chemosensors9110299
Chicago/Turabian StylePrabowo, Briliant Adhi, Patrícia D. Cabral, Paulo Freitas, and Elisabete Fernandes. 2021. "The Challenges of Developing Biosensors for Clinical Assessment: A Review" Chemosensors 9, no. 11: 299. https://doi.org/10.3390/chemosensors9110299
APA StylePrabowo, B. A., Cabral, P. D., Freitas, P., & Fernandes, E. (2021). The Challenges of Developing Biosensors for Clinical Assessment: A Review. Chemosensors, 9(11), 299. https://doi.org/10.3390/chemosensors9110299