Article

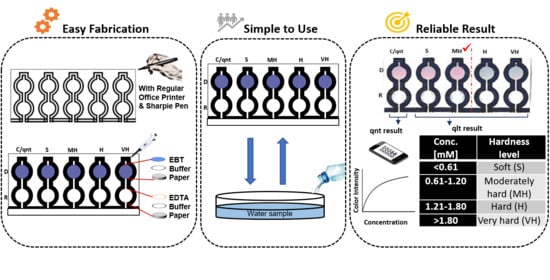
Dual-Modal Assay Kit for the Qualitative and Quantitative Determination of the Total Water Hardness Using a Permanent Marker Fabricated Microfluidic Paper-Based Analytical Device

by
Oyejide Damilola Oyewunmi
1,
Seyed Hamid Safiabadi-Tali
2 and
Sana Jahanshahi-Anbuhi
1,*
1
Department of Chemical and Materials Engineering, Gina Cody School of Engineering, Concordia University, Montreal, QC H3G 1M8, Canada
2
Department of Mechanical, Industrial, and Aerospace Engineering, Concordia University, Montreal, QC H3G 1M8, Canada
*
Author to whom correspondence should be addressed.
Chemosensors 2020, 8(4), 97; https://doi.org/10.3390/chemosensors8040097
Submission received: 10 September 2020 / Revised: 29 September 2020 / Accepted: 6 October 2020 / Published: 9 October 2020
(This article belongs to the Special Issue Paper-Based Sensors and Microfluidic Devices)

Abstract

:
A dip-and-read microfluidic paper-based analytical device (µPAD) was developed for the qualitative and quantitative detection of the total hardness of water. To create well-defined hydrophobic barriers on filter paper, a regular office printer and a commercially available permanent marker pen were utilized as a quick and simple technique with easily accessible equipment/materials to fabricate µPAD in new or resource-limited laboratories without sophisticated equipment. After a wettability and barrier efficiency analysis on the permanent marker colors, the blue and green ink markers exhibited favorable hydrophobic properties and were utilized in the fabrication of the developed test devices. The device had five reaction and detection zones modeled after the classification given by the World Health Organization (WHO), so qualitatively it determined whether the water was ‘soft’, ‘moderately hard’, ‘hard’, or ‘very hard’ by changing color from blue to pink in about 3 min. The device was also used to introduce an alternative colorimetric reaction for quantitative analysis of the water hardness without the need for ethylenediaminetetraacetic acid (EDTA) and without compromising the simplicity and low cost of the device. The developed µPAD showed a calculated limit of detection (LOD) of 0.02 mM, which is at least 80% less than those of commercially available test strips and other reported µPADs, and the results of the real-world samples were consistent with those of the standard titration (with EDTA). In addition, the device exhibited stability for 2 months at room and frigid condition (4 °C) and at varying harsh temperatures from 25 to 100 °C. The results demonstrate that the developed paper-based device can be used for rapid, on-site analysis of water with no interferences and no need for a pipette for sample introduction during testing.

Graphical Abstract

1. Introduction

Water is a valuable resource for humanity. The various usage of water knows no bounds—from industrial usage to domestic and drinking purposes, to agricultural purposes, which in the end supply food for humanity. In each case, water quality control specifications are set by regulatory organizations for the safety of humanity and the environment. The hardness of water is one such water quality control specification that is often considered before its usage. The hardness of water is defined as the amount of metallic ions present in water. Due to the relatively high concentration of calcium ion (Ca2+) and magnesium ion (Mg2+) in natural water as compared to other metallic ions, the hardness of water is defined basically as the total amount of calcium and magnesium ion in water reported as a calcium carbonate equivalent [1,2]. The World Health Organization (WHO) grouped the total hardness of water into four classes based on the concentration of equivalent calcium carbonate present: namely, soft water (<0.61 mM), moderately hard water (0.61–1.20 mM), hard water (1.21–1.80 mM), and very hard water (>1.80 mM) [1].
The hardness of water is also known as the measure of the ability of water to react with soap, and the greater the hardness of the water, the larger the amount of soap needed to form a lather. This generates a big issue in domestic and industrial washing, as the hard water needs to be made soft or a large amount of soap will be required for the washing operation [2]. Hard water also creates stains on glassware and ring deposits on bathtubs and toilet bowls. Moreover, it causes clogs in municipal water pipe networks as well as industrial connections because of scale build-up, which eventually leads to breakdown and ultimately costly repairs or overhauling [3]. Excessive hardness affects the aesthetic appearance of water, which limits its acceptability by many at that level and hence is a major factor at swimming pools and other artificial water recreation centers. According to Health Canada [4], the acceptable level of hardness in water is 80–100 mM to provide a balance between corrosion and incrustation. Moreover, an excessive intake of hard water by people suffering from renal insufficiency or milk alkali syndrome causes hypercalcemia, which is due to the inability to eliminate excess nutrients in the body. This may lead to total kidney failure or death, if not properly checked [1,5,6]. Furthermore, exposure to hard water has been reported to aggravate eczema, particularly in children [7]. These issues have led to various investigations of and innovations on how to detect the level of hardness of water and how to make hard water soft.
The common means of determining the level of hardness of water have been the traditional titration method, ion selective electrode analysis [8], inductively coupled plasma atomic emission spectroscopy (ICP-OES) [9], and Raman spectroscopy characterization [10]. These methods, though giving accurate results, require bulky instruments and apparatus, need an external power source and a large amount of sample for operation, and do not allow for dynamic and point-of-use testing. These properties limit the use of these testing methods, especially, in remote areas and in some developing countries. However, testing can be made easy and readily available by fabricating simple, portable, and cheap devices that can also perform the required test with high accuracy.
To provide low-cost, simple, portable, and eco-friendly disposable analytical testing platforms for point-of-use analysis, microfluidic paper-based analytical devices (µPADs) have, over the past decade, become popular in the research community. These devices use paper as substrate, which is impregnated with reagents for systematic testing of analytes through colorimetric or other methods such as electrochemistry [11,12,13,14,15,16]. Many researchers have developed µPADs to detect various metals in water, such as lead [17], copper [18], mercury [19,20], iron [21], calcium and magnesium [22,23], chromium [24], zinc [25], and nickel [26]. However, most of these µPADs either require the use of a volume calibrated tool for sample introduction or do not perform both qualitative and quantitative detection simultaneously.
To allow a defined flow of liquid along defined paths on papers, the principle of hydrophobicity and hydrophilicity is used to create well-defined channels and barriers. Several methods of µPAD fabrication have been investigated, such as Teflon stamping [27], technical drawing pen writing [28], micro-embossing [29], filtration-assisted screen printing [30], polymer impregnated paper barriers surrounded by external wax barriers [31], chemical functionalization of papers [32], 3D wax printing [33], photoresist utilization [34], laser printing and cutting [35], stamping of parafilm and PDMS [36], and direct ink writing [37]. The commonest way of creating hydrophobic barriers for µPAD has been wax printing [38]. However, as of the year 2019, the manufacture of all the employed solid ink printers—Xerox ColorQube 8580 [39], ColorQube 8880 [40], ColorQube 8700 [41], etc.—has been discontinued by Xerox, the manufacturer [42].
Gallibu et al. [43] reported the use of permanent marker ink for fabricating µPAD which was used for enzyme assay. In that study, a programmed XY plotter was utilized to pattern the paper substrate with the permanent marker, and patterns were designed on the computer using Inkscape, a vector graphics software. However, a common and promptly accessible approach is required for the fabrication step and for defining the hydrophilic fluid flow paths of the solutions on the paper device. In addition, the barrier efficiency of different colors of the permanent marker needs to be investigated in order to ascertain the inks which are best for fabrication of the µPAD. In addition, Karita and Kaneta [22] reported the fabrication of the first µPAD for the semi-quantitative detection of calcium and magnesium ion with a limit of detection (LOD) of 0.5 mM. In that work, the focus was on the semi-quantitative detection of analytes using ethylenediaminetetraacetic acid (EDTA) as a complexing agent. However, a sensitive, selective and user-friendly sensor for the qualitative detection of these ions in water, that allows the end-user right away to tell if the water is hard or soft (without needing to translate numbers), remains highly needed. Moreover, the previously reported sensor needed an auxiliary tool (pipette) for sample introduction during testing, which could lead to errors due to human interaction. Our study tackled these shortcomings by (1) fabricating a paper sensor that determined the total hardness of water both qualitatively and quantitatively in just one test (dual-mode detection). The qualitative result tells instantly if the water is soft, moderately hard, hard, or very hard without the need for interpreting numbers, hence making the device more user friendly. We (2) introduced an alternative colorimetric quantification of water hardness without the need for EDTA as a complexing agent, while the obtained results stayed in agreement with the standard complexometric titration (including EDTA) and the device performance remained uncompromised. Other similar existing works all have used EDTA. We (3) investigated the wettability of paper substrate modified with different colors of permanent marker ink by contact angle analysis. We (4) investigated the barrier efficiency of µPAD fabricated with the use of a regular office printer and different colors of permanent marker ink, which could be of particular interest to laboratories with very limited space and budget to accommodate more sophisticated tools and techniques such as XY plotter, laser cutter, photolithography, hot embossing, etc. We (5) investigated the use of a dip-and-read lateral flow design on the µPAD, which eliminated the need for any auxiliary tool for sample introduction and direct human interaction during testing. We (6) investigated the greatly improved limit of detection of the sensor (0.02 mM), which is at least 80% lower than that of commercially available test strips and other reported µPADs for the detection of total water hardness.
In this study, we fabricated a dip-and-read paper-based analytical device for the determination of the total hardness of water. In the sensor device, a commercially available permanent marker (Sharpie©) was utilized to create the hydrophobic barriers on the paper. The paper device, shown in Figure 1a,b, was systematically designed to determine qualitatively and quantitatively the total hardness of water through the complexometric titration reactions on paper. Using the water hardness classification given by the World Health Organization, the device qualitatively indicated if the water sample was soft, moderately hard, hard, or very hard, as illustrated in Figure 1c. This approach makes it easy for the final consumers to get a quick and easy eye-observed result of the water hardness level. In addition, a control zone for the quantitative determination of the total hardness of water without the use of EDTA was incorporated into the design for more precise analysis, as shown in Figure 1d. The following sections present experiments and data leading to a simple and ready-to-use assay kit for the determination of the total hardness of water. In addition, the paper device has an LOD as low as 0.02 mM, which is lower than that of the present commercially available test strip and other fabricated µPADs for total hardness detection by at least 80%. Finally, we successfully demonstrated the stability of the µPAD over a wide temperature range and the immunity of the µPAD to various common water interference ions.

2. Materials and methods

2.1. Chemicals and Materials

Magnesium sulfate, ethylenediaminetetraacetic acid (EDTA), disodium salt dihydrate, Eriochrome Black T (EBT), 0.1 M sodium hydroxide concentrate, 3-(cyclohexylamino) propanesulphonic acid (CAPS), manganese acetate tetrahydrate, ferrous sulphate, ammonium fluoride, ammonium chloride, copper dinitrate trihydrate, and methanol were purchased from Sigma Aldrich, Oakville, ON, Canada. Calcium chloride dihydrate and Whatman® Grade 4 filter paper were purchased from Fisher Scientific, Edmonton, AB, Canada. HPLC grade water was purchased from the Concordia University central store, Montreal, QC, Canada. Neon food color was purchased from a local Walmart store, Montreal, QC, Canada. The indicator (EBT) was dissolved in methanol at a concentration of 0.1 (w/v) %. The buffer solution with a pH of 10 was prepared by dissolving 11 g of CAPS in 100 mL HPLC grade water and adjusted to the desired pH with sodium hydroxide solution. Spiked samples of combined calcium and magnesium solutions were generated from a stock solution containing a mixture of 25 mL of 0.5 M of calcium and magnesium ion each.

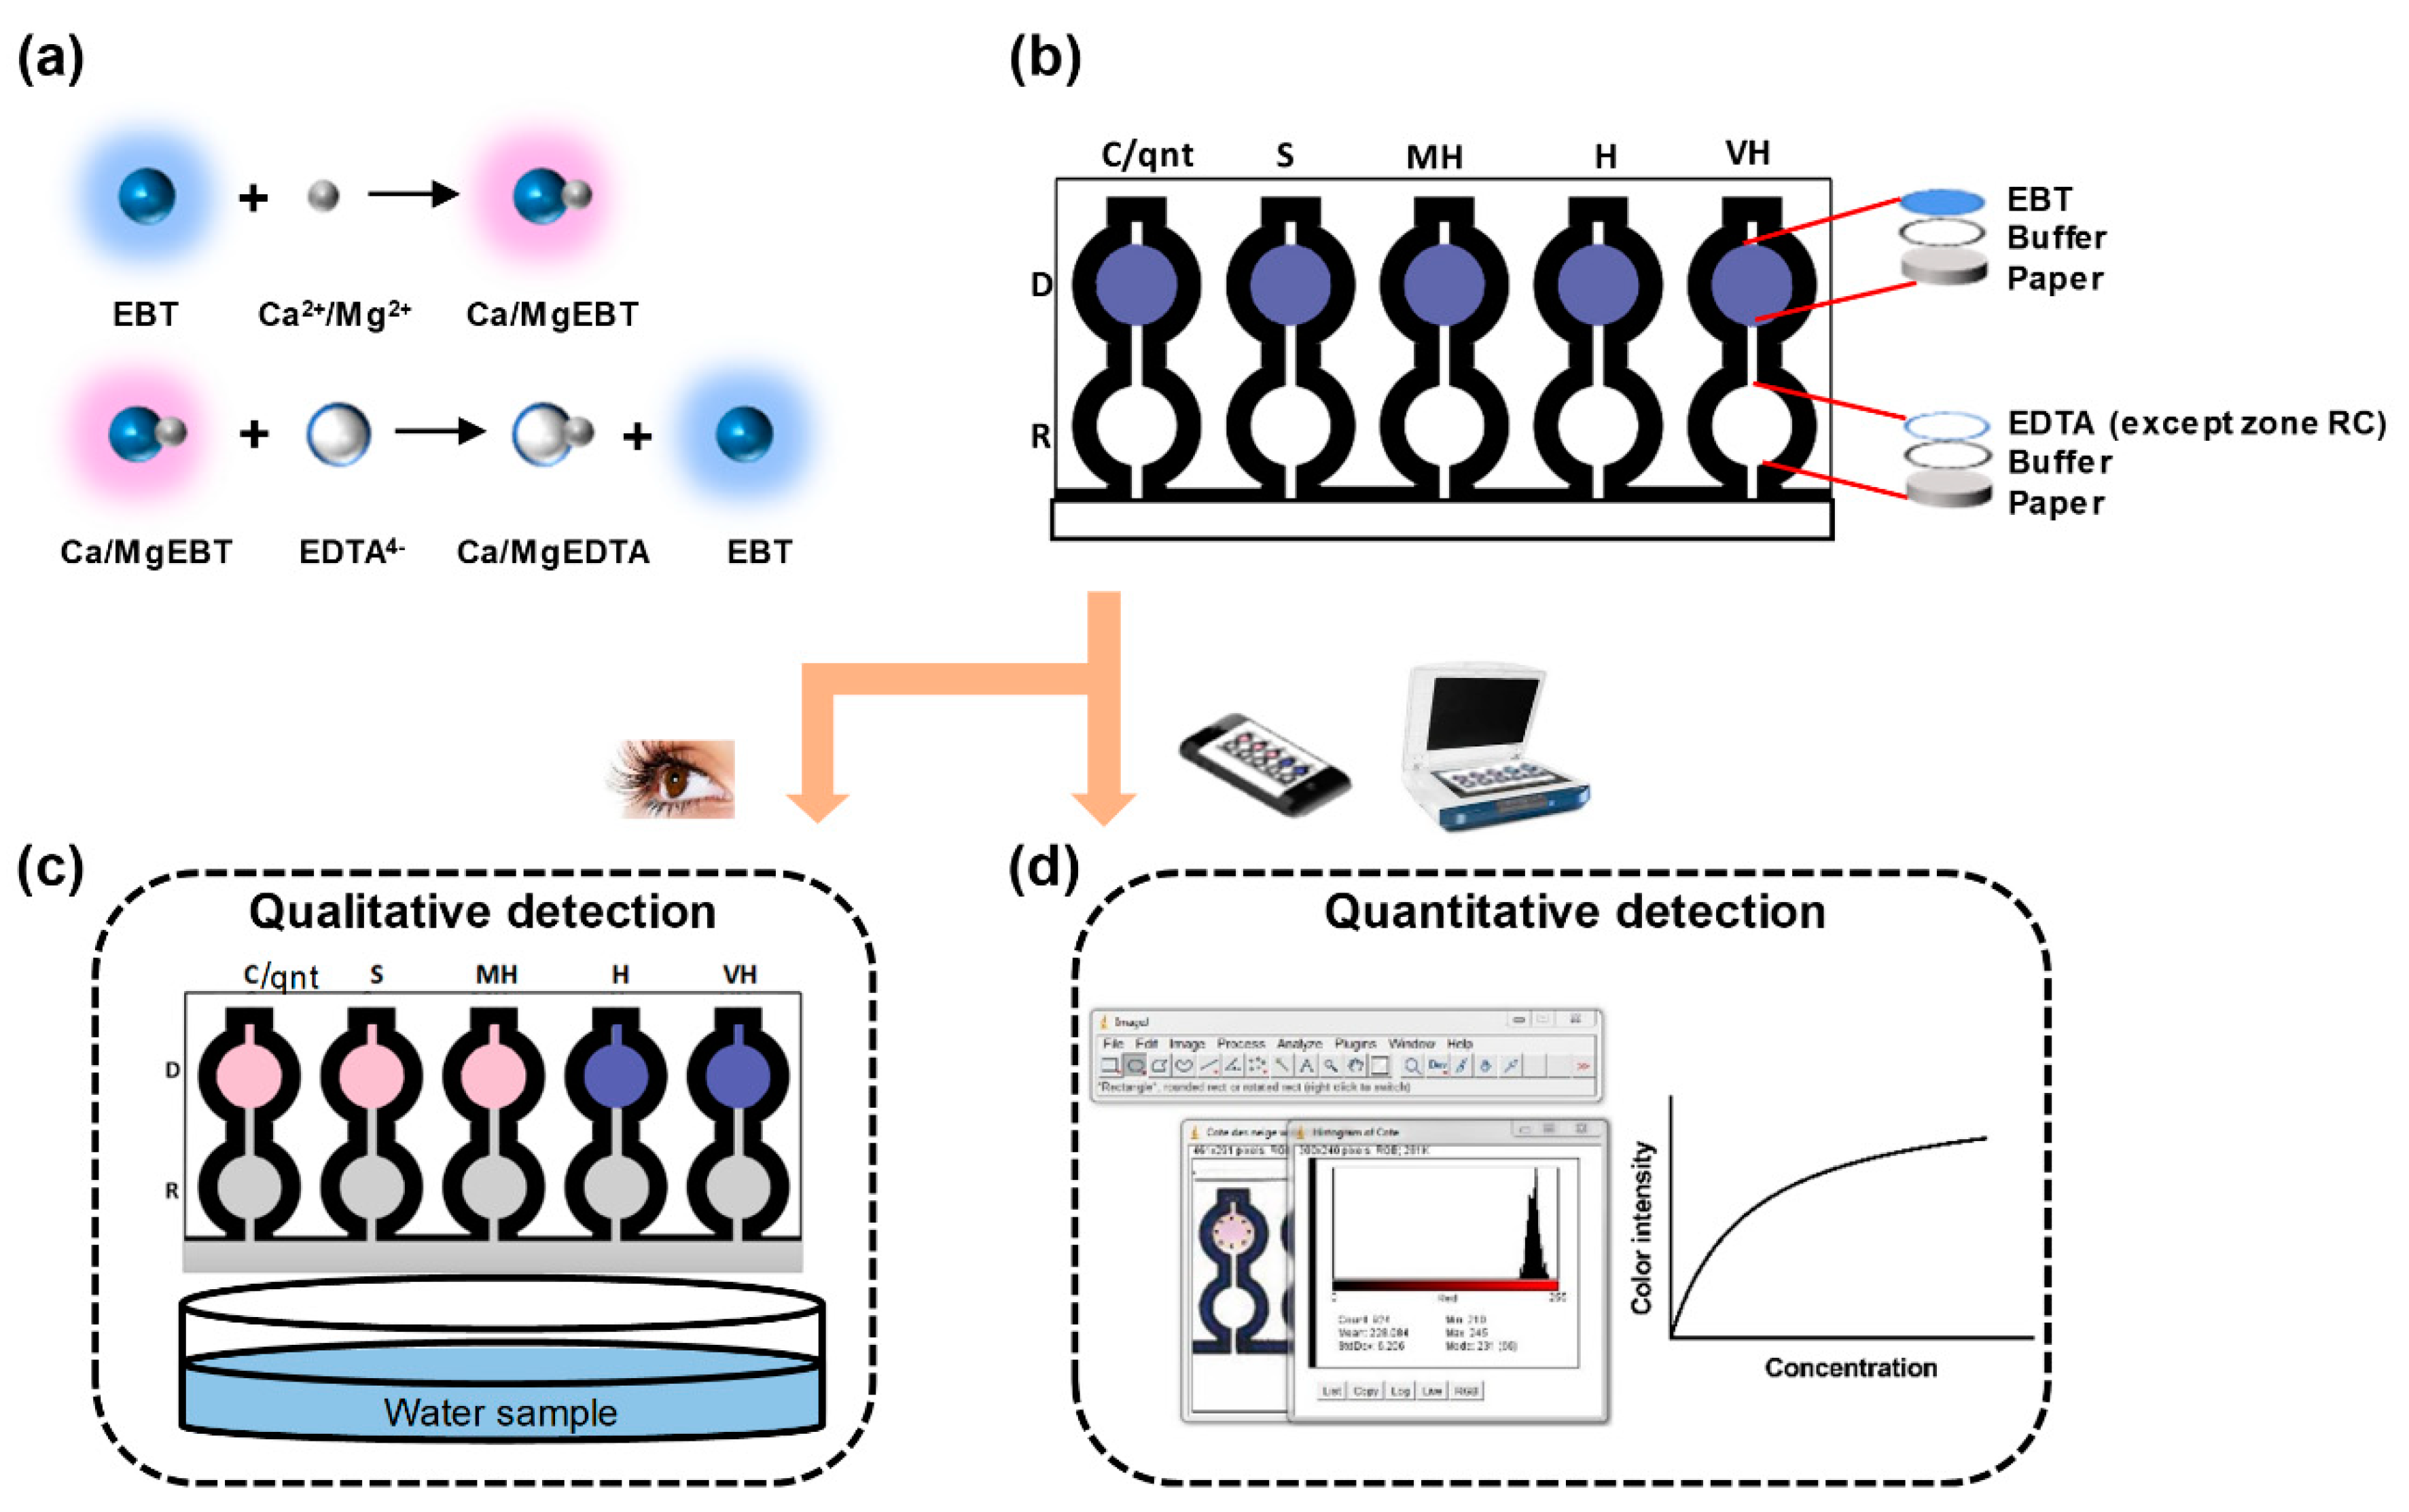
2.2. Principle of Complexometric Chelate Titration

In the complexometric titration, water containing the unknown concentration of Ca2+ and Mg2+ is titrated against EDTA. The reaction between Ca2+ and EDTA is done at pH 10, and hence a buffer with a pH 10 is added to the water sample to be analyzed. The indicator mostly used for this titration is Eriochrome Black T, which is pink originally and turns blue at a pH of 10. Afterward, the resulting solution turns back to pink on reaction with Ca2+ or Mg2+. The titration follows a two-step reaction as shown in Figure 1a.

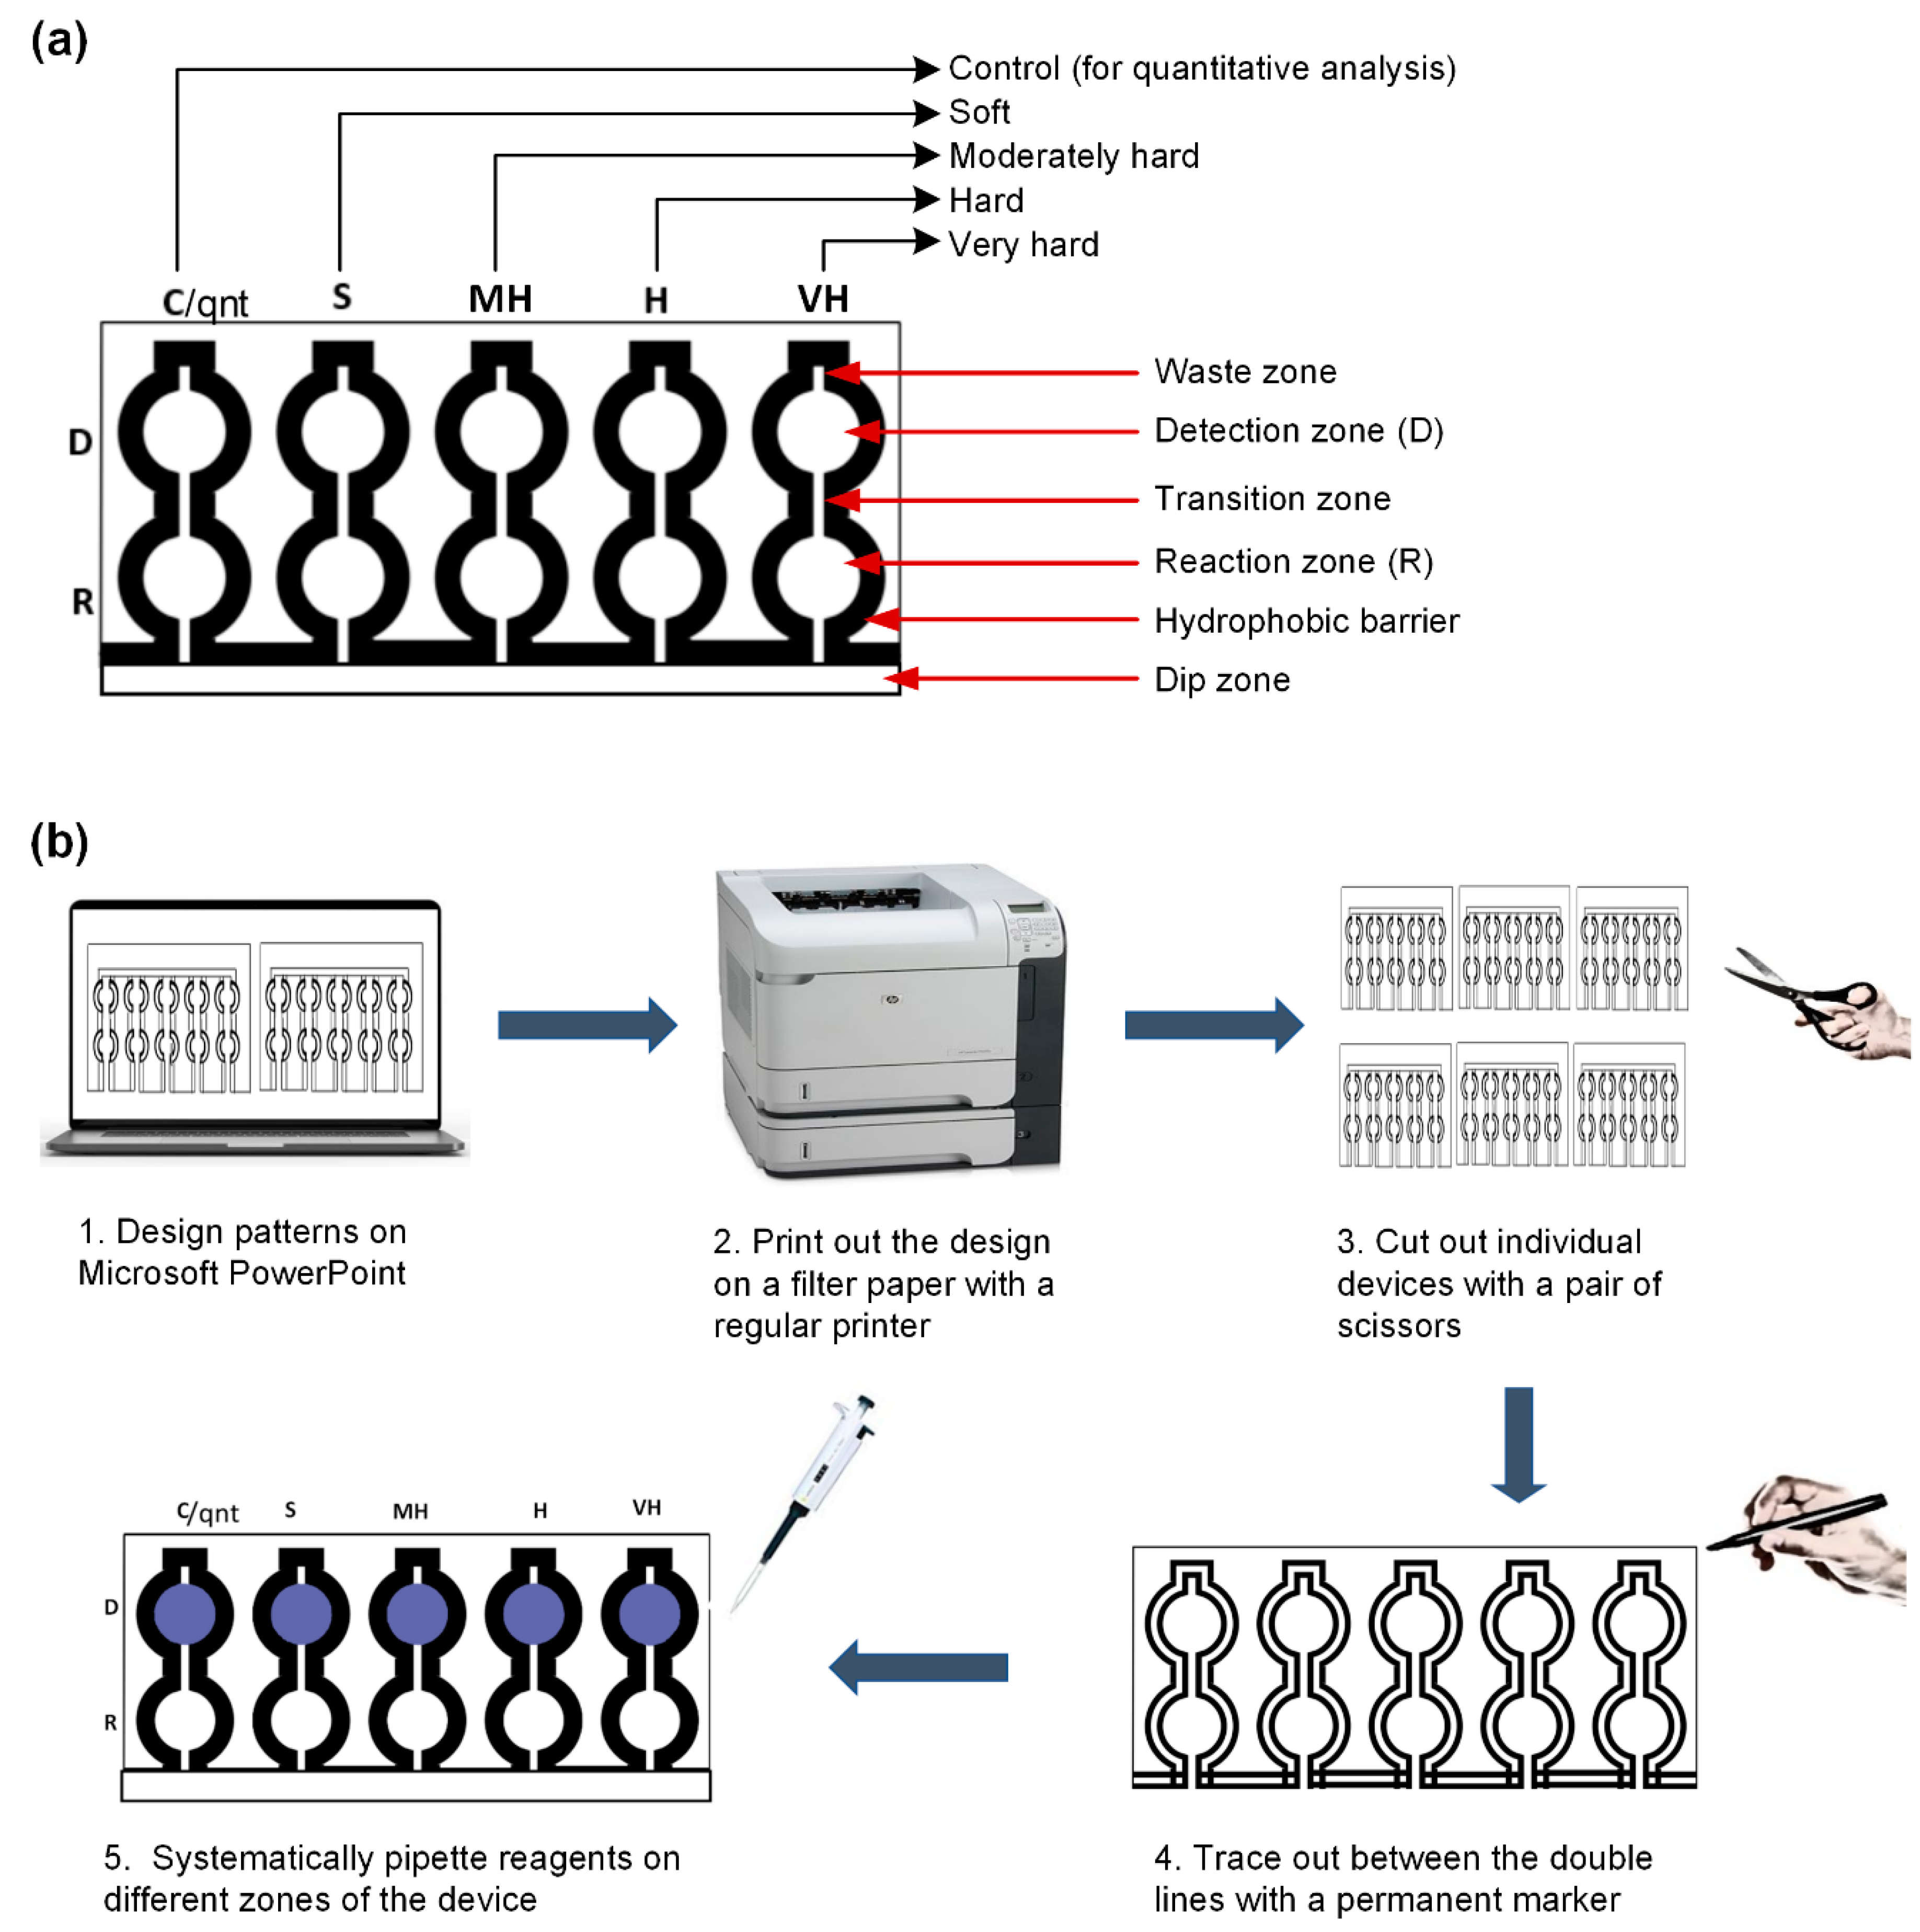
2.3. Microfluidic Paper-Based Analytical Device Fabrication

The structure of the μPAD was designed using the Microsoft PowerPoint 2019 software. The design (Figure 2a) contains five detection (D) and reaction zones (R): four for the different classes of water hardness, including soft (S), moderately hard (MH), hard (H), and very hard (VH) and one for a control (C) section that is used for the quantification. A channel links each reaction zone to the detection zone called the transition zone. There is also a dip zone which is the part of the device that is inserted into the water sample for the testing procedure. A channel also exists which connects the dip zone to the reaction zone. On top of the detection zone, there is a waste zone which aids in reducing the elution time [44]. The boundaries of the device were designed with a doubled line in order to give space for the application of the permanent marker for creating the hydrophobic barriers. Afterward, the design was printed on the Whatman Grade 4 filter paper (A4 paper dimension) with a Hewlett-Packard LaserJet P4015× Printer, using the EconoMode printer setting (Figure 2b). The diameter of both the detection and the reaction zone was 0.7 cm. The length and width of the transition zone were 0.54 cm and 0.1 cm, respectively. The waste zone had a length and width of 0.2 cm and 0.1 cm, respectively. Overall, the device had a dimension of 15.88 cm × 12.7 cm.
To make the hydrophilic channels on the printed design, a commercially available permanent marker (Sharpie©) was applied in between the doubled line boundary of the design. This was done by passing the marker between the boundary lines at most twice, in order to allow proper penetration of the ink through the paper matrix and at the same time prevent excessive ink deposit on the paper. Therefore, it took about 1 min to apply the permanent marker ink for one device and less than 30 s for the ink to dry. The device was ready for the next stage of the fabrication process almost immediately after the application of the hydrophobic pigment due to the volatile nature of the carrier solvent. Afterward, the reagents were systematically added to different zones and allowed to dry completely for usage.

2.4. Systematic Introduction of Reagents on the Fabricated Microfluidic Paper-Based Analytical Device

After the application of the permanent marker on the device to create the barriers and channels, reagents were systematically added to the device for the final preparation. 4.5 µL of the CAPS buffer at a pH of 10 was added to all the reaction and detection zones. The buffer solution dried completely on the paper after ~5 min at room ambiance. The presence of the buffer allowed all the zones to be conditioned to a pH of 10 as needed for the complexometric chelate titration. After the complete drying of the device, 3 µL of the EBT indicator was added to the detection zones, which turned from its original pink color to blue due to the conditioned pH of 10. Even though the EBT was dissolved in methanol (non-polar solvent) during the solution preparation stage, it had no effect on the zone barriers since only an exact volume that filled the detection zone was applied. It was observed that 11 µL of liquid would fill up the device when completely dry, hence 5.5 µL of EDTA was added to the reaction zones (R.S.–R.VH.) except for the first reaction zone (R.C.). This volume selection of EDTA was chosen to model a systematic reaction concentration ratio of 1:2 of the concentration of the water sample to EDTA in each testing channel. Hence, the volume and the concentration balanced each other as EDTA and the water sample ions originally react in the ratio 1:1 as shown in Figure 1a. 5.5 µL EDTA with the concentrations 0.40, 1.22, 2.42, and 3.62 mM was added to the reaction zones R.S. to R.VH., respectively. The concentration of EDTA added to the reaction zones was twice the lowest limit of the different ranges of water hardness given by the World Health Organization, excluding the first concentration (0.40 mM) which was chosen to affect a soft water characterization between 0.2–0.6 mM. The device was then allowed to dry completely and become ready to use. Therefore, for example, if the hardness concentration is higher than 0.2 mM, the calcium/magnesium ions will completely react with the 0.4 mM EDTA (volume ratio of 2:1 of water sample to EDTA) at the zone R.S., and the remaining hardness concentration will move up to the corresponding detection zone causing a color change from blue to pink. This systemic titration and analyte cancelling on the paper will take place at other channels too.

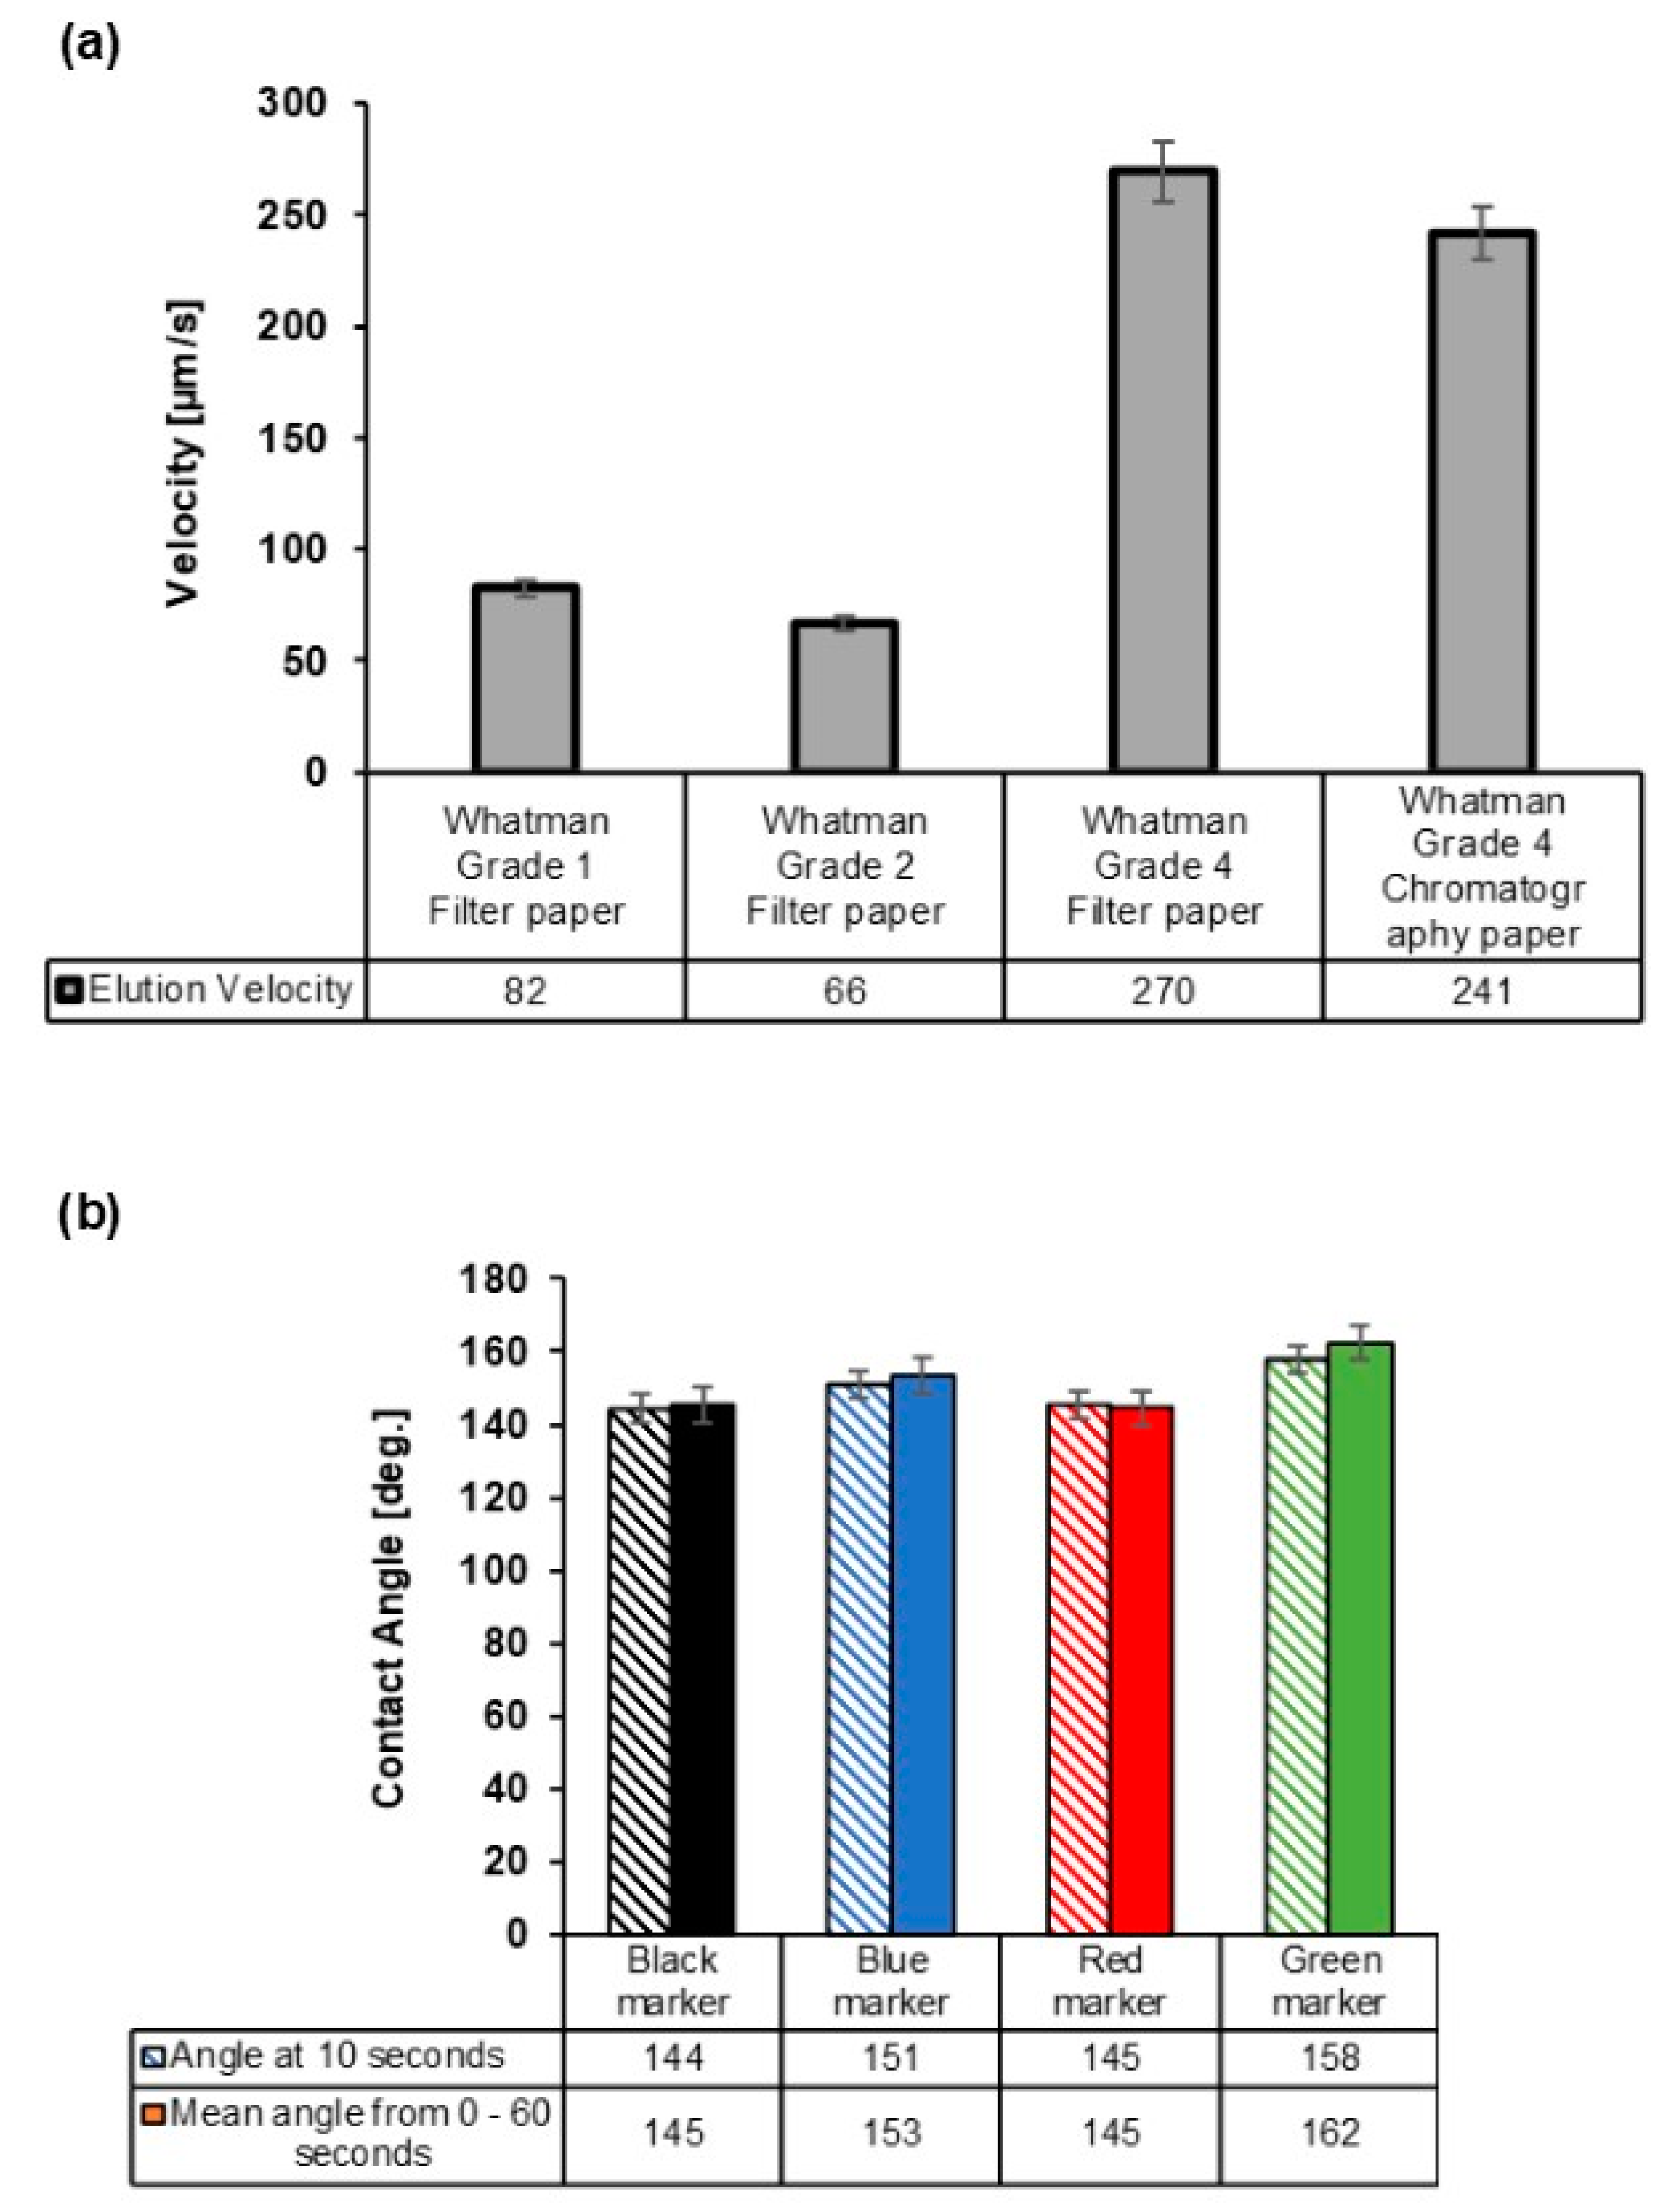
2.5. Elution Velocity Determination

Different paper grades (Whatman® Grade 1 filter paper, Whatman® Grade 2 filter paper, Whatman® Grade 4 filter paper, and Whatman® Grade 4 chromatography paper) were cut into strip sizes of 0.5 cm × 4 cm. Afterward, the paper strips were dipped into the HPLC grade water and observed with respect to time as the water wicked up at room atmospheric conditions.

2.6. Contact Angle Determination

The contact angle measurements were done using a device called a Dropometer (Droplet Smart Tech Incorporation, Toronto, ON, Canada). The Whatman® Grade 4 filter paper was cut into square sheets of 2 cm × 2 cm. The four colors (blue, green, red, and black) of the permanent marker were then applied on the square sheet. HPLC grade water was fed into the sample application syringe, and an aliquot amount was ejected on each treated square sheet. Afterward, an image was captured and analyzed using the installed Sessile mobile application.

2.7. Real-World Samples

Tap water samples from different locations were collected and evaluated with the µPAD and with the traditional titration method. The locations were the Concordia University in Montreal, Canada; a residential apartment building in Cote des Neiges, Montreal, Canada; a residential bungalow building in Montreal East, Canada; and a residential bungalow building in Abeokuta, Nigeria.

2.8. Stability Analysis

The stability of the device in the form of the retained activity was investigated over a period of 2 months at room atmospheric condition and at 4 °C. The temperature of 4 °C was actualized by putting the device in a conditioned laboratory refrigerator. The stability of the device over the temperature range from 25–100 °C was also investigated. This was achieved by putting the µPAD in an oven (Thermo ScientificTM PrecisionTM Compact Gravity Convention, ThermoFisher Scientific, Mississauga, ON, Canada) for 20 min at the desired temperature.

2.9. Statistical Analysis

All statistical analysis was performed using the GraphPad Prism 8 software. Statistically significant differences were determined by the unpaired Student’s t-test method and defined as p < 0.05. In addition, all data are presented as mean ± standard deviation.

3. Results and Discussion

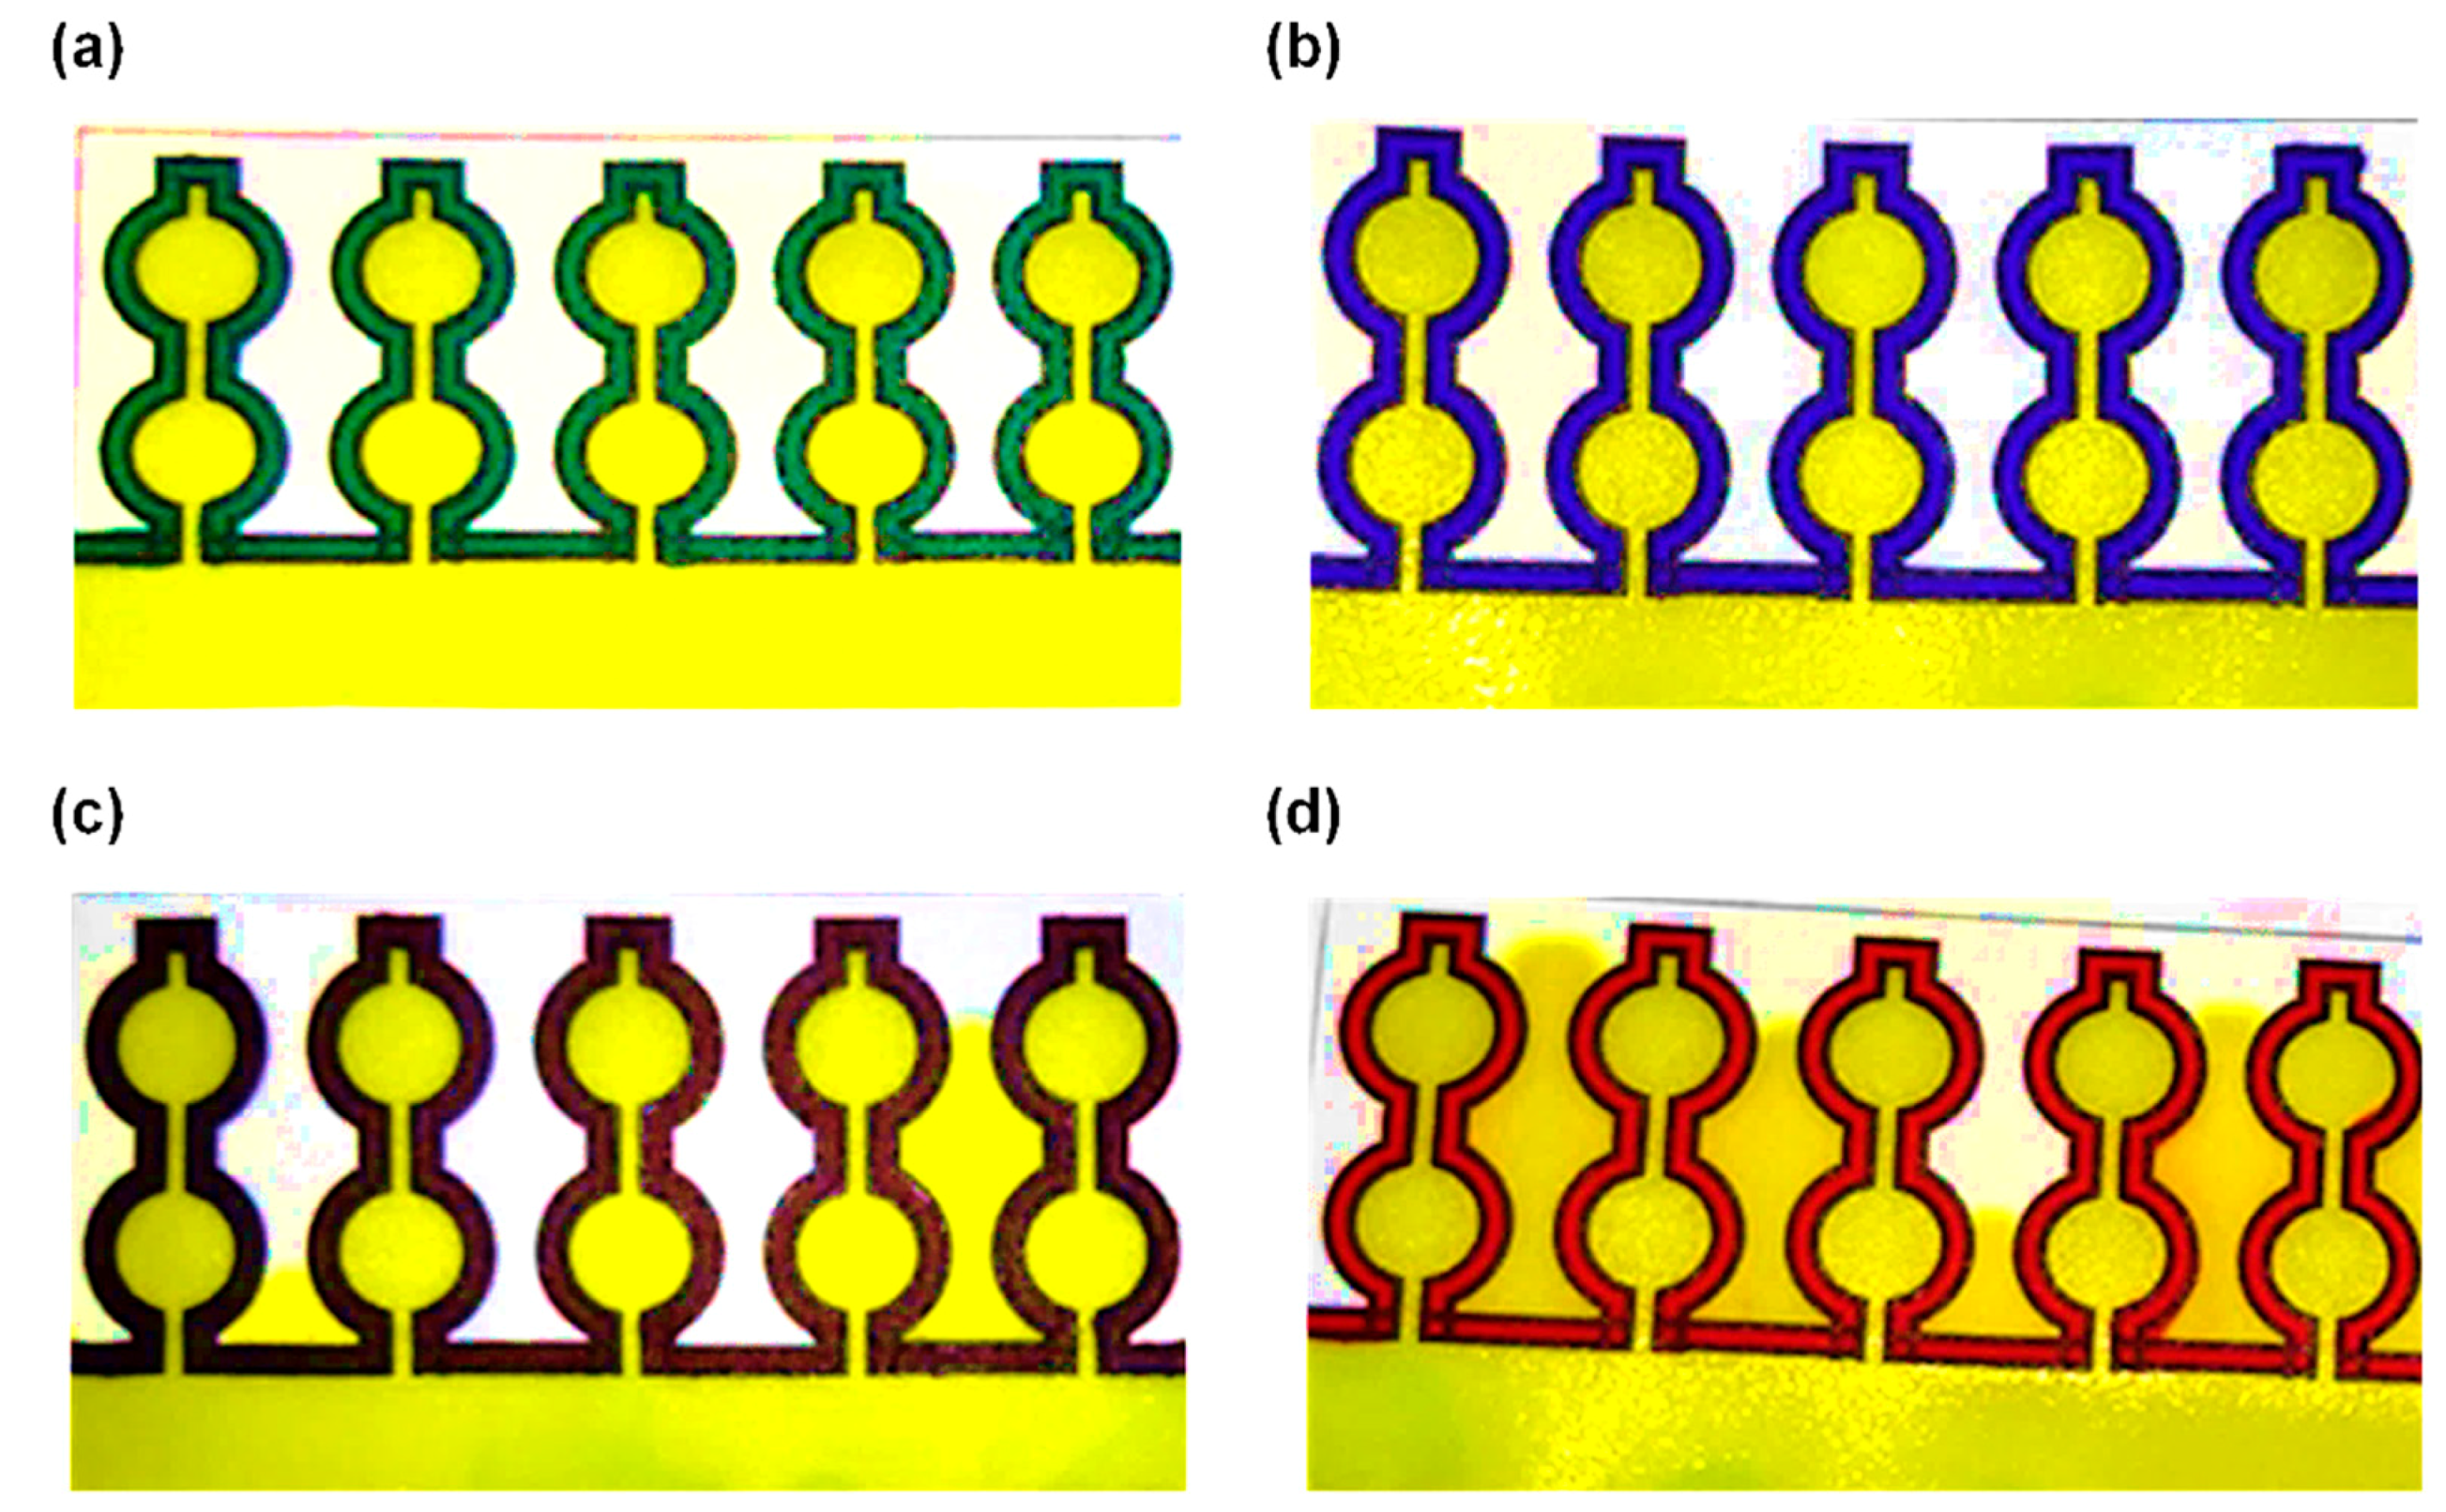
3.1. Selection of the Paper Type and Marker Color for the Creation of Hydrophobic Barrier

Initial studies involved the optimization of the paper sensor in terms of the paper type and the selection of the permanent marker ink color for creation of the hydrophobic barrier to obtain the fastest detection and well-confined hydrophilic channels on paper (see Figure 3 and Figure 4). The type of paper utilized was optimized in terms of wicking velocity. The most favorable color of permanent marker to be utilized also needed to be determined based on its barrier efficiency against water penetration, and this was investigated by using the water contact angle and leakage analysis. The permanent marker usage is quite promising for new and resource-limited laboratories on a low budget, particularly due to discontinuation of the solid ink printers by Xerox, which were the top candidate for creating hydrophobic barriers on paper substrate.
Elution velocity for four different types of Whatman paper was investigated and is shown in Figure 3a. The velocities of 66, 82, 241, and 270 µm/s were determined for Whatman Grade 2 filter paper, Whatman Grade 1 filter paper, Whatman Grade 4 chromatography paper, and Whatman Grade 4 filter paper, respectively. Therefore, the Whatman Grade 4 filter paper recorded the highest velocity. The observed higher velocity in Whatman Grade 4 filter paper was due to its higher pore size as compared the other paper types. The pore size of Whatman Grade 4 filter paper as given by the manufacturer is 20–25 µm, while for Whatman Grade 1 filter paper and Whatman Grade 2 filter paper, it is 11 and 8 µm, all at 98% efficiency, respectively. These results also follow excellently the Washburn equation [45] of flow in porous media which gives a directly proportional relationship between the velocity and pore size. Hence, due to the fast wicking velocity of the Whatman grade 4 filter paper, this paper type was selected for the fabrication of the µPAD.
In order to determine the best color of permanent marker appropriate for the fabrication of the μPAD, we analyzed the contact angle of the HPLC grade water on the different colors of permanent marker. To do this, the blue, black, green, and red permanent markers were applied thoroughly on the Whatman Grade 4 filter paper sheets. The contact angle measurements were performed after 10 s of dropping from the water droplet. The contact angles of 144 deg. for the black marker, 151 deg. for the blue marker, 145 deg. for the red marker, and 158 deg. for the green marker were observed as shown in Figure 3b. Therefore, the hydrophobic strength based on the water contact angle measurements was in the order green marker > blue marker > red marker ≈ black marker. In addition, an investigation of the contact angles of the four marker colors over 60 s showed similar results with those of the 10 s, indicating that the pigments in the marker pen had the potency to retain their hydrophobicity over time (Figure 3b).
Permanent markers contain non-polar solvents that are used in transporting the color pigment to the desired surfaces and have resins that cause the color pigment to stay on the surface [46]. The difference in contact angle for the different colors of marker may be linked to the difference in the concentration of resins, color pigments, and solvents utilized during manufacturing [47]. Particularly, the blue and green permanent markers are known to contain a large amount of the blue phthalocyanine pigment [48], which is a large organic compound that is insoluble in most solvents including water.
A leakage analysis of the 4 colors of permanent markers was conducted to further determine which color to use for the fabrication of the device. The device made with the 4 colors was dipped into the colored HPLC grade water and investigated for leakages. After 4 min in the colored water, the device made with the green and the blue color markers did not show any sign of leakage, as they provided a formidable barrier against the pressure of the water molecules (Figure 4a,b). However, the black and the red marker fabricated devices leaked after 4 min in the colored water (Figure 4c,d). This leakage can be linked to the lower concentration of the non-polar resin and pigment [46] in the red and black marker and hence the lower resistance.
Therefore, for the fabrication of the µPADs, the green and the blue markers were utilized to create hydrophobic barriers for the flow of water through the device.

3.2. Analysis of Water Sample Using the µPAD

After the selection of the Whatman grade 4 filter paper as the paper substrate and the green and the blue permanent markers as the marker type for creating hydrophobic barriers on the µPAD, the paper sensor was fabricated, and reagents were deposited on each zone.
The µPAD was used by inserting the dip zone into the water sample (as illustrated in Figure 5) and allowed to remain in the sample for about 3 min, which is the time taken to fill up the device completely. After the complete filling of the device, it was removed and read qualitatively or quantitatively depending on need.

3.2.1. Optimization of the Reagents on the µPAD, Stoichiometric Cancellation, and Expectations

The deposition of reagents was done in a way that mimicked the classification given by the World Health Organization and allowed for the selective cancelling of analytes at the reaction zones during testing. Therefore, excess analytes moved to the detection zones to produce a color change from blue to pink. For qualitative detection, the result was determined by the last color change signal from blue to pink at the detection zone starting from the leftmost detection zone D.C. Hence, if the last color change from blue to pink happens at the zones D.S., D.MH., D.H., or D.VH., it means the hardness of the water is either soft, moderately hard, hard, or very hard, respectively (see Table S1 and Figure S1 in the Supporting Information).
For the equivalent CaCO3 concentration less than 0.61 mM (soft water), only the zones D.C. and D.S. were expected to turn from blue to pink (Figure S1a). The stoichiometric relationship that happened when the µPAD detected soft water (0.4 mM total hardness) is tabulated in Table S1a to show the cancellation of analytes and the reason for the color change at the detection zones. For CaCO3 concentration equivalent between 0.61–1.20 mM (moderately hard water), only the zones D.C., D.S., and D.MH. were expected to turn from blue to pink (Figure S1b), since only these zones had free analytes ready to react with the indicator as shown in the stochiometric table for 0.81 mM total hardness (moderately hard water) in Table S1b. For equivalent CaCO3 concentration between 1.21–1.80 mM (hard water), only the zones D.C., D.S., D.MH., and D.HW. were expected to turn from blue to pink (Figure S1c), and for equivalent CaCO3 concentration greater than 1.8 mM (very hard), all the detection zones (D.C.–D.VH.) were expected to turn from blue to pink (Figure S1d). The stoichiometric relationship for hard water (1.4 mM total hardness) and very hard water (2.0 mM total hardness) on the µPAD is tabulated in Table S1c,d, respectively, showing the progression of the analyte cancellation in the reaction zones and the moving of excess analytes to the detection zones to produce the color change.

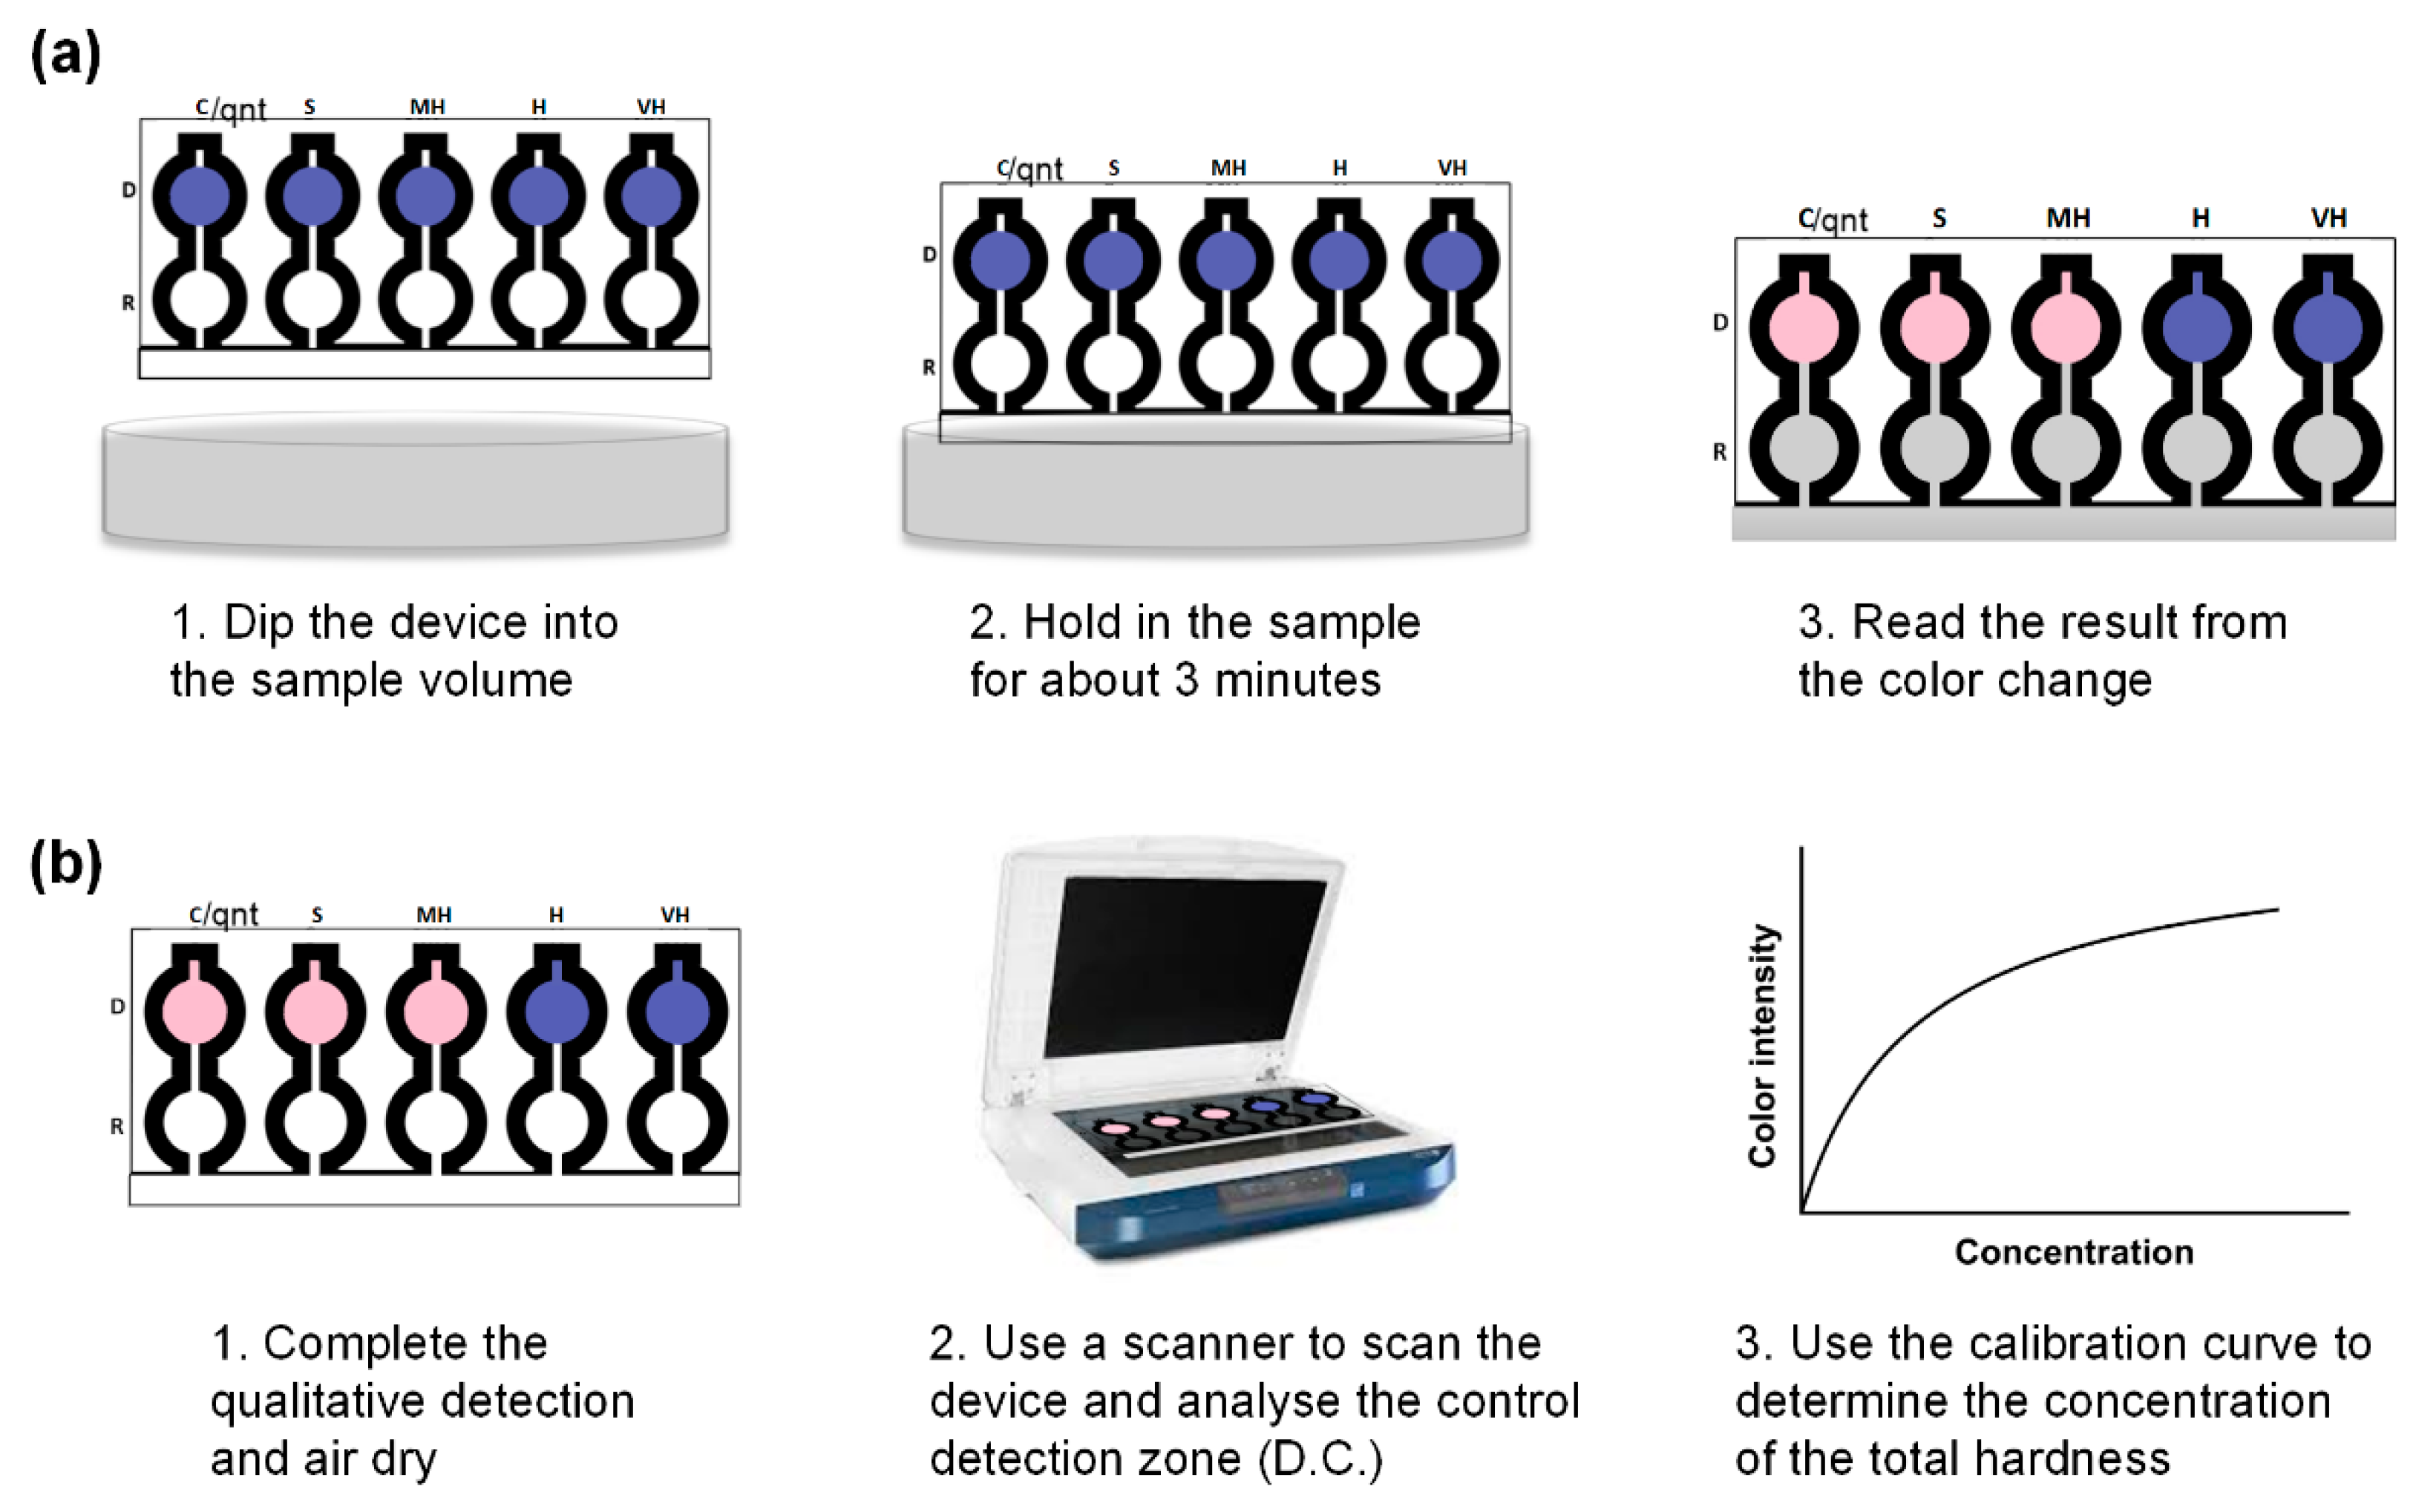
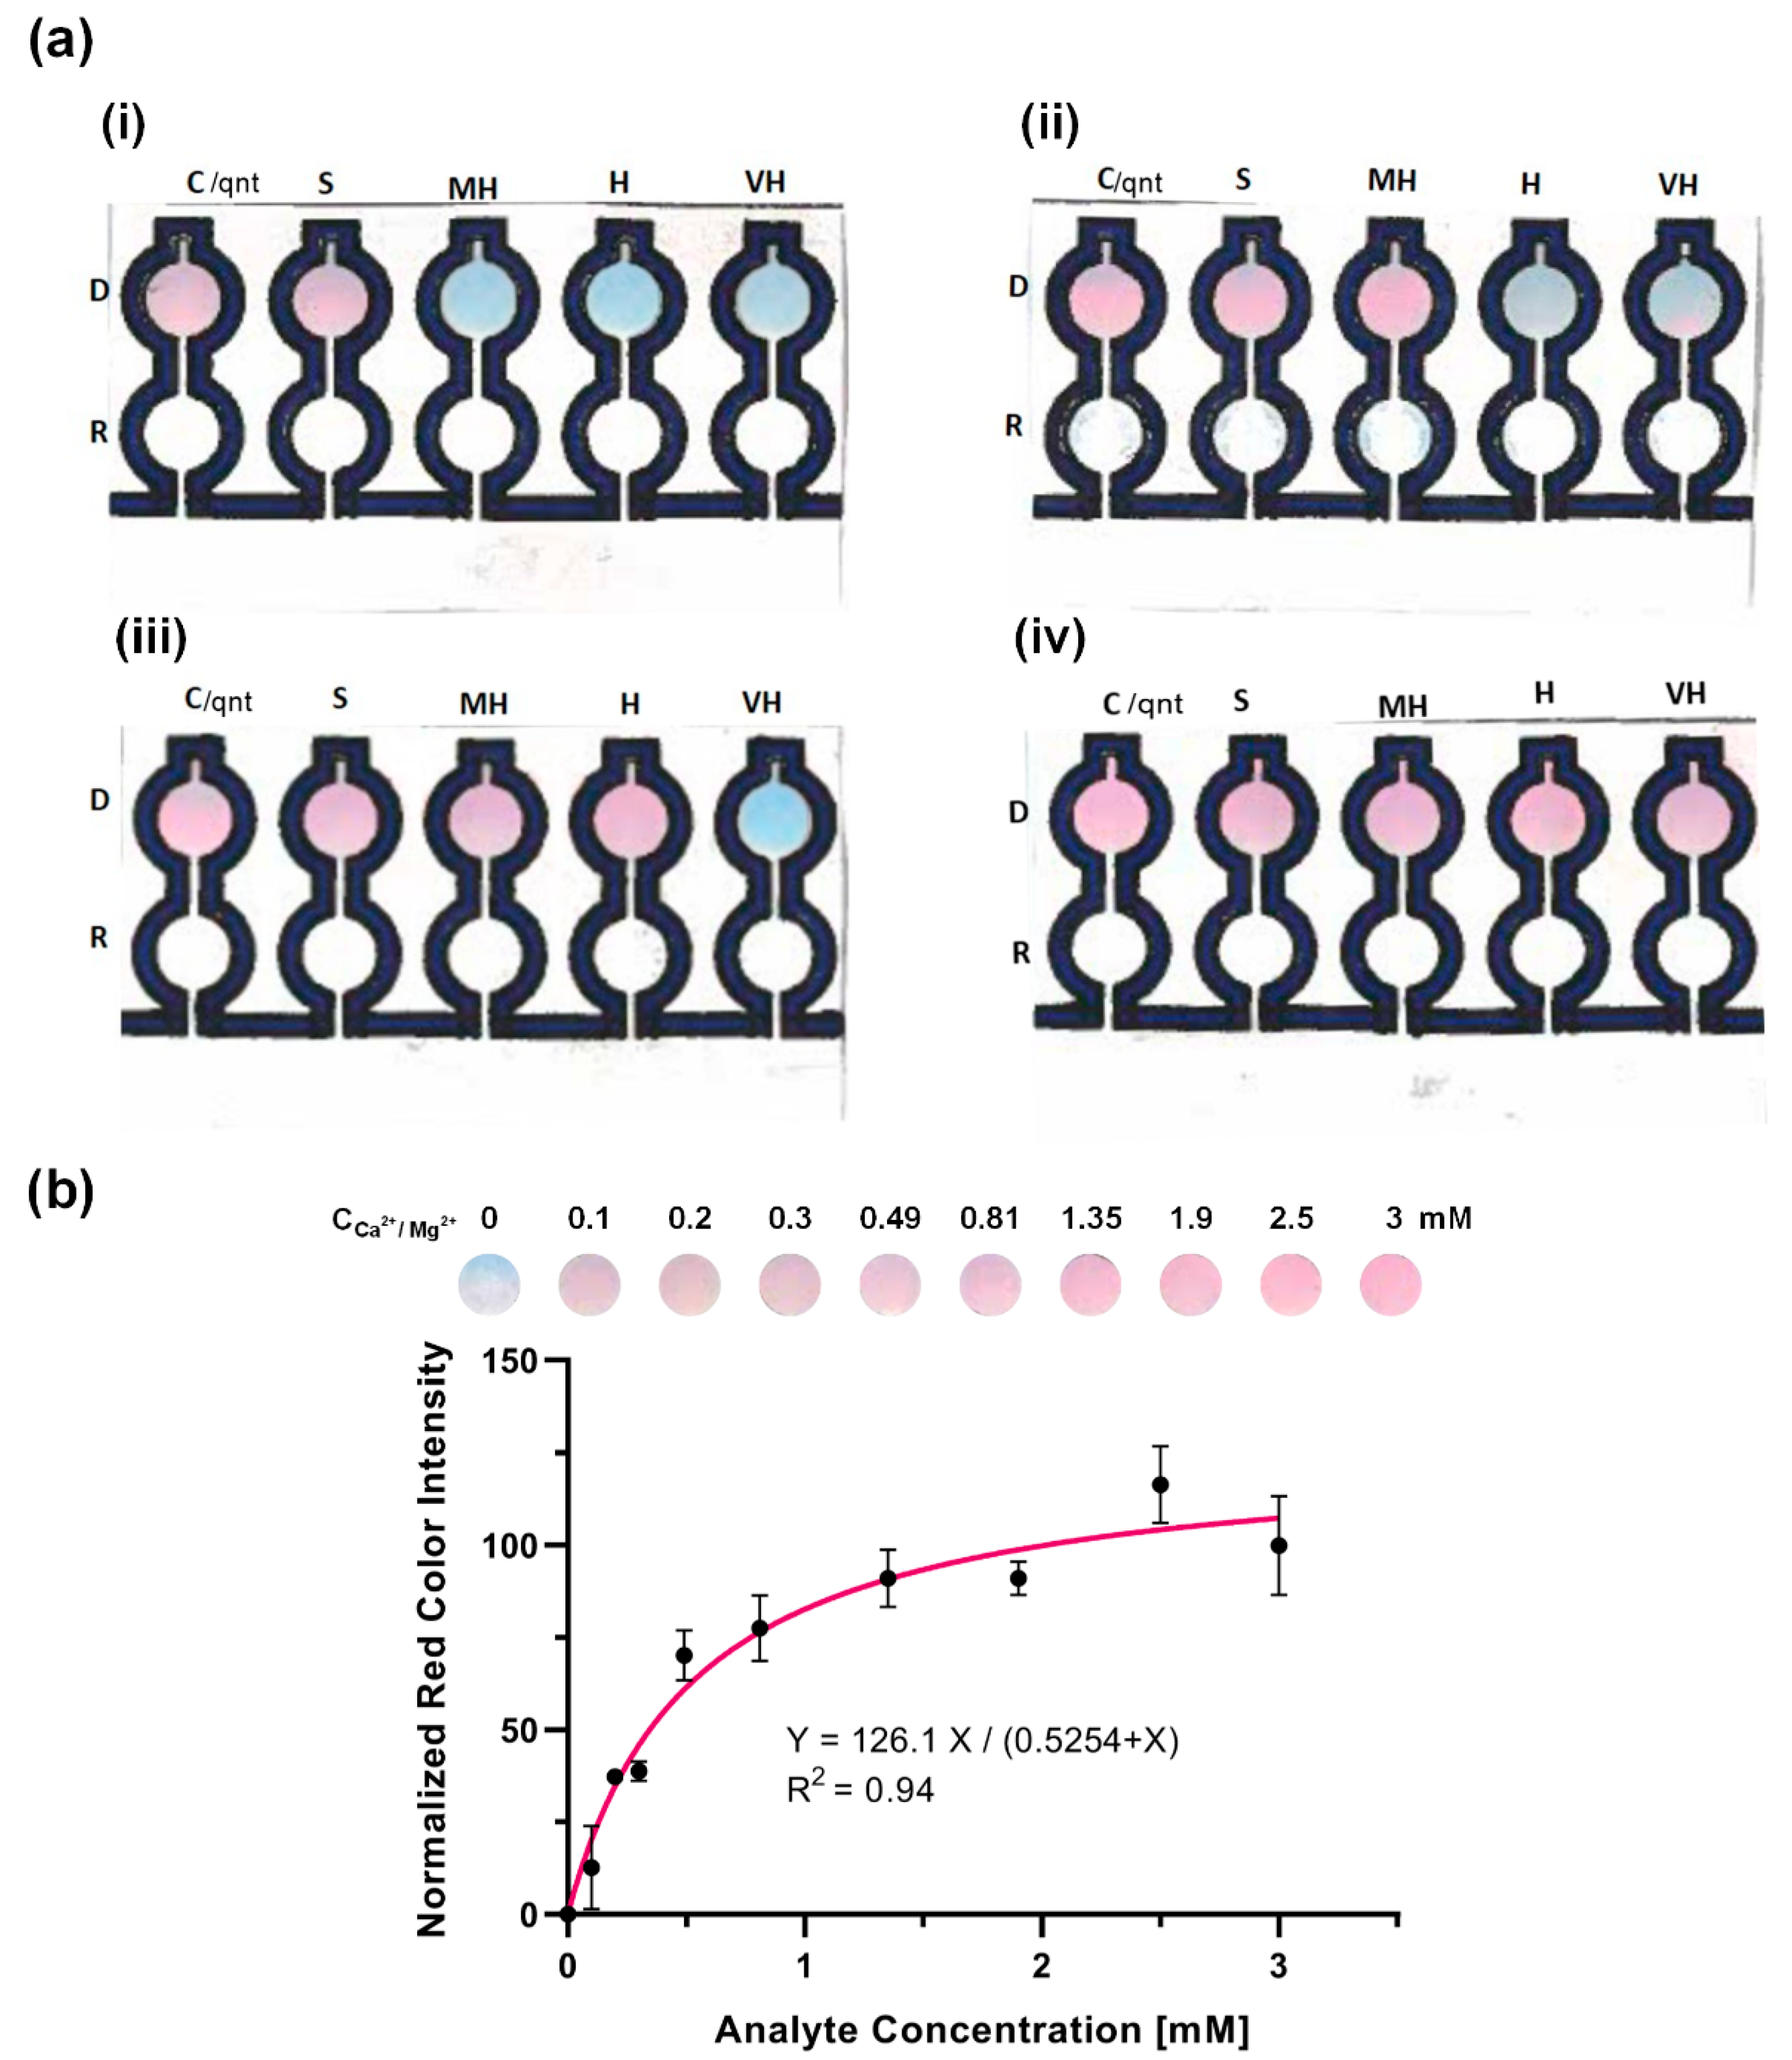
3.2.2. Qualitative Determination of the Total Hardness of Water for Spiked Sample

To evaluate the performance of the developed paper sensors, Ca2+ and Mg2+ ions as CaCO3 equivalent of the total hardness were spiked into the HPLC grade water samples at four different known concentrations and assayed using the paper device to evaluate if the color changes met the expectation. The color change expectations were based on the stoichiometry of the reactions for the total hardness of water that happened in the reaction and detection zones (see Table S1 and Figure S1 in the Supporting Information).
The results of the qualitative detection of the total hardness of water are shown in Figure 6a. The device was dipped into the water samples at room temperature, and the color changes were observed in the detection zones after ~3 min. For the spiked water sample of a concentration 0.49 mM CaCO3 equivalent (Figure 6a-i), the zones D.C. and D.S. turned pink while the remaining detection zones stayed blue. This observation showed that the water was soft, and the result was in accordance with the expectation. For the moderately hard water detection (Figure 6a-ii), a 0.81 mM spiked sample of CaCO3 equivalent was used, and the zones D.C, D.S., and D.MH. turned pink. This moderately hard water also mimicked the expectation. For the classified hard water detection (Figure 6a-iii), a 1.35 mM spiked sample of CaCO3 equivalent was used, and the expectation was for the zones D.C., D.S., D.MH. and D.H. to turn pink. The result of the actual device mimicked the expectation perfectly. This favorable result worked well for the very hard water detection as well, as shown in Figure 6a-iv using 2.5 mM spiked sample of CaCO3 equivalent total hardness. The perfect synchronization between the expectation and the actual device’s results proved that the device could qualitatively determine the total hardness of water using the classification given by the World Health Organization.
The fabricated device was also investigated to find out if it could test water samples that contain only a single ion. To do this, spiked samples of 0.81 mM calcium ion and 0.81 mM magnesium ion were utilized. At that concentration, the spiked sample falls into the moderately hard water category, and the expectation was for the zones D.C., D.S., and D.MH. to turn pink as shown in Figure S1b. The expectation was perfectly met since the zones D.C., D.S., and D.MH. turned pink as shown in Figure S2a,b. These results proved that the device is capable of testing for total hardness in water samples containing either or both magnesium and calcium ions.

3.2.3. Quantitative Determination of Total Hardness of Water for Spiked Sample

To make the sensor quantitative (not semi-quantitative), we introduced an alternative colorimetric reaction. Here, unlike other existing works, we performed a reaction without utilizing EDTA. In this approach, the colorimetric signal is not easily distinguishable by naked eyes; however, using a smart-phone or a mobile scanner, the user can store an image of the sensing zone to be analyzed by ImageJ, a mobile phone application and software available for free. Thus, for quantitative detection, the result is determined by scanning the device after the completion of the qualitative detection and the complete drying of the device. The red color intensity of the control detection zone (D.C.) is then used to determine the concentration of the equivalent ion.
To be able to use the device for the quantification of the water hardness, we tested the μPAD in a series of standard concentrations of CaCO3 equivalent of total hardness and obtained a calibration curve (Figure 6b). The concentrations 0.1, 0.2, 0.3, 0.49, 0.81, 1.35, 1.9, 2.5, and 3 mM were chosen such that they cover all types of water hardness according to the WHO classification. The quantitative detection was done through the control channel with the detection zone (DC) loaded with the indicator (EBT) and the reaction zone (RC) devoid of EDTA. The control detection zone was turned from blue to pink ~3 min after putting the device in the water samples due to the formation of calcium/magnesium–Eriochrome Black T complex. Then, the device was air dried, scanned with an office scanner, and the average red color intensity of the control detection zone was obtained by the ImageJ software. This process of detection allowed the quantitative detection of the total hardness of water without the need of EDTA in the reaction zone.
As Figure 6b demonstrates, the red color intensities in the concentration range of the experiment show a saturation behavior. This observation is justifiable by the fact that there were only limited amounts of indicator molecules reacting with the analytes to form the pink complexes, eventually reaching a saturated state in color intensities. Accordingly, we fitted the Michaelis–Menten saturation equation to our calibration data. The high R-squared value of 0.94 showed that the fitted line properly predicted the trend of the data in the desired concentration range. Therefore, this equation was used for further quantification of water hardness in real-world samples.
In addition, the limit of detection of the fabricated µPAD using a existing equation (LOD = Xb1 + 3Sb1, where Xb1 is mean concentration of the blank and Sb1 is the standard deviation of the blank) was calculated to be 0.02 mM. This low LOD improved on existing commercially available test strips (often with a LOD of 0.25 mM) and other reported µPADs in the literature. As shown in Figure 7, our fabricated µPAD improved the value of the LOD of water hardness devices by at least 80%, hence showing its greatly improved sensitivity.

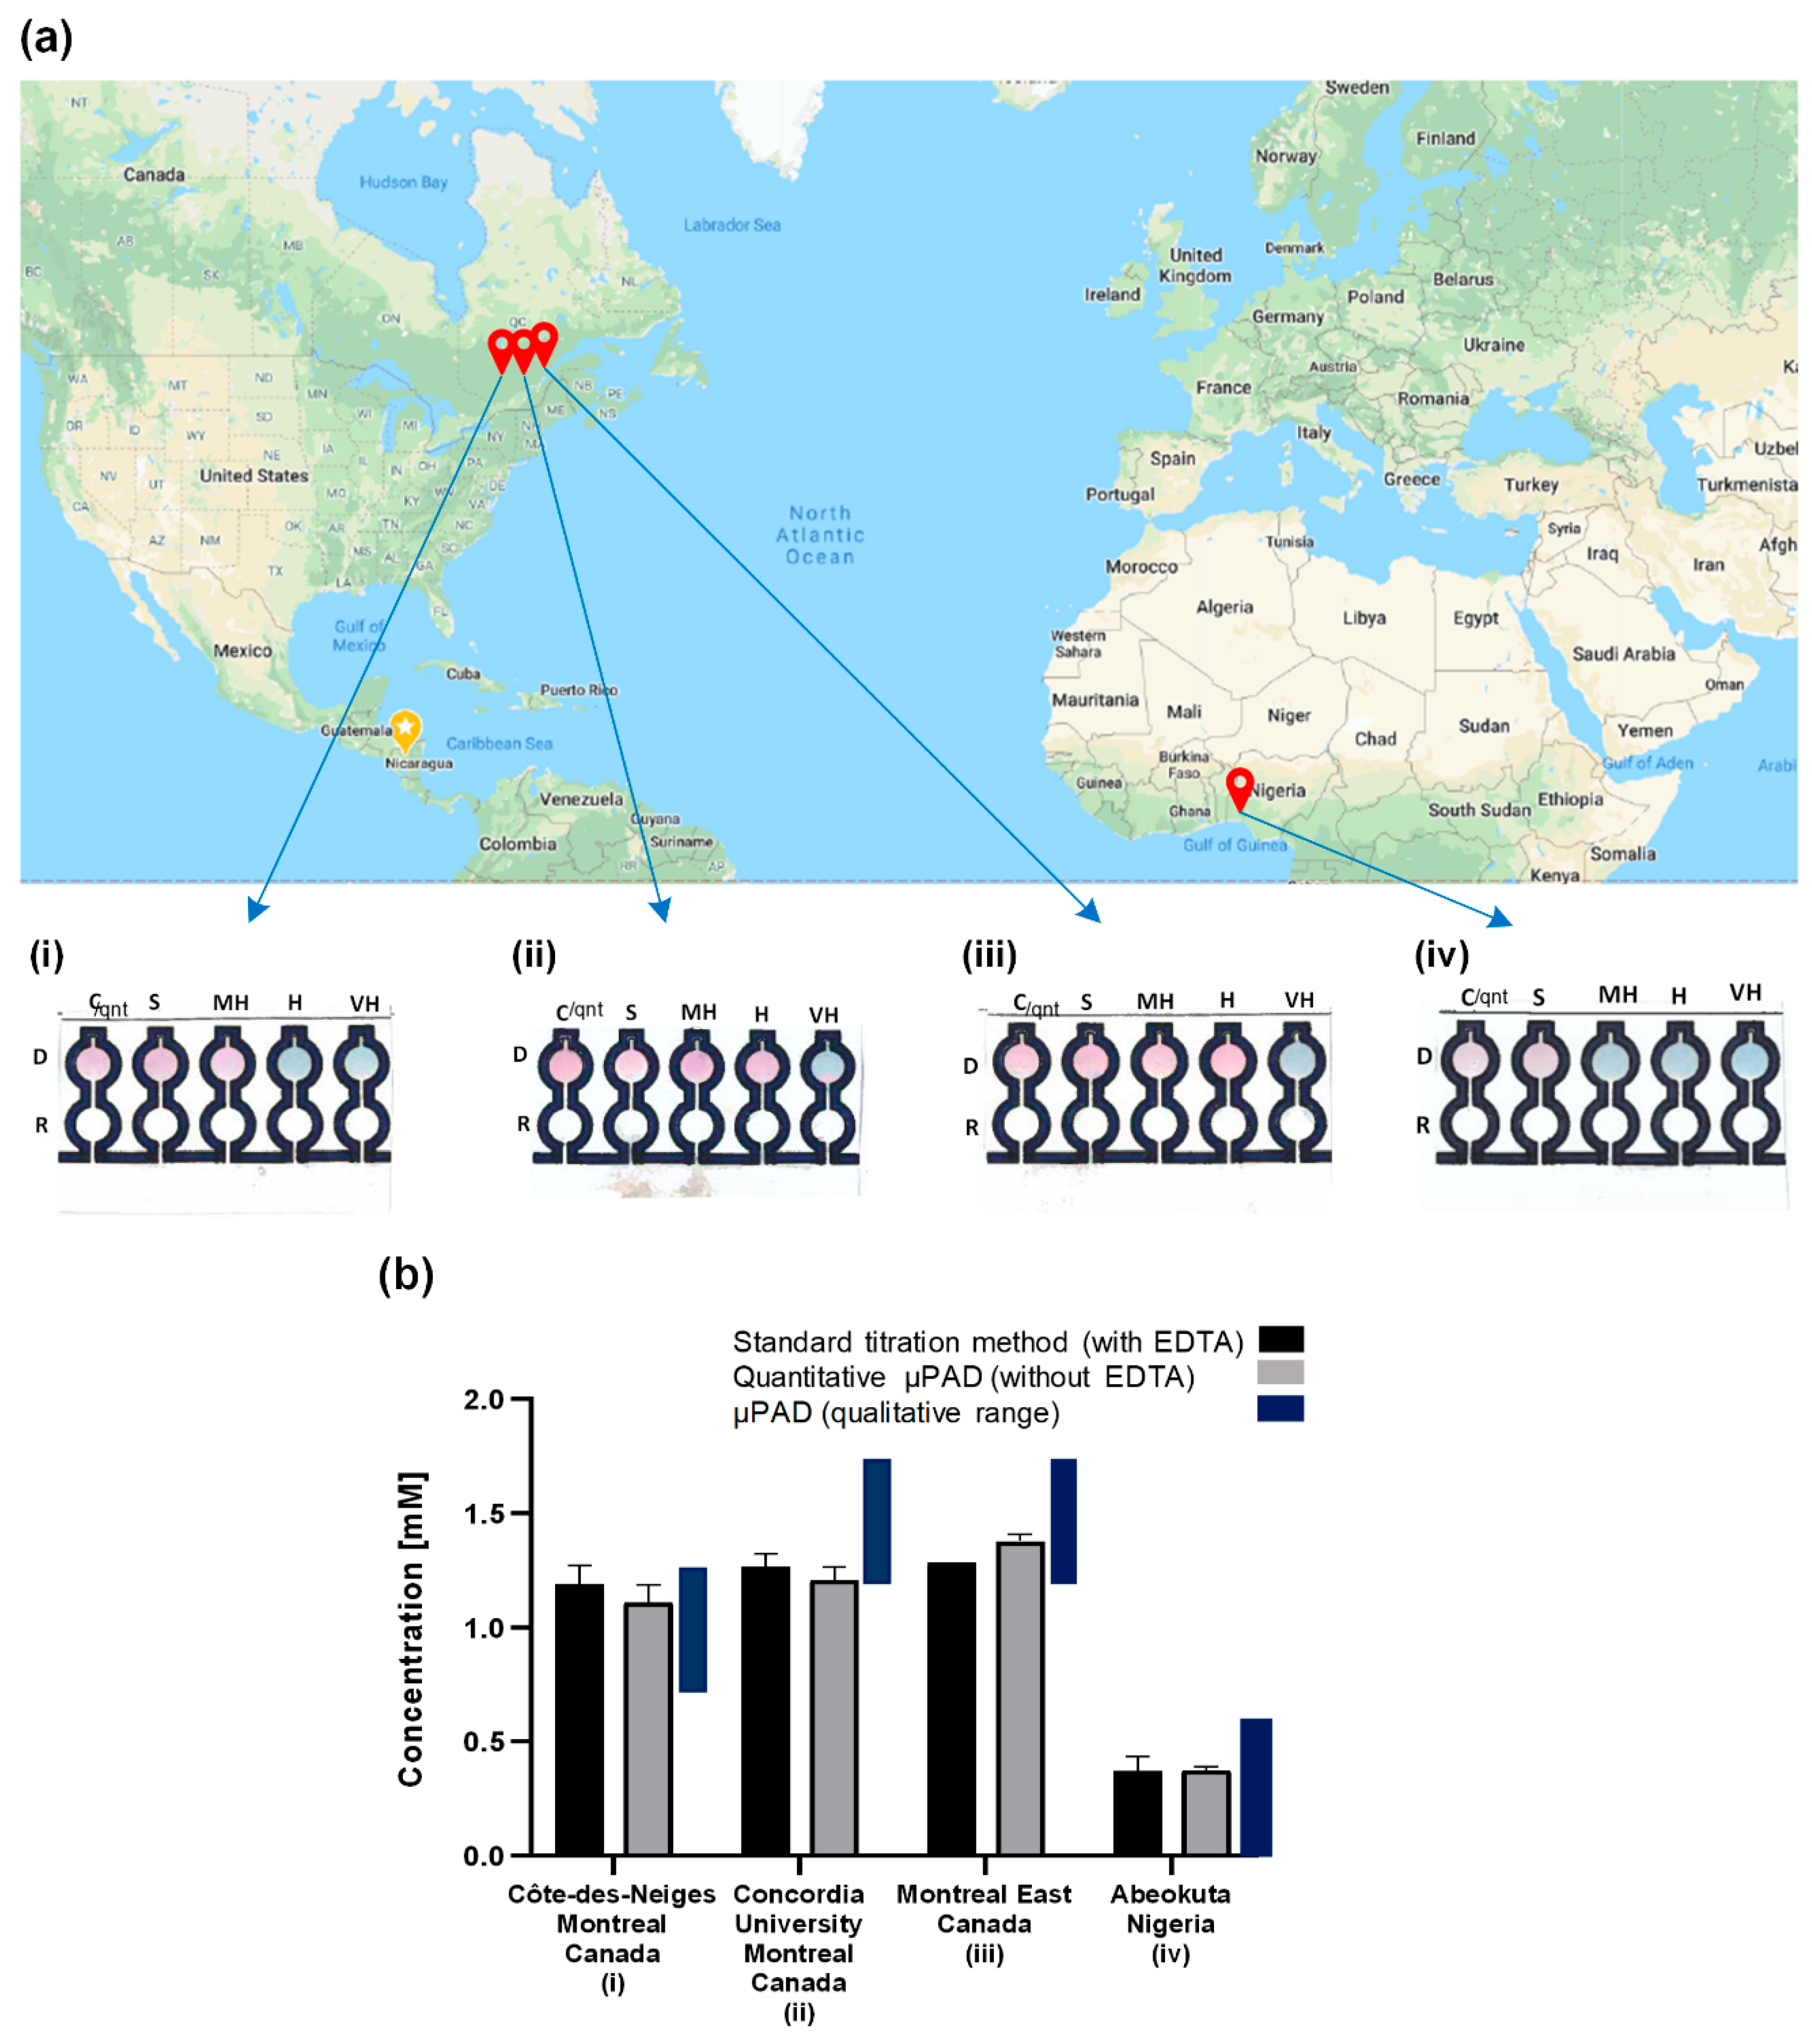
3.2.4. Real-World Sample Analysis
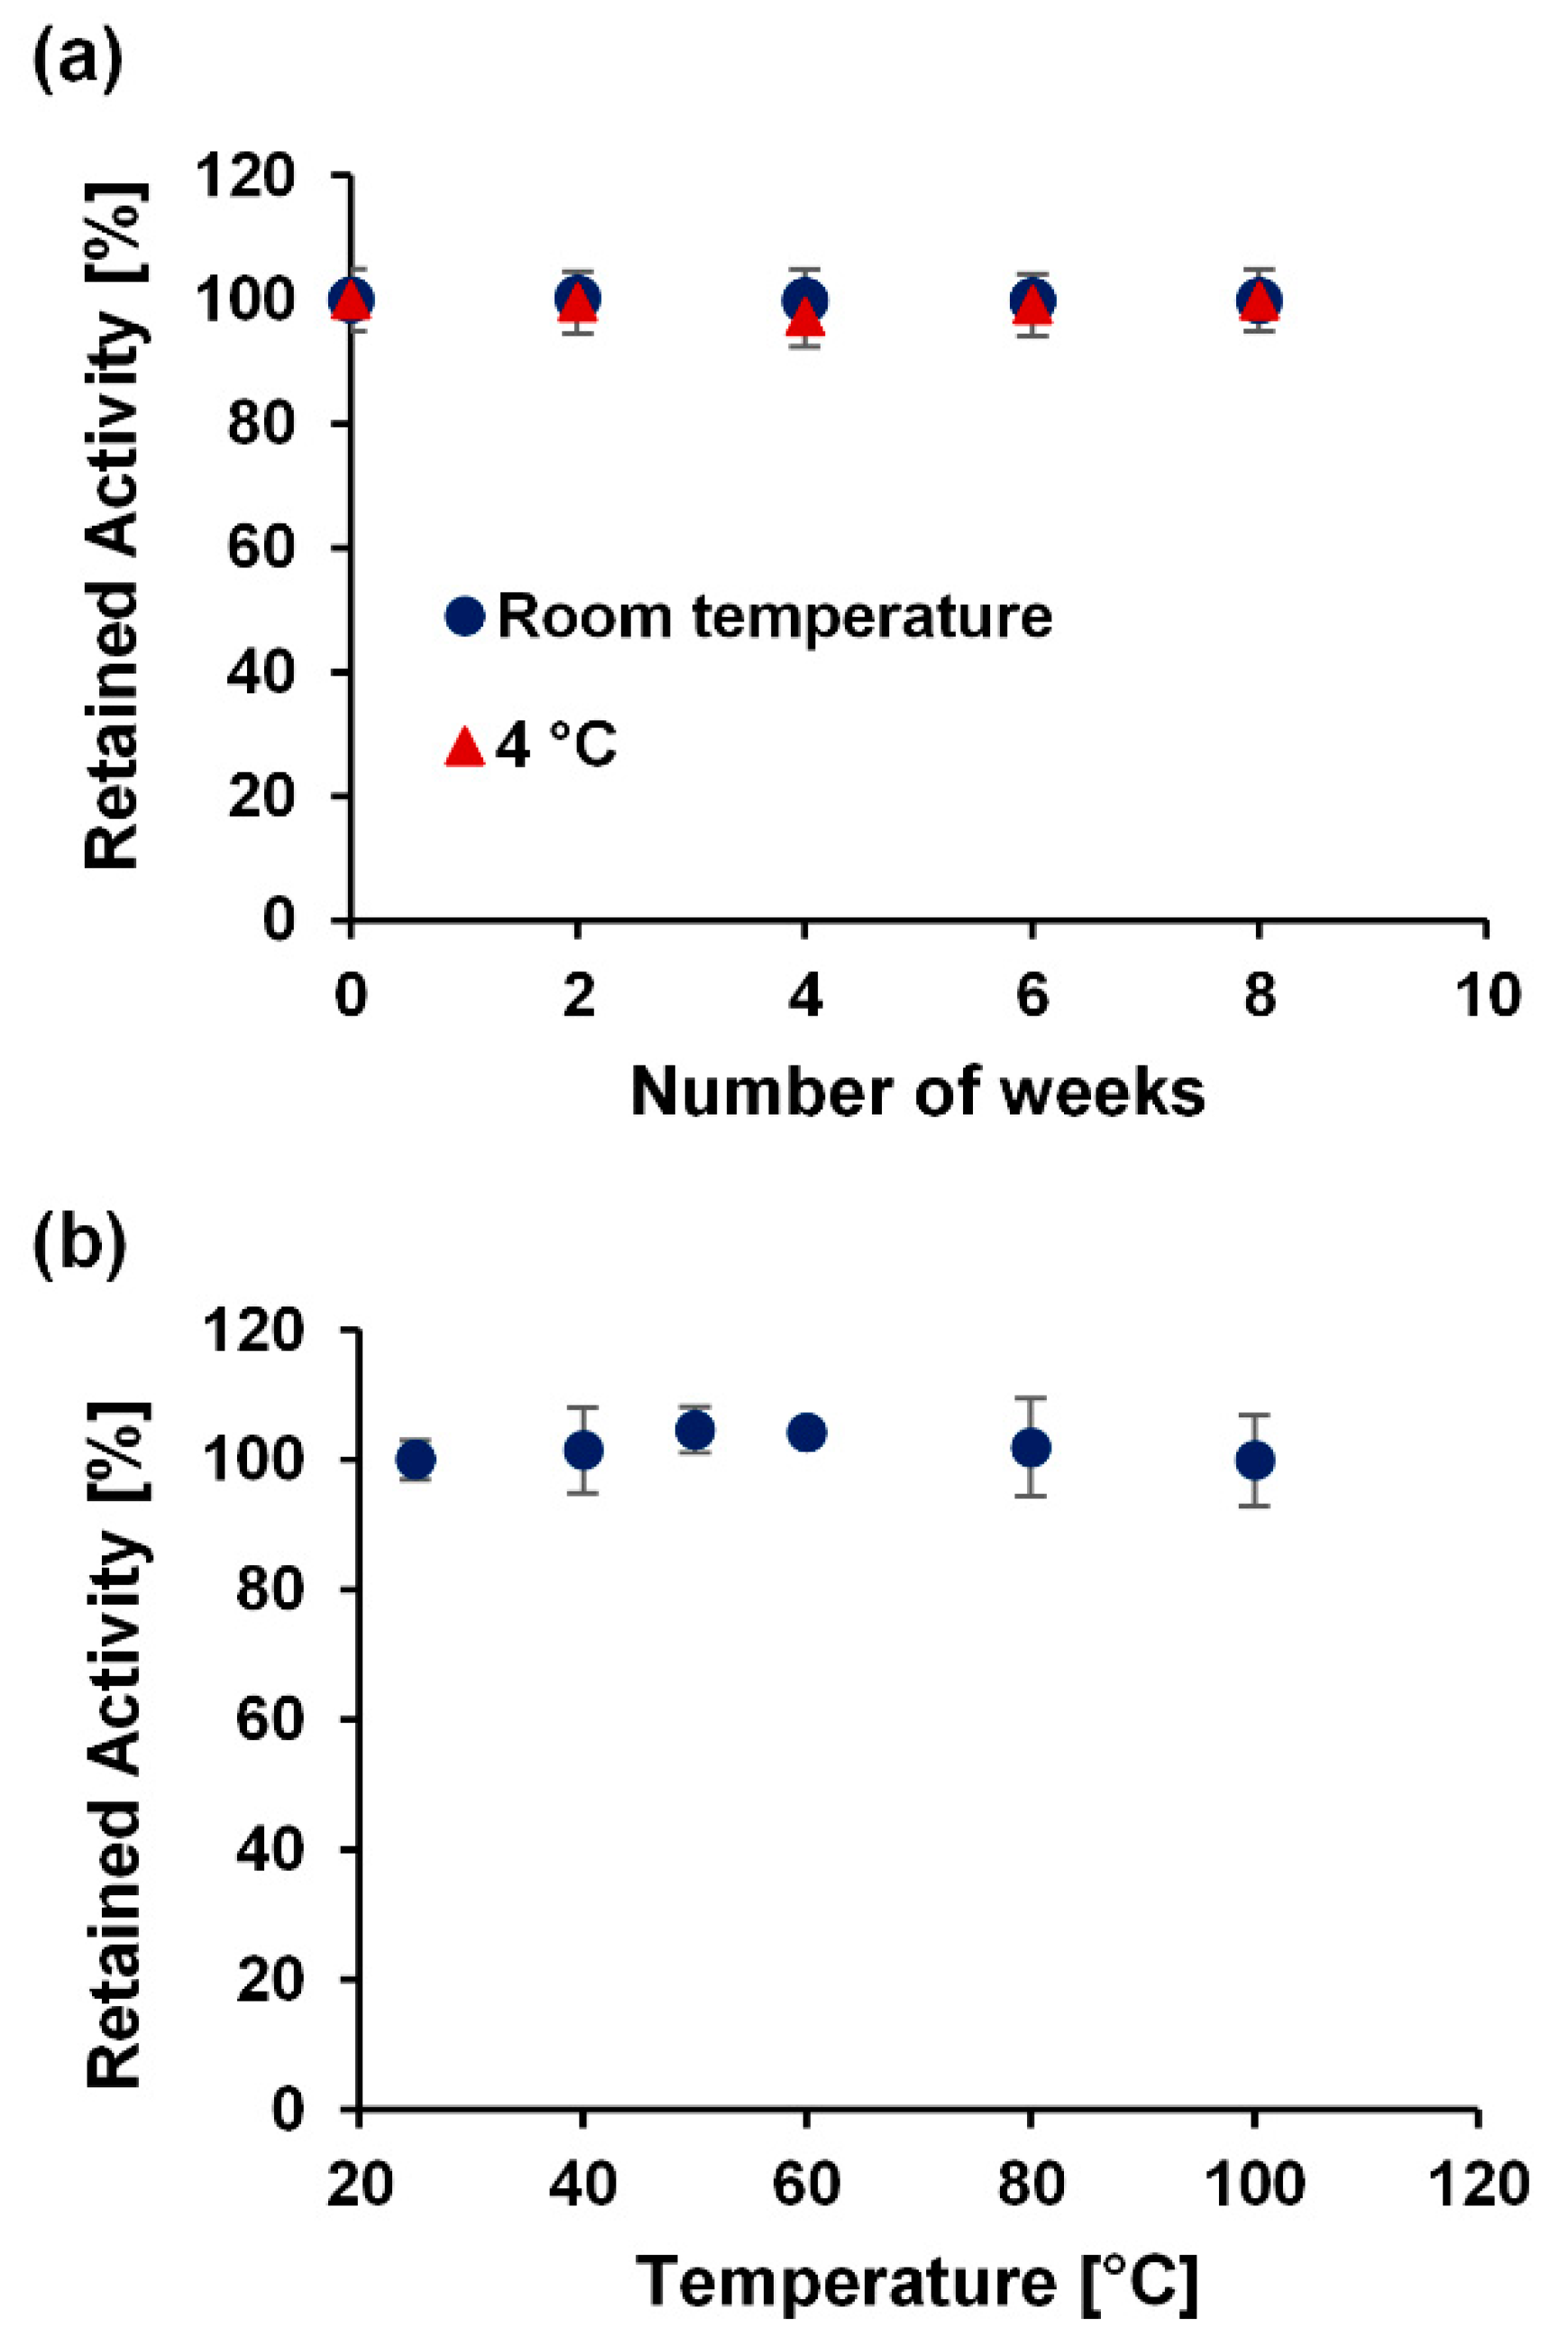
To demonstrate the applicability of the paper-based device for the determination of water hardness in real samples, tap water samples from different municipal districts were collected and analyzed for their total hardness using both the paper-based device and the common traditional titration assay. The results of the qualitative and comparative quantitative analyses are shown in Figure 8a,b, respectively. For the water sample from Abeokuta in Nigeria, the µPAD (quantitative) recorded a value of 0.37 mM, and the total hardness gotten from the traditional titration value was 0.37 mM (p = 0.932) (Figure 8b-iv). Qualitatively, the traditional titration predicted that the water was soft, and the µPAD also predicted the same (Figure 8a-iv). For the water sample from Cote des Neiges, Montreal, the total hardness gotten using the traditional titration was 1.19 mM, and the µPAD (quantitative) gave a total hardness value of 1.11 mM (p = 0.094) (Figure 8b-i). Qualitatively, the traditional titration predicted a moderately hard water sample, and the µPAD also predicted the same (Figure 8a-i). The analysis of the water samples gotten from Montreal East and the Concordia University Hall building in Montreal, Canada with the µPAD (quantitative) gave a total hardness concentration of 1.38 mM and 1.21 mM, respectively. The total hardness concentration gotten through the traditional titration for both locations were 1.29 (p = 0.052) and 1.27 mM (p = 0.222), respectively (Figure 8b-ii and iii). With the total hardness value gotten through the traditional titration means, both water samples were categorized as hard water, and the µPAD gave the same outcome (Figure 8a-ii and iii).
Overall, the device proved to be an accurate tool to test for the total hardness of water with error values of less than 7% in comparison with the traditional titration means. This error may be mainly attributed to the non-uniformity and inconsistency in the Whatman filter paper’s structure [54], which affects the repeatability and sensitivity of the assay.
Previously, µPADs have been reported for the semi-quantitative analysis of the total hardness of water using the chelate titration as the detection method [22]. Nonetheless, the proposed approach here provides a number of advantages: (1) the dip-and-read lateral flow design makes the device ready-to-use, eliminating the need for any auxiliary equipment such as volume-calibrated pipettes or droppers; (2) the design based on the WHO classification makes it easier for the final consumer to readily determine how high the total hardness of water is; and (3) the inclusion of a control zone in the design allows for the quantification of the total hardness of water for more accurate analysis.

3.3. Stability Test

Next, shelf-life investigations were performed to further demonstrate practical utility.
To evaluate the long-term stability of the device, the colorimetric response of the reagents on the µPAD to spiked water sample concentrations was monitored upon storage at room temperature, and in the fridge for up to eight weeks. As shown in Figure 9a, after monitoring the retained activity, the device was stable for at least eight weeks at room temperature and at 4 °C. Furthermore, the retained activity of the device on exposure to varying harsh temperatures over 20 min was also investigated. Figure 9b shows the stability of the device across different temperatures ranging from 25–100 °C. These stability results show the excellent shelf-life of the device at varying conditions.

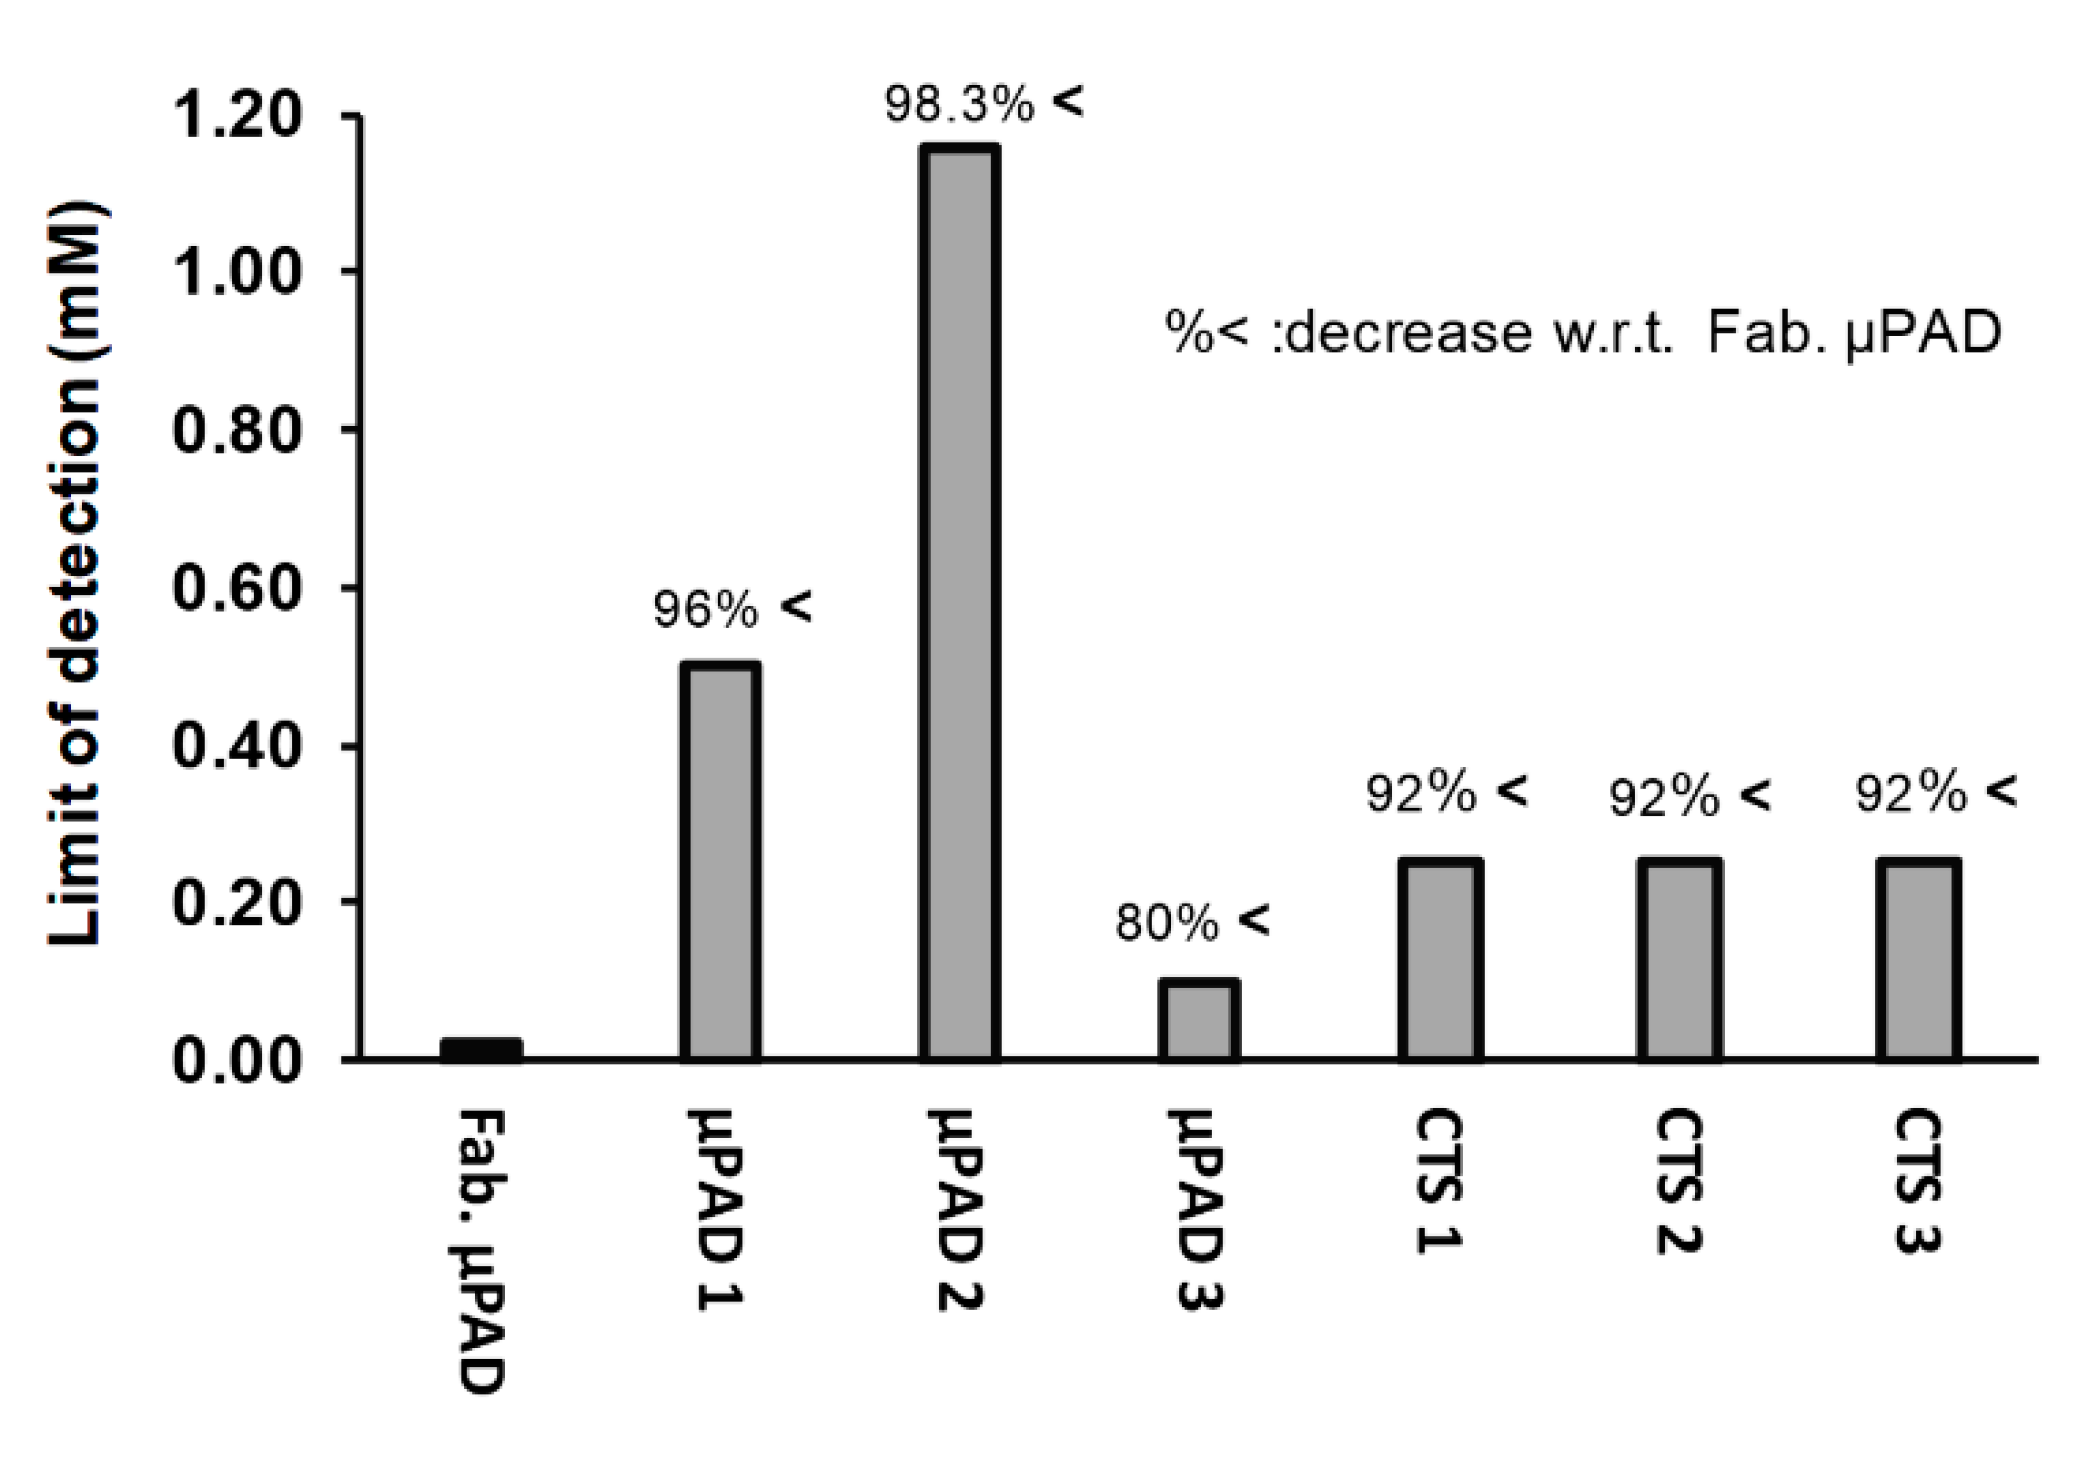
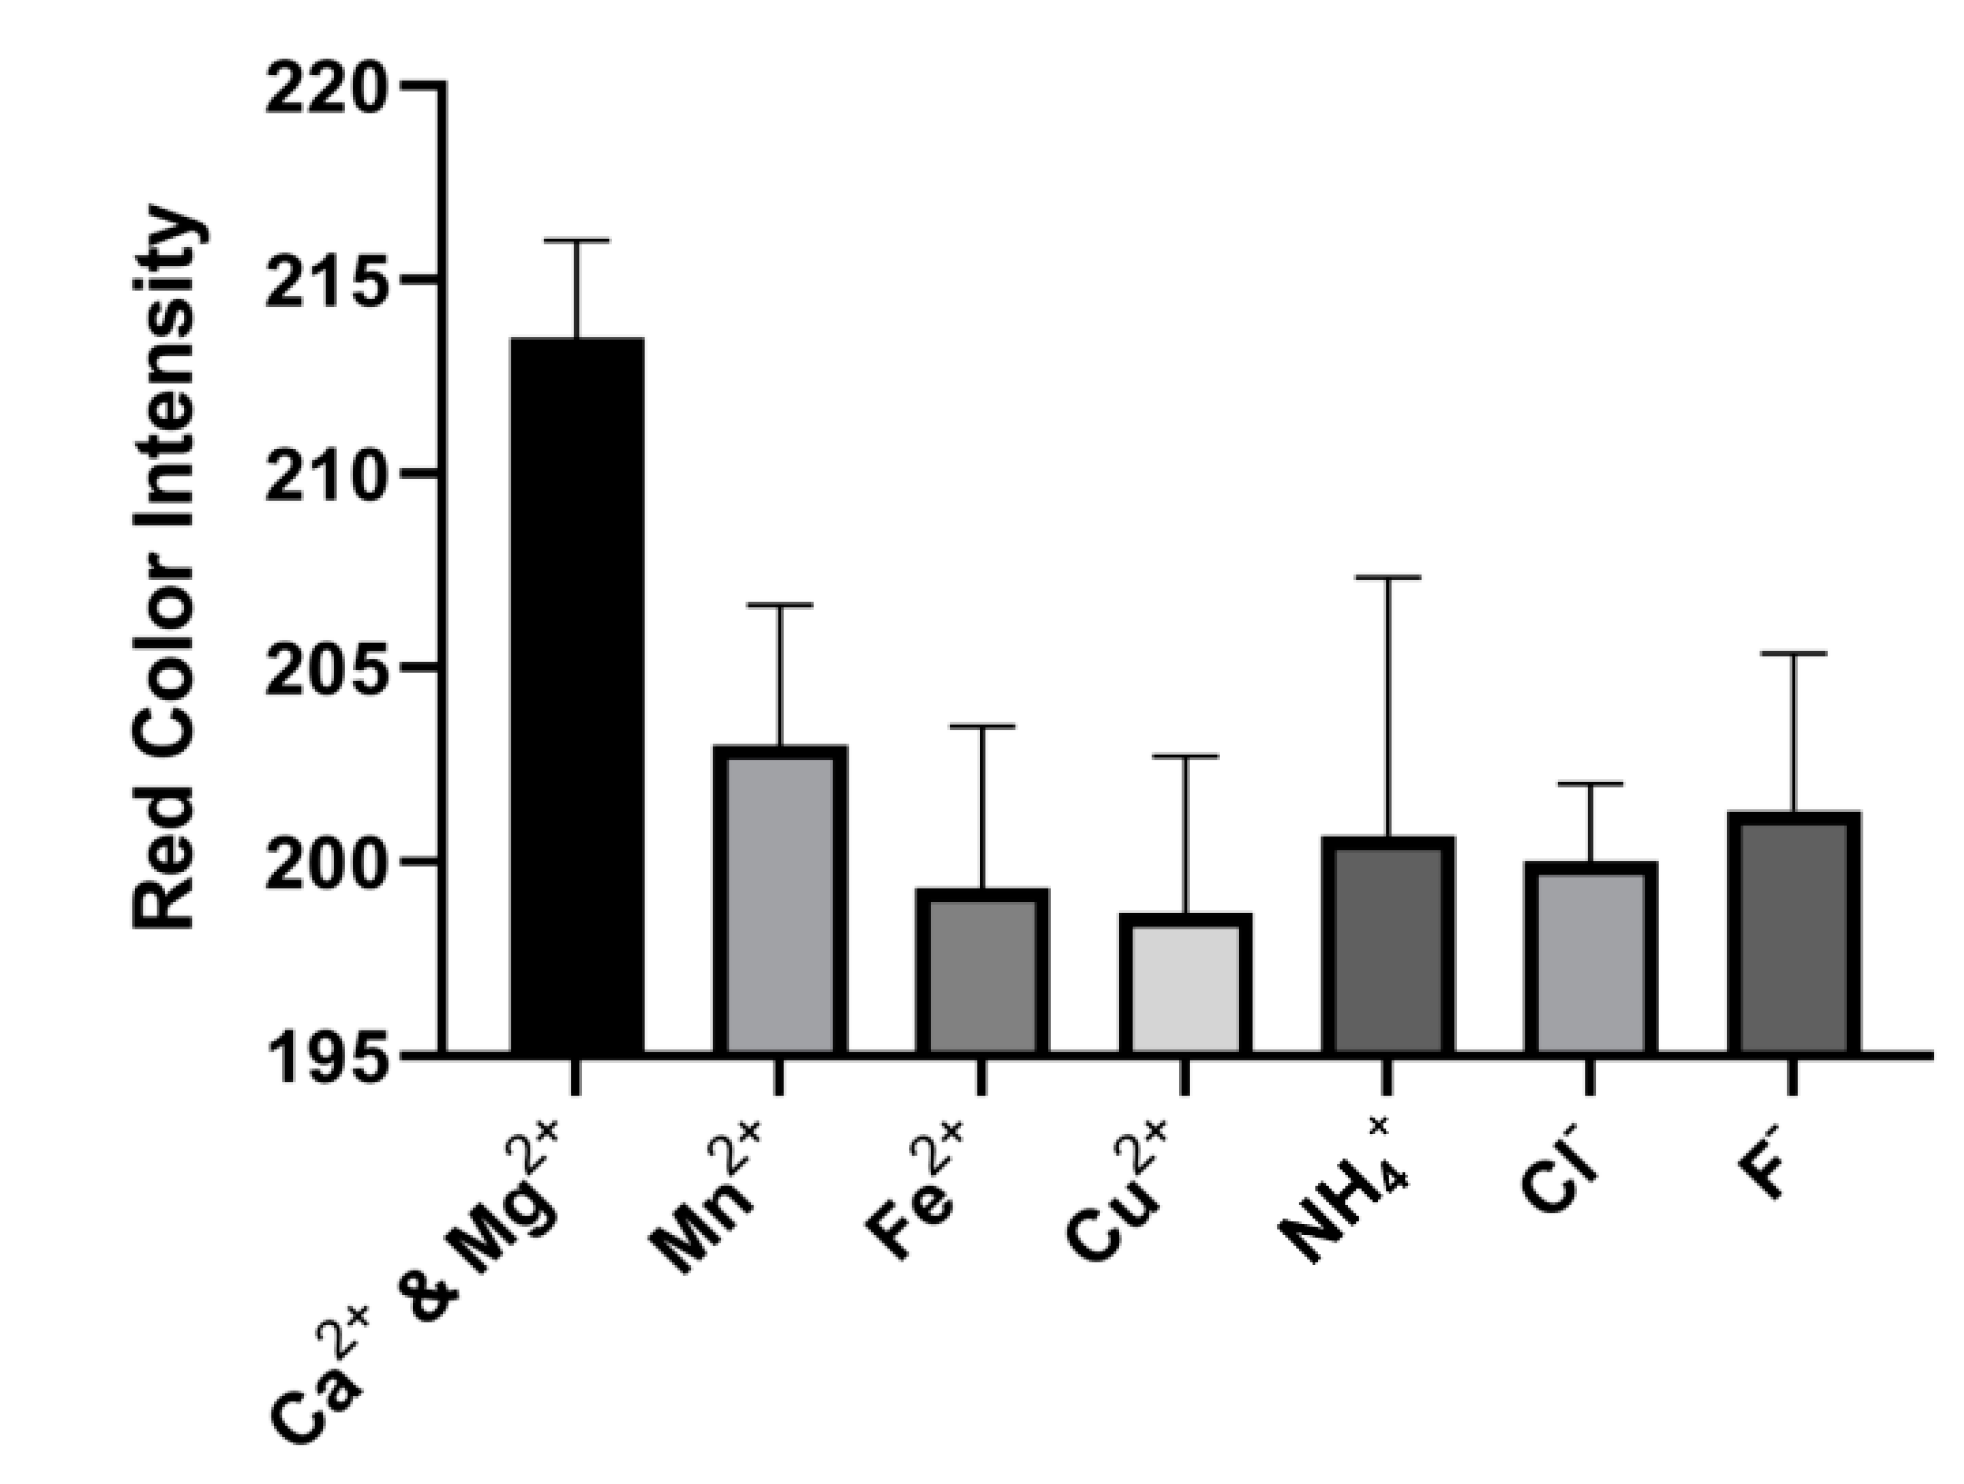
3.4. Interference Test

After the analytical performance comparison and shelf-life evaluation, the interference of common ions in water such as Mn2+, Fe2+, NH4+, Cl, F, and Cu2+ was investigated. The maximum allowable concentration (MAC) of these studied ions is given in the Supplementary Information. The MAC of each of the ions is less than 80 µM; hence, the interference of 100 µM (0.1 mM) of each ion was compared with the limit of detection of the device (0.1 mM) for the total water hardness. Figure 10 shows the average red color intensity value of 214 when the device began to quantitatively detect the presence of ions (Mg2+ & Ca2+) in the water samples (LOD), and the red color intensity of the tested interference ions were largely lower than this value. Hence, each of the ions had no significant interference with the usage of the device for the detection of the total hardness of water at the maximum allowable concentration set by Health Canada.

4. Conclusions

Developing low-cost and portable analytical devices are of high importance, especially for remote places, developing countries, and point-of-use testing. Here, we developed a paper-based analytical device with off-the-shelf permanent markers (Sharpie©) along with a regular office printer which together cost less than $1 CAD for the creation of 100 devices. The proposed approach can be of particular interest to laboratories with a very limited budget and/or minimal space to accommodate more advanced equipment such as a laser cutter, XY plotter, photolithography, hot embossing, etc. In addition, in established laboratories that are already equipped with one of those (recently discontinued) Xerox solid ink printers plus the required oven, in case the printer breaks down the presented approach can be considered to resume the experiments instantly without delay. The dip-and-read design of the device also eliminates any requirements for auxiliary equipment. We have demonstrated that the fabricated paper-based analytical device can appropriately detect the total hardness of water quantitatively and qualitatively in accordance with the classification given by the World Health Organization. Using such classification in the design helps the final user to simply determine whether the water is soft, moderately hard, hard, or very hard in about 3 min with the naked eye, and if needs be, quantitative analysis can be conducted to have a numeric value of the total hardness by making use of the calibration curve that was generated. This quantitative calibration curve was generated using a new alternative reaction without the use of EDTA as a standard solution for the detection on the µPAD. To determine the exact value of the water hardness, a smart-phone or a mobile scanner can be used to analyze the color intensity of the designated sensing zone. The developed µPAD showed a calculated limit of detection (LOD) of 0.02 mM, which is at least 80% less than those of the commercially available test strip and other reported µPADs. In addition, the µPAD demonstrated an excellent stability over a long time at varying temperature conditions and resistance to interference from common water interference ions.

Supplementary Materials

The following are available online at https://www.mdpi.com/2227-9040/8/4/97/s1, Figure S1: Schematic of the complexometric titration in the solution phase in laboratory test tubes and the expectations on the paper-based device according to the stoichiometric calculations which were presented in Table S1: (a) soft water, (b) moderately hard water, (c) hard water, and (d) very hard water (D: detection zone; R: reaction zone; C: control; S: soft; MH: moderately hard; H: hard; VH: very hard), Figure S2: Qualitative detection of total hardness of water containing only a single ion of calcium and magnesium ion. (a) 0.81 mM calcium ion, and (b) 0.81 mM magnesium ion, Table S1: Calculations of the stoichiometric expectations for the test results of the spiked water samples with Mg2+ and Ca2+ using the paper-based device. (a) Soft water with the total hardness less than 60 mM; (b) moderately hard water with the total hardness between 0.61–1.20 mM; (c) hard water with the total hardness between 1.21–1.8 mM; (d) very hard water with the total hardness more than 1.81 mM, Maximum allowable concentration (MAC) of ions in water.

Author Contributions

Conceptualization, S.J.-A.; methodology, O.D.O., S.H.S.-T. and S.J.-A.; software, O.D.O. and S.H.S.-T.; validation, O.D.O. and S.H.S.-T.; investigation, O.D.O., S.H.S.-T. and S.J.-A.; data curation, O.D.O., S.H.S.-T. and S.J.-A.; writing—original draft preparation, O.D.O.; writing—review and editing, O.D.O., S.H.S.-T. and S.J.-A.; supervision, S.J.-A.; funding acquisition, S.J.-A. All authors have read and agreed to the published version of the manuscript.

Funding

The authors thank the Natural Sciences and Engineering Research Council of Canada for funding this work through a Discovery Grant, and the Concordia University for the Concordia FRDP grant for Development of Paper-Based Microfluidic Analytical Device (μPADs) for Diagnostic and Environmental Application.

Conflicts of Interest

The authors declare no conflict of interest.

References

  1. World Health Organization. Hardness in Drinking Water: Background Document for Development of WHO Guidelines for Drinking Water Quality; WHO: Geneva, Switzerland, 2010. [Google Scholar]
  2. Abeliotis, K.; Candan, C.; Amberg, C.; Ferri, A.; Osset, M.; Owens, J.; Stamminger, R. Impact of water hardness on consumers’ perception of laundry washing result in five European countries. Int. J. Consum. Stud. 2014, 39, 60–66. [Google Scholar] [CrossRef]
  3. Liang, J.; Huang, Y.; Zhang, F.; Zhang, Y.; Li, N.; Chen, Y. The use of graphene oxide membranes for the softening of hard water. Sci. China Ser. E Technol. Sci. 2014, 57, 284–287. [Google Scholar] [CrossRef]
  4. Water and Air Quality Bureau, Healthy Environments and Consumer Safety Branch, Health Canada. Guidelines for Canadian Drinking Water Quality—Summary Table; Health Canada: Ottawa, ON, Canada, 2019.
  5. Leurs, L.J.; Schouten, L.J.; Mons, M.N.; Goldbohm, R.A.; Brandt, P.A.V.D. Relationship between Tap Water Hardness, Magnesium, and Calcium Concentration and Mortality due to Ischemic Heart Disease or Stroke in the Netherlands. Environ. Health Perspect. 2009, 118, 414–420. [Google Scholar] [CrossRef] [PubMed] [Green Version]
  6. Sengupta, P. Potential Health Impacts of Hard Water. Int. J. Prev. Med. 2013, 4, 866–875. [Google Scholar] [PubMed]
  7. Cotruvo, J.A.; Costello, R.; Weglicki, W.B. Public Health—Magnesium, Hard Water, and Health. J. Am. Water Work. Assoc. 2017, 109, 62–68. [Google Scholar] [CrossRef]
  8. Bakker, E. Ion-Selective Electrodes. In Reference Module in Chemistry, Molecular Sciences and Chemical Engineering; Elsevier: Amsterdam, The Netherlands, 2018; ISBN 978-0-12-409547-2. [Google Scholar]
  9. Butcher, D.J. Advances in Inductively Coupled Plasma Optical Emission Spectrometry for Environmental Analysis. Instrum. Sci. Technol. 2010, 38, 458–469. [Google Scholar] [CrossRef]
  10. Yang, C.-H.; Shi, X.-H.; Yuan, J.-H.; Chang-Hu, Y.; Xiang-Hua, S.; Jian-Hui, Y. Study on the Application of Raman Spectroscopy on Detecting Water Hardness. Water Environ. Res. 2014, 86, 417–420. [Google Scholar] [CrossRef]
  11. Channon, R.B.; Yang, Y.; Feibelman, K.M.; Geiss, B.J.; Dandy, D.S.; Henry, C.S. Development of an Electrochemical Paper-Based Analytical Device for Trace Detection of Virus Particles. Anal. Chem. 2018, 90, 7777–7783. [Google Scholar] [CrossRef]
  12. De Oliveira, T.R.; Fonseca, W.T.; Setti, G.D.O.; Faria, R.C. Fast and flexible strategy to produce electrochemical paper-based analytical devices using a craft cutter printer to create wax barrier and screen-printed electrodes. Talanta 2019, 195, 480–489. [Google Scholar] [CrossRef]
  13. Nantaphol, S.; Kava, A.A.; Channon, R.B.; Kondo, T.; Siangproh, W.; Chailapakul, O.; Henry, C.S. Janus electrochemistry: Simultaneous electrochemical detection at multiple working conditions in a paper-based analytical device. Anal. Chim. Acta 2019, 1056, 88–95. [Google Scholar] [CrossRef] [PubMed]
  14. Sicard, C.; Glen, C.; Aubie, B.; Wallace, D.; Jahanshahi-Anbuhi, S.; Pennings, K.; Daigger, G.T.; Pelton, R.H.; Brennan, J.D.; Filipe, C.D. Tools for water quality monitoring and mapping using paper-based sensors and cell phones. Water Res. 2015, 70, 360–369. [Google Scholar] [CrossRef] [PubMed]
  15. Jahanshahi-Anbuhi, S.; Henry, A.; Leung, V.; Sicard, C.; Pennings, K.; Pelton, R.; Brennan, J.D.; Filipe, C.D.M. Paper-based microfluidics with an erodible polymeric bridge giving controlled release and timed flow shutoff. Lab Chip 2014, 14, 229–236. [Google Scholar] [CrossRef] [PubMed]
  16. Jahanshahi-Anbuhi, S.; Pennings, K.; Leung, V.; Liu, M.; Carrasquilla, C.; Kannan, B.; Li, Y.; Pelton, R.; Brennan, J.D.; Filipe, C.D.M. Pullulan Encapsulation of Labile Biomolecules to Give Stable Bioassay Tablets. Angew. Chem. Int. Ed. 2014, 53, 6155–6158. [Google Scholar] [CrossRef] [PubMed]
  17. Satarpai, T.; Shiowatana, J.; Siripinyanond, A. Paper-based analytical device for sampling, on-site preconcentration and detection of ppb lead in water. Talanta 2016, 154, 504–510. [Google Scholar] [CrossRef]
  18. Wu, Q.; He, J.; Meng, H.; Wang, Y.; Zhang, Y.; Li, H.; Feng, L. A paper-based microfluidic analytical device combined with home-made SPE column for the colorimetric determination of copper(II) ion. Talanta 2019, 204, 518–524. [Google Scholar] [CrossRef]
  19. Chen, G.-H.; Chen, W.-Y.; Yen, Y.-C.; Wang, C.-W.; Chang, H.-T.; Chen, C.-F. Detection of Mercury(II) Ions Using Colorimetric Gold Nanoparticles on Paper-Based Analytical Devices. Anal. Chem. 2014, 86, 6843–6849. [Google Scholar] [CrossRef]
  20. Firdaus, M.L.; Aprian, A.; Meileza, N.; Hitsmi, M.; Elvia, R.; Rahmidar, L.; Khaydarov, R.R. Smartphone Coupled with a Paper-Based Colorimetric Device for Sensitive and Portable Mercury Ion Sensing. Chemosensors 2019, 7, 25. [Google Scholar] [CrossRef] [Green Version]
  21. Marquez, S.; Liu, J.; Morales-Narváez, E. Paper-based analytical devices in environmental applications and their integration with portable technologies. Curr. Opin. Environ. Sci. Health 2019, 10, 1–8. [Google Scholar] [CrossRef]
  22. Karita, S.; Kaneta, T. Chelate titrations of Ca2+ and Mg2+ using microfluidic paper-based analytical devices. Anal. Chim. Acta 2016, 924, 60–67. [Google Scholar] [CrossRef] [Green Version]
  23. Shibata, H.; Hiruta, Y.; Citterio, D. Fully inkjet-printed distance-based paper microfluidic devices for colorimetric calcium determination using ion-selective optodes. Analyst 2019, 144, 1178–1186. [Google Scholar] [CrossRef]
  24. Rattanarat, P.; Dungchai, W.; Cate, D.M.; Siangproh, W.; Volckens, J.; Chailapakul, O.; Henry, C.S. A microfluidic paper-based analytical device for rapid quantification of particulate chromium. Anal. Chim. Acta 2013, 800, 50–55. [Google Scholar] [CrossRef] [Green Version]
  25. Kudo, H.; Yamada, K.; Watanabe, D.; Suzuki, K.; Citterio, D. Paper-Based Analytical Device for Zinc Ion Quantification in Water Samples with Power-Free Analyte Concentration. Micromachines 2017, 8, 127. [Google Scholar] [CrossRef]
  26. Yamada, K.; Citterio, D.; Henry, C.S. “Dip-and-read” paper-based analytical devices using distance-based detection with color screening. Lab Chip 2018, 18, 1485–1493. [Google Scholar] [CrossRef]
  27. Sun, H.; Li, W.; Dong, Z.-Z.; Hu, C.; Leung, C.-H.; Ma, D.-L.; Ren, K. A suspending-droplet mode paper-based microfluidic platform for low-cost, rapid, and convenient detection of lead(II) ions in liquid solution. Biosens. Bioelectron. 2018, 99, 361–367. [Google Scholar] [CrossRef]
  28. Nuchtavorn, N.; Macka, M. A novel highly flexible, simple, rapid and low-cost fabrication tool for paper-based microfluidic devices (μPADs) using technical drawing pens and in-house formulated aqueous inks. Anal. Chim. Acta 2016, 919, 70–77. [Google Scholar] [CrossRef]
  29. Juang, Y.-J.; Chen, P.-S.; Wang, Y. Rapid fabrication of microfluidic paper-based analytical devices by microembossing. Sens. Actuators B Chem. 2019, 283, 87–92. [Google Scholar] [CrossRef]
  30. Juang, Y.-J.; Li, W.-S.; Chen, P.-S. Fabrication of microfluidic paper-based analytical devices by filtration-assisted screen printing. J. Taiwan Inst. Chem. Eng. 2017, 80, 71–75. [Google Scholar] [CrossRef]
  31. Jahanshahi-Anbuhi, S.; Pennings, K.; Leung, V.; Kannan, B.; Brennan, J.D.; Filipe, C.D.M.; Pelton, R. Design Rules for Fluorocarbon-Free Omniphobic Solvent Barriers in Paper-Based Devices. ACS Appl. Mater. Interfaces 2015, 7, 25434–25440. [Google Scholar] [CrossRef] [PubMed]
  32. Devadhasan, J.P.; Kim, J. A chemically functionalized paper-based microfluidic platform for multiplex heavy metal detection. Sens. Actuators B Chem. 2018, 273, 18–24. [Google Scholar] [CrossRef]
  33. Chiang, C.-K.; Kurniawan, A.; Kao, C.; Wang, M.-J. Single step and mask-free 3D wax printing of microfluidic paper-based analytical devices for glucose and nitrite assays. Talanta 2018, 194, 837–845. [Google Scholar] [CrossRef] [PubMed]
  34. Mora, M.F.; Garcia, C.D.; Schaumburg, F.; Kler, P.A.; Berli, C.; Hashimoto, M.; Carrilho, E. Patterning and Modeling Three-Dimensional Microfluidic Devices Fabricated on a Single Sheet of Paper. Anal. Chem. 2019, 91, 8298–8303. [Google Scholar] [CrossRef] [PubMed]
  35. Spicar-Mihalic, P.; Toley, B.; Houghtaling, J.; Liang, T.; Yager, P.; Fu, E. CO2 laser cutting and ablative etching for the fabrication of paper-based devices. J. Micromech. Microeng. 2013, 23, 67003. [Google Scholar] [CrossRef]
  36. Yu, L.; Shi, Z.Z. Microfluidic paper-based analytical devices fabricated by low-cost photolithography and embossing of Parafilm®. Lab Chip 2015, 15, 1642–1645. [Google Scholar] [CrossRef] [PubMed]
  37. Ching, T.; Li, Y.; Karyappa, R.; Ohno, A.; Toh, Y.-C.; Hashimoto, M.; Yingying, L. Fabrication of integrated microfluidic devices by direct ink writing (DIW) 3D printing. Sens. Actuators B Chem. 2019, 297, 126609. [Google Scholar] [CrossRef]
  38. Carrilho, E.; Martinez, A.W.; Whitesides, G.M. Understanding Wax Printing: A Simple Micropatterning Process for Paper-Based Microfluidics. Anal. Chem. 2009, 81, 7091–7095. [Google Scholar] [CrossRef] [PubMed]
  39. Chabaud, K.R.; Thomas, J.L.; Torres, M.N.; Oliveira, S.; Mccord, B.R. Simultaneous colorimetric detection of metallic salts contained in low explosives residue using a microfluidic paper-based analytical device (µPAD). Forensic Chem. 2018, 9, 35–41. [Google Scholar] [CrossRef]
  40. Tan, W.; Zhang, L.; Doery, J.C.; Shen, W. Three-dimensional microfluidic tape-paper-based sensing device for blood total bilirubin measurement in jaundiced neonates. Lab Chip 2020, 20, 394–404. [Google Scholar] [CrossRef]
  41. Yehia, A.M.; Farag, M.A.; Tantawy, M.A. A novel trimodal system on a paper-based microfluidic device for on-site detection of the date rape drug “ketamine”. Anal. Chim. Acta 2020, 1104, 95–104. [Google Scholar] [CrossRef]
  42. Xerox Inc. Available online: https://www.xerox.com/en-us/office/solid-ink (accessed on 17 March 2020).
  43. Gallibu, C.; Gallibu, C.; Avoundjian, A.; Gomez, F.A. Easily Fabricated Microfluidic Devices Using Permanent Marker Inks for Enzyme Assays. Micromachines 2016, 7, 6. [Google Scholar] [CrossRef] [Green Version]
  44. Nguyen, M.P.; Meredith, N.A.; Kelly, S.P.; Henry, C.S. Design considerations for reducing sample loss in microfluidic paper-based analytical devices. Anal. Chim. Acta 2018, 1017, 20–25. [Google Scholar] [CrossRef]
  45. Masoodi, R.; Pillai, K.M. Darcy’s law-based model for wicking in paper-like swelling porous media. AIChE J. 2010, 56. [Google Scholar] [CrossRef]
  46. Mott, C.R. Aqueous Permanent Coloring Composition for a Marker. U.S. Patent 5131776A, 21 July 1992. [Google Scholar]
  47. Sanborn, K.B.; Loftin, R.M. Permanent Aqueous Marker Inks. U.S. Patent 1994002542A1, 3 February 1994. [Google Scholar]
  48. Van Der Werf, I.D.; Germinario, G.; Palmisano, F.; Sabbatini, L. Characterisation of permanent markers by pyrolysis gas chromatography–mass spectrometry. Anal. Bioanal. Chem. 2011, 399, 3483–3490. [Google Scholar] [CrossRef] [PubMed]
  49. Shariati-Rad, M.; Heidari, S. Classification and determination of total hardness of water using silver nanoparticles. Talanta 2020, 219, 121297. [Google Scholar] [CrossRef] [PubMed]
  50. Ostad, M.A.; Hajinia, A.; Heidari, T. A novel direct and cost effective method for fabricating paper-based microfluidic device by commercial eye pencil and its application for determining simultaneous calcium and magnesium. Microchem. J. 2017, 133, 545–550. [Google Scholar] [CrossRef]
  51. HoneForest. Available online: http://www.honeforest.net/product/water-hardness-test-strips/ (accessed on 7 September 2020).
  52. Health Metric. Available online: https://www.health-metric.com/products/well-water-test-kit (accessed on 7 September 2020).
  53. Thomas Scientific. Available online: https://www.thomassci.com/Laboratory-Supplies/Water-Quality-Test-Strips/_/Total-Hardness-Test-Strips?q=Test%20Strips%20Total%20Hardness (accessed on 7 September 2020).
  54. Liu, W.; Kou, J.; Xing, H.; Li, B. Paper-based chromatographic chemiluminescence chip for the detection of dichlorvos in vegetables. Biosens. Bioelectron. 2014, 52, 76–81. [Google Scholar] [CrossRef]
Figure 1. Schematic of the microfluidic paper-based analytical device (µPAD) for the detection of the total hardness of water. (a) The principle of the complexometric titration reactions; (b) the multi-layered deposition of the analytes on the µPAD; (c) the qualitative detection of the total hardness of water; (d) the quantitative detection of the total hardness of water.
Chemosensors 08 00097 g001
Figure 2. The paper-based analytical device’s design and fabrication. (a) Schematic diagram of the lateral flow dip-and-read paper-based analytical device (D: detection; R: reaction; C: control; S: soft; MH: moderately hard; H: hard; VH: very hard). (b) Fabrication steps and procedures for the lateral flow dip-and-read paper-based analytical device.
Chemosensors 08 00097 g002
Figure 3. Optimization of the paper-based analytical device’s fabrication with respect to the paper type and marker color. (a) The elution velocity of distilled water in different grades of paper. (b) The contact angle measurement over time for the black marker, blue marker, red marker, and green marker on Whatman® Grade 4 filter paper on exposure to drops of HPLC grade water (slanted shade is measurement at 10 s and full color shade is mean measurement over 60 s). Each bar represents the mean of the three individual experiments ± standard deviation.
Chemosensors 08 00097 g003
Figure 4. Leakage analysis for different marker colors on the device: (a) green marker, (b) blue marker, (c) black marker, (d) red marker.
Chemosensors 08 00097 g004
Figure 5. The application of the paper-based analytical device for water analysis. (a) Qualitative detection of total hardness using a lateral flow dip-and-read paper based analytical device. (b) Quantitative detection of total hardness using a lateral flow dip-and-read paper based analytical device.
Chemosensors 08 00097 g005
Figure 6. Qualitative and quantitative detection of the total hardness of water. (a) Qualitative detection of the total hardness of spiked samples of (i) soft water as in 0.49 mM equivalent CaCO3 concentration, (ii) moderately hard water as in 0.81 mM equivalent CaCO3 concentration, (iii) hard water as in 1.35 mM equivalent CaCO3 concentration, and (iv) very hard water as in 2.5 mM equivalent CaCO3 concentration. (b) Calibration curve for quantitative analysis using the paper-based analytical device. The control detection zone of the device changed from blue to pink in ~3 min in correspondence with different concentrations of the CaCO3 equivalent to the total hardness of water. In the graph, the black data points represent the normalized average red color intensities of the control detection zone of the device at each concentration obtained by the ImageJ software after scanning. Each point is the mean of the three individual experiments at each concentration ± standard deviation. The solid line illustrates the best fitted Michaelis–Menten equation to the data.
Chemosensors 08 00097 g006
Figure 7. Comparison of the limit of detection (LOD) of the fabricated µPAD (Fab. µPAD) with µPAD 1 (fabricated by Karita and Kaneta [22]), µPAD 2 (fabricated by Shariati-Rad and Heidari [49]), µPAD 3 (fabricated by Ostad et al. [50]), CTS 1 (Commercial Test Strip manufactured by Honeforest [51]), CTS 2 (Commercial Test Strip manufactured by Health Metric [52]), and CTS 3 (Commercial Test Strip manufactured by Thomas Scientific [53]).
Chemosensors 08 00097 g007
Figure 8. Real-world tap water samples and comparison with the conventional detection method. (a) Qualitative analysis of the total hardness for the real-world tap water samples from (i) Côte-des-Neiges, Montreal, Canada. Moderately hard water was qualitatively predicted by the µPAD. (ii) Concordia University, Montreal, Canada. Hard water was qualitatively predicted by the µPAD. (iii) Montreal East, Canada. Hard water was qualitatively predicted by the µPAD. (iv) Abeokuta, Nigeria. Soft water was qualitatively predicted by the µPAD. (b) Quantitative analysis of the water hardness of the real-world samples with the μPAD and their comparison with the standard titration method (with ethylenediaminetetraacetic acid (EDTA)) and the range corresponding to the qualitative analysis. Each bar represents the mean of the three individual experiments for each water sample ± standard deviation. The statistical analysis showed no significant difference between the μPAD results and those of the traditional titration.
Chemosensors 08 00097 g008
Figure 9. Stability test on µPAD at varying time intervals and conditions. Retained activity of the test kit (a) over a period of 2 months (8 weeks) at room temperature and at 4 °C and (b) after 20 min at varying temperatures from 25 °C to 100 °C. Each data point is the mean of the three individual experiments ± standard deviation.
Chemosensors 08 00097 g009
Figure 10. Interference test of the common ions in water in comparison with the limit of detection (0.1 mM) of the combined calcium and magnesium ions by the device. For each of the interference ions, the concentration of 0.1 mM was used for the comparison. Each data point is the mean of the three individual experiments ± standard deviation.
Chemosensors 08 00097 g010

