Article

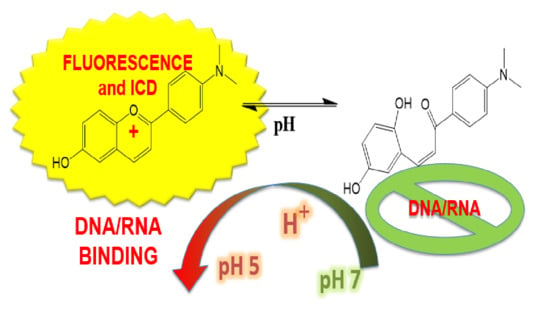
Flavylium Dye as pH-Tunable Fluorescent and CD Probe for Double-Stranded DNA and RNA

1
Division of Organic Chemistry and Biochemistry, Ruđer Bošković Institute, Bijenička cesta 54, P.O. Box 180, HR-10002 Zagreb, Croatia
2
LAQV-Laboratório Associado para a Química Verde-REQUIMTE, Departamento de Química, Faculdade de Ciências e Tecnologia, Universidade NOVA de Lisboa, Campus de Caparica, 2829-516 Caparica, Portugal
3
Department of Physical Chemistry, Faculty of Science/Chemistry, Horvatovac 102A, HR-10000 Zagreb, Croatia
*
Authors to whom correspondence should be addressed.
Chemosensors 2020, 8(4), 129; https://doi.org/10.3390/chemosensors8040129
Submission received: 12 November 2020 / Revised: 4 December 2020 / Accepted: 11 December 2020 / Published: 13 December 2020
(This article belongs to the Special Issue New insides in Fluorescent and Colorimetric Probes)

Abstract

:
The interaction of 4′-(N,N-dimethylamino)-6-hydroxyflavylium cation with double stranded (ds-) DNA/RNA was studied by UV/Vis spectrophotometry, circular dichroism (CD), and also steady-state and time-resolved emission spectroscopies at neutral and weakly acidic conditions. At pH 5, the studied molecule, in its flavylium cationic form, showed considerable binding affinities (5 < logKs < 6) for all ds-DNA/RNA, contrary to chalcones forms (dominant at pH 7), which did not show binding to polynucleotides. Flavylium cation intercalated into ds-DNAs at variance to dominant groove aggregation within ds-RNA, which was reported by RNA-specific bisignate induced CD spectrum (ICD) bands. The intrinsically negligible fluorescence of flavylium was strongly increased upon the addition of DNA or RNA, whereby both the fluorescence intensity and emission lifetimes of complexes differed considerably: the strongest emission increase was observed for AU-RNA (detection limit estimated to 10 nM) followed by AT-DNAs and the much weaker effect of GC-DNAs. Both fluorescence sensitivity on the ds-DNA/RNA secondary structure and sequence-selective ICD bands make the flavylium–chalcones system an intriguing pH-switchable new probe for distinguishing between various polynucleotide sequences.

Graphical Abstract

1. Introduction

Flavylium derivatives and related structures are one of the most common families of naturally occurring dyes. Their usage as colorants is part of traditional human history and still finds many applications today [1,2,3]. Remarkable features of flavylium salts for application in molecular biology and biomedicine are based on their well-studied biological interactions (most of them common in the human diet and thus safe dyes) [4,5,6], as well as the high sensitivity of chromophores on the microenvironment. For instance, pH [7,8], light [9], temperature [10], and redox potential [11] can finely and reversibly tune chromophore properties [12].
Flavylium cations are 2-phenyl-1-benzopyrylium derivatives with the ability to establish several types of supramolecular interactions. They constitute the structural core of anthocyanins, which are the natural dyes responsible for most of the reds and blues in flowers and fruits. To attain these colors, nature developed intricate supramolecular structures where anthocyanins are involved in metal complexation and aromatic stacking [13]. Synthetic flavylium cations are electron-poor guests that have been shown to insert into neutral or negatively charged electron-rich cavities such as those of molecular clips [14] and cucurbiturils [15,16,17]. Their positive charge and aromatic character suggest potential interactions with nucleic acids; for instance, some natural anthocyanins were shown to interact with duplex DNA and RNA, as shown by UV-Vis spectrophotometry [18,19], by changes in melting temperature—in this case, with triplex DNA—[20], by spectrofluorimetry using ethidium bromide displacement assays [21] or by gel electrophoresis [22]. These studies were mostly carried out at pH values between 3 and 4, while at physiological pH values, no evidence for nucleic acid intercalation by anthocyanins or anthocyanidins could be detected [22].
Flavylium cations are fluorescent molecules that can present high fluorescence quantum yields [2,23]. Their fluorescence strongly depends on the substituents in the 2-phenyl-1-benzopyrylium core. In particular, the presence of amino groups decreases the fluorescence quantum yield in polar solvents apparently due to deactivation of the emissive excited state via internal charge transfer states [24]. Thus, it is expected that the interaction of flavylium cations with nucleic acids increases their fluorescence, leading these compounds as off–on fluorescent probes for nucleic acid detection.
In an aqueous solution, flavylium cations undergo a series of pH-dependent reactions leading to the establishment of a chemical reaction network that contains several neutral and anionic species, see Scheme 1 [2,3,12]. To our purpose, the flavylium cation should be the predominant species in a pH range where the interactions with nucleic acids can be conveniently studied, e.g., 5 < pH < 7. While most flavylium cations no longer exist at these pH values, the introduction of amino groups in adequate positions of the 2-phenyl-1-benzopyrylium core delocalizes the positive charge of the pyrylium ring and extends the pH range of the flavylium stability to the neutral region [12]. In this work, we have selected flavylium 4′-(N,N-dimethylamino)-6-hydroxyflavylium hexafluorophosphate (F1, Scheme 1) whose mole fraction distribution at pH = 5 contains mainly flavylium cation [25]. The interaction of F1 with calf thymus DNA (ct-DNA) and five oligonucleotides (poly dAdT–poly dAdT, poly dA–poly dT, poly dG–poly dC, poly dGdC–poly dGdC, poly A–poly U) that represent several most common types of nucleic acid structures (Supplementary Information Table S1) were studied by UV-Vis spectrophotometry, steady-state and time-resolved spectrofluorimetry, and circular dichroism (CD).

2. Materials and Methods

Polynucleotides were purchased as noted: poly dGdC–poly dGdC, poly dAdT–poly dAdT, Poly dG–poly dC, poly dA–poly dT, poly A–poly U, poly A, and poly U (Sigma) and dissolved in sodium cacodylate buffer, I = 0.05 mol·dm−3, pH = 7. The calf thymus ct-DNA was additionally sonicated and filtered through a 0.45 mm filter. Polynucleotide concentration was determined spectroscopically [26] as the concentration of phosphates (equivalent to c(nucleobase)) by application of molar extinction coefficients provided by the manufacturer. The 4′-(N,N-dimethylamino)-6-hydroxyflavylium hexafluorophosphate (F1) was prepared according to previously described procedures [25].
The UV/Vis spectrophotometric experiments were recorded on Varian Cary 100 Bio instruments, CD, linear dichroism (LD) spectra on a JASCO 815, and fluorescence spectra on a Varian Eclipse instrument. Couette flow system for LD measurements is manufactured by Dioptica Scientific Ltd., Rugby, UK. The fluorescence decays measurements were performed in a TemPro Horiba Jobin-Yvon, exciting at 570 nm using a nanoled N-570 with pulse width < 1.5 ns. 1 cm path quartz cuvettes in thermostated conditions.
The measurements were performed in an aqueous buffer solution at pH 5.0 (I = 0.05 mol·dm−3, sodium cacodylate or phosphate buffer, as indicated). In fluorimetric experiments, excitation spectra agreed well with the corresponding UV/Vis spectra, and excitation wavelengths at λexc = 541 nm were used to avoid the absorption of excitation light by added polynucleotides. The UV/vis and fluorimetric titrations were performed by adding portions of polynucleotide solution into the solution of the studied compound, while CD/LD experiments were performed by adding portions of the compound stock solution into the solution of a polynucleotide. UV/Vis and fluorimetric titration data were processed by non-linear fitting using a Global Fit procedure [27,28] through a Scatchard equation [29,30].

3. Results

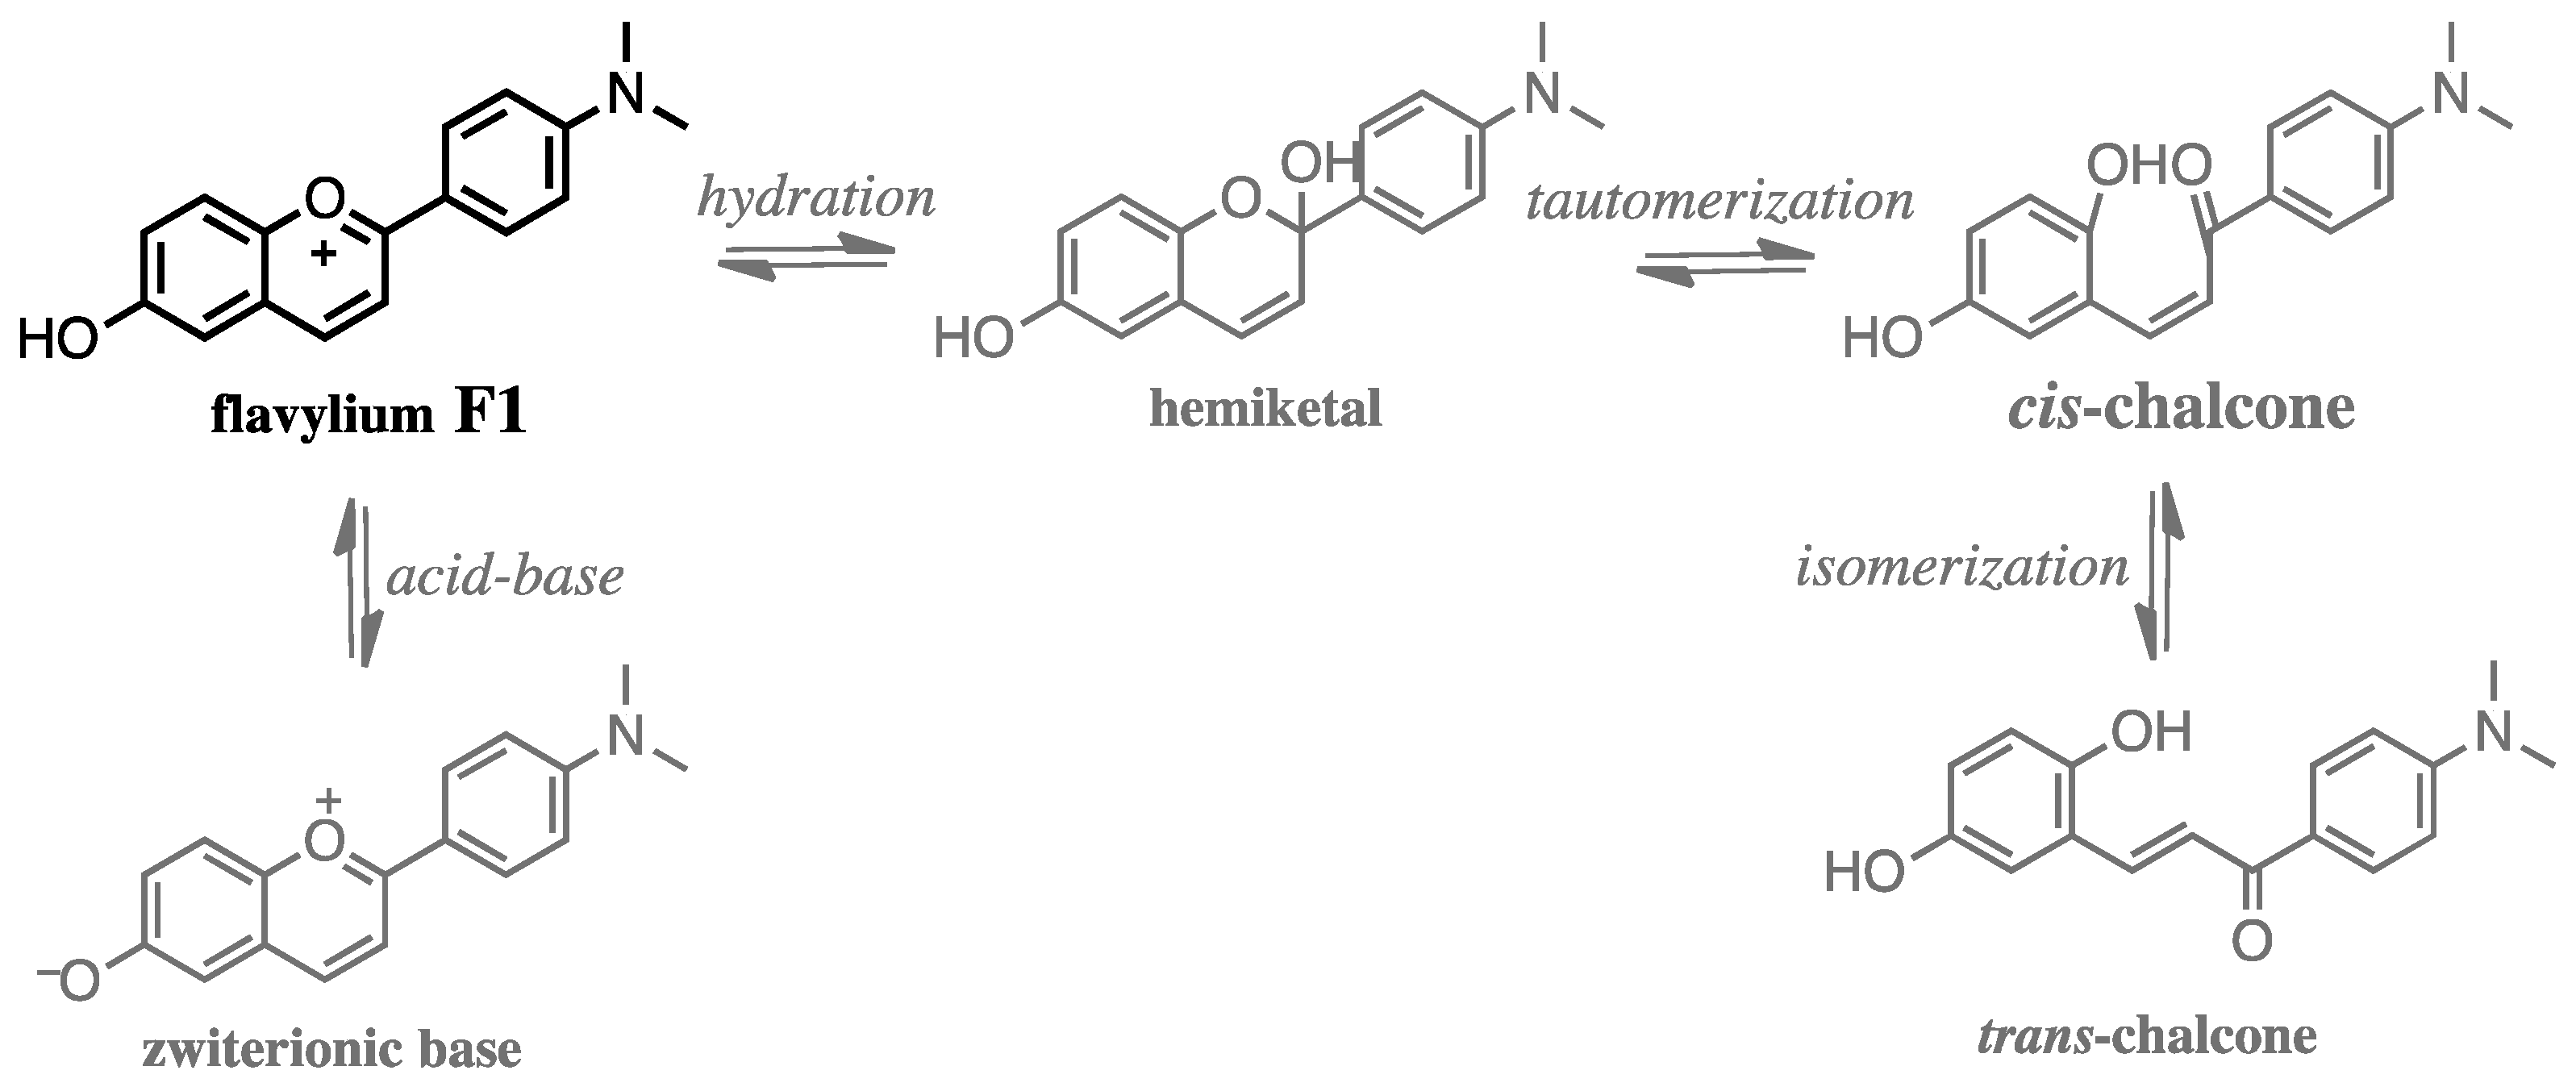
3.1. Physicochemical Properties of Aqueous Solutions of Studied Compound F1

Flavylium F1 represented on Scheme 1 is well-soluble in water up to mM concentrations, and acidic aqueous solutions (pH < 5) were stable over several months. The mole fraction distribution of species for compound F1 at pH 5 (see Supplementary Information, Figure S1) corresponds to ca. 85% of flavylium species, 12% of neutral trans-chalcone, and 3% of minor species (zwitterionic base and deprotonated cis- and trans-chalcones) [25].
The flavylium cation of F1 is characterized by a large aromatic surface combined with a positive charge, which makes this species a potential ligand to DNA/RNA. At pH 7, compound F1 reversibly evolves to mainly negatively charged deprotonated chalcone species (72%, Scheme 1), with significantly decreased aromatic surface, which completely hampered binding to DNA/RNA. Moreover, flavylium (λmax = 540 nm, ε = 25,000 cm1·mol1·dm3) and chalcone (mono-deprotonated chalcones: λmax = 410 nm, ε ≈ 11,000 cm1·mol1·dm3) differ significantly in their spectrophotometric properties, which allowed easy monitoring of DNA/RNA binding for only flavylium F1.

3.2. Study of Interactions of F1 with ds-DNA and ds-RNA in Aqueous Media

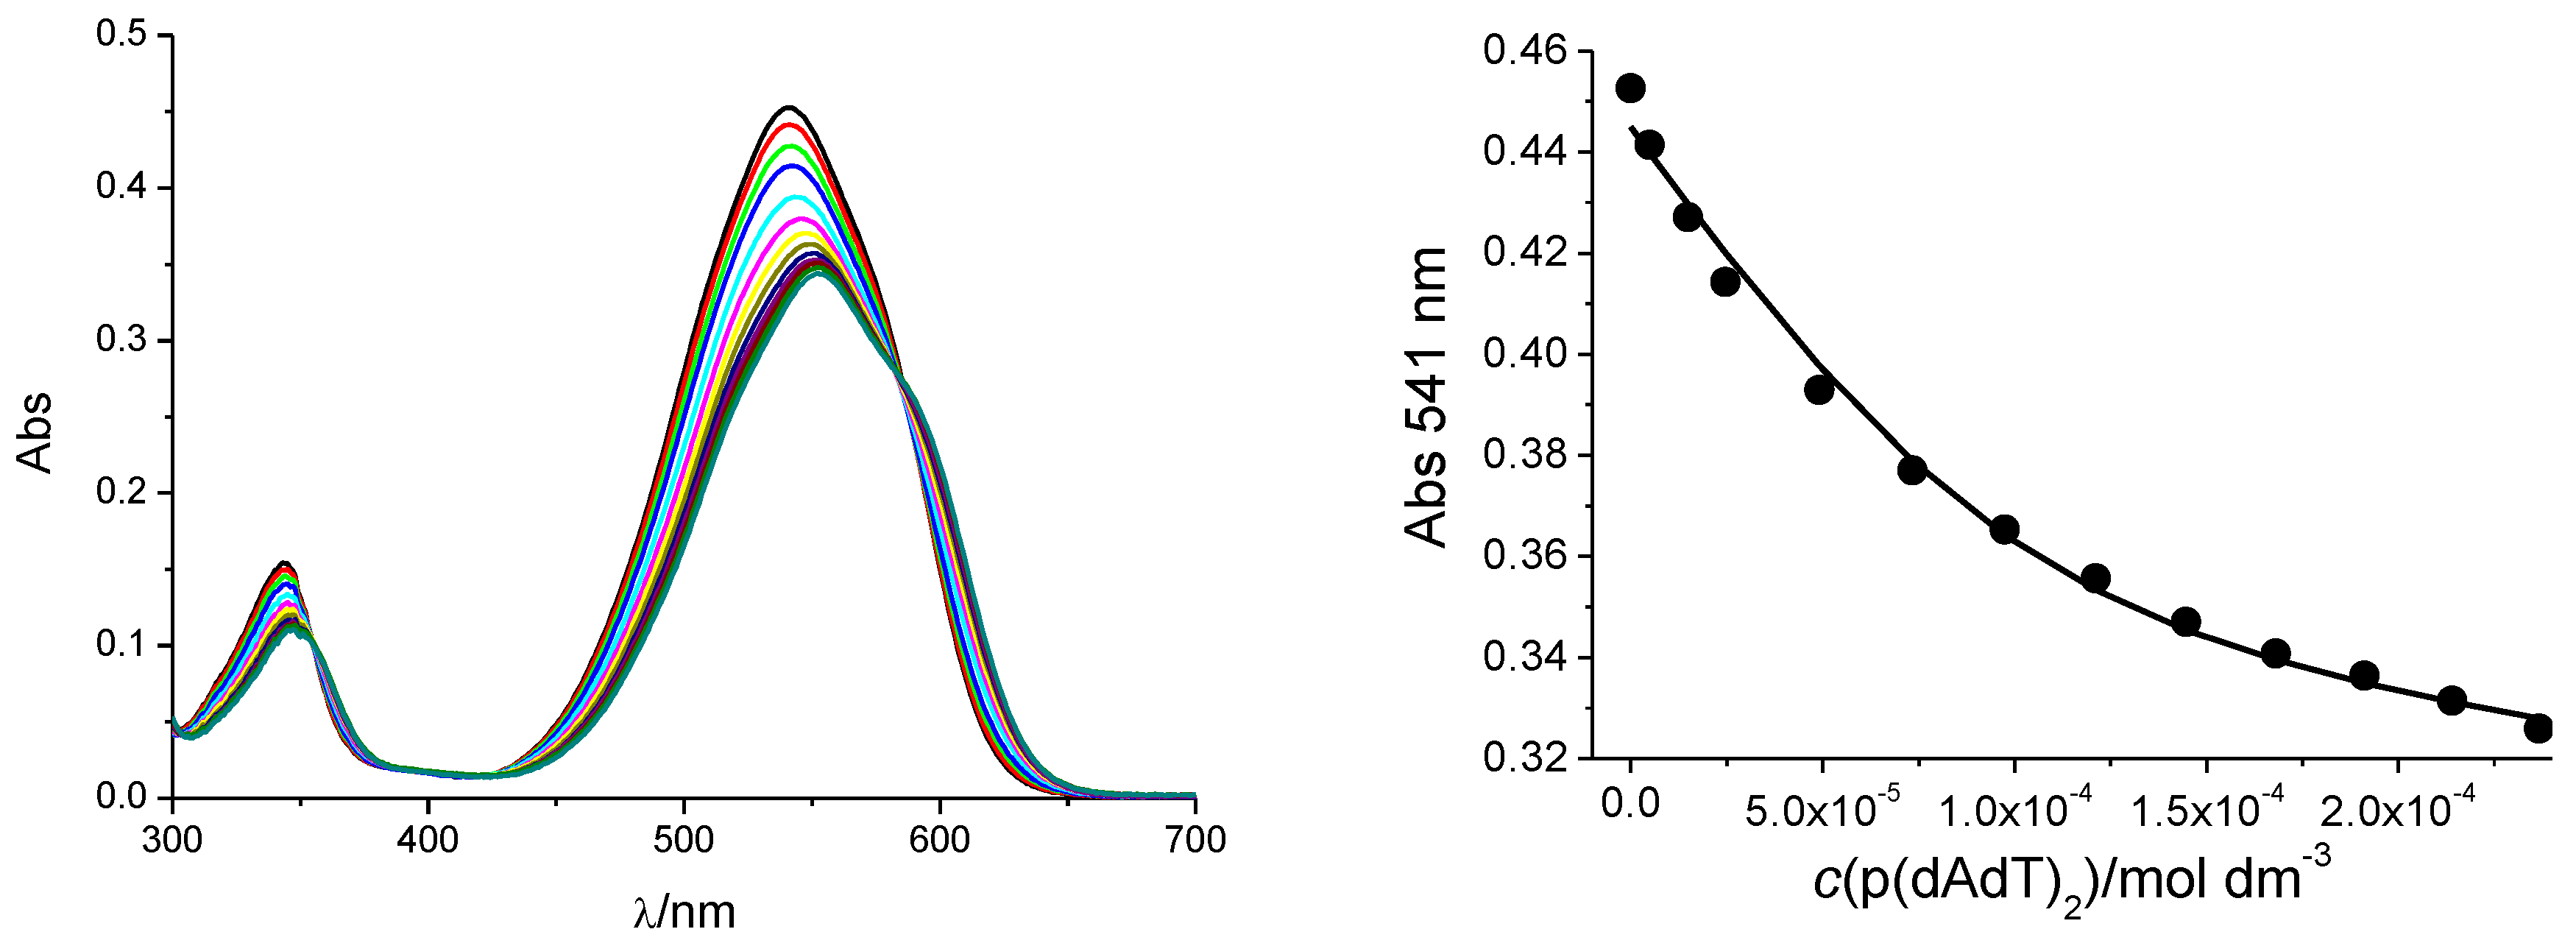
3.2.1. UV/Vis Titrations

Since preliminary experiments showed that deprotonated chalcone forms (pH 7) are completely DNA/RNA inactive, all further studies were done at pH = 5 (sodium cacodylate buffer, I = 0.05 mol·dm−3), at which F1 in a form of flavylium cation is characterized by a typical UV/Vis spectrum (Figure 1) and exhibited negligible intrinsic fluorescence at micromolar concentrations.
The addition of any of the ds-polynucleotides resulted in bathochromic and hypochromic shifts in the UV/Vis spectrum of compound F1 (Figure 1, Table 2, Supplementary Information Figure S2). The isosbestic points in the titrations (e.g., ʎ = 590 nm in Figure 1) indicate the formation of only one type of dye/polynucleotide complex.

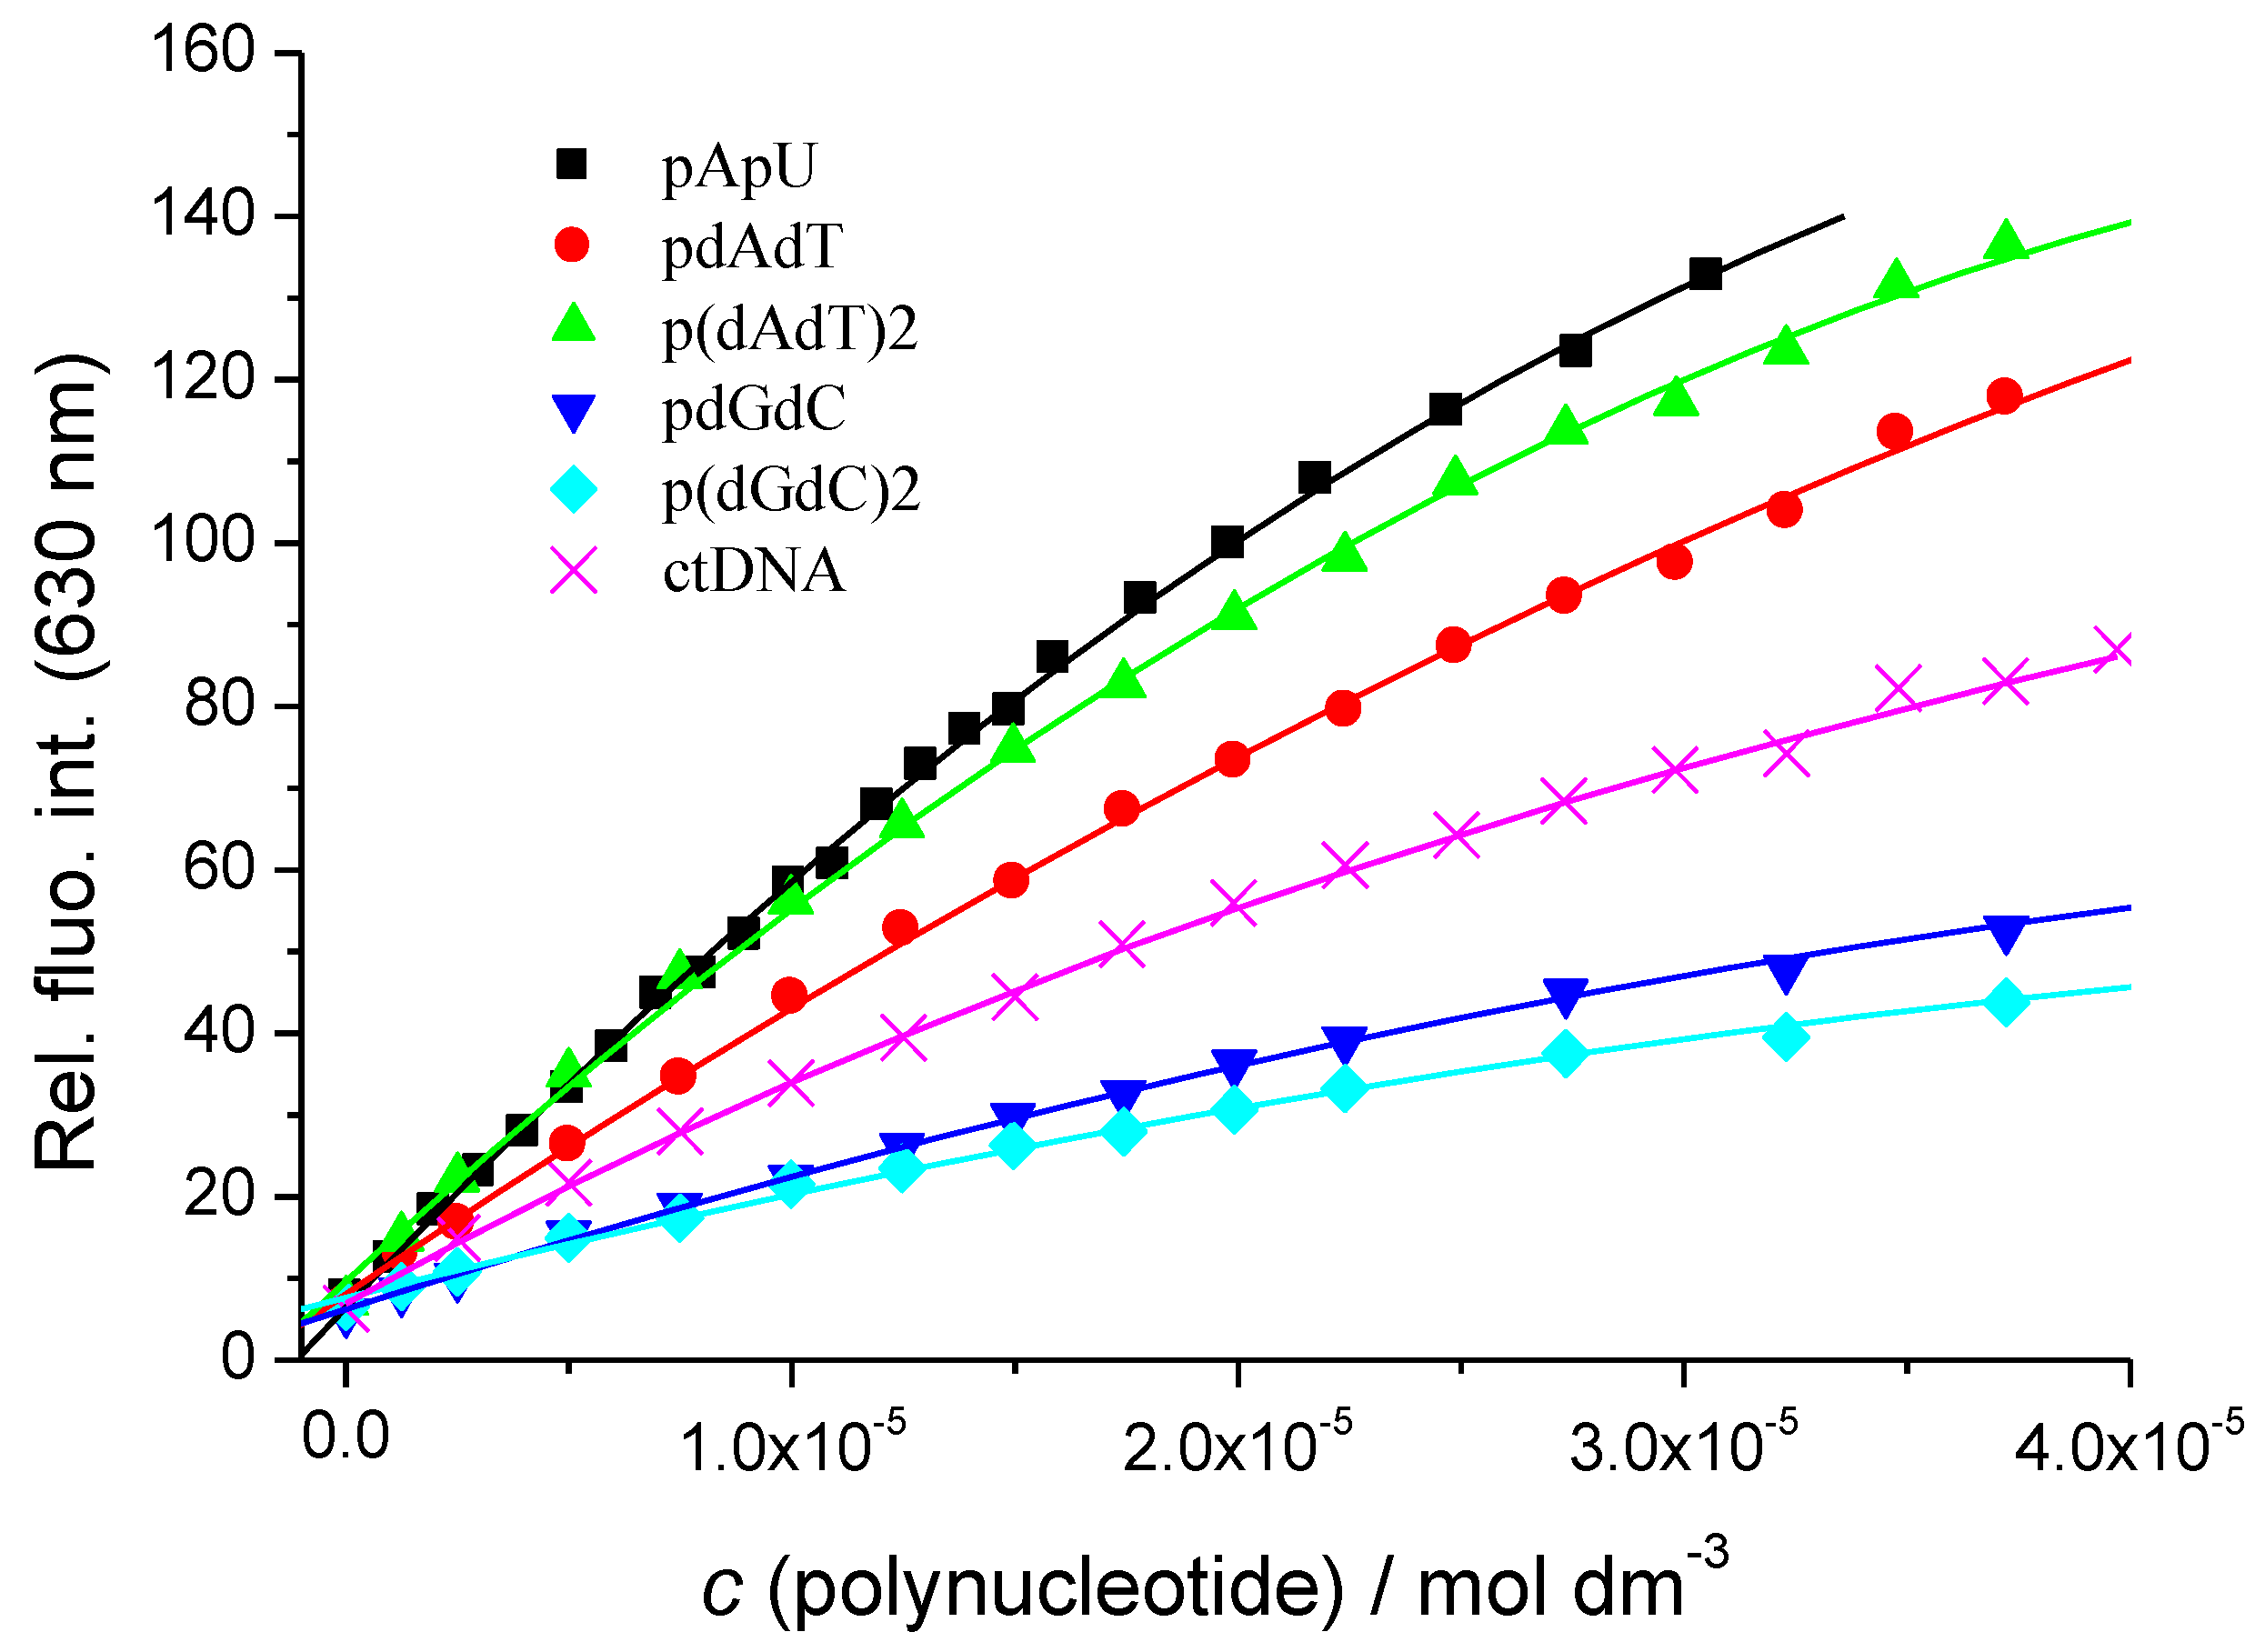
3.2.2. Fluorimetric Titrations

While compound F1 at pH = 5 exhibited negligible intrinsic fluorescence, its fluorescence strongly increased upon the addition of ds-polynucleotides (Figure 2), allowing accurate fluorimetric titrations. This increase in fluorescence suggests the presence of interactions with all the ds-polynucleotides where the flavylium cation is hindered from non-radiative processes. Emission increase (Figure 2) is the strongest for ds-RNA (ca. 30-fold for poly A–poly U, detection limit estimated to 10 nM), while between various ds-DNAs, it is strongly related to the type of basepair composition. For instance, a much stronger emission increase was observed for AT-DNAs than for GC-DNAs (Figure 2), which can be attributed to the reductive electron-transfer quenching of the excited state of F1 by the guanine base that is known to be the easiest nucleobase to oxidize. Indeed, the reduction potential of guanine (E7 = 1.29 V) [31] and average value for the reduction of flavylium cations (E0 = −0.106 V) [32] and the emission maximum of F1 (640 nm = 1.937 eV) all taken together yield an ΔE0 = 0.541 V.
To characterize in more detail the observed changes, we performed fluorescence excited-state lifetime measurements (Table 1). In all cases, there is an increase in the excited state lifetime in accordance with the observed increase in steady-state fluorescence emission. The highest increase in fluorescence lifetime is observed for poly A–poly U. In the case of DNAs, the fluorescence decay times for the two AT-DNAs are indistinguishable within the experimental error and are higher than those measured for GC-DNAs (also indistinguishable within the experimental error).
Simultaneous processing of UV/Vis and fluorimetric titration data by the Globalfit procedure [27,28] (adapted to Scatchard equation [29,30]) gave binding constants Ks and ratios n[bound compound]/[DNA/RNA] (Table 2). The studied F1 showed considerable affinity toward ds-DNA and ds-RNA, which is somewhat higher than the affinities of non-charged flavonoids [33,34] and comparable to the common affinity of positively charged tri-aromatic DNA binding compounds (5 < log Ks < 6) [35]. Minor differences in binding affinity fall within the error of the method determination, thus not suggesting a significant preference for any DNA/RNA sequence.

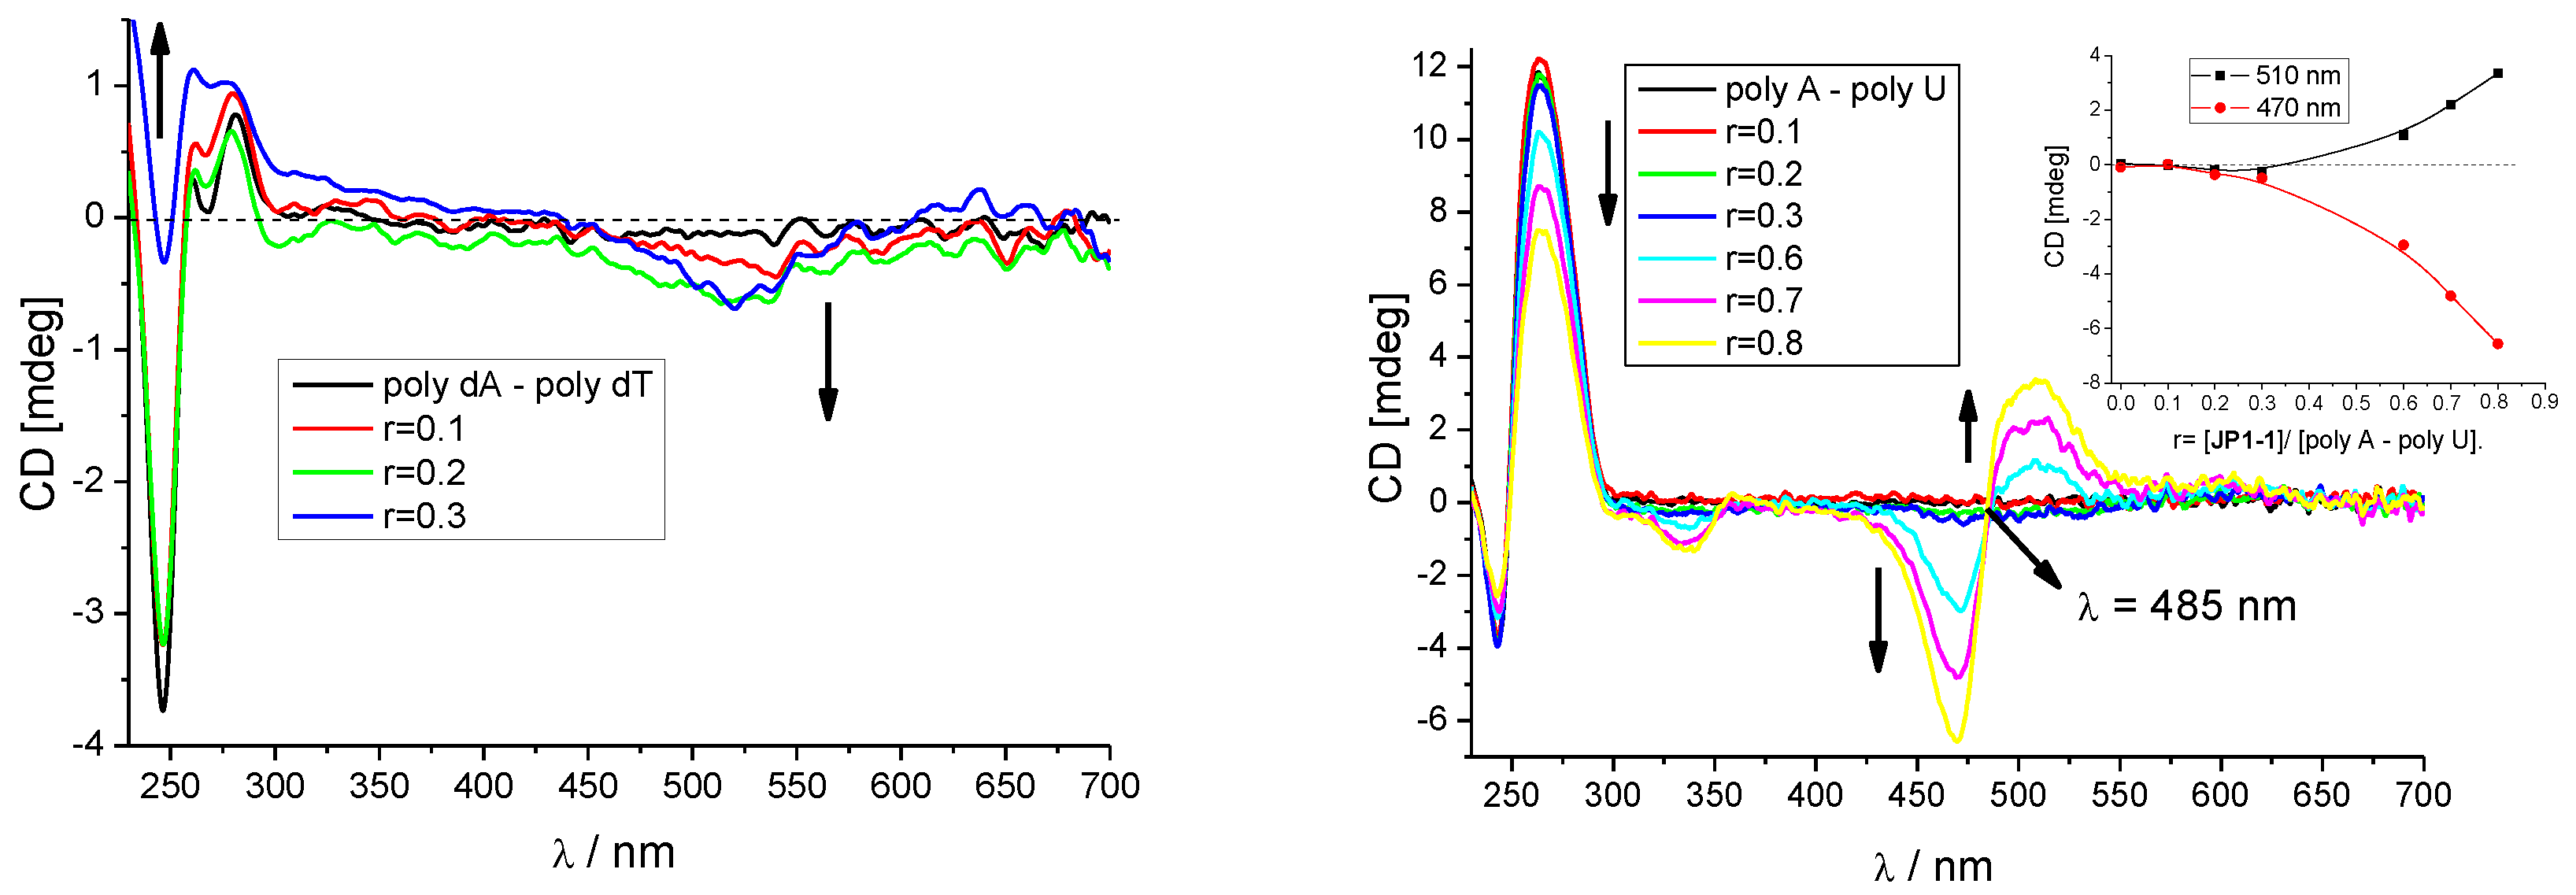
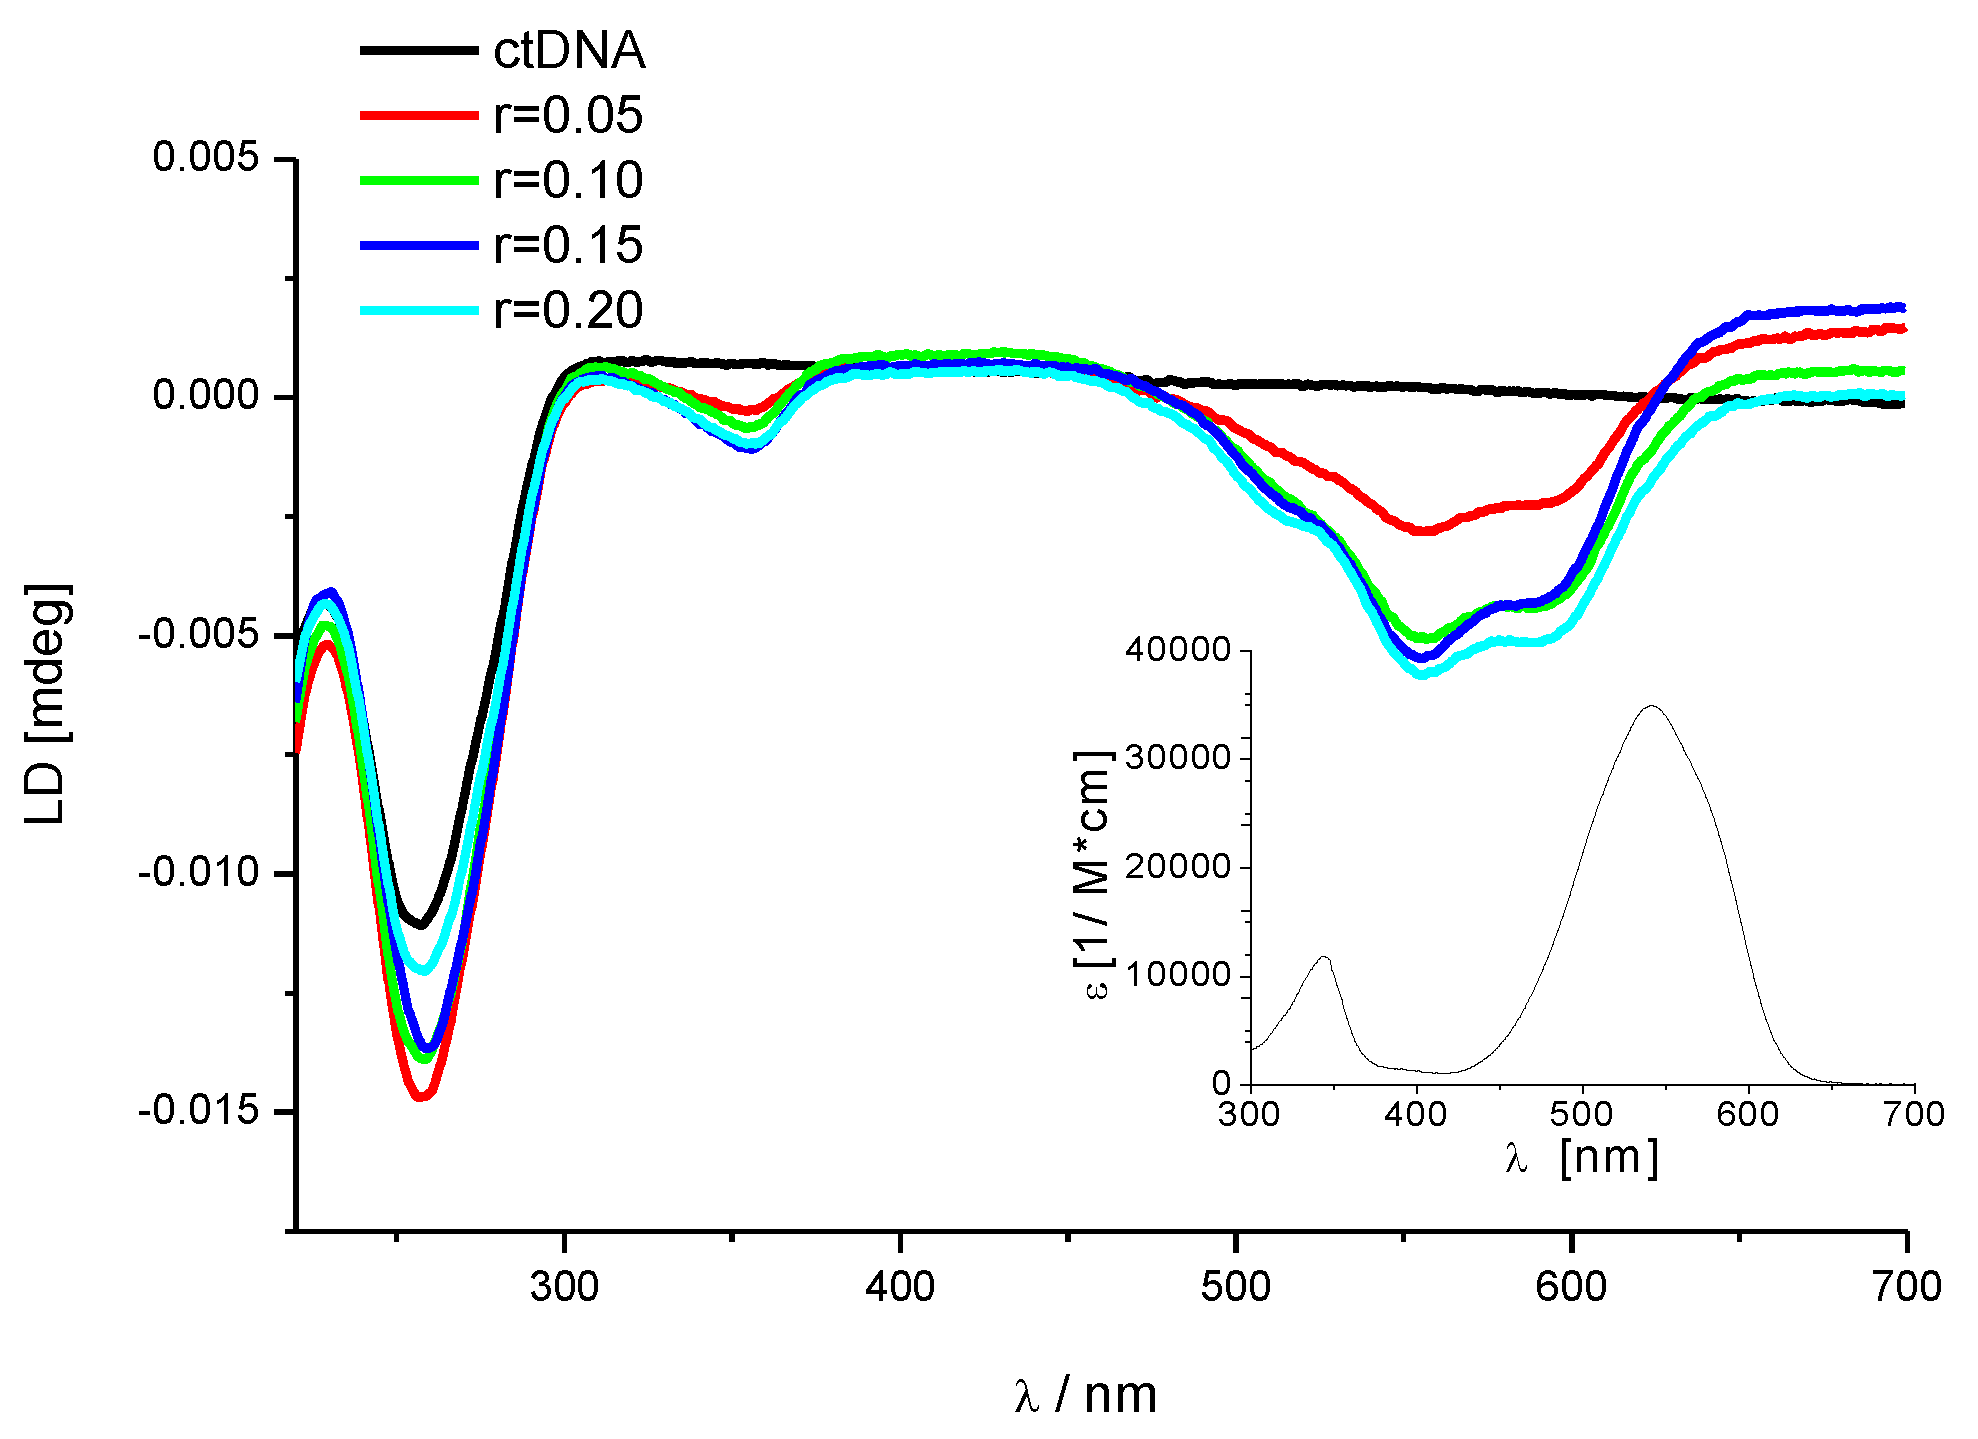
3.2.3. Circular Dichroism (CD) Titrations

However, affinities and UV/Vis or fluorimetric response cannot be correlated to the particular DNA/RNA binding mode, since both intercalation and groove binding can yield similar changes, as well as similar binding affinity [35,36]. To investigate the binding mode of F1 to DNA/RNA in more structural detail, we relied on CD spectropolarimetry as a highly sensitive method for the study of conformational changes in the secondary structure of polynucleotides [37]. In addition, achiral small molecules can eventually acquire induced CD spectrum (ICD) upon binding to polynucleotides, which could give useful information about modes of interaction [37,38]. It should be noted that flavylium F1 is achiral and therefore does not possess an intrinsic CD spectrum.
The addition of F1 to studied ds-DNAs resulted in only minor changes in the CD spectrum of polynucleotides, which is accompanied with a weak negative ICD band at 540 nm (Figure 3 LEFT, Supplementary Information Figure S3) that is characteristic for the intercalative binding mode [37,38]. Intriguingly, only for ds-RNA (poly A–poly U) were the bisignate ICD bands (Figure 3, RIGHT) observed at a higher ratio r > 0.3, which could be attributed to the dye-dimer formation within RNA grooves [39,40].
To further corroborate intercalative binding mode into ds-DNA, we also performed a linear dichroism (LD) titration experiment, where the signal depends on the orientation of the ligand relative to the orientation axis of the ds-DNA strands [35]. The uniform orientation of the ct-DNA rod-like double strands was achieved in a cylindrical rotating Couette cell, where the solution was subjected to a constant gradient over the annular gap between the rotating (inner cylinder) and the fixed coaxial outer cylinder with a spinning rate of 4000 rpm. The negative induced LD signal in the 500–600 nm range obtained by the addition of F1 to ct-DNA (Figure 4) emerges as a consequence of the perpendicular orientation of the F1 aromatic system with respect to the chiral axis of the ct-DNA, which confirms the intercalative binding mode [35].
It is common for DNA-interacting small molecules to exert an impact on the thermal denaturation of ds-DNA [41]. However, the testing of F1 solution at increased temperatures revealed irreversible chemical changes of F1, thus hampering thermal denaturation experiments.

4. Conclusions

Here, the presented 4′-(N,N-dimethylamino)-6-hydroxyflavylium hexafluorophosphate F1 showed considerable affinity (log Ks = 5–6 range) toward ds-DNA/RNA at weakly acidic conditions (pH 5), which could be reversibly switched off by external stimuli by a change to pH 7. Flavylium cation F1 intercalated into ds-DNAs, but for ds-RNA, F1 showed aggregation, which was reported by RNA-specific bisignate ICD bands. The negligible fluorescence of flavylium F1 was strongly increased by the addition of DNA or RNA, whereby both the fluorescence intensity and emission lifetimes of the complexes strongly increased, the intensity of emission depending on the basepair composition and secondary structure of the ds-polynucleotide. The strongest emission increase was observed for ds-RNA (detection limit estimated to 10 nM in a sample containing no other polynucleotide), which was attributed to the formation of an F1 dimer within the RNA major groove. The difference in F1 emission between complexes with AT-DNA and GC-DNA can be attributed to aromatic stacking interactions between intercalated F1 and adjacent basepairs. Namely, some 4,9-pyrene and acridine derivatives also exhibited a similar guanine-selective emission response, which was correlated with the electron-donating properties of guanine [27,42]. Both fluorescence sensitivity on ds-DNA/RNA secondary structure and RNA-specific ICD bands suggest that F1 can be considered as an intriguing new lead structure for the design of pH-controlled probes for various DNA/RNA. The pH-controlled switch of the F1 falvylium–chalcone structure is of particular interest; although the physiological condition has a neutral pH, many solid tumors have significantly lowered extracellular pH [43,44], and several antitumor drugs owe their preferential accumulation in tumor tissue due to weakly acidic pKa value [43,45]. Therefore, due to the spectrophotometric sensitivity of F1 on the pH, it could be expected that the neutral and hydrophobic chalcone (non-colored, DNA/RNA inactive) will accumulate in cell membranes due to their hydrophobic nature. Only in weakly acidic conditions (in extra- or even intracellular cancerous moieties) will chalcone switch to water-soluble positively charged flavylium (strongly coloured λmax = 541 nm), at which point flavylium would bind DNA/RNA and possibly lead to bioactivity.
Thus, the here studied naturally occurring flavylium systems offer an easily accessible plethora of reversible small molecule-systems in equilibrium (controlled by external stimuli as pH or light), strongly supporting further research aiming for biochemical and biomedical applications.

Supplementary Materials

The following are available online https://www.mdpi.com/2227-9040/8/4/129/s1, Table S1: Groove widths and depths for used nucleic acid sequences, Figure S1: Chemical equilibria (a) and mole fraction distribution of species (b) for 4′-(N,N-dimethylamino)-6-hydroxyflavylium in aqueous solution; data from [20] in the paper, Figure S2: Changes in the UV/Vis spectra of F1 (c = 1 × 10⁻⁵ mol·dm−3, sodium cacodylate buffer, pH = 5.0, I = 0.05 mol·dm−3) upon addition of polynucleotides, Figure S3: Changes in CD spectra of ds-polynucleotides (c = 2 × 10⁻⁵ mol·dm−3) upon addition of F1 at different ratios r = [F1]/[ds-polynucleotide] (sodium cacodylate buffer, pH = 5.0, I = 0.05 mol·dm−3).

Author Contributions

Synthesis of chromophore F1, L.G., A.J.P.; Conceptualization, I.P., and A.J.P.; Methodology, I.C. L.G., A.J.P.; Writing I.C., I.P., A.J.P.; Funding Acquisition, I.P., A.J.P. Formal analysis, G.H. and I.P. All authors have read and agreed to the published version of the manuscript.

Funding

This work was supported by the Associate Laboratory for Green Chemistry-LAQV which is financed by portuguese FCT/MCTES (UIDB/50006/2020). FCT is also acknowledged for supporting the National Portuguese NMR Network (ROTEIRO/0031/2013-PINFRA/22161/2016) and for funding under grant SFRH/BPD/88322/2012 (LG). I.P. and I.C. thank Croatian Science Foundation project HrZZ IP-2018-01-5475 for financial support.

Conflicts of Interest

The authors declare no conflict of interest.

References

  1. Melo, M.J. Missal Blue: Anthocyanins in Nature and Art. In Dyes in History and Archaeology; Kirby, J., Ed.; Archetype Publications: London, UK, 2008; Volume 21, pp. 65–74. [Google Scholar]
  2. Pina, F. Chemical applications of anthocyanins and related compounds A source of bio-inspiration. J. Agric. Food Chem. 2014, 62, 6885–6897. [Google Scholar] [CrossRef] [PubMed]
  3. Pina, F.; Parola, A.J.; Melo, M.J.; Lima, J.C.; De Freitas, V. Chemistry of Anthocyanins. In Anthocyanins from Natural Sources: Exploiting Targeted Delivery for Improved Health; Brook, M.S.-L., Celli, G.B., Eds.; The Royal Society of Chemistry: Cambridge, UK, 2019; Volume 12, Chapter 2; pp. 34–76. [Google Scholar]
  4. Cheynier, V.; Tomas-Barberan, F.A.; Yoshida, K. Polyphenols, From Plants to a Variety of Food and Nonfood Uses. J. Agric. Food Chem. 2015, 63, 7589–7594. [Google Scholar] [CrossRef] [PubMed]
  5. Dangles, O.; Fenger, J.-A. The Chemical Reactivity of Anthocyanins and Its Consequences in Food Science and Nutrition. Molecules 2018, 23, 1970. [Google Scholar] [CrossRef] [PubMed] [Green Version]
  6. Basílio, N.; Pina, F. Chemistry and Photochemistry of Anthocyanins and Related Compounds: A Thermodynamic and Kinetic Approach. Molecules 2016, 21, 1502. [Google Scholar] [CrossRef]
  7. Pina, F.; Melo, M.J.; Parola, A.J.; Maestri, M.; Balzani, V. pH-Controlled Photochromism of Hydroxyflavylium ions. Chem. Eur. J. 1998, 4, 2001–2007. [Google Scholar] [CrossRef]
  8. Moncada, M.C.; Parola, A.J.; Lodeiro, C.; Pina, F.; Maestri, M.; Balzani, V. Multistate/Multifunctional Behaviour of 6-nitro-4’-hydroxyflavylium A Write-lock/Read/Unlock/Enable-erase/Erase Cycle Driven by Light and pH Stimulation. Chem. Eur. J. 2004, 10, 1519–1526. [Google Scholar] [CrossRef]
  9. Pina, F.; Petrov, V.; Laia, C.A.T. Photochromism of flavylium systems: An overview of a versatile multistate system. Dyes Pigment. 2012, 92, 877–889. [Google Scholar] [CrossRef]
  10. Giestas, L.; Folgosa, F.; Lima, J.C.; Parola, A.J.; Pina, F. Bio-Inspired Multistate Networks Responsive to Light, pH and Thermal Inputs: An Example of a Multistate System Operating Through Different Algorithms. Eur. J. Org. Chem. 2005, 4187–4200. [Google Scholar] [CrossRef]
  11. Jimenez, A.; Pinheiro, C.; Parola, A.J.; Maestri, M.; Pina, F. The Chemistry of 6-Hydroxyflavylium, Zwitterionic base, and p-Quinoidal Chalcones A Multiswitchable System Operated by Proton, Electron and Photon Inputs. Photochem. Photobiol. Sci. 2007, 6, 372–380. [Google Scholar] [CrossRef]
  12. Pina, F.; Melo, M.J.; Laia, C.A.T.; Parola, A.J.; Lima, J.C. Chemistry and Applications of Flavylium Compounds, a Handful of Colours. Chem. Soc. Rev. 2012, 41, 869–908. [Google Scholar] [CrossRef]
  13. Yoshida, K.; Mori, M.; Kondo, T. Blue flower color development by anthocyanins, from chemical structure to cell physiology. Nat. Prod. Rep. 2009, 26, 884–915. [Google Scholar] [CrossRef] [PubMed]
  14. Gomes, R.; Parola, A.J.; Bastkowski, F.; Polkowska, J.; Klärner, F.-G. Host-guest interactions between molecular clips and multistate systems based on flavylium salts. J. Am. Chem. Soc. 2009, 131, 8922–8938. [Google Scholar] [CrossRef] [PubMed]
  15. Basílio, N.; Pina, F. Flavylium network of chemical reactions in confined media, modulation of 3′,4′,7-trihydroxyflavilium reactions by host-guest interactions with cucurbit[7]uril. ChemPhysChem 2014, 15, 2295–2302. [Google Scholar] [CrossRef] [PubMed]
  16. Zubillaga, A.; Ferreira, P.; Parola, A.J.; Gago, S.; Basílio, N. pH-Gated Photoresponsive Shuttling in a Water-Soluble Pseudorotaxane. Chem. Commun. 2018, 54, 2743–2746. [Google Scholar] [CrossRef] [PubMed]
  17. Seco, A.; Diniz, A.M.; Sarrato, J.; Mourão, H.; Cruz, H.; Parola, A.J.; Basílio, N. A pseudorotaxane formed from a cucurbit[7]uril wheel and a bioinspired molecular axle with pH, light and redox-responsive properties. Pure Appl. Chem. 2020, 92, 301–314. [Google Scholar] [CrossRef]
  18. Mistry, T.V.; Cai, Y.; Lilley, T.H.; Haslam, E. Polyphenol interactions. Part 5. Anthocyanin co-pigmentation. J. Chem. Soc. Perkin Trans. 1991, 8, 1287–1296. [Google Scholar] [CrossRef]
  19. Sarma, A.D.; Sharma, R. Anthocyanin-DNA copigmentation complex: Mutual protection against oxidative damage. Phytochemistry 1999, 52, 1313–1318. [Google Scholar] [CrossRef]
  20. Mas, T.; Susperregui, J.; Berke, B.; Chèze, C.; Moreau, S.; Nuhrich, A.; Vercauteren, J. DNA triplex stabilization prop-erty of natural anthocyanins. Phytochemistry 2000, 53, 679–687. [Google Scholar] [CrossRef]
  21. Habermeyer, M.; Fritz, J.; Barthelmes, H.U.; Christensen, M.O.; Larsen, M.K.; Boege, F.; Marko, D. Anthocyanidins modulate the activity of human DNA topoisomerases I and II and affect cellular DNA integrity. Chem. Res. Toxicol. 2005, 18, 1395–1404. [Google Scholar] [CrossRef]
  22. Webb, M.R.; Min, K.; Ebeler, S.E. Anthocyanin interactions with DNA: Intercalation, topoisomerase I inhibition and oxidative reactions. J. Food Biochem. 2008, 32, 576–596. [Google Scholar] [CrossRef]
  23. Katritzky, A.R.; Czerney, P.; Levell, J.R.; Du, W. Molecular Engineering of Benzo[b]pyrylium Salts by Indirect Electrophilic Substitution. Eur. J. Org. Chem. 1998, 2623–2629. [Google Scholar] [CrossRef]
  24. Haucke, G.; Czerney, P.; Steen, D.; Rettig, W.; Hartmann, H. Radiationless Transitions in Substituted Benzopyrylium Dyes, Competing Adiabatic Photoreactions Towards Nonradiative Funnels. Ber Bunsenges Phys. Chem. 1993, 97, 561–570. [Google Scholar] [CrossRef]
  25. Laia, C.A.T.; Parola, A.J.; Folgosa, F.; Pina, F. Multistate reaction kinetics of 6-hydroxy-4’-dimethylaminoflavylium driven by pH A stopped-flow study. Org Biomol. Chem. 2007, 5, 69–77. [Google Scholar] [CrossRef]
  26. Tumir, L.M.; Piantanida, I.; Cindric, I.J.; Hrenar, T.; Meic, Z.; Zinic, M. New permanently charged phenanthridinium-nucleobase conjugates. Interactions with nucleotides and polynucleotides and recognition of ds-polyAH(+). J. Phys. Org. Chem. 2003, 16, 891–899. [Google Scholar] [CrossRef]
  27. Zhao, H.Y.; Schuck, P. Global Multi-Method Analysis of Affinities and Cooperativity in Complex Systems of Macromolecular Interactions. Anal. Chem. 2012, 84, 9513–9519. [Google Scholar] [CrossRef] [PubMed] [Green Version]
  28. Zhao, H.Y.; Piszczek, G.; Schuck, P. SEDPHAT—A platform for global ITC analysis and global multi-method analysis of molecular interactions. Methods 2015, 76, 137–148. [Google Scholar] [CrossRef] [PubMed] [Green Version]
  29. Scatchard, G. The attractions of proteins for small molecules and ions. Ann. N. Y. Acad. Sci. 1949, 51, 660–672. [Google Scholar] [CrossRef]
  30. McGhee, J.D.; von Hippel, P.H. Theoretical aspects of DNA-protein interactions, Co-operative and non-co-operative binding of large ligands to a one-dimensional homogeneous lattice. J. Mol. Biol. 1976, 103, 679–684. [Google Scholar] [CrossRef]
  31. Steenken, S.; Jovanovic, S.V. How Easily Oxidizable Is DNA? One-Electron Reduction Potentials of Adenosine and Guanosine Radicals in Aqueous Solution. J. Am. Chem. Soc. 1997, 119, 617–618. [Google Scholar] [CrossRef]
  32. da Silva, P.F.; Lima, J.C.; Quina, F.H.; Maçanita, A.L. Excited-State Electron Transfer in Anthocyanins and Related Flavylium Salts. J. Phys. Chem. A 2004, 108, 10133–10140. [Google Scholar] [CrossRef]
  33. Piantanida, I.; Mašić, L.; Rusak, G. Structure-spectrophotometric selectivity relationship in interactions of quercetin related flavonoids with double stranded and single stranded RNA. J. Mol. Struct. 2009, 924, 138–143. [Google Scholar] [CrossRef]
  34. Marinić, M.; Piantanida, I.; Rusak, G.; Žinić, M. Interactions of quercetin and its lanthane complex with double stranded DNA/RNA and single stranded RNA, Spectrophotometric sensing of poly G. J. Inorg. Biochem. 2006, 100, 288–298. [Google Scholar] [CrossRef] [PubMed]
  35. Demeunynck, M.; Bailly, C.; Wilson, W.D. Small Molecule DNA and RNA Binders: From Synthesis to Nucleic Acid Complexes; Wiley-VCH: Weinheim, Germany, 2004. [Google Scholar]
  36. Long, E.C.; Barton, J.K. On demonstrating DNA intercalation. Acc. Chem. Res. 1990, 23, 271–273. [Google Scholar] [CrossRef]
  37. Šmidlehner, T.; Piantanida, I.; Pescitelli, G. Polarization spectroscopy methods in the determination of interactions of small molecules with nucleic acids-tutorial. Beilstein J. Org. Chem. 2018, 14, 84–105. [Google Scholar] [CrossRef] [PubMed]
  38. Eriksson, M.; Nordén, B. Drug–Nucleic Acid Interactions. In Methods in Enzymology; Academic Press: San Diego, CA, USA, 2001; Volume 340, pp. 68–98. [Google Scholar]
  39. Hernandez-Folgado, L.; Schmuck, C.; Tomić, S.; Piantanida, I. A novel pyrene-guanidiniocarbonyl-pyrrole cation efficiently differentiates between ds-DNA and ds-RNA by two independent, sensitive spectroscopic methods. Bioorg. Med. Chem. Lett. 2008, 18, 2977–2981. [Google Scholar] [CrossRef] [PubMed]
  40. Armitage, B.A. DNA Binders and Related Subjects: Cyanine dye-DNA interactions: Intercalation, groove binding, and aggregation. Top. Curr. Chem. 2005, 253, 55–76. [Google Scholar]
  41. Mergny, J.L.; Lacroix, L. Analysis of thermal melting curves. Oligonucleotides 2003, 13, 515–537. [Google Scholar] [CrossRef]
  42. Piantanida, I.; Palm, B.S.; Žinić, M.; Schneider, H.J. A new 4,9-diazapyrenium intercalator for single- and double-stranded nucleic acids: Distinct differences from related diazapyrenium compounds and ethidium bromide. Perkin Trans. 2001, 1808–1816. [Google Scholar] [CrossRef]
  43. Wong, P.; Lee, C.; Tannock, I.F. Reduction of intracellular pH as a strategy to enhance the pH-dependent cytotoxic effects of melphalan for human breast cancer cells. Clin. Cancer Res. 2005, 11, 3553–3557. [Google Scholar] [CrossRef] [Green Version]
  44. Gillies, R.J.; Robey, I.; Gatenby, R.A. Causes and consequences of increased glucose metabolism of cancers. J. Nucl. Med. 2008, 49, 24s–42s. [Google Scholar] [CrossRef] [Green Version]
  45. Raghunand, N.; Gillies, R.J. pH and drug resistance in tumors. Drug Resist. Update 2000, 3, 39–47. [Google Scholar] [CrossRef] [PubMed] [Green Version]
Scheme 1. Chemical reaction network established by flavylium cations in slightly acidic aqueous solution exemplified for 4′-(N,N-dimethylamino)-6-hydroxyflavylium F1, studied here [25]. Other species formed upon protonation of the amino group under very acidic conditions and deprotonation of the phenol group(s) in the hemiketal, cis- and trans-chalcones occur at basic pH values are omitted for simplicity.
Chemosensors 08 00129 sch001
Figure 1. Changes in UV/Vis spectrum of compound F1 (c = 1 × 10⁻⁵ mol·dm−3) upon titration with poly dAdT–poly dAdT (LEFT) and dependence of absorbance at λmax = 541 nm on (poly dAdT–poly dAdT), pH 5.0, sodium cacodylate buffer, I = 0.05 mol·dm−3 (RIGHT). The fitting to the Scatchard eq [29,30] (▬) yielded parameters shown in Table 2.
Chemosensors 08 00129 g001
Figure 2. Strong increase of emission intensity of F1 (c = 1 × 10⁻⁵ mol·dm−3, λexc. = 541 nm) at λem. = 630 nm upon the addition of various ds-polynucleotides (sodium cacodylate buffer, pH = 5.0, I = 0.05 mol·dm−3). Data were fitted by non-linear least square procedure according the Scatchard equation [29,30] (▬) and results are given in Table 2.
Chemosensors 08 00129 g002
Figure 3. Changes in the circular dichroism (CD) spectra of poly dA–poly dT (LEFT, c = 2 × 10⁻⁵ mol·dm−3) and poly A–poly U (RIGHT, c = 2 × 10⁻⁵ mol·dm−3) upon the addition of F1 in various ratios r = [F1]/[polynucleotide].
Chemosensors 08 00129 g003
Figure 4. Changes in the flow—linear dichroism (LD) spectra of calf thymus DNA (ct-DNA) (c = 2 × 10⁻⁴ mol·dm−3) at various ratios r = [F1]/[ct-DNA]. The induced negative signal in the LD spectra corresponds to the absorption band of F1, the inset shows F1 UV/vis absorption spectrum.
Chemosensors 08 00129 g004
Table 1. Measured fluorescence lifetimes for flavylium F1 (c = 1 × 10⁻⁵ mol·dm−3) upon the addition of ds-polynucleotides (c = 1.2 × 10⁻⁴ mol·dm−3); phosphate buffer, pH 5.0, I = 0.05 M.
Sampleτ/ps
F147 ± 7
F1 + pApU284 ± 10
F1 + pdAdT232 ± 6
F1 + p(dAdT)2220 ± 12
F1 + p(dGdC)2117 ± 8
F1 + pdGdC118 ± 16
Table 2. Stability constants (log Ks), ratios n = [bound F1]/[polynucleotide] and spectroscopic properties of complexes of F1 with ds-polynucleotides calculated according to Scatchard equation by Global Fit procedure simultaneously from UV-Vis and fluorimetric titrations.
PolynucleotideslogKsna Δλ/nmb ΔIcalcc Stokes Shift/nm
ctDNA5.20.12+1222788
poly A–poly U 4.80.18+1737588
poly dA–poly dT 6.10.05+1041990
poly dG–poly dC5.50.07+1812297
poly (dA–dT)25.20.14+1129690
poly (dG–dC)24.90.23+158992
a UV/Vis spectrophotometric data, changes in the maximum absorption wavelength: Δλ = λmax(complex) − λmax (pure compound) b Spectrofluorimetric data, change in emission intensity: ΔIcalc= Ilim − I0 where I0 refers to pure F1 and Ilim refers to the complex, calculated upon fitting with the Scatchard equation [29,30]. c Spectrofluorimetric data, Stokes shift of the complex, the difference between λmax(absorption) and λmax(emission).
Publisher’s Note: MDPI stays neutral with regard to jurisdictional claims in published maps and institutional affiliations.

