Abstract
Caffeic acid may be accurately detected in food supplements by using cyclic voltammetry and carbon screen-printed sensors modified with various nanomaterials. Sensor characterization by cyclic voltammetry in reference solutions has shown that carbon nanotubes or carbon nanofibers significantly improve the sensor response in terms of sensitivity and reversibility. Screen-printed sensors were then used in order to study the electrochemical behavior of caffeic acid in aqueous solution at pH 3.6. A redox process was observed in all cases, which corresponds to a reversible redox process involving the transfer of two electrons and two protons. The role of nanomaterials in the increment of sensor performance characteristics was evidenced. Calibration curves were developed for each sensor, and the detection (LOD) and quantification (LOQ) limits were calculated. Low LOD and LOQ values were obtained, in the 10−7 to 10−9 M range, which demonstrates that the method is feasible for quantification of caffeic acid in real samples. Caffeic acid was quantitatively determined in three food supplements using the most sensitive sensor, namely the carbon nanofiber sensor. The Folin–Ciocalteu spectrophotometric assay was used to validate the results obtained with the sensor. The results obtained by using the voltammetric method were consistent with those obtained by using the spectrophotometric method, with no statistically significant differences between the results obtained at 95% confidence level.
1. Introduction
Phenolic compounds are found in fruits; vegetables; grains; and beverages such as tea, coffee and wine and are the most abundant antioxidants in people’s diets [1]. Over the years, important efforts have been made to elucidate the beneficial effects of phenolic compounds on human health, mainly due to their antioxidant activities [2]. As antioxidants, phenolic compounds can protect the cellular constituents against oxidative stress and can, therefore, limit the risk of people developing certain degenerative diseases [3]. Experimental studies have demonstrated the role of phenolic compounds in the prevention of cardiovascular and neurodegenerative diseases, as well as in cancer, osteoporosis and diabetes prevention [4,5]. The consumption of phenolic compounds has been proven to limit the development of atheromas by inhibition of low-density lipoprotein oxidation, which is considered a key mechanism in endothelial lesions resulting the atherosclerosis [4,6].
The main challenge in analyzing phenolic compounds is the variety and complexity of their chemical structures [7]. Despite the recent progress in the field, the extraction, separation, identification and quantification of phenolic compounds in plants remain a challenge [8]. There are numerous extraction methods which may be used in the analyses of different samples. Solvent extractions, such as liquid/liquid extraction and solid/liquid extraction, are most commonly used in the laboratories for analyzing samples of vegetal origin [9,10]. Phenolic compounds are predominantly hydrophilic, so these compounds and their derivatives (e.g., glycosides, oligomers) can be extracted by using water mixtures, polar organic solvents (methanol, ethanol, acetonitrile, acetone, etc.) or mixtures of the two with water in various proportions [8]. The pH of the solvent used for extraction is important as well. In the case of phenolic compounds, most extractions are performed under acidic conditions due to the fact that they are generally more stable at low pH; the acidic conditions help them to remain neutral and thus more easily extracted into organic solvents [8,9].
Numerous spectrophotometric methods have been developed for estimating the total content of phenolic compounds, flavonoids and anthocyanins [8,9]. Although these methods are fast and simple, these cannot be applied specifically to individual compounds. Interference of nonphenolic compounds in the sample may cause erroneous results. Glycosides of the same aglycone, such as quercetin glycosides, have similar ultraviolet–visible (UV-Vis) spectra but slightly different retention times in chromatography. Therefore, the chromatography allows the individual separation and identification [10].
Among the phenolic compounds found in fruits, the hydroxycinnamic acids (HAs) are very important and have antioxidant properties. HAs are present in all parts of the fruit, although a higher concentration is observed in the peel of ripe fruit. Caffeic acid is the most abundant HA, representing 75%–100% of the total found in most fruits [11]. Caffeic acid (3,4-dihydroxycinnamic acid) is also found in wine, tea, coffee, olive oil, etc. [1]. Caffeic acid contributes to color stability and protection against oxidation in food and beverages [12], and it acts as an antioxidant and free radical scavenger [13] and as a carcinogenic inhibitor [14] in the body.
Moreover, caffeic acid is a useful compound which may be used for topical application to protect the skin against photosensitive damage, UV-induced damage and other associated problems such as skin inflammation [15]. Considering the importance of this compound, it is necessary to establish a simple, fast, sensitive and low-cost method for the quantitative analysis of caffeic acid. Electroanalysis is a fast, sensitive and inexpensive method useful for determining the electroactive compounds from complex samples [12]. For example, the electrochemical oxidation of caffeic acid has been studied for the elucidation of the reaction mechanism and kinetics. Furthermore, electroanalytical methods for the quantification of caffeic acid in wines, teas, coffee, olive oils, juices, vegetable raw materials or pharmaceutics have been developed [16,17].
The voltammetric sensors used to determine caffeic acid are mainly based on vitreous carbon [18,19]; graphite [20]; reduced graphene [21]; poly(3,4-ethylenedioxythiophene) (PEDOT) [22,23]; and various composites involving the use of PEDOT, graphene, chitosan and metal nanoparticles, among others [24,25,26]. The sensitive materials, the detection technique and the analytical performances of the main types of voltammetric sensors used for the detection of caffeic acid are included in Table 1.

Table 1.
Sensitive materials, detection techniques and detection limits (LODs) of the main voltammetric sensors used for the detection of caffeic acid.
Among voltammetric sensors, those based on screen-printing technology have seen a rapid development [34]. Numerous screen-printed electrodes (SPEs), which are suitable for on-line and on-site analysis, have been developed in order to achieve the portability of such systems and to reduce the cost of the electroanalytical methods [35,36]. SPE modification with various materials, especially carbonaceous nanomaterials, has significantly increased the sensitivity and selectivity of the sensors due particular features such as electrocatalytic properties, large active surface area and fast electron transfer rate [37,38].
The aims of the this study were to carry out the electrochemical characterization of novel carbon-based screen-printed electrodes (C-SPEs) modified with carbon nanofibers or multiwalled carbon nanotubes and to develop and validate a sensitive electroanalytical method for the quantitative assay of caffeic acid in food supplements.
2. Materials and Methods
2.1. Chemicals and Solutions
The potassium chloride, potassium ferrocyanide, sodium diphosphate and phosphoric acid were purchased from Sigma-Aldrich (St. Louis, MO, USA). The 0.1 M KCl solution and the 0.1 M KCl and 10−3 M potassium ferrocyanide solutions were used in the preliminary experiments.
The 0.1 M phosphate buffer solution (PBS) with a pH of 3.6 was used as a support electrolyte in the studies related to caffeic acid electrochemical detection. The PBS was prepared from the calculated amounts of NaH2PO4 and H3PO4, which were dissolved in ultrapure water obtained from a Milli-Q system (Millipore, Bedford, MA, USA). The pH value of PBS was verified by using a pH meter (WTW instruments, Weilheim, Germany).
The caffeic acid (analytical purity) used in the electroanalytical studies was purchased from Sigma-Aldrich. The stock solution of caffeic acid (10−3 M) was prepared by dissolving the appropriate amount of caffeic acid in a PBS solution of pH 3.6.
The interfering compounds uric acid, ferulic acid, vanillic acid, gallic acid and catechol were purchased from Sigma-Aldrich. L-Ascorbic acid was acquired from Riedel-de Haën (Seelze, Germany).
The Folin–Ciocalteu reagent (Sigma-Aldrich, St. Louis, MO, USA) and a 15% sodium carbonate solution (Sigma-Aldrich, St. Louis, MO, USA) were used in the Folin–Ciocalteu spectrophotometric assay.
Multiwalled carbon nanotubes (MWCNTs) and carbon nanofibers (CNFs) were acquired from Sigma-Aldrich (St. Louis, MO, USA) and used for the modification of C-SPCEs.
2.2. Electrochemical Cell
An electrochemical cell (Princeton Applied Research, Oak Ridge, TN, USA) of 50 mL was used. The Ag/AgCl electrode, which is the most commonly employed in the electrochemical experiments performed in aqueous media, was used as a reference electrode due to its simplicity, stability and lack of toxicity. A Pt wire was the counter electrode used in all the electrochemical studies. This material was chosen due to its chemical and electrochemical inertia. The working electrodes were C-SPEs (Dropsens, Llanera, Asturias, Spain) modified in the lab with MWCNTs or CNFs. The modification procedure was carried out following a previously reported method [39]. The suspensions of MWCNTs and CNFs were prepared by adding 10 mg of carbonaceous nanomaterial powder in 10 mL of solvent (a dimethylformamide:water mixture (1:1)) followed by sonication for 60 min using an Elmasonic ultrasonic bath (Carl Roth GmbH, Karlsruhe, Germany). The C-SPEs were modified with the nanomaterial dispersions by the casting method. Here, 10 μL of the suspension was cast onto the working electrode surface of the C-SPE in two stages of 5 μL. The solvent evaporation was carried at room temperature in a desiccator.
2.3. Electrochemical Measurements
An EG&G potentiostat/galvanostat (Princeton Applied Research, Oak Ridge, TN, USA), model 263A, controlled by ECHEM software (which operates in Windows) was used to characterize and optimize the electrode signals and for electroanalysis of the food supplements. Experiments, data acquisition and interpretation of results were controlled in this way.
Cyclic voltammetry was the detection technique used, and the optimal potential range was optimized for the analyzed solutions. The scan rate was 0.1 V·s−1, except for the studies on the influence of scan rate on the sensor response.
2.4. Real Sample Analysis
Three food supplements were analyzed, namely Active Detox, DVR-Stem Glycemo and Green Tea.
Active Detox (Herbagetica) is an original Romanian product, obtained from concentrated Aloe ferox juice (75%; 300 mg), and other several plant extracts: standardized artichoke extract (Cynara scolymus) (32 mg) containing 2.5% derivatives of caffeic acid; extract from cherry fruit tails (Prunus cerasus/Prunus avium) (32 mg); corn silk extract (Zea mays) (36 mg).
DVR-Stem Glycemo (DVR Pharm) contains extracts of bitter Tibetan cucumber (Momordica caranthia) (100 mg), Siberian ginseng root (Eleuterococus senticosus) powder (60 mg), artichoke (Cynara scolymus) leaves, a dry hydroalcoholic extract with at least 2.5% caffeic acid derivatives, olive leaves (45 mg) and dandelion leaves (30 mg). The product also contains lyophilized royal jelly (80 mg).
Ceai Verde (green tea) (Alevia) is a type of tea obtained from the unfermented leaves of Camelia sinensis, an evergreen Asian shrub with at least 90% polyphenols and at least 60% catechins grown in China, India, Pakistan and Russia.
The contents of one capsule of each food supplement were dispersed in 50 mL of PBS solution (pH = 3.6) for the electrochemical analysis. Ultrasonication followed by filtration was used in order to prepare the real samples for the analysis.
The Folin–Ciocalteu assay was used to validate the novel electroanalytical method based on modified C-SPE. The caffeic acid solutions of different concentrations were the standard solutions [40]. To put it briefly, variable volumes were taken from the caffeic acid stock solution so that the concentrations of the final solutions ranged from 0.1 to 20 mg/mL (12 standard solutions). Afterwards, 2 mL of 15% Na2CO3 solution, 0.5 mL of Folin–Ciocalteu reagent and ultrapure water were added to reach a final volume of 5 mL. The volumetric flasks were kept at room temperature for 30 min, and after the absorbance of standard solutions were registered at 765 nm with a Rayleigh UV2601 UV/Vis double-beam spectrophotometer (Beijing Beifen-Ruili Analytical Instrument, Beijing, China) towards the blank sample.
In the case of food supplements, the samples were processed in the same manner as in the case of voltammetric analysis. Dilutions were made from the stock solution so that the absorbance would be close to the half of the absorbance range obtained for standard solutions. All food supplements were analyzed in triplicate.
3. Results and Discussion
3.1. Preliminary Studies
Preliminary analysis evaluated the electrochemical properties of three types of C-SPCE: one of them unmodified and the other two chemically modified with either CNFs or MWCNTs. The electrolytic solutions used were a 0.1 M KCl solution and a 10−3 M K4[Fe(CN)6] and 0.1 M KCl solution.
Initially, the widest possible potential range when water is the solvent was used. The signal of all electrodes was not stable when the potential range had values between −1.0 and +1.3 V; an intense and unstable peak, associated with water reduction, was observable at negative potentials (lower than −0.6 V) [41]. Consequently, the potential range to be used in aqueous solutions needed to be optimized so that the electrode signals would be stable.
The vertex potential in the positive range remained constant at +1.3 V, and the vertex potential in the negative range changed by 0.1 V each time. A stable signal of the sensors was obtained in the case of caffeic acid when the potential range values were between −0.4 and +1.3 V. In the case of potassium ferrocyanide, the optimal potential range values were between −0.6 and +1.0 V.
In the first stage, the voltammetric behavior of the C-SPEs, MWCNT/C-SPEs and CNF/C-SPEs in the 0.1 M KCl solution (redox inactive substance) in the potential range between −0.6 and +1.3 V was studied. No peaks were observed in the studied potential range (results are not shown). This demonstrates that the materials used to build the electrodes have high purity and that the active surfaces of the electrodes used do not show any contamination which could influence the electrochemical responses. It may also be noticed that the CNF/C-SPE has lower background currents as compared to the other electrodes used.
3.2. The Electrochemical Behavior of C-SPEs, CNF/C-SPEs and MWCNT/C-SPEs in Electroactive Solution
In the next stage of the present research, the electrochemical behavior of the electrodes when immersed in a solution containing 10−3 M potassium ferrocyanide and 0.1 M potassium chloride was studied.
As shown in Figure 1, each electrode has two peaks (an anodic one and a cathodic one), which are related to the oxidation–reduction processes of the ferrocyanide ion at the surface of the working electrode.
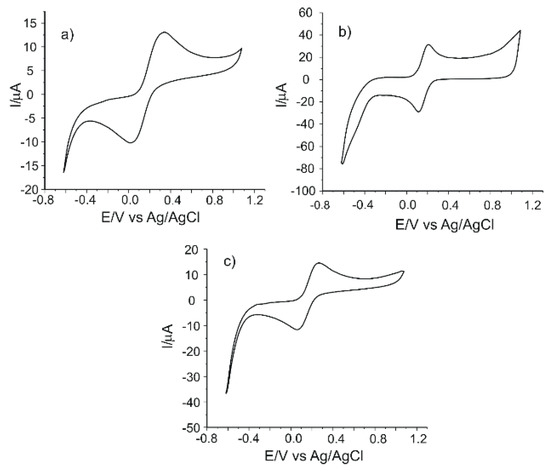
Figure 1.
The cyclic voltammograms of (a) carbon-based screen-printed electrodes (C-SPEs), (b) carbon nanofiber (CNF)-modified C-SPEs and (c) multiwalled carbon nanotube (MWCNT)-modified C-SPEs immersed in 10−3 M K4[Fe(CN)6] - 0.1 M KCl solution. Scan rate 0.1 V·s−1.
The main parameters obtained from the cyclic voltammograms, as well as those which can be calculated from these parameters, are presented in Table 2.
Table 2.
Electrochemical parameters obtained from the sensor cyclic voltammograms of electrodes immersed in 10−3 M K4[Fe(CN)6]–0.1 M KCl solution.
E1/2 (half-wave potential) has approximately the same value for CNF/C-SPE (0.163 V) and MWCNT/C-SPE (0.166 V) and a higher value for C-SPE (0.179 V). The Ipc/Ipa ratio is close to the ideal value of 1 in all situations, the closest value to the ideal being obtained in the case of CNF/C-SPE (0.85). The highest peak currents were observed in the case of CNF/C-SPE and were almost double those of the unmodified electrode. Considering these results, CNF/C-SPE showed the highest sensitivity for the detection of ferrocyanide ion (Ipa and Ipc have the highest values). The CNF/C-SPE has the highest degree of reversibility, the lowest separation between the potentials of the anodic and cathodic peaks (ΔE) and the greatest Ipc/Ipa ratio value.
In order to estimate the active surface area of SPEs, cyclic voltammograms of all the sensors were registered in 10−3 M potassium ferrocyanide and 0.1 M potassium chloride solution with different scan rates in the range of 0.1–1.0 V·s−1. The results obtained in the case of CNF/C-SPE are presented in Figure 2a.
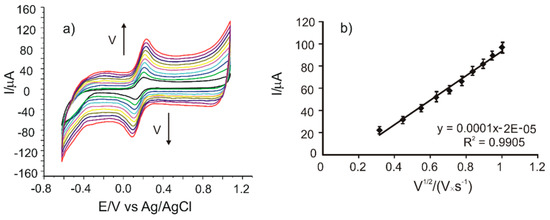
Figure 2.
(a) Cyclic voltammograms of CNF/C-SPE immersed in 10−3 M K4[Fe(CN)6] − 0.1 M KCl solution registered with scan rates in the range of 0.1–1.0 V·s−1. (b) Plot of Ipa vs. v1/2.
It may be noticed that the currents corresponding to the redox processes of the ferrocyanide/ferricyanide couple increase when the scan rate increases. In order to determine the limiting factor of the electrochemical oxidation process, linear regression models were developed, correlating the Ipa with the scan rate or the square root of the scan rate. A very good linearity was obtained between Ipa and the square root of the scan rate, I(A) = 0.0001·v1/2(V·s−1)1/2 + 2×10⁻⁵ (Figure 2b), with a coefficient of determination (R2) of 0.9905. According to other reported results, this linear dependence demonstrates that the electrochemical process at the working electrode is controlled by the diffusion of the electroactive species, where the diffusion is the determining stage of kinetics.
The same type of result was obtained for the C-SPE and MWCNT/C-SPE. The equations of linear regressions and R2 values are presented in Table 3.
Table 3.
Ipa vs. v1/2 linear regression equations, determination coefficients and active surface areas of all the screen-printed electrodes studied.
The linear dependencies between Ipa and v1/2 were used to calculate the active area of the electrodes using the Randles–Sevcik equation [42,43].
where Ipa is the anodic peak current (A), n is the number of electrons transferred in the redox process, A is the electrode area (cm2), D is the diffusion coefficient (cm2·s−1), C is the concentration (mol·cm−3) and v is the scan rate (V·s−1). The diffusion coefficient of the ferrocyanide ion is D = 7.26 × 10⁻⁶ cm2·s−1 [42].
The area of the electrode’s active surface was calculated from the slope of the Ipa equation as a function of v1/2. The results obtained are also presented in Table 3.
The highest value of the active surface area was obtained for the CNF/C-SPE, followed by MWCNT/C-SPE and C-SPE. These results are consistent with peak currents previously presented. The conclusion was that the sensor sensitivity is the highest for CNF/C-SPE, followed by MWCNT/C-SPE and then C-SPE. This high sensitivity of CNF/C-SPE is due to the presence of CNFs on the electrode surface, which favor electron transfer and the selective accumulation and favorable diffusion of analytes due to their small size with large specific surface area. These results are consistent with various studies published in the field which consider that CNFs generally have a better electrochemical behavior due to their nanoscale features, very good conductivity and high chemical stability [44,45,46]. However, all the three electrodes can be successfully used to detect caffeic acid, the target compound of this study.
3.3. Electrochemical Responses of Sensors in Caffeic Acid Solution
Qualitative and, subsequently, quantitative determination of caffeic acid was performed by cyclic voltammetry, a method that has multiple advantages (i.e., sensitivity, selectivity and easy to use equipment) and is useful for understanding the processes taking place on the surface of electrodes. The cyclic voltammograms were registered in 10−3 M caffeic acid solution; the support electrolyte solution was 0.1 M PBS (pH = 3.6). This pH value is optimal for the determination of caffeic acid with a very good sensitivity and selectivity [47]. This value was used because the caffeic acid is not dissociated at this value [48]. Furthermore, the pH of 3.6 is the typical value for wines and fruit juice, and it is desirable to expand this electroanalytical method for other natural samples [49]. Regarding the electrochemical measurements, five cycles in the optimized potential range (from −0.4 to +1.3 V) are required in order to obtain a stable sensor response. The cyclic voltammograms further presented are those obtained after the stabilization of the signals.
Figure 3 shows the cyclic voltammograms of all electrodes in 10−3 M caffeic acid solution (electrolyte support 0.1 M PBS, pH = 3.6).
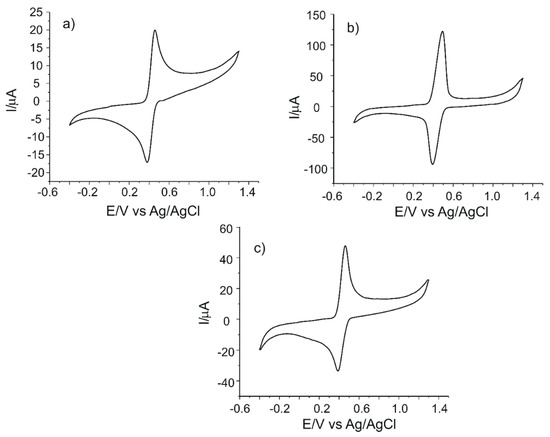
Figure 3.
Cyclic voltammograms of (a) C-SPE, (b) CNF/C-SPE and (c) MWCNT/C-SPE immersed in 10−3 M caffeic acid solution (support electrolyte 0.1 M PBS, pH = 3.6).
An anodic peak and a cathodic peak, corresponding to oxidation and reduction processes of caffeic acid at the surface of the working electrode, respectively, may be observed in the cyclic voltammograms of all SPEs. According to other studies, the redox processes consist in the oxidation of caffeic acid to the corresponding ortho-quinone derivative, followed, in the cathodic scan, by the reduction of the ortho-quinone derivative to caffeic acid [50]. These processes involve the transfer of two electrons and two protons [50,51]. The scheme of the electrochemical detection mechanism of caffeic acid is presented in Figure 4. It must be stated that caffeic acid is undissociated at the pH value of 3.6 [15,48].
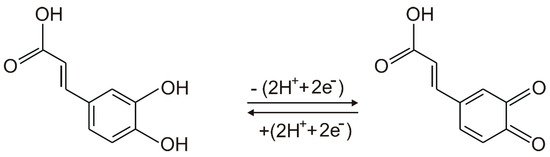
Figure 4.
The mechanism of reversible redox process of caffeic acid.
Table 4 presents the most important electrochemical parameters obtained from cyclic voltammograms or calculated by taking into account the experimental parameters.
Table 4.
The values of the parameters obtained from the cyclic voltammograms of all the electrodes immersed in 10−3 M caffeic acid solution (the electrolyte support was 0.1 M PBS of pH 3.6).
All the electrodes studied showed two clear and well-defined peaks and a quasi-reversible behavior, as indicated by the values ΔE and Ipc/Ipa. The CNF-modified electrode has the most intense anodic and cathodic peaks, demonstrating that it has the best sensitivity for the detection of caffeic acid. The peaks observed in the case of MWCNT/C-SPE are more intense than the peaks of C-SPE, which demonstrates the facilitation of the electrochemical processes by means of nanomaterial modification. Comparing the nanomaterials, it was reported that CNFs have a larger surface-to-volume ratio than MWCNTs due to the cylindrical nanostructure with a stacking arrangement of graphene sheets and more edge-plane defects on the outer wall. These features offer efficient electron transfer and enhanced electrocatalytic activity [52]. Therefore, the oxidation of caffeic acid to the ortho-quinone derivative and the consequent reduction of the ortho-quinone derivative to caffeic acid via two-electron and two-proton transfer processes are facilitated by CNF features [46]. The sensitivity of the electrodes increases in the following order: C-SPE < MWCNT/C-SPE < CNF/C-SPE. This could be related to the carbon nanofiber features such as high surface-to-volume ratio, large specific surface area, improved interfacial adsorption, higher rate of electron transfer or better electrocatalytic properties [53].
In order to study the influence of the scan rate on the voltammetric response, the cyclic voltammograms of C-SPE, CNF/C-SPE and MWCNT/C-SPE were registered at different scan rates between 0.1 and 1.0 V·s−1, increasing the scan rate by 0.1 V·s−1 each time.
In order to determine which factor controls the kinetics of the electrode processes, the currents of the anodic peaks were plotted as a function of the scan rate or the square root of the scan rate.
A linear dependence between Ipa and v1/2 (Table 5) was obtained in all cases, which demonstrates that the redox process is controlled by the diffusion process. The diffusion coefficient (D) values of caffeic acid were calculated from the Randles–Sevcik equation, and the results for all electrodes are shown in Table 5.
Table 5.
The linear fitting equations (Ipa vs. v1/2), R2 and D of caffeic acid.
The D values obtained for caffeic acid with SPEs are comparable to those obtained with other carbon-based electrodes reported in the literature [48,54,55,56]. It is well known that carbon nanomaterials significantly improve the absorption of the analyte on the electrode surface; they also increase the electroactive surface, which accelerates the electrochemical reactions [37,44,45,46].
These results prove that C-SPEs modified with carbonaceous nanomaterials are sensitive and useful for the detection of caffeic acid.
3.4. Calibration Curve and Calculation of the Detection Limit
Calibration curves were constructed for each sensor (C-SPE, CNF/C-SPE and MWCNT/C-SPE) by registering the cyclic voltammograms in solutions of caffeic acid in the concentration range from 0.1 to 40 μM (the electrolyte support was 0.1 M PBS of pH 3.6).
The voltammetric responses of the CNF/C-SPE immersed in solutions of caffeic acid with different concentrations are shown in Figure 5a. When the concentration of caffeic acid increases, the intensity of the anodic and cathodic peaks increases as well.
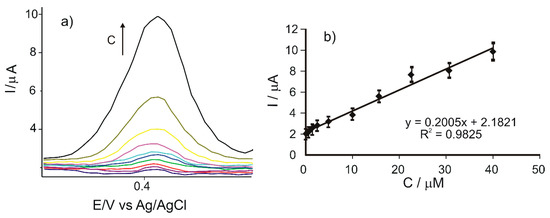
Figure 5.
(a) Zoomed-in view of the anodic peak zone of the cyclic voltammograms registered with CNF/C-SPE immersed in caffeic acid solutions with the concentrations in the 0.1–40 μM range. (b) Linear dependence between the anodic peak current and the concentration of the caffeic acid solution.
Full width at half maximum (FWHM) of the anodic peak at the level of concentration used for the calibration was in the (42–62) ± 2 mV range. These values are close to the theoretical value of 90.6 mV divided by n, where n is the number of electrons transferred [57]. Therefore, at these concentrations the CNF/C-SPE has a behavior close to the ideal one in the detection of caffeic acid, which consists in the transfer of two electrons and two protons [48].
The calibration curve, representing the dependence between the anodic peak current of the CNF/C-SPE and the caffeic acid concentration (Ipa vs. c), is shown in Figure 5b.
A linear dependence was observed between the anodic peak current and the caffeic acid concentration, for concentrations in the 0.1–40 μM range.
The detection limit (LOD) and quantification limit (LOQ) were calculated from the following equations [58]:
where σ is the standard deviation of the electrochemical signal for the blank sample at the potential corresponding to the caffeic acid peak and m is the slope of the calibration curve.
LOD = 3σ/m; LOQ = 10σ/m
The results obtained for the LOD and the LOQ for all sensors are presented in Table 6.
Table 6.
LOD and quantification limit (LOQ) values for caffeic acid detection for each of the three sensors.
The low LOD and LOQ values, lower than the values previously reported in the field (Table 1), are due to the high sensitivity of the sensors developed in this study. These results demonstrate the feasibility of the voltammetric method for the analysis of caffeic acid in real samples, such as food supplements.
CNF/C-SPE, which has the lowest LOD and LOQ, is the most sensitive sensor developed in this study. As compared to MWCNTs, CNFs do not have a perfect disposition of atoms and the empty cavity in the center. In general, CNFs are cylinder-shaped and consist of graphene layers disposed as stacked cones, cups or plates. One of the most important characteristics of CNFs is the presence of a high number of edges, which ensure an adapted surface available for interaction with analytes [59]. Therefore, CNF/C-SPE will be used for the quantitative analysis of caffeic acid in food supplements.
3.5. Quantification of Caffeic Acid in Food Supplements
The CNF/C-SPE sensor was used to quantify the caffeic acid in three nonstandardized food supplements: Active Detox (Herbagetica), DVR-Stem Glycemo (DVR Pharm) and green tea (Alevia). The measurements were registered by cyclic voltammetry in the potential range between −0.4 and 1.3 V with different scan rates between 0.1 and 1.0 V·s−1 (Figure 6a–c). It may be observed that a pair of redox peaks related to the caffeic acid present in the samples are obtained. There are some less defined peaks or shoulders which correspond to other active compounds found in these food supplements. The intensities of the anodic and cathodic peaks increase when the scan rate increases. When the intensity of the anodic peak as a function of the scan rate is graphically represented, a linear dependence with v1/2 is obtained, which demonstrates that the electrochemical process is controlled by diffusion, as in the case of caffeic acid.
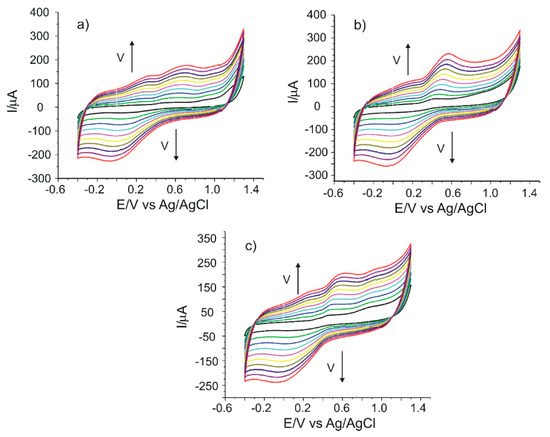
Figure 6.
Cyclic voltammograms of CNF/C-SPE immersed in solutions of (a) Active Detox, (b) DVR-Stem Glycemo and (c) green tea, recorded at scan rates between 0.1 and 1.0 V·s−1.
Table 7 shows the values of the currents and potentials which correspond to the peaks observed in the cyclic voltammograms registered at 0.1 V·s−1.
Table 7.
Parameters of the cyclic voltammograms of the CNF/C-SPE immersed in the real samples.
The amounts of caffeic acid in food supplements were calculated from the calibration equations, which correspond to the two methods of determination, i.e., spectrophotometric and voltammetric methods (CNF/C-SPE). All the experiments were carried out in triplicate. The results are reported as the averages of three replicates.
In the case of Folin–Ciocalteu assay, the absorbances of the samples at 765 nm were registered after addition of reactives, and therefore used for quantification of caffeic acid in the samples by interpolation.
In the case of voltammetric method, in order to avoid the interference of other compounds in food supplements, the current corresponding to specific detection potential for caffeic acid, i.e., 0.493 V, was taken into account (Table 4). In the calculations of values reported in the Table 8, the dilutions and the amount of food supplement used in the analysis were taken into account. The results, expressed in mg of caffeic acid per capsule, are shown in Table 8. Producers specify that caffeic acid is present in the food supplements, but the amount in which it is present is not mentioned on the label of the products.
Table 8.
Caffeic acid content determined in the three food supplements by using spectrophotometric and voltammetric methods.
The values of caffeic acid obtained by using the two methods are similar. One-way analysis of variance (ANOVA) showed no significant difference between the three sets of values at a 95% confidence level (p = 0.032). This result demonstrates that the voltammetric method is a sensitive, valid and accurate method for determining caffeic acid in food supplements.
3.6. Stability
Since screen-printed electrodes are disposable electrodes, one cannot speak of long-term stability. Such electrodes become relatively easily contaminated or fouled, and their surface cannot be easily renovated or cleaned without modifying it. In addition, considering that a pseudo-reference silver electrode may oxidize due to its interaction with the solution to be analyzed, an external reference electrode was used in the present study in order to avoid this problem.
The CNF/C-SPE sensor may be repeatedly used in the measurement conditions envisaged in this study without changing its cyclic voltammogram by more than 5% for at least 100 measurements. However, the relative standard deviation of 10 replicate cyclic voltammograms registered in 10−5 M caffeic acid solution is 3.02%. The contact time with the solution to be analyzed must be as short as possible, and the sensor must be washed with electrolyte support solution (PBS of pH 3.6 in this case) and with ultrapure water after each measurement.
3.7. Interference Studies
To assess CNF/C-SPE sensor selectivity for caffeic acid detection in complex samples, the influence of some chemically related species, which could interfere in the quantification of 10−5 M caffeic acid in optimal conditions, was studied. The tolerance limit was considered as being the maximum concentration of the interfering species that causes a relative error of ±5% for the quantitative detection of caffeic acid. The results obtained are shown in Table 9.
Table 9.
The interference of some chemically related species on the quantitative determination of 10−5 M caffeic acid.
As can be seen in the Table 9, caffeic acid determination is influenced more by the presence of catechol, while gallic acid, L-ascorbic acid, uric acid, ferulic acid and vanillic acid have a small influence in quantitative determination of caffeic acid. This is related to the oxidation potentials of catechol and gallic acid, which are close to that of caffeic acid. The other interfering compounds appear in cyclic voltammograms as novel peaks, not influencing the anodic or cathodic peaks of caffeic acid. From these results, it may be concluded that the CNF/C-SPE sensor is selective for caffeic acid in real samples and has good precision and accuracy.
4. Conclusions
A series of voltammetric sensors based on screen-printed carbon electrodes modified with carbon nanofibers or multiwalled carbon nanotubes have been successfully used in the analysis of caffeic acid. Among the sensors studied, the one based on carbon nanofibers has an excellent sensitivity for the detection of caffeic acid by cyclic voltammetry. The voltammetric method has been shown to be useful and valid for determining the caffeic acid content in food supplements. The sample analyzed requires minimal treatment before analysis and the equipment is simple, portable and highly sensitive. This analytical method is useful as a screening method to determine the caffeic acid content of nutritional supplements or pharmaceutical samples. The small amount of sample required, the reduced time necessary for sample analysis and portability are the advantages that make this electroanalytical method suitable for quality control of food supplements. In the future, nanotechnologies are expected to be used for the ordered deposition of nanomaterials for the increment of the sensing properties.
Author Contributions
Conceptualization, C.A. and A.V.B.; methodology, C.A.; validation, C.A. and A.V.B.; formal analysis, A.V.B.; investigation, C.A. and A.V.B.; data curation, C.A. and A.V.B.; writing—original draft preparation, A.V.B.; writing—review and editing, C.A.; supervision, C.A. All authors have read and agreed to the published version of the manuscript.
Funding
This research received no external funding.
Acknowledgments
The translation and linguistic review of the present article were conducted by Antoanela Marta Mardar, member of the Research Center “Interface Research of the Original and Translated Text. Cognitive and Communicative Dimensions of the Message”, Faculty of Letters, “Dunărea de Jos” University of Galați, Romania.
Conflicts of Interest
The authors declare no conflict of interest.
References
- Neto, J.O.; Rezende, S.G.; Reis, C.D.F.; Benjamin, S.R.; Rocha, M.L.; Gil, E.D.S. Electrochemical behavior and determination of major phenolic antioxidants in selected coffee samples. Food Chem. 2016, 190, 506–512. [Google Scholar] [CrossRef] [PubMed]
- González, I.; Morales, M.A.; Rojas, A. Polyphenols and AGEs/RAGE axis. Trends and challenges. Food Res. Int. 2020, 129, 108843. [Google Scholar] [CrossRef]
- Żwierełło, W.; Maruszewska, A.; Skórka-Majewicz, M.; Goschorska, M.; Baranowska-Bosiacka, I.; Dec, K.; Styburski, D.; Nowakowska, A.; Gutowska, I. The influence of polyphenols on metabolic disorders caused by compounds released from plastics—Review. Chemosphere 2020, 240, 124901. [Google Scholar] [CrossRef] [PubMed]
- Millar, C.L.; Duclos, Q.; Blesso, C.N. Effects of Dietary Flavonoids on Reverse Cholesterol Transport, HDL Metabolism, and HDL Function. Adv. Nutr. 2017, 8, 226–239. [Google Scholar] [CrossRef] [PubMed]
- Scalbert, A.; Manach, C.; Morand, C.; Rémésy, C.; Jimenez, L. Dietary Polyphenols and the Prevention of Diseases. Crit. Rev. Food Sci. Nutr. 2005, 45, 287–306. [Google Scholar] [CrossRef]
- Covas, M.I.; Nyyssonen, K.; Poulsen, H.E.; Kaikkonen, J.; Zunft, H.-J.F.; Kiesewetter, H.; Gaddi, A.; De La Torre, R.; Mursu, J.; Bäumler, H.; et al. The Effect of Polyphenols in Olive Oil on Heart Disease Risk Factors: A Randomized Trial. Ann. Intern. Med. 2006, 145, 333. [Google Scholar] [CrossRef]
- Tzima, K.; Brunton, N.; Rai, D.K. Qualitative and Quantitative Analysis of Polyphenols in Lamiaceae Plants—A Review. Plants 2018, 7, 25. [Google Scholar] [CrossRef]
- Tsao, R. Chemistry and biochemistry of dietary polyphenols. Nutrients 2010, 2, 1231–1246. [Google Scholar] [CrossRef]
- Mojzer, E.B.; Hrnčič, M.K.; Škerget, M.; Knez, Ž.; Bren, U. Polyphenols: Extraction Methods, Antioxidative Action, Bioavailability and Anticarcinogenic Effects. Molecules 2016, 21, 901. [Google Scholar] [CrossRef]
- Tsao, R.; Yang, R. Optimization of a new mobile phase to know the complex and real polyphenolic composition: Towards a total phenolic index using high-performance liquid chromatography. J. Chromatogr. A 2003, 1018, 29–40. [Google Scholar] [CrossRef]
- Guo, J.; Yuan, Y.; Dou, P.; Yue, T. Multivariate statistical analysis of the polyphenolic constituents in kiwifruit juices to trace fruit varieties and geographical origins. Food Chem. 2017, 232, 552–559. [Google Scholar] [CrossRef] [PubMed]
- Hoyos-Arbeláez, J.; Vázquez, M.; Contreras-Calderón, J. Electrochemical methods as a tool for determining the antioxidant capacity of food and beverages: A review. Food Chem. 2017, 221, 1371–1381. [Google Scholar] [CrossRef] [PubMed]
- Melero, A.; Assis, R.P.; Brunetti, I.L.; Isaac, V.L.B.; Salgado, H.R.N.; Corrêa, M.A.C. In vitro methods to determine the antioxidant activity of caffeic acid. Spectrochim. Acta Part A Mol. Biomol. Spectrosc. 2019, 219, 358–366. [Google Scholar] [CrossRef]
- Singh, P.; Grewal, A.S.; Pandita, D.; Lather, V. Synthesis and evaluation of a series of caffeic acid derivatives as anticancer agents. Future J. Pharm. Sci. 2018, 4, 124–130. [Google Scholar] [CrossRef]
- Erady, V.; Mascarenhas, R.J.; Satpati, A.K.; Bhakta, A.K.; Mekhalif, Z.; Delhalle, J.; Dhason, A. Carbon paste modified with Bi decorated multi-walled carbon nanotubes and CTAB as a sensitive voltammetric sensor for the detection of Caffeic acid. Microchem. J. 2019, 146, 73–82. [Google Scholar] [CrossRef]
- Moon, J.-M.; Thapliyal, N.; Hussain, K.K.; Goyal, R.N.; Shim, Y.-B. Conducting polymer-based electrochemical biosensors for neurotransmitters: A review. Biosens. Bioelectron. 2018, 102, 540–552. [Google Scholar] [CrossRef]
- Apetrei, C.; Alessio, P.; Constantino, C.; De Saja, J.; Rodriguez-Mendez, M.; Pavinatto, F.; Fernandes, E.G.R.; Zucolotto, V.; Oliveira, O. Biomimetic biosensor based on lipidic layers containing tyrosinase and lutetium bisphthalocyanine for the detection of antioxidants. Biosens. Bioelectron. 2011, 26, 2513–2519. [Google Scholar] [CrossRef]
- Magarelli, G.; Da Silva, J.G.; Filho, I.A.D.S.; Lopes, I.S.D.; De Souza, J.R.; Hoffmann, L.; De Castro, C.S.P. Development and validation of a voltammetric method for determination of total phenolic acids in cotton cultivars. Microchem. J. 2013, 109, 23–28. [Google Scholar] [CrossRef]
- Karikalan, N.; Karthik, R.; Chen, S.-M.; Chen, H.-A. A voltammetric determination of caffeic acid in red wines based on the nitrogen doped carbon modified glassy carbon electrode. Sci. Rep. 2017, 7, 1–10. [Google Scholar] [CrossRef]
- David, I.G.; Bizgan, A.-M.C.; Popa, D.E.; Buleandră, M.; Moldovan, Z.; Badea, I.; Tekiner, T.A.; Basaga, H.; Ciucu, A.A. Rapid determination of total polyphenolic content in tea samples based on caffeic acid voltammetric behaviour on a disposable graphite electrode. Food Chem. 2015, 173, 1059–1065. [Google Scholar] [CrossRef]
- Vilian, A.; Chen, S.-M.; Chen, Y.-H.; Ali, M.A.; Al-Hemaid, F.M. An electrocatalytic oxidation and voltammetric method using a chemically reduced graphene oxide film for the determination of caffeic acid. J. Colloid Interface Sci. 2014, 423, 33–40. [Google Scholar] [CrossRef] [PubMed]
- Zhang, Q.; Kilmartin, P.A. Adsorption effects during the analysis of caffeic acid at PEDOT electrodes. Int. J. Nanotechnol. 2017, 14, 496–504. [Google Scholar] [CrossRef]
- Bianchini, C.; Curulli, A.; Pasquali, M.; Zane, D. Determination of caffeic acid in wine using PEDOT film modified electrode. Food Chem. 2014, 156, 81–86. [Google Scholar] [CrossRef]
- Di Carlo, G.; Curulli, A.; Toro, R.; Bianchini, C.; De Caro, T.; Padeletti, G.; Zane, D.; Ingo, G.M. Green Synthesis of Gold–Chitosan Nanocomposites for Caffeic Acid Sensing. Langmuir 2012, 28, 5471–5479. [Google Scholar] [CrossRef] [PubMed]
- Karabozhikova, V.; Tsakova, V. Electroanalytical determination of caffeic acid—Factors controlling the oxidation reaction in the case of PEDOT-modified electrodes. Electrochim. Acta 2019, 293, 439–446. [Google Scholar] [CrossRef]
- Matemadombo, F.; Apetrei, C.; Nyokong, T.; Rodriguez-Mendez, M.; De Saja, J.A. Comparison of carbon screen-printed and disk electrodes in the detection of antioxidants using CoPc derivatives. Sens. Actuators B Chem. 2012, 166–167, 457–466. [Google Scholar] [CrossRef]
- Zhang, Y.; Liu, Y.; He, J.; Pang, P.; Gao, Y.; Hu, Q. Electrochemical Behavior of Caffeic Acid Assayed with Gold Nanoparticles/Graphene Nanosheets Modified Glassy Carbon Electrode. Electroanalysis 2013, 25, 1230–1236. [Google Scholar] [CrossRef]
- Shi, Y.; Xu, H.; Wang, J.; Li, S.; Xiong, Z.; Yan, B.; Wang, C.; Du, Y. Visible light enhanced electrochemical detection of caffeic acid with waxberry-like PtAuRu nanoparticles modified GCE. Sens. Actuators B Chemical 2018, 272, 135–138. [Google Scholar] [CrossRef]
- Liu, Z.; Lu, B.; Gao, Y.; Yang, T.; Yue, R.; Xu, J.; Gao, L. Facile one-pot preparation of Pd–Au/PEDOT/graphene nanocomposites and their high electrochemical sensing performance for caffeic acid detection. RSC Adv. 2016, 6, 89157–89166. [Google Scholar] [CrossRef]
- Liu, Z.; Xu, J.; Yue, R.; Yang, T.; Gao, L. Facile one-pot synthesis of Au–PEDOT/rGO nanocomposite for highly sensitive detection of caffeic acid in red wine sample. Electrochim. Acta 2016, 196, 1–12. [Google Scholar] [CrossRef]
- Thangavelu, K.; Palanisamy, S.; Chen, S.-M.; Velusamy, V.; Chen, T.-W.; Ramaraj, S.K. Electrochemical Determination of Caffeic Acid in Wine Samples Using Reduced Graphene Oxide/Polydopamine Composite. J. Electrochem. Soc. 2016, 163, B726–B731. [Google Scholar] [CrossRef]
- Thangavelu, K.; Raja, N.; Chen, S.-M.; Liao, W.-C. Nanomolar electrochemical detection of caffeic acid in fortified wine samples based on gold/palladium nanoparticles decorated graphene flakes. J. Colloid Interface Sci. 2017, 501, 77–85. [Google Scholar] [CrossRef] [PubMed]
- Karabiberoglu, S.; Ayan, E.M.; Dursun, Z. Electroanalysis of Caffeic Acid in Red Wine and Investigation of Thermodynamic Parameters Using an Ag Nanoparticles Modified Poly(Thiophene) Film Glassy Carbon Electrode. Electroanalysis 2013, 25, 1933–1945. [Google Scholar] [CrossRef]
- Apetrei, I.M.; Apetrei, C. Development of a Novel Biosensor Based on Tyrosinase/Platinum Nanoparticles/Chitosan/Graphene Nanostructured Layer with Applicability in Bioanalysis. Materials 2019, 12, 1009. [Google Scholar] [CrossRef] [PubMed]
- Wee, Y.; Park, S.; Kwon, Y.H.; Ju, Y.; Yeon, K.M.; Kim, J. Tyrosinase-immobilized CNT based biosensor for highly-sensitive detection of phenolic compounds. Biosens. Bioelectron. 2019, 132, 279–285. [Google Scholar] [CrossRef]
- Apetrei, C.; Iticescu, C.; Georgescu, P.L. Multisensory System Used for the Analysis of the Water in the Lower Area of River Danube. Nanomaterials 2019, 9, 891. [Google Scholar] [CrossRef]
- Baig, N.; Sajid, M.; Saleh, T.A. Recent trends in nanomaterial-modified electrodes for electroanalytical applications. TrAC Trends Anal. Chem. 2019, 111, 47–61. [Google Scholar] [CrossRef]
- Apetrei, I.; Apetrei, C. A modified nanostructured graphene-gold nanoparticle carbon screen-printed electrode for the sensitive voltammetric detection of rutin. Measurement 2018, 114, 37–43. [Google Scholar] [CrossRef]
- Cinti, S.; Arduini, F.; Carbone, M.; Sansone, L.; Cacciotti, I.; Moscone, D.; Palleschi, G. Screen-Printed Electrodes Modified with Carbon Nanomaterials: A Comparison among Carbon Black, Carbon Nanotubes and Graphene. Electroanalysis 2015, 27, 2230–2238. [Google Scholar] [CrossRef]
- González, M.; Guzmán, B.; Rudyk, R.; Romano, E.; Molina, M.A.A. Spectrophotometric Determination of Phenolic Compounds in Propolis. Acta Farm. Bonaer. 2003, 22, 243–248. [Google Scholar]
- Choi, W.-K. Electrochemical Characterizations of the Reducibility and Persistency of Electrolyzed Reduced Water Produced from Purified Tap Water. Int. J. Electrochem. Sci. 2014, 9, 10. [Google Scholar]
- Apetrei, I.M.; Apetrei, C. Voltammetric determination of melatonin using a graphene-based sensor in pharmaceutical products. Int. J. Nanomed. 2016, 11, 1859–1866. [Google Scholar] [CrossRef] [PubMed]
- Bard, A.J.; Faulkner, L.R. Electrochemical Methods: Fundamentals and Applications, 2nd ed.; Wiley: New York, NY, USA, 2001. [Google Scholar]
- Ekabutr, P.; Chailapakul, O.; Supaphol, P. Modification of disposable screen-printed carbon electrode surfaces with conductive electrospun nanofibers for biosensor applications. J. Appl. Polym. Sci. 2013, 130, 3885–3893. [Google Scholar] [CrossRef]
- Rezaei, B.; Ghani, M.; Shoushtari, A.M.; Rabiee, M. Electrochemical biosensors based on nanofibres for cardiac biomarker detection: A comprehensive review. Biosens. Bioelectron. 2016, 78, 513–523. [Google Scholar] [CrossRef]
- Sakthivel, M.; Ramaraj, S.; Chen, S.-M.; Dinesh, B.; Ramasamy, H.V.; Lee, Y.S. Entrapment of bimetallic CoFeSe2 nanosphere on functionalized carbon nanofiber for selective and sensitive electrochemical detection of caffeic acid in wine samples. Anal. Chim. Acta 2018, 1006, 22–32. [Google Scholar] [CrossRef] [PubMed]
- Apetrei, C.; Apetrei, I.M.; De Saja, J.A.; Rodriguez-Mendez, M.L. Carbon paste electrodes made from different carbonaceous materials: Application in the study of antioxidants. Sensors 2011, 11, 1328–1344. [Google Scholar] [CrossRef]
- Giacomelli, C.; Ckless, K.; Galato, D.; Miranda, F.D.S.; Spinelli, A. Electrochemistry of Caffeic Acid Aqueous Solutions with pH 2.0 to 8.5. J. Braz. Chem. Soc. 2002, 13, 332–338. [Google Scholar] [CrossRef]
- Manikandan, V.S.; Sidhureddy, B.; Thiruppathi, A.R.; Chen, A. Sensitive Electrochemical Detection of Caffeic Acid in Wine Based on Fluorine-Doped Graphene Oxide. Sensors 2019, 19, 1604. [Google Scholar] [CrossRef]
- Le, A.V.; Su, Y.-L.; Cheng, S.-H. A novel electrochemical assay for aspartame determination via nucleophilic reactions with caffeic acid ortho-quinone. Electrochim. Acta 2019, 300, 67–76. [Google Scholar] [CrossRef]
- Beiginejad, H.; Rafiee, Z.; Moradi, M. Electrochemical oxidation of caffeic acid in the presence of 1,4-benzenediboronic acid: CEC mechanism and glucose effect on the complex formation. J. Iran Chem. Soc. 2020, 17, 935–942. [Google Scholar] [CrossRef]
- Huang, J.; Liu, Y.; You, T. Carbon nanofiber based electrochemical biosensors: A review. Anal. Methods 2010, 2, 202–211. [Google Scholar] [CrossRef]
- Bezzon, V.D.; Montanheiro, T.L.D.A.; De Menezes, B.R.C.; Ribas, R.G.; Righetti, V.A.N.; Rodrigues, K.F.; Thim, G.P. Carbon Nanostructure-based Sensors: A Brief Review on Recent Advances. Adv. Mater. Sci. Eng. 2019, 2019, 4293073. [Google Scholar] [CrossRef]
- Trabelsi, S.; Tahar, N.; Abdelhedi, R. Electrochemical behavior of caffeic acid. Electrochim. Acta 2004, 9–10, 1647–1654. [Google Scholar] [CrossRef]
- Norkus, E.; Vaškelis, A.; Stalnionienė, I. Caffeic acid modified glassy carbon electrode for electrocatalytic oxidation of reduced nicotinamide adenine dinucleotide (NADH). J. Solid State Electrochem. 2000, 4, 87–94. [Google Scholar] [CrossRef]
- Li, J.; Jiang, J.; Liu, M.; Xu, Z.; Deng, P.; Qian, D.; Tong, C.; Xie, H.; Yang, C. Facile synthesis of MnO2-embedded flower-like hierarchical porous carbon microspheres as an enhanced electrocatalyst for sensitive detection of caffeic acid. Anal. Chim. Acta 2017, 985, 155–165. [Google Scholar] [CrossRef] [PubMed]
- Bridge, M.H.; Williams, E.; Lyons, M.E.G.; Tipton, K.F.; Linert, W. Electrochemical investigation into the redox activity of Fe(II)/Fe(III) in the presence of nicotine and possible relations to neurodegenerative diseases. Biochim. Et Biophys. Acta (BBA) Mol. Basis Dis. 2004, 1690, 77–84. [Google Scholar] [CrossRef]
- Şengül, Ü. Comparing determination methods of detection and quantification limits for aflatoxin analysis in hazelnut. J. Food Drug Anal. 2016, 24, 56–62. [Google Scholar] [CrossRef]
- Matlock-Colangelo, L.; Baeumner, A.J. Recent progress in the design of nanofiber-based biosensing devices. Lab Chip 2012, 12, 2612–2620. [Google Scholar] [CrossRef]


© 2020 by the authors. Licensee MDPI, Basel, Switzerland. This article is an open access article distributed under the terms and conditions of the Creative Commons Attribution (CC BY) license (http://creativecommons.org/licenses/by/4.0/).