Article

Synthesis of a 5-Carboxy Indole-Based Spiropyran Fluorophore: Thermal, Electrochemical, Photophysical and Bovine Serum Albumin Interaction Investigations

by
Rodrigo da Costa Duarte
1,
Fabiano da Silveira Santos
1,
Bruno Bercini de Araújo
2,
Rodrigo Cercena
1,
Daniela Brondani
3,
Eduardo Zapp
3,
Paulo Fernando Bruno Gonçalves
2,
Fabiano Severo Rodembusch
2,* and
Alexandre Gonçalves Dal-Bó
1,*
1
Programa de Pós-Graduação em Ciência e Engenharia de Materiais–PPGCEM, Universidade do Extremo Sul Catarinense (UNESC), Criciúma CEP 88806-000, Brazil
2
Instituto de Química, Universidade Federal do Rio Grande do Sul (UFRGS), Porto Alegre CEP 91501-970, Brazil
3
Departamento de Ciências Exatas e Educação (CEE), Universidade Federal de Santa Catarina (UFSC), Blumenau 89036-004, Brazil
*
Authors to whom correspondence should be addressed.
Chemosensors 2020, 8(2), 31; https://doi.org/10.3390/chemosensors8020031
Submission received: 3 April 2020 / Revised: 26 April 2020 / Accepted: 27 April 2020 / Published: 3 May 2020
(This article belongs to the Special Issue Chromogenic and Fluorogenic Chemosensors)

Abstract

:
In this study, we synthesized a spiropyran containing an electron-withdrawing carboxyl group in good yield by condensation of an aromatic aldehyde with enamine indole. The spiropyran absorbed at the ultraviolet region with a maximum at approximately 300 nm, demonstrating slight solvatochromism (~3 nm). A fluorescent emission around 360 nm was observed with a higher solvatochromic effect (~12 nm), indicating higher electronic delocalization in the excited state. The photoreversibility of the open and closed forms of spiropyran excited at 300 nm and 365 nm was not observed, indicating that the absence of the nitro group plays a fundamental role in this equilibrium. Theoretical calculations were also applied for better understanding the photophysics of these compounds. Electrochemical characterization revealed the values of the HOMO and LUMO energy levels at −1.89 eV (electron affinity) and −5.61 eV (ionization potential), respectively. Thermogravimetric analysis showed excellent thermal stability of the spiropyran, with 5% weight loss at approximately 250 °C. Finally, the photophysical features were used to explore the interaction of spiropyran with bovine serum albumin in a phosphate buffer solution, where a significant suppression mechanism was observed.

Graphical Abstract

1. Introduction

Spiropyrans are a class of organic molecules widely studied for their photochromic properties [1,2]. Their relatively easy structural modification allows for control of their photodynamic characteristics in different media [3,4,5,6,7]. The considerable difference in the physicochemical properties of spiropyrans between the initial and the photoinduced form is also of interest [8,9,10,11,12]. These molecules may undergo heterolytic C–O bond cleavage in the spiro form, resulting in an open zwitterionic form, merocyanine (Scheme 1) [13].
The orthogonal spiro form does not absorb visible light, and it is converted to the planar and colored merocyanine form by excitation under ultraviolet light. The structural transformation of spiropyran to merocyanine is accompanied by increased polarity, and the initial form is regenerated by absorption in the visual or thermal region [14,15,16,17]. These molecules demonstrate various phenomena, such as photochromism [18,19], solvatochromism [20,21], thermochromism [22], hydrochromism [23], and acidochromism [24], when stimulated by light, solvents, heat, water, and acid/base, respectively [25]. In addition, spiropyran compounds may exhibit solvatochromism at different solvent polarities. The highly polar form of merocyanine can lead to hypsochromic or bathochromic changes depending on the solvent polarity. Thus, spiropyrans can be used as indicators of solvent polarity owing to their negative solvatochromism [26,27]. Reversible transformation of spiropyrans has been widely used in many areas, including fluorescence modulation of nanoparticles [28,29], amino acid recognition and quantification [30], optical devices [31], proton transfer induction [32], photosensitive biomaterials [33], and pH and ion sensors [24,34]. The interaction between the spiropyran and the merocyanine form is viable because of the oxygen atom. However, the additional binding site leads to the much more stable merocyanine form and aids in the detection of metal ions. Thus, spiropyran and its derivatives have been utilized for the quantitative and qualitative detection of various metal ions [7,35,36].
Herein, we present the synthesis of a spiropyran derivative, its thermal, electrochemical, and photophysical characterization, and its application as a fluorescent probe to detect proteins in a phosphate buffer solution (PBS) using bovine serum albumin (BSA) as a protein model.

2. Materials and Methods

The compounds p-Aminobenzoic acid, salicylaldehyde, 3-methyl-2-butanone, ammonium acetate, and SnCl2·2H2O were purchased from Sigma-Aldrich. NaNO2, HCl, MeOH, and CH3COOH were acquired from Synth. The reagents and solvents were used as received or purified according to the literature using standard procedures [37]. The chemical reactions were monitored by thin layer chromatography using Silica Gel 60 F254 plates. Purification of the compounds was perfomed by column chromatography using 70–230 mesh Silica Gel 60 Å. Infrared spectra (4000 to 750 cm−1) were acquired using NaCl disk in a Shimadzu-IR PRESTIGE-21 spectrometer with 4.0 resolution and 20 scans. 1H and 13C NMR spectra were obtained with a Bruker Scientific operating at 400 MHz (1H) or 100 MHz (13C) using deuterated chloroform (CDCl3). The chemical shifts (δ) were measured in ppm, and the coupling constants (J) in Hz. 1H NMR spectra were presented regarding their multiplicities (s, singlet; d, doublet; m, multiplet), integrals and coupling constants.
The compound 1′,3′-Dihydro-1′,3′,3′-trimethylspiro[2H-1-benzopyran-2,2′-(2H)-indole]-5′- carboxylic acid, so-called Spiropyran 7 was synthesized by the addition of 5-carboxy-1,2,3,3-tetramethyl- 3H-indol-1-ium iodide 5 (172 mg, 0.49 mmol) in 20 mL of methanol, followed by the addition of CH3COONH4 (77 mg, 1.0 mmol). This mixture was stirred for 5 min at 25 °C. Then compound 6 (61 mg, 0.5 mmol) was added to the reaction mixture under stirring and reflux for 24 h. After the solvent was evaporated under vacuum, the solid was purified by precipitation and washed with hexane (6 × 50 mL).
1′,3′-Dihydro-1′,3′,3′-trimethylspiro[2H-1-benzopyran-2,2′-(2H)-indole]-5′-carboxylic acid. Brown solid, yield 51%, melting point: 256–259 °C. FTIR (NaCl) νmax (cm−1): 2967, 2807, 1660, 1609, 1297, 1246. 1H NMR (CDCl3, 400 MHz): δ (ppm) 8.06 (d, 1H, J = 8 Hz); 7.83 (s, 1H); 7.12 (m, 2H); 6.92 (d, 1H, J=10.27 Hz); 6.88 (m, 1H); 6.74 (d, 1H, J=8.31 Hz); 6.56 (d, 1H, J = 8.31 Hz); 5.70 (d, 1H, J = 10.27 Hz); 2.85 (s, 3H); 1.38 (s, 3H); 1.21 (s, 3H). 13C NMR (CDCl3, 100 MHz) δ (ppm) 172.4; 154.0; 152.8; 136.8; 132.5; 129.9; 129.8; 126.8; 123.8; 120.4; 119.6; 118.5; 118.4; 115.0; 105.8; 104.1; 51.3; 28.7; 25.8; 20.1.
UV-Vis absorption spectra in solution (10−5 M) were obtained with a Shimadzu UV-2450 spectrophotometer. Steady-state fluorescence emission spectra were acquired using a Shimadzu RF-5301PC spectrofluorometer. The maximum absorption was used as the excitation wavelength for emission spectra. Slits of 5.0 nm/5.0 nm were used for emission/excitation, respectively. The quantum yield of fluorescence was measured at 25 °C using quinine sulfate (1 N H2SO4) as the quantum yield standard [38] at the optical dilute regime (absorbance lower than 0.1).
Photoisomerization experiments were conducted in solution using acetonitrile as the solvent (~10−5 M). The absorption spectra were acquired in two different ways: (i) one spectrum every 2 min for 50 min and (ii) one after 5 min of irradiation at 300 nm and 365 nm on a Hewlett-Packard 8452A diode array spectrophotometer-registered using a homemade LabView® interface. An Hg/Xe 200-W lamp from ThermoOriel was assembled perpendicularly to the spectrophotometer to induce photoisomerization.
Cyclic voltammetry (CV) was performed on a PalmSens3 potentiostat/galvanostat, using a solution of tetra-N-butylammonium hexafluorophosphate (TBAPF6) in CH2Cl2 (0.1 M) as the supporting electrolyte. A three-electrode cell was used, comprised of a glassy carbon electrode as the working electrode, a platinum wire as the counter electrode, and an Ag/Ag+ reference electrode. The cell was deoxygenated by purging with argon before each measurement. Ferrocene/ferricenium (Fc/Fc+) redox couple was used as internal reference.
Thermogravimetric analysis (TGA) and differential scanning calorimetry (DSC) were also used to better characterize the thermal behavior of the synthesized compound. DSC was carried out on a DSC Sirius from Netzsch under nitrogen atmosphere at a heating rate of 10 °C·min−1. The melting point (Tm) and glass transition temperature (Tg) were taken from the first and second heating curves, respectively. TGA was carried out on a Shimadzu TG-50 analyzer under nitrogen atmosphere at a heating rate of 10 °C·min−1 (25 °C–1000 °C). The mass of the samples was between 3 and 7 mg.
The ionization constant (pKa) was obtained according to the literature [39]. The proton concentration was measured with a Digimed DM-22 pH-meter with flow-through glass-silver chloride electrodes filled with a saturated solution of potassium chloride. The titrations in solution were performed with a constant ionic strength (µ = 0.1) by the addition of 0.15 M KCl [40]. UV-Vis spectra were performed in an EtOH/H2O solution (1:1 v/v) at different pH using a Shimadzu UV-2450 spectrophotometer [41,42]. In the data treatment, the sum of squared residuals of absorbance intensity values as a function of wavelength under different pH conditions was minimized with a Boltzmann sigmoidal regression function. The pH vs. absorbance data were adjusted with good correlation coefficients. The inflection point indicated the equivalence of pH to pKa according to the Henderson–Hasselbach equation [43].
The bovine serum albumin (BSA) suppression study was performed by keeping the protein concentration constant (7.33 × 10⁻⁶ M in PBS buffer, pH 7.2) during addition of previously prepared spiropyran solutions in dimethylformamide (0–20.5 μM). The final solution was left to rest for 1 h. The fluorescence spectra were obtained under excitation at 279 nm at 25 °C, using emission/excitation slits of 5.0 nm/5.0 nm, respectively. The bovine serum albumin (BSA) association study was performed by keeping the spiropyran concentration constant (1.86 μM in dimethylformamide) during the addition of a previously prepared BSA solutions in PBS buffer (0–8.0 μM, pH 7.2). The final solution was left to rest for 1 h. The fluorescence spectra were obtained under excitation at 298 nm at 25 °C, using emission/excitation slits of 5.0 nm/5.0 nm, respectively.
The theoretical calculations were carried out with density functional theory (DFT) and time dependent density functional theory (TD-DFT) implemented in Gaussian 16 package [44]. The equilibrium geometries in ground and excited states, characterized by the absence of imaginary frequencies, were obtained at PBE1PBE/cc-pVDZ level of theory. The vertical excitation energies were computed for the first ten excited states at PBE1PBE/jun-cc-pVTZ level of theory. PBE1PBE [45] functional was chosen because of the good agreement between the theoretical and experimental results. The jun-cc-pVTZ basis set was chosen for the necessity of diffuse functions to describe the excited states [46]. To simulate the solvent effects, a polarizable continuum model (PCM) was used [47]. To evaluate charge transfer character in spiropyran, Multiwfn package was employed to analyze the increment and depletion zones of electronic densities [48,49]. All the geometries, orbitals, and increment and depletion regions images were rendered with ChemCraft [50].

3. Results and Discussion

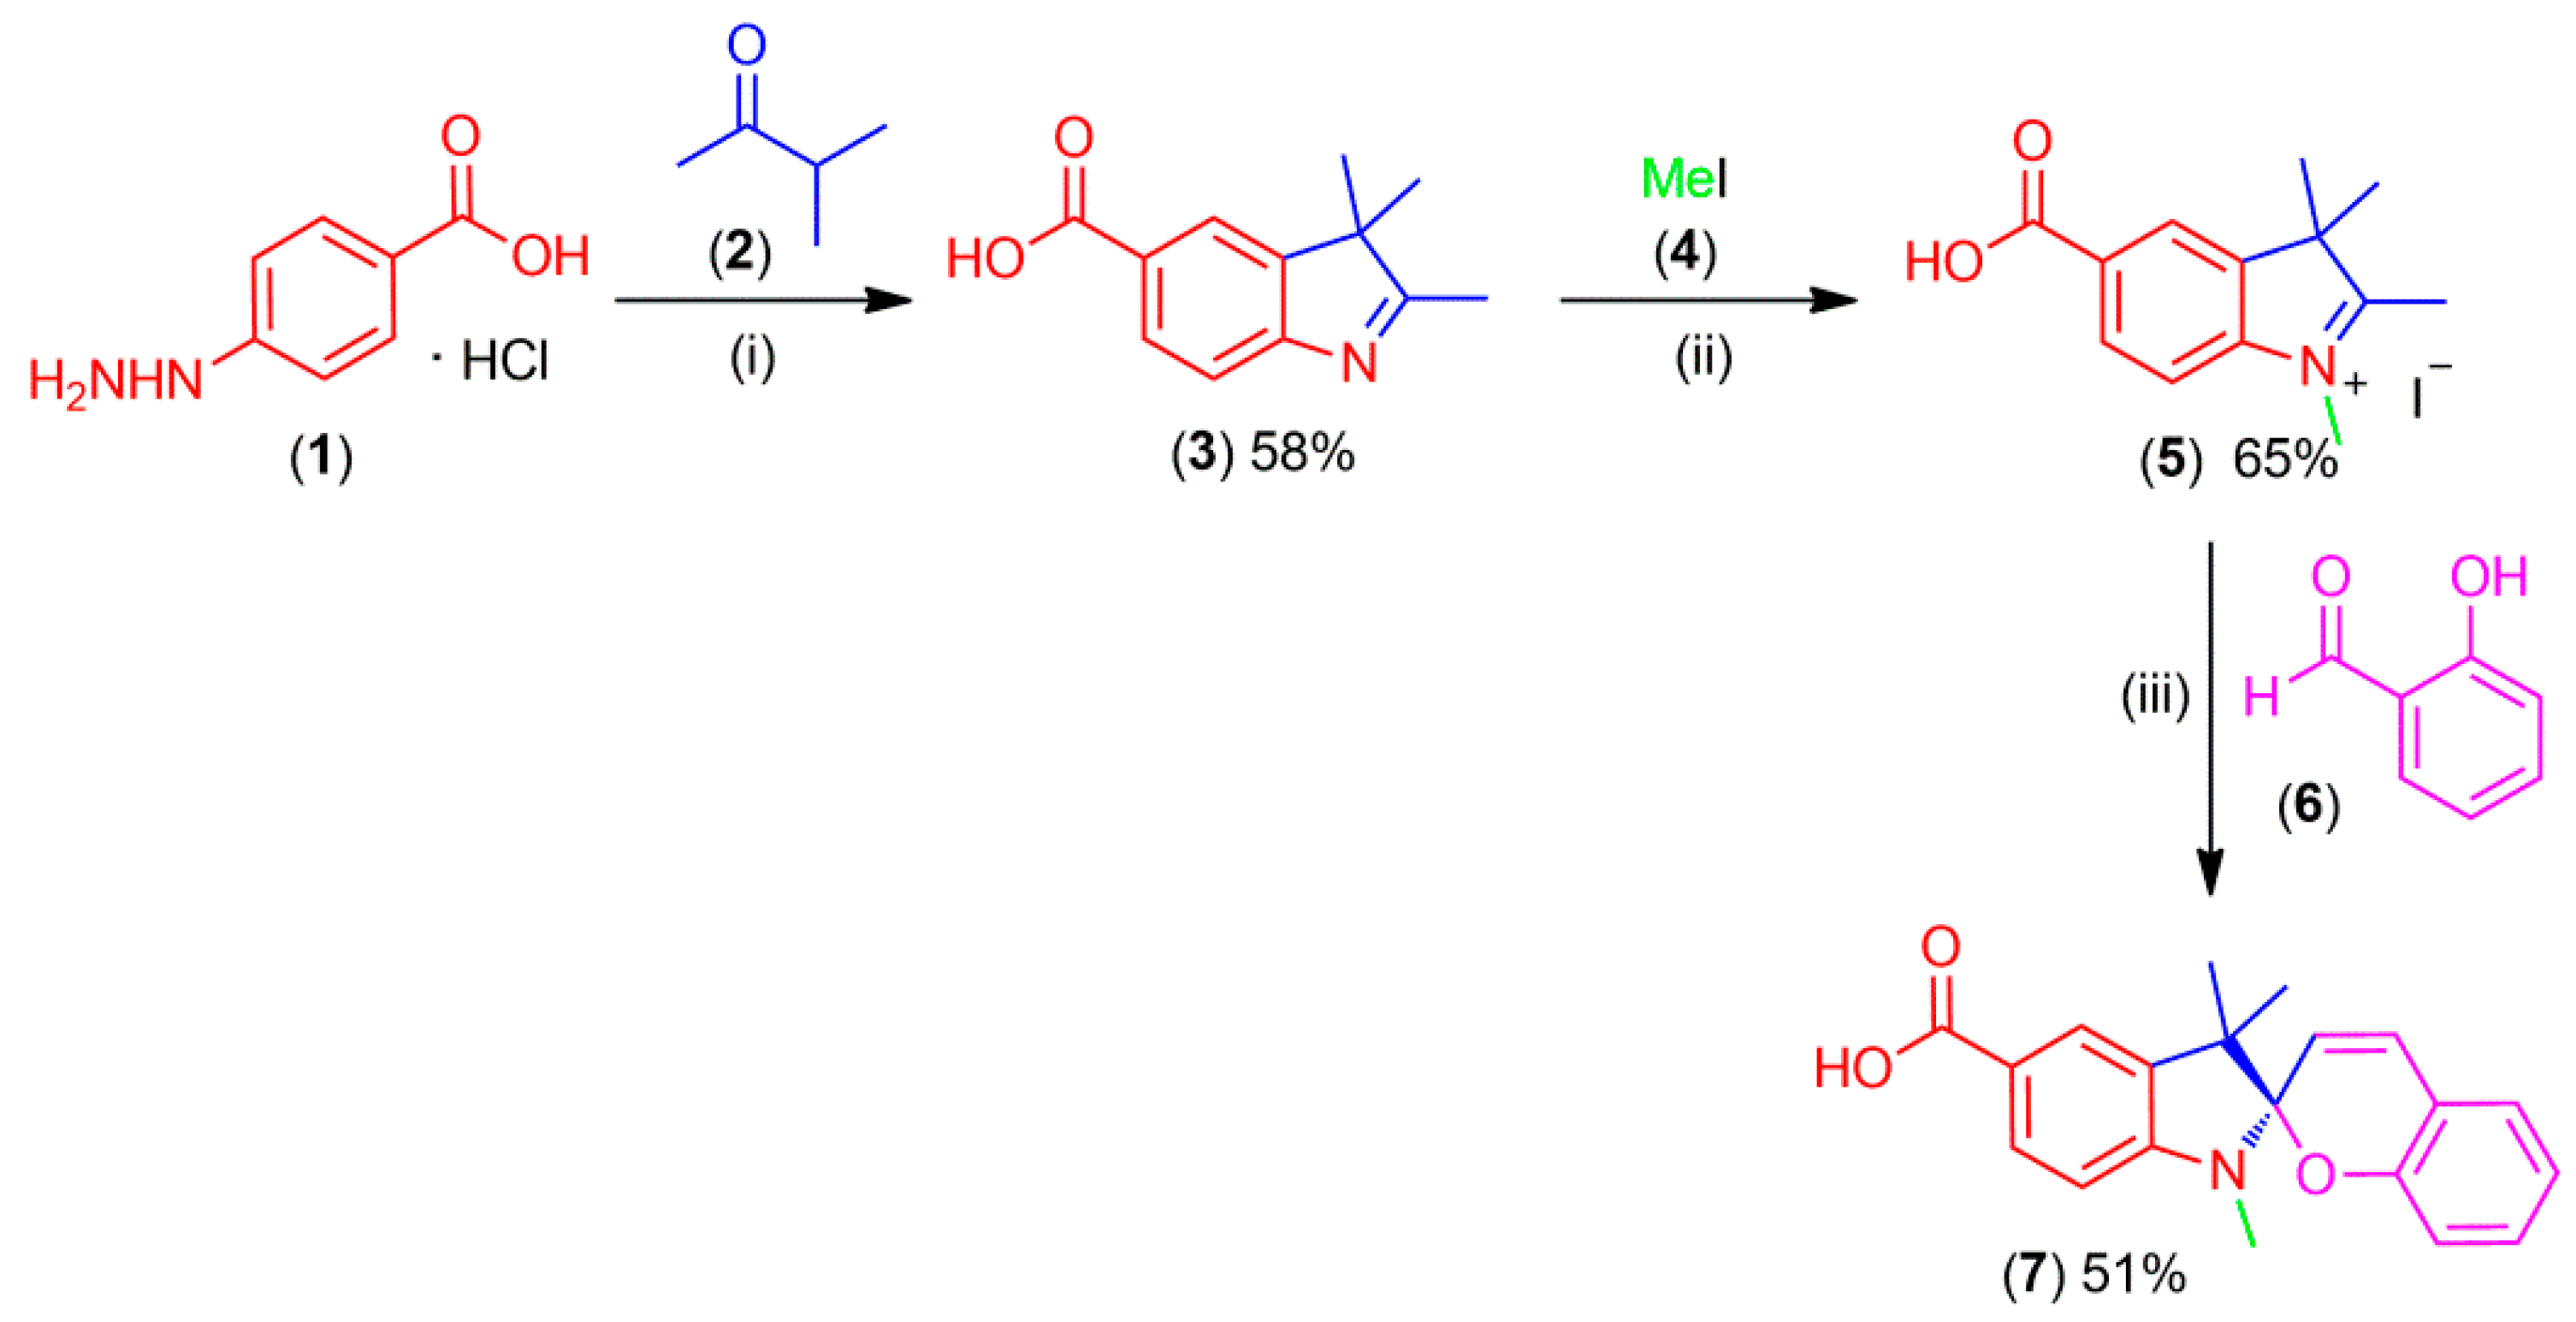
3.1. Synthesis of Spiropyran

The heterocycle compound 3 was prepared according to the literature (Scheme 2) [36]. Initially, 4-hydrazinobenzoic acid 1 reacted with 3-methylbutan-2-one 2 under reflux to obtain the intermediate compound 2,3,3-trimethyl-3H-indole-5-carboxylic acid 3 by Fischer cyclization [51]. Then, 3 was alkylated with iodomethane 4 in a nitrogen atmosphere to obtain compound 5 [52]. The spectroscopic characterization of compounds 3 and 5, as well as their synthetic details are presented as supplementary material. The desired spiropyran 7 was synthesized by the reaction of the previously prepared compound 5 with salicylaldehyde 6 under reflux in the presence of ammonium acetate and bases, as required for the Knoevenagel condensation [1]. Spectroscopic characterization indicated that the synthesized spiropyran 7 had a closed structure. The original spectra can be found in the supplementary material (Figures S1–S7). The 1H NMR spectra indicated the typical signals located at 5.70 (doublet, 1H) and 6.92 (doublet, 1H) with a coupling constant of 10.27 Hz, related to the cis conformation, for both vinyl hydrogen atoms. In addition, the O–H stretch in the Fourier-transform infrared (FTIR) spectra appeared as a very broad band at 3300–2500 cm−1, centered at about 3000 cm−1, indicating that compound 7 was present in its acidic form. Furthermore, the UV-Vis spectra exhibited absorption at 300 nm in acidic pH, which corroborated the acidic form indications of the FTIR spectra.

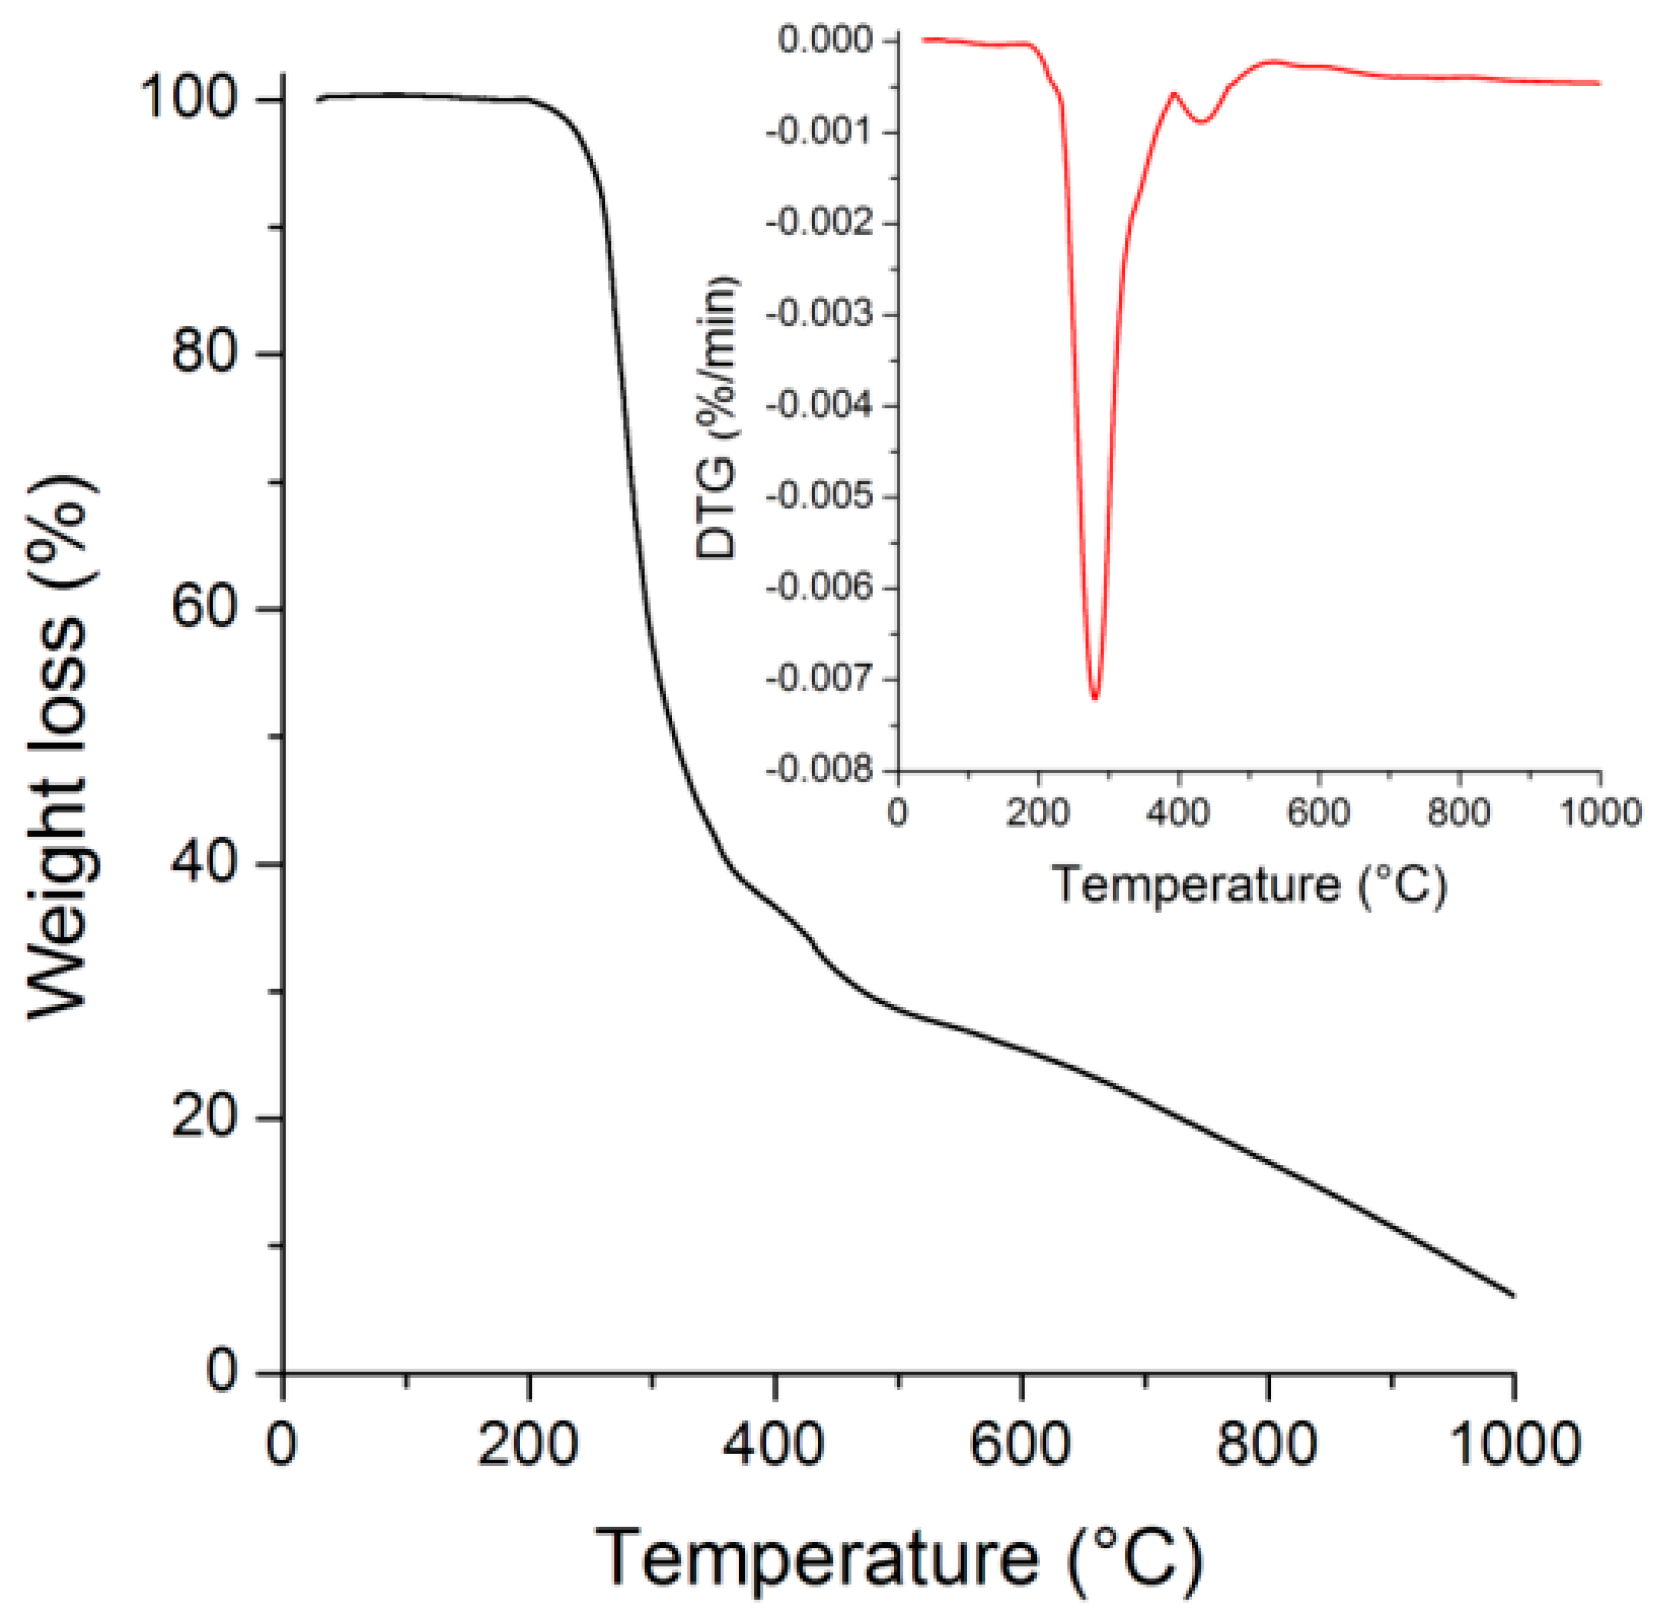
3.2. Electrochemical and Thermal Characterization
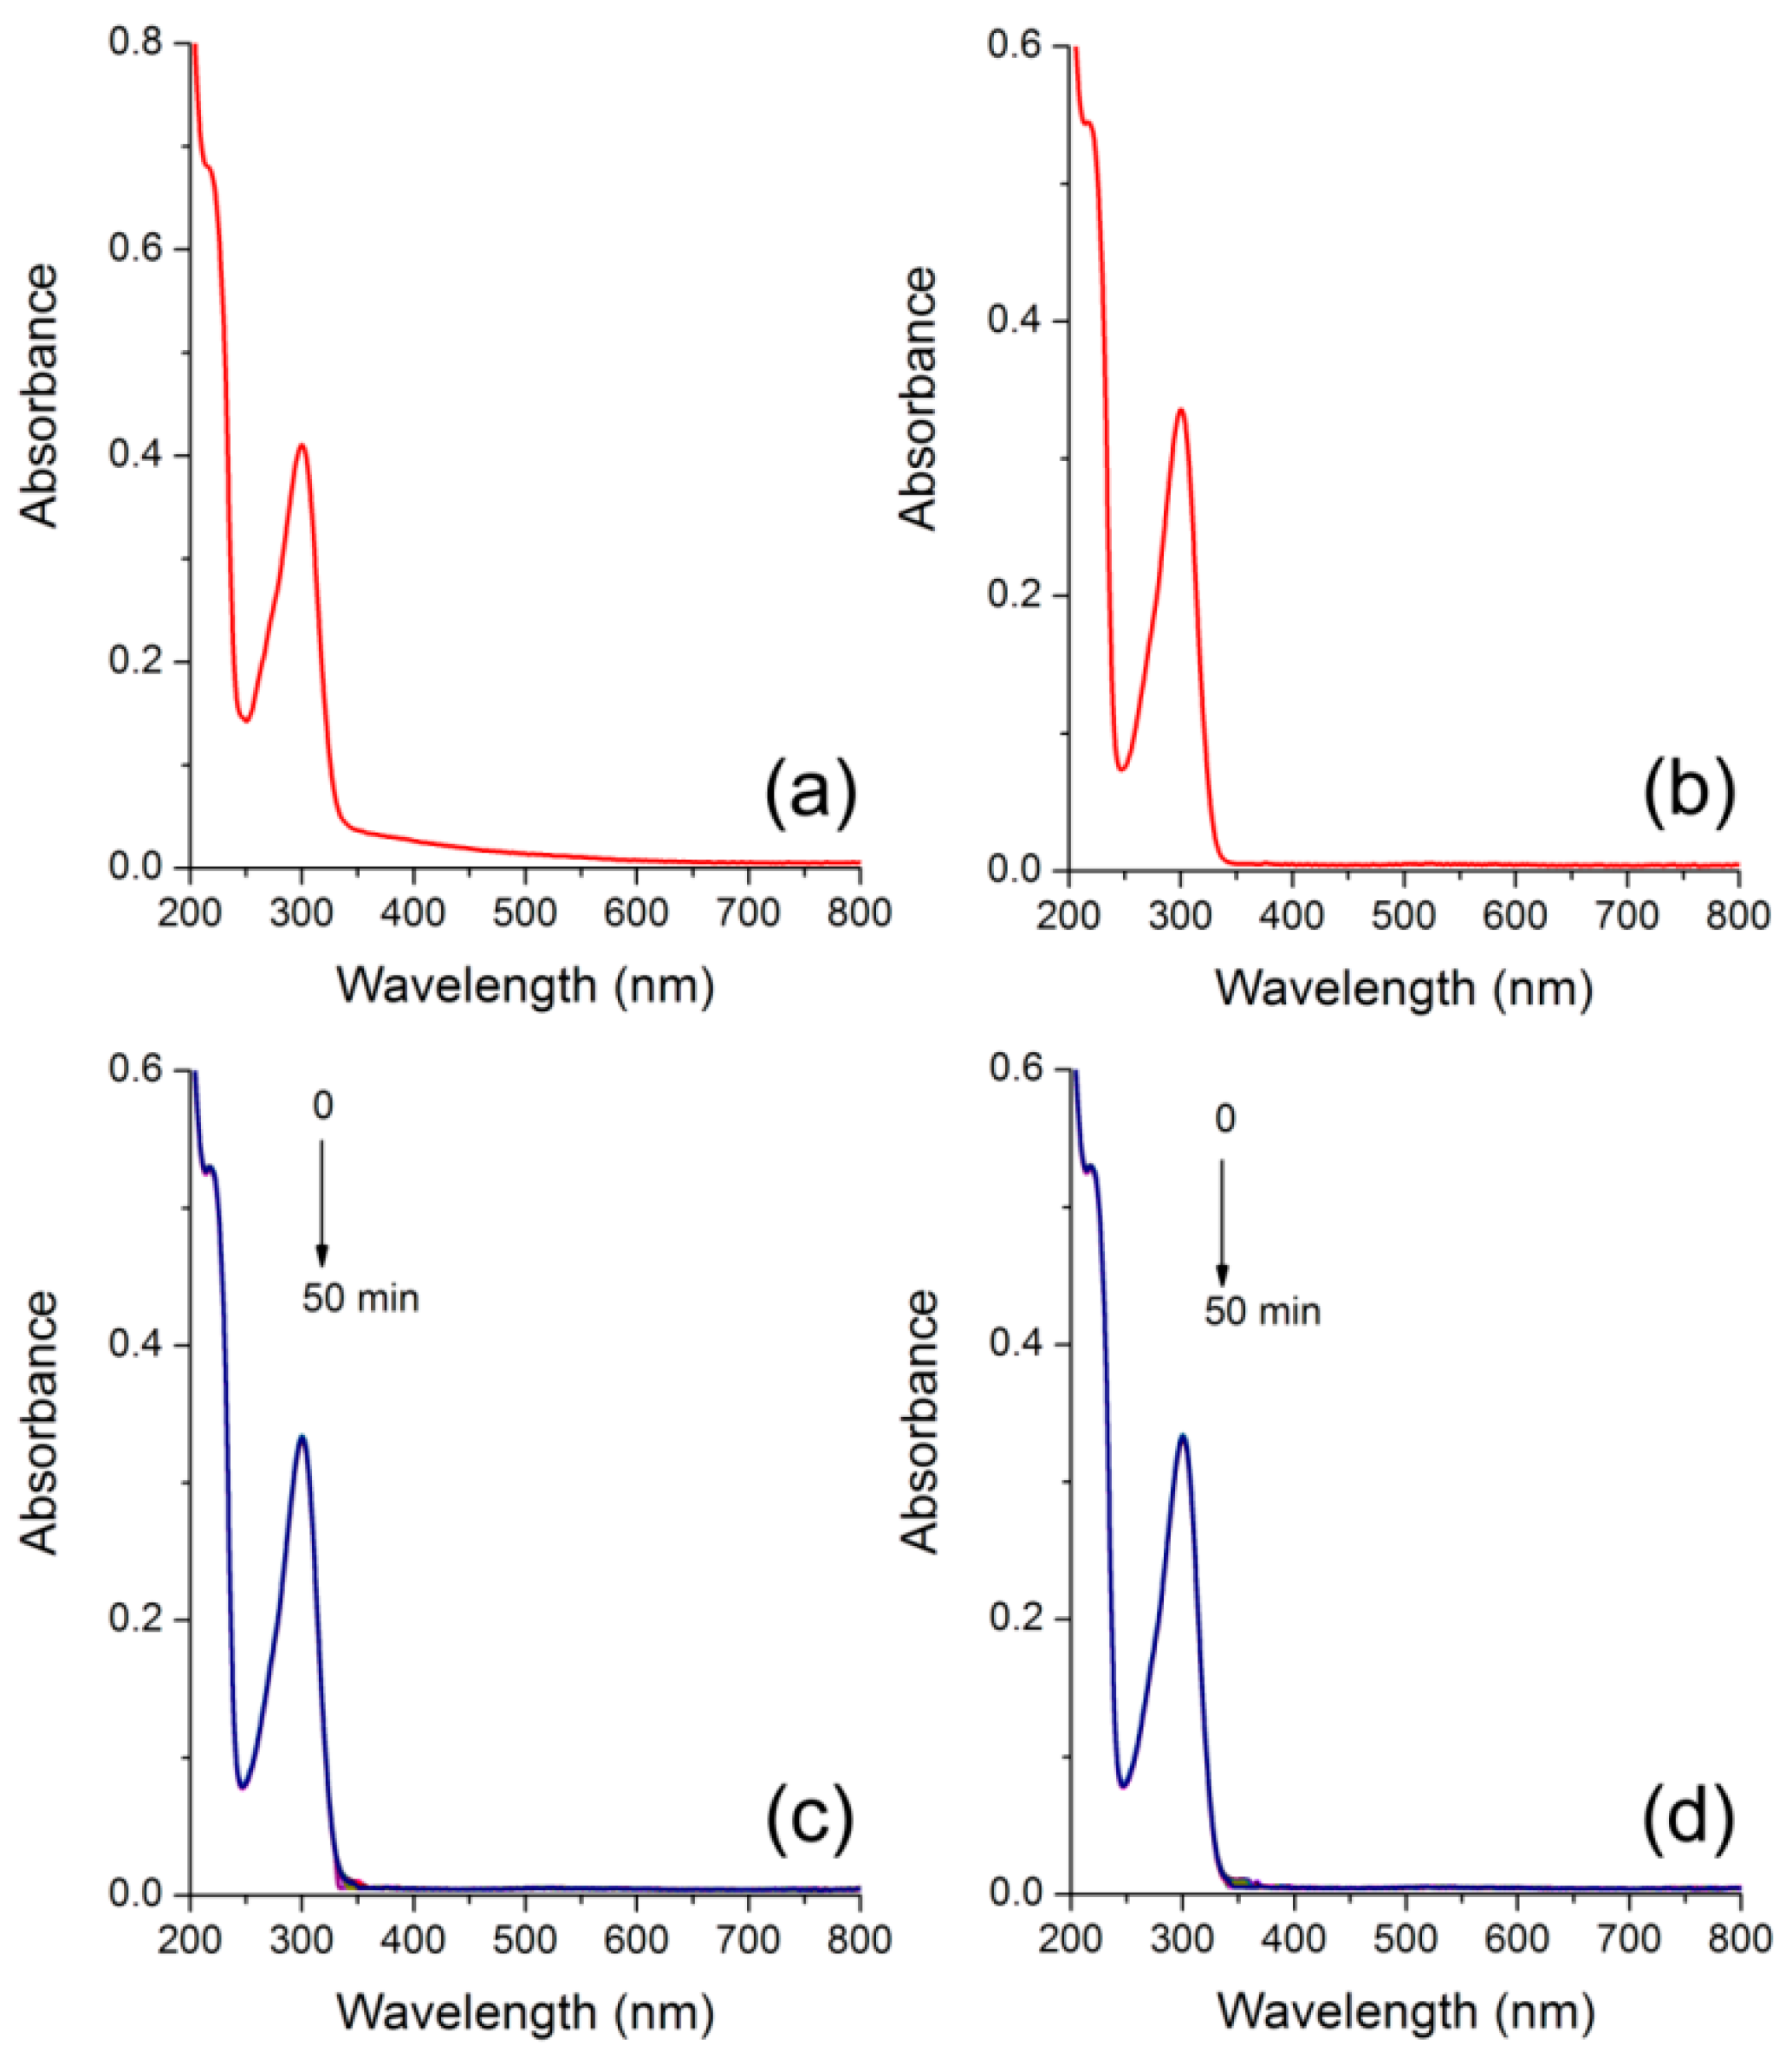
The electrochemical behavior of spiropyran molecules was investigated by CV (Figure 1). In the positive scan, the CV showed an irreversible anodic trajectory because the oxidation of the indoline moiety resulted in the formation of a radical cation [2]. The oxidation peak appeared at higher potential values (Epa) than those of nitrospiropyran derivates reported by Armendáriz–Vidales [53], demonstrating its dependence on the substituent. Substitution by a carboxylic group in para-position, unlike the results obtained by Ivashenko [54], did not show a coupling block that would prevent dimerization; therefore, we did not observe a reversible process for compound oxidation in CV [2]. As suggested by Ivashenko [54], the oxidation of the indoline nitrogen at ca. 0.91 V (Eonset vs. Ag/Ag+) caused subsequent fast chemical reactions because the oxidized spiropyran radical cation dimerized quickly by aryl C−C coupling (irreversible process). The CV curves did not exhibit a well-defined electrochemical reduction of the naphthospiropyran. However, a cathodic signal of molecule reduction could be observed at the potential (Eonset) of −1.82 V vs. Ag/Ag +.
The HOMO and LUMO energy levels of π-extended conjugated molecules, like spiropyrans, are determined by the electron affinity (EA) and ionization potential (IP) of the molecules, which could be correlated with electrochemical processes accessed by CV. In order to calculate the absolute energies, the redox data were standardized with a Fc/Fc+ couple, and the standard reduction potential of the couple was found at 0.25 V vs. Ag/Ag+. The optical band gap of spiropyran was determined from the absorption edge of its solutions. The IP value was calculated using the empirical equation IP = −( E o x i o n s e t + 4.44) eV, where E o x i o n s e t   represents the oxidation onset potential, which was 0.91 V vs. Ag/Ag+ for the spiropyran, and therefore a potential of 1.17 V vs. the normal hydrogen electrode (NHE). Thus, the calculated IP was equal to −5.61 eV. The EA value was obtained by subtracting the IP energy from the optical band gap, which was on the low energetic edge of the absorption spectrum ( E g a p o p t = 3.72 eV). Therefore, the calculated EA was −1.89 eV. These electrochemical and electronic data are summarized in Table 1.
The thermal behavior of the material was investigated using TGA and DSC. The decomposition temperature (Td) of the spiropyran 7 (corresponding to 5% weight loss) was 249 °C (Figure 2).
During initial heating up to 240 °C, the compound showed endothermic peaks that corresponded to melting at approximately 242 °C (Figure S8). During cooling, the compound did not exhibit exothermic crystallization. The Tg of spiropyran was 56 °C, forming an amorphous solid at room temperature [55]. Previous studies of spiropyran derivates with different functional groups have found lower Tm, Tg, and Td values than those found by our research group, at 170–180 °C, 44–58 °C, and 180–200 °C, respectively [55]. Kristian et al. synthesized a series of novel spiropyran analogs with groups that possessed a C8, C12, and C16 tail. The Tm of the derivatives decreased linearly with the increasing chain length, to approximately 95 °C, 85 °C, and 65 °C for the C8, C12, and C16 tails, respectively. The Tm of our synthesized spiropyran was very high because of its rigid structure [56]. The results indicated that the spiropyran had a relatively high thermal stability; the relatively high Td is crucial for the use of emissive materials in optoelectronic applications [57].

3.3. Photophysics

The photophysical investigation of the ground and excited states in solution was performed in different organic solvents (10−5 M) with a wide range of dielectric constants; the relevant data are summarized in Table 2. Figure 3 shows the UV-Vis spectra of the synthesized spiropyran, where a sharp absorption peak at 250–350 nm can be observed with a maximum at approximately 300 nm. Moreover, we could hardly observe a solvatochromic effect (Δλabs = 3 nm). In addition, the molar absorptivity coefficient (e) obtained by UV-Vis spectroscopy was used to calculate the oscillator strength (fe) and the theoretical rate constant for emission (ke0) from the Strickler–Berg relations, presented in Equations (1) and (2), respectively [58]. Moreover, we can obtain the theoretical rate constant for emission (ke0) from Equation (2), and consequently, the pure radiative lifetime τ0, defined as 1/ke0 [59].
f e 4.3 × 10 9 ε d v ¯ ,
k e 0 2.88 × 10 9 v ¯ 0 2 ε d v ¯
The molar absorptivity coefficient (ε) (×104 M−1·cm−1), as well as the calculated radiative rate constants (ke0) (108 s−1), indicated fully spin- and symmetry-allowed electronic transitions, that could be related to 1ππ* transitions (Table 2). In addition, the oscillator strength (f) (~0.5) indicated highly probable electronic transitions. The comparable constant radiative lifetime τ0 also indicated that both absorptions populated the same excited state.
It is worth to mention that an observation of the full UV-Vis spectra (220–600 nm) did not indicate the presence of a merocyanine-like structure in these conditions (Figure S9) [1]. So, in order to study the photoisomerization ability of the synthesized compound, UV-Vis spectra were collected after continuous UV irradiation at 300 nm and 365 nm in two different ways: (i) one spectrum after 5 min of irradiation (Figure 4a,b), and (ii) one every 2 min for 50 min (Figure 4c,d). All spectra presented an absorption maximum at 300 nm, ascribed to the closed-form (lower conjugation), as already observed in similar spiropyran dyes [1,2]. However, and surprisingly, no additional redshifted absorption bands could be observed under any circumstances in this compound. The literature relates that under UV radiation, the spiro form, which is colorless presents a carbon-oxygen bond cleavage of the pyran ring, followed by cis-trans isomerization to reach the colored merocyanine (MC) form [60]. The MC form (open-form) is highly conjugated, presenting an absorption band in the visible region. In addition, it is reported in the literature that the open-form can be stabilized by the nitro group in the para position to the phenolic oxygen [61]. In this way, and based on the results presented in Figure 4, no evidence of an open form could be observed in this study, which may be related to the absence of the electron-withdrawing nitro group that cannot stabilize the generated phenolate as a weak base.
The fluorescence emission spectra were obtained by exciting the compound at the absorption maxima and the excitation spectra were obtained using the fluorescence emission maxima as observation wavelength (λexc). The respective spectra in different solvents are also presented in Figure 3, and the data are summarized in Table 2. The spiropyran showed a main fluorescence emission at approximately 360 nm with a Stokes shift of approximately 5600 cm−1. Based on the photoisomerization experiment, the emission was related to the closed form of this compound. The observed fluorescence maxima obtained from the excitation spectra could be related to this species, as well.

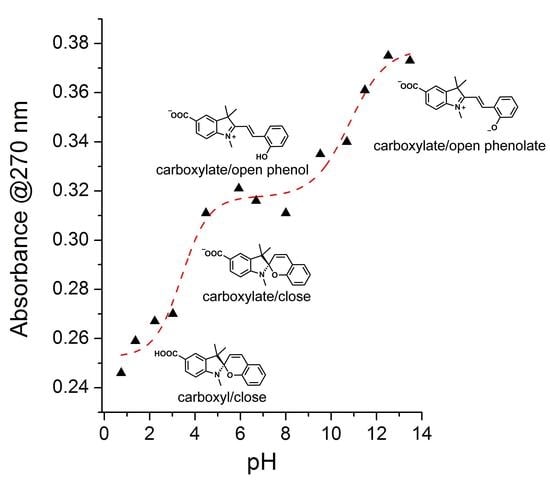
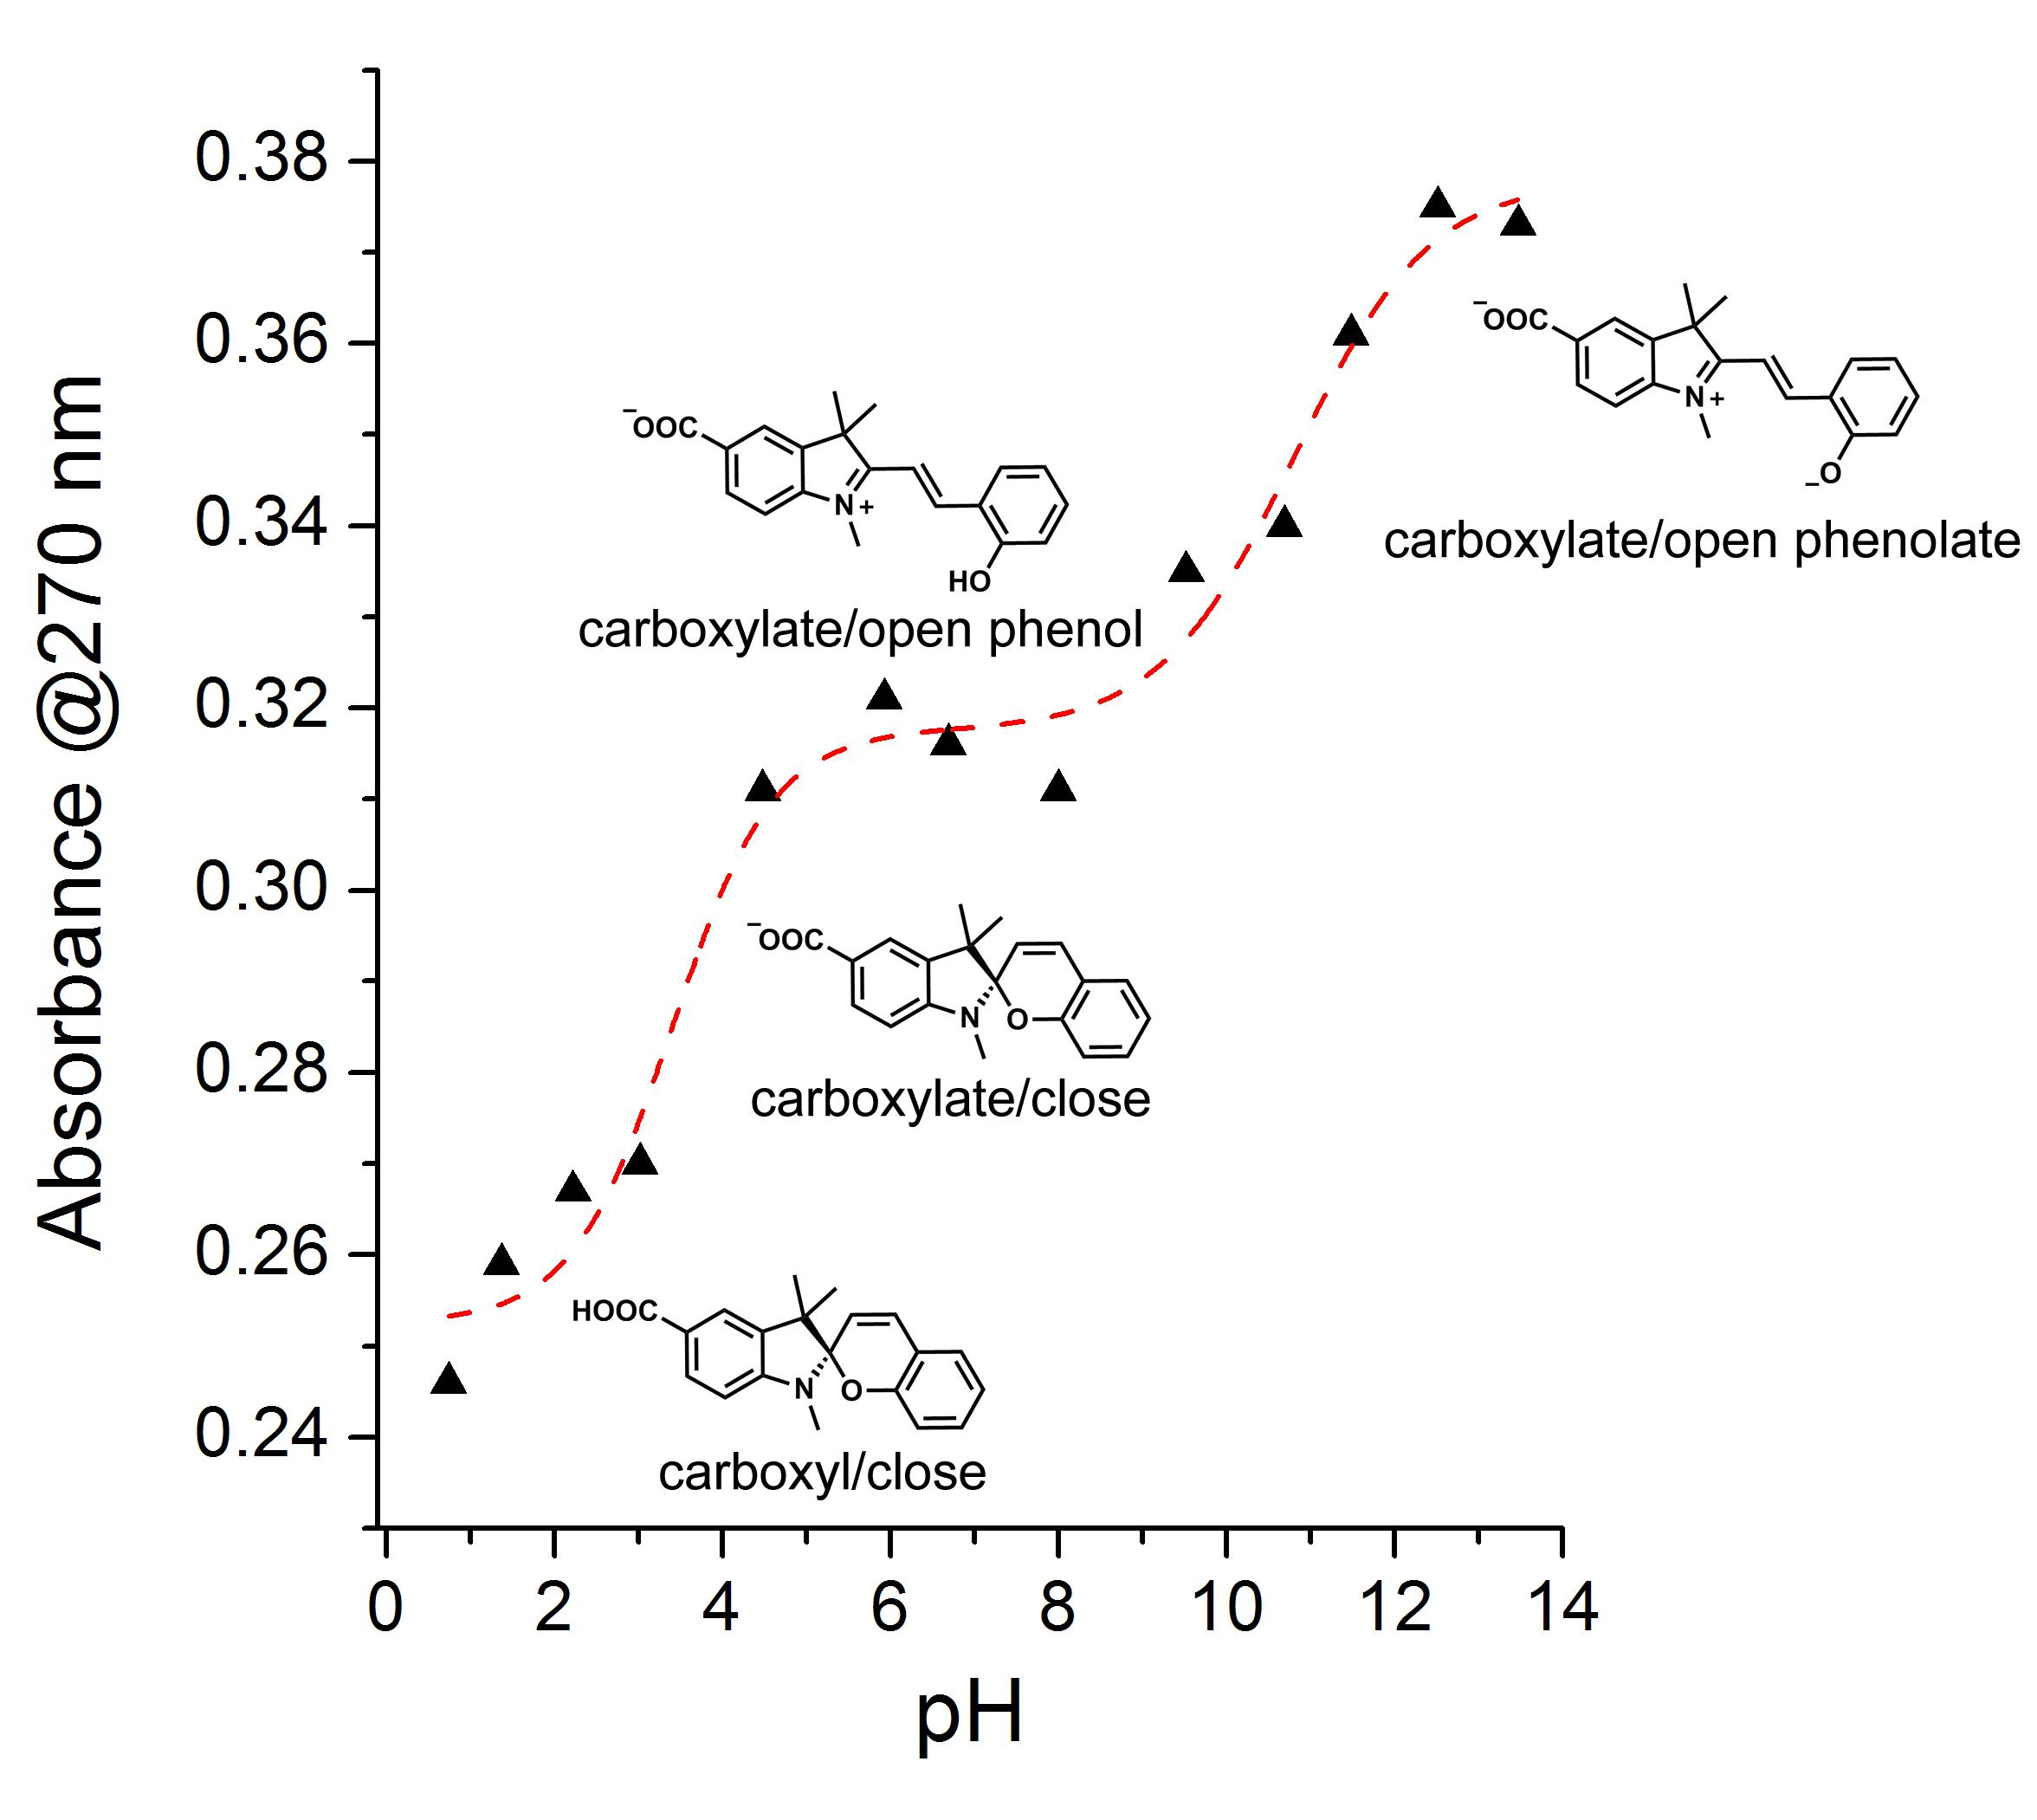
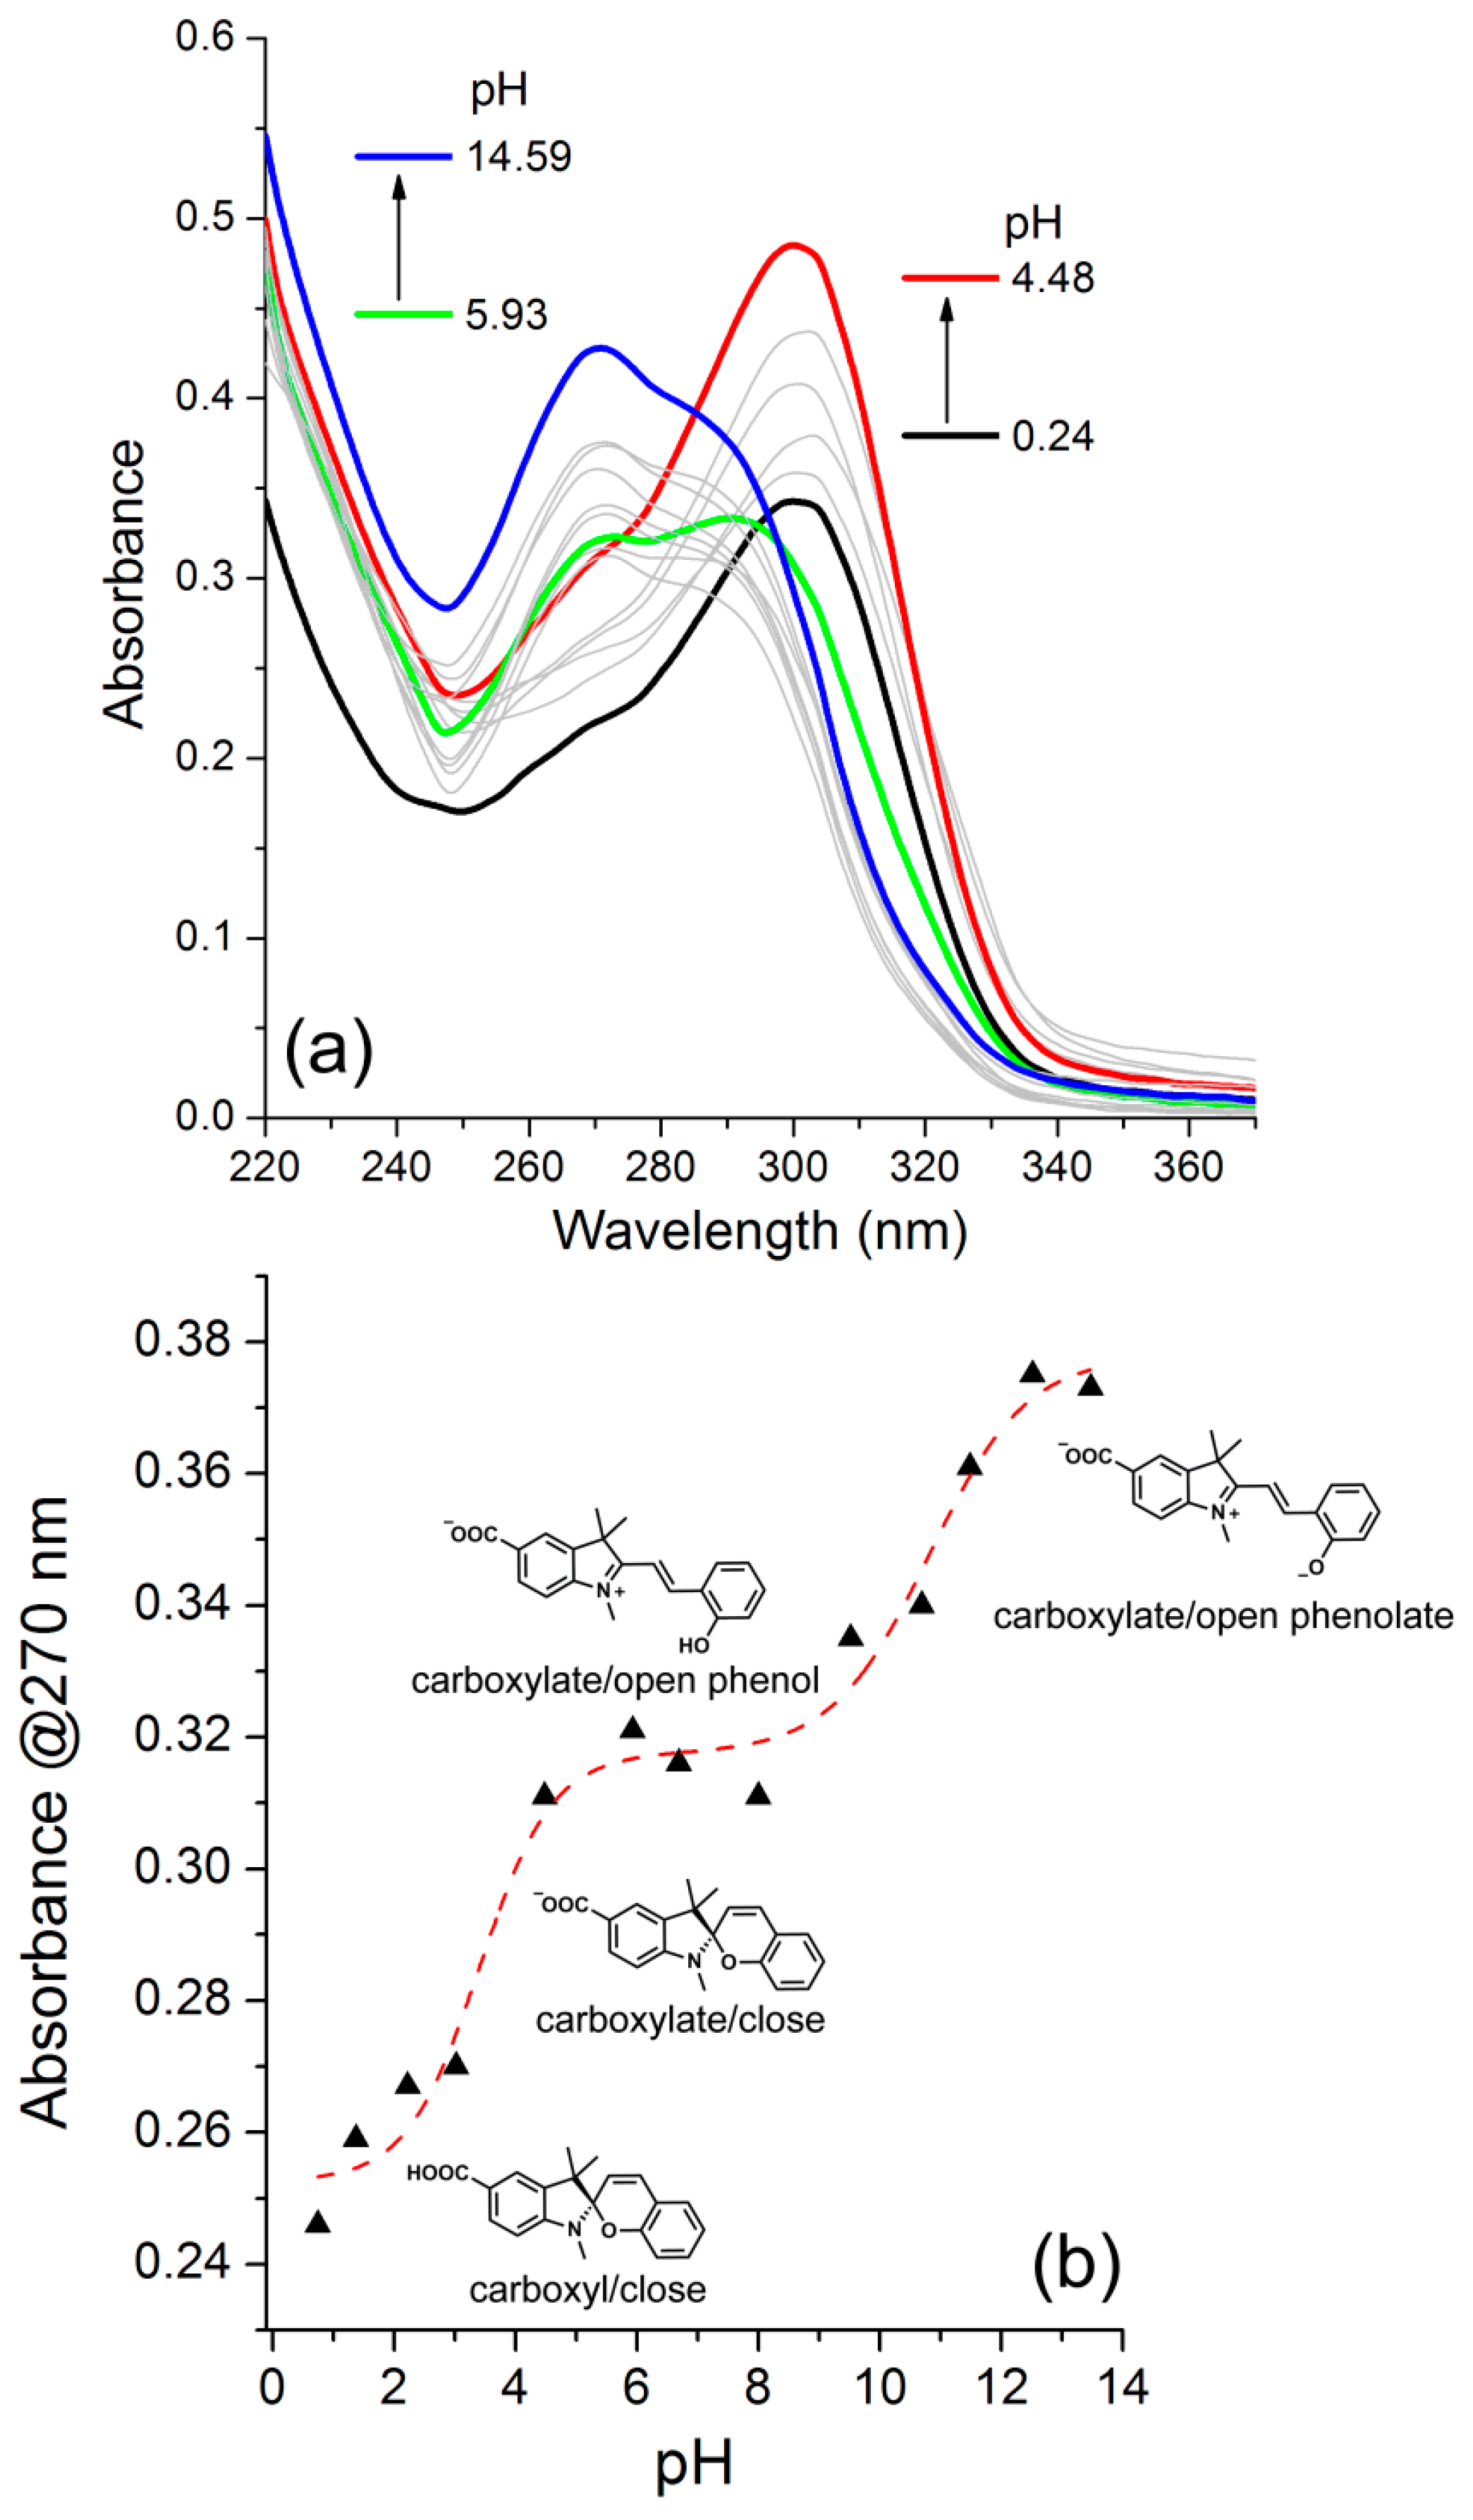
3.4. Ionization Constants

The determination of the ionization constants of the synthesized spiropyran plays a fundamental role in this investigation since the molecule contains an additional carboxyl moiety, which can influence its photochromic properties. In this sense, the pKa values were obtained in 1:1 EtOH/H2O solution (v/v) applying the Henderson–Hasselbach relation, presented in Equation (3):
p H = p K a + l o g ( A A a ) ( A b A )   ,
where Aa is the absorbance of the protonated specie, Ab is the absorbance of the neutral specie and A is the absorbance of both the protonated and neutral species in the solution [34,35]. Experimentally, it is performed by measuring the absorbance of anionic, neutral (using KOH) and protonated (using HCl) species at a specific absorption wavelength as a function of the pH [34,35]. In this procedure, the determination of the ionization constants depends on the direct determination of the ratio of molecular (neutral) to ionized (protonated) species in non-absorbing solutions, whose pH values are measured. In this way, to optimize the optical response, a specific wavelength was chosen, at which the greatest difference between the absorbances of the two species is observed. In addition, the acidic strength of the phenolic hydrogen in water in the electronic ground state (wpKa) was obtained by extrapolation [62,63,64,65].
Figure 5 presents the UV-Vis absorption spectra of the spiropyran in solution and the dependence on the absorbance intensity vs. pH. In this curve, the variation of the absorbance intensities is due to the presence of both neutral and deprotonated species at the relevant pH values. It can be observed that the absorptions in the UV region of the neutral, first, and second deprotonated species are located at 300 nm, 290 nm, and 270 nm, respectively. Therefore, the wavelength of 277 nm was the most suitable to determine its pKa. The results could be fitted using a sigmoidal curve, where the inflection points were determined at 3.40 and 10.81. According to Equation (3), the pH is equal to pKa at the inflection points. A plateau can be found at pH lower than 4.0, between 4 and 8, and higher than 12. These preliminary results indicated that spiropyran is a potential candidate for sensing pH in the UV region.
Previous studies suggest that nitro group-substituted spiropyrans favor the formation of the merocyanine form in acidic media [1]; however, other studies propose that this opening is favored in strongly basic media [66]. The studied compound exhibits similar behavior to that observed by Zheng et al. [62], where the closed structure is favored in acidic pH, while the open form (merocyanine) is favored in basic media. Moreover, the synthesized carboxylic derivative shows a blueshift in its merocyanine form, unlike the redshift of derivatives containing electron withdrawal groups (EWG), such as nitro and cyano groups [1,61,62,67]. This behavior shows that both the absence of these EWG and the presence of the carboxyl moiety in the indolic ring plays a key role in the species equilibrium and modulate their absorption spectra. In addition, as already discussed, we determined the ionization constant in water (wpKa) from the measured pKa in the ethanol/water solution (1:1 v/v) using the relationship pKa = wpKa − d, where d is 0.21 in the same solution with 0.1 ionic strength (KCl solution of 0.15 mol·L−1) [68]. The pKa values in water were 3.40 and 10.81, and attributed to the carboxylic acid and phenol groups ionization of the spiropyran, respectively.

3.5. BSA Interaction Study

It is well known that BSA in a buffered solution exhibits UV-Vis absorption and intrinsic fluorescence emission located at 280 nm and 340 nm, respectively, due to tryptophan residues [69]. Its fluorescence suppression can be a powerful tool to elucidate its interaction with small molecules, since BSA is largely used as protein model. In this way, it was studied the interaction of BSA with the spiropyran on suppression experiments, where the BSA concentration was kept constant (7.33 mM), and the concentration of the spiropyran changed from 1.9 mM up to 20.0 mM (Figure 6). Conversely, the interaction of spiropyran with the BSA was studied in association experiments. However, no association of the spiropyran with BSA related to the increase in the fluorescence intensity of the precursors could be observed.
Upon the addition of spiropyran into the solution containing bovine serum albumin, the absorption band located at approximately 279 nm increased (BSA absorption band), as expected. Additionally, a decrease in the fluorescence intensity of the BSA took place after the addition of spiropyran. Based on these results, the observed BSA fluorescence quenching was quantitatively evaluated using the collisional Stern–Volmer relation, presented in Equation (4) [70].
F0/F = 1 + KSV [Q] = 1 + Kqτ0[Q],
where F0 and F are the fluorescence intensities of the BSA in the absence and presence of the spiropyran, respectively; [Q] is the spiropyran concentration; KSV is the Stern–Volmer constant, and is the product of a bimolecular suppression constant Kq and the fluorophore lifetime (τ0 ~ 10−9 s) in the absence of the quencher [66]. Thus, we determined a linear plot correlation (F0/F = 0.987 + 73 377.83 [Q], R-Square: 0.992) and calculated the KSV at 7.33 × 10⁴ M−1. Additionally, the bimolecular suppression constant Kq for BSA was calculated at 7.33 × 10¹³ M−1∙s−1 based on τ0, which exceeded the maximum values of the diffusional mechanism (2.0 × 10⁻¹∙s−1). Thus, the nature of quenching was not dynamic but static suppression, resulting in the formation of spiropyran-BSA complexes in the ground state [71]. Moreover, we could calculate the binding constant (Ka) and the respective number of binding sites (n) between the BSA and the spiropyran by applying the Scatchard relation, presented in Equation (5) [72]:
log [(F0 − F)/F] = log Ka + n log [Q],
Figure 7 exhibits the double logarithmic plot of the fluorescence intensities of BSA over the spiropyran concentration. We observe a linear plot correlation (log [(F0 − F)/F] = 4.89289 + 1.00695 log [Q], R-Square: 0.964) with comparable binding constants (Ka) of 7.81 × 10⁴ with one binding site (n~1), indicating a non-significant role in the interaction of spiropyran with the BSA.

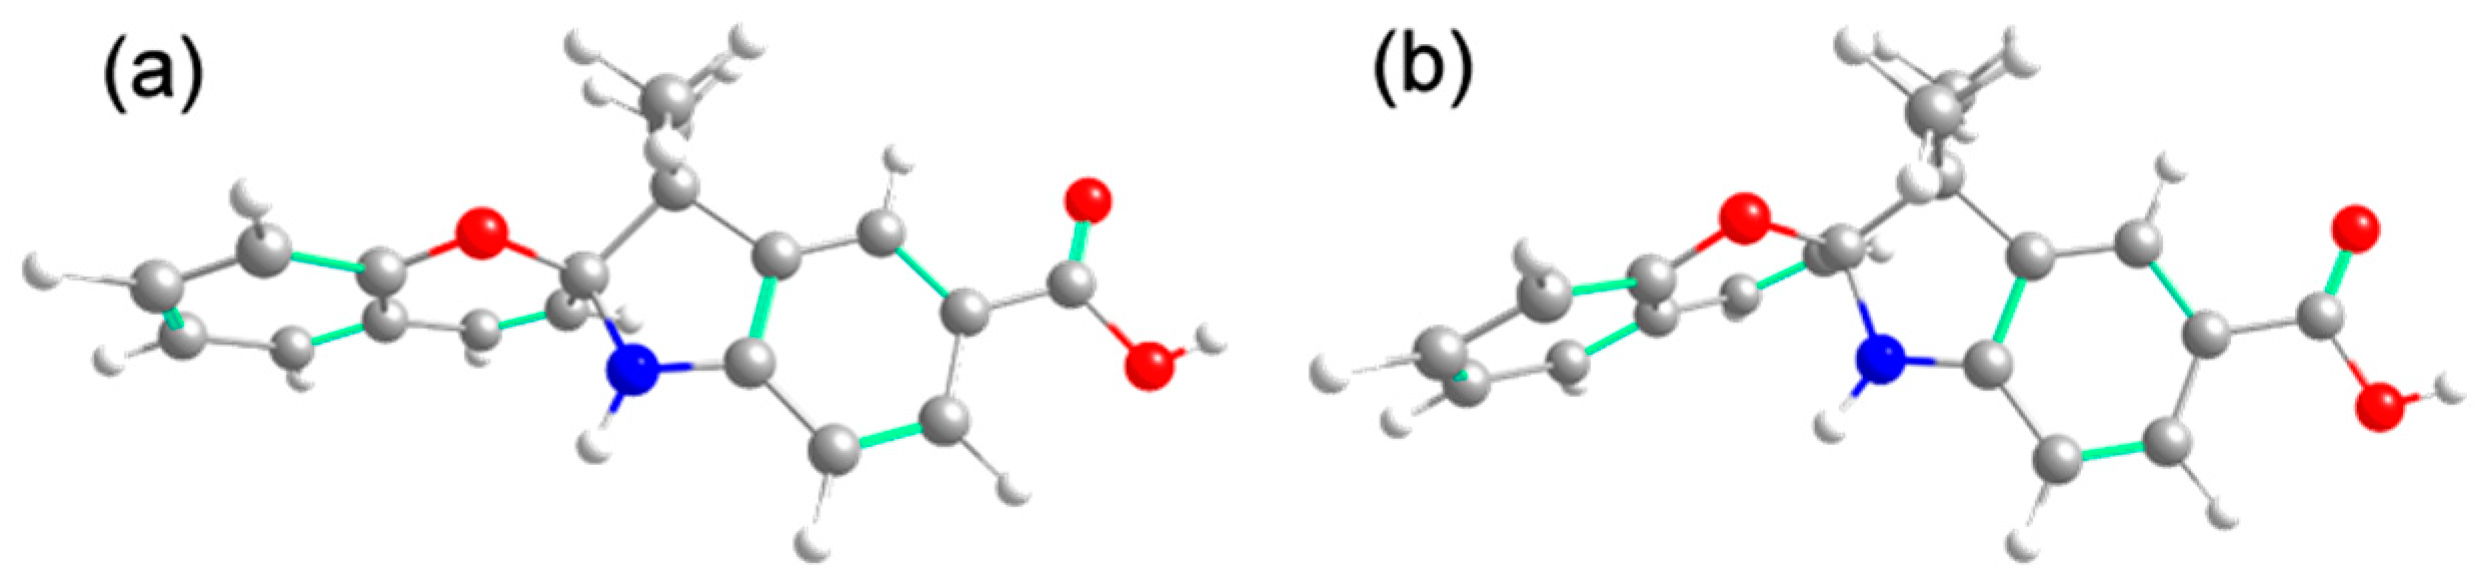
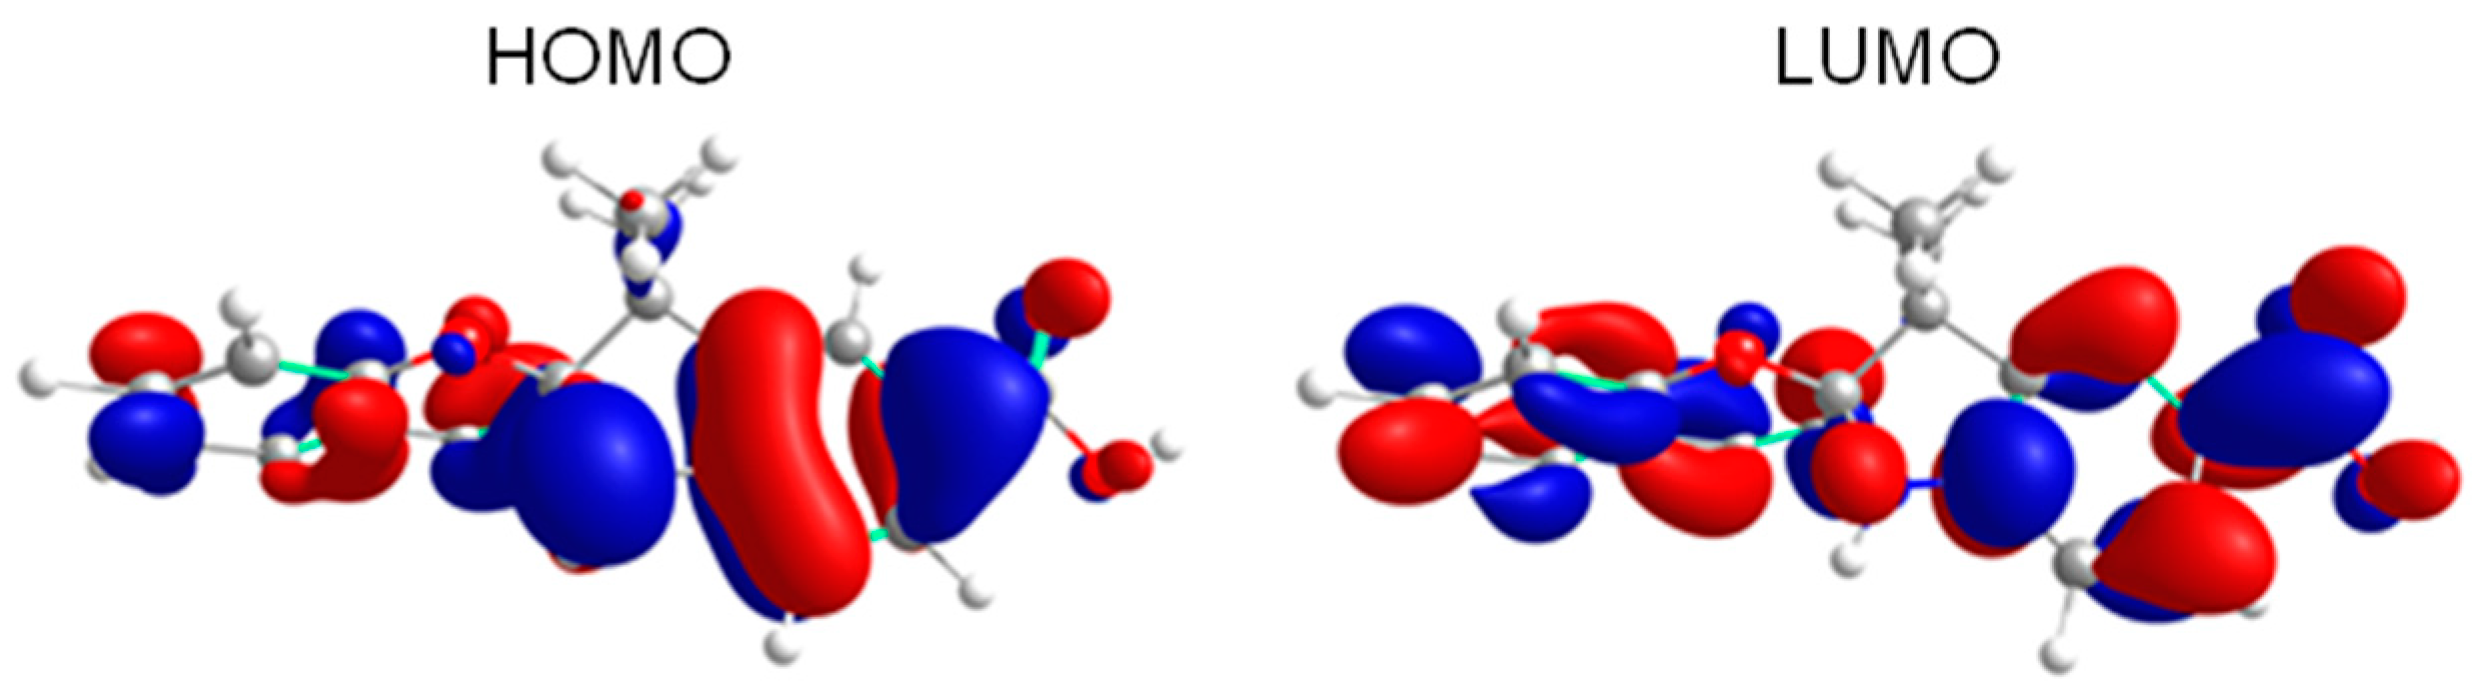
3.6. Theoretical Calculation

The ground (S0) and first (S1) excited state in dichloromethane obtained at PBE1PBE/cc-pVDZ level of theory is shown in Figure 8. All obtained geometries were very similar for all solvents, both in the ground and the first excited state (Figure S10). In the S1, the geometry of spiropyran is quite similar to the ground state; however, in the excited state there is an approximation of the indol and the benzopyran rings with the OCN angle going from ~110° to ~106°. The theoretical photophysical data obtained at PBE1PBE/jun-cc-pVTZ level of theory are shown in Table 3.
After excitation, the first excited state is populated due to its high oscillator strength in comparison to others computed excited states. This S0→S1 transition only occurs between the HOMO and LUMO orbitals, HOMO a π orbital and LUMO an π*orbital, making the S0→S1 transition have a 1ππ*character (Figure 9). Similar results could be observed in acetonitrile and methanol (Figure S11). The experimental data shows that methanol and acetonitrile had lower absorption wavelengths (296 nm and 298 nm, respectively) than dichloromethane (299 nm). However, this behavior is not observed in the TD-DFT results, as the theoretical absorption wavelengths for dichloromethane is lower in comparison to methanol and acetonitrile. This is because PCM only simulates solvent effects implicitly, and thus is not capable to take into account explicit solvent–solute interactions, e.g., hydrogen bonds between polar groups of spiropyran and solvent. In the theoretical data is observed a small increase in the absorption wavelengths with the increase of the dielectric constant, because the polarity of spiropyran increases in the excited state.
It was also investigated if the spiropyran 7 shows intramolecular charge transfer (ICT). The depletion region (C-), representing the decrease of electronic density that after excitation, and the increment region (C+), representing the increase of electronic density after excitation, are shown in Figure 10 for dichloromethane, acetonitrile and methanol. Evaluating the DCT values, a measure of the distance of the barycenter of the depletion and increment regions, in dichloromethane, 1.33 Å, acetonitrile, 0.91 Å, and methanol, 0.93 Å it is concluded that spiropyran shows ICT for all considered solvents, with the largest distance between the two regions being observed on dichloromethane. In the S0→S1 transition there is an electronic density transfer of the indole ring to the benzopyran ring.

4. Conclusions

We synthesized and characterized a novel spiropyran to investigate its relationship with BSA and elucidate its physical properties. The spiropyran presented an intense band at approximately 300 nm related to the π−π* electronic transitions from the ground state to the first excited state. The obtained Strickler–Berg parameters corroborate these observations. The synthesized spiropyran presented a single fluorescence emission band at approximately 558 nm. The difference found between the experimental and theoretical results can be explained by the fact that PCM simulates the solvent effect implicitly and not explicitly. The S0→S1 transition show a 1ππ* character involving the HOMO and LUMO orbitals. The calculated DCT values shows that spiropyran exhibit ICT. The values of the ionization constant in water were 3.40 and 10.81, and attributed to the ionization of the carboxylic acid and phenol group of the spiropyran, respectively. Despite the absence of photoisomerization, we studied the interaction of this compound with BSA successfully, and it showed suppression properties, with relatively large Stern–Volmer values (~104 M−1) and bimolecular suppression (~1013 M−1∙s−1) constants. Steady-state experiments indicated that the nature of the suppression was static.

Supplementary Materials

The Supplementary Materials are available online at https://www.mdpi.com/2227-9040/8/2/31/s1. Figure S1: 1H NMR spectrum of compound 3 in CDCl3 (300 MHz), Figure S2: 13C NMR spectrum of compound 3 in CDCl3 (75 MHz), Figure S3: 1H NMR spectrum of compound 5 in DMSO-d6 (300 MHz), Figure S4: 13C NMR spectrum of compound 5 in DMSO-d6 (75 MHz), Figure S5: FTIR spectrum of compound 7 in NaCl window, Figure S6: 1H NMR spectrum of compound 7 in CDCl3 (400 MHz), Figure S7: 13C NMR spectrum of compound 7 in CDCl3 (100 MHz), Figure S8: Differential Scanning Calorimetry (DSC) plots of compound 7 measured at 10 °C/min showing the glass transition temperature (Tg) and melting point temperature (Tm), Figure S9: Full UV-Vis spectra in solution of compound 7 different organic solvents [ca. 10-5 M], Figure S10: Geometries of spiropyran in acetonitrile and methanol, Figure S11: HOMO and LUMO orbitals in acetonitrile and methanol.

Author Contributions

R.d.C.D. and F.d.S.S. contributed with conception and design of the study; F.S.R. established the specific methodology; R.d.C.D., F.d.S.S. and R.C. organized the database; R.d.C.D., F.d.S.S. and R.C. performed the synthesis, analyses and investigations; D.B. and E.Z. performed and validated the electrochemical experiments; A.G.D.-B. provided resources; R.d.C.D., F.d.S.S. and R.C. wrote the first draft of the manuscript; F.S.R. and A.G.D.-B. supervised final editing and managed project; B.B.d.A. and P.F.B.G. performed and validated the theoretical calculations. All authors have read and agreed to the published version of the manuscript.

Funding

This research was funded by National Council for Scientific and Technological Development – CNPq, grant number 305954/2019-9, Coordenação de Aperfeiçoamento de Pessoal de Nível Superior - Brasil (CAPES) - Finance Code 001 and CELESC P&D grant number 05697-1718/2018 and 5697-0717/2017.

Acknowledgments

The authors thank Teresa Dib Zambon Atvars and Luís Gustavo Teixeira Alves for the photoisomerization study.

Conflicts of Interest

The authors declare that the research was conducted in the absence of any commercial or financial relationships that could be construed as a potential conflict of interest.

References

  1. Klajn, R. Spiropyran-based dynamic materials. Chem. Soc. Rev. 2014, 43, 148–184. [Google Scholar] [CrossRef] [PubMed] [Green Version]
  2. Kortekaas, L.; Browne, W.R. The evolution of spiropyran: fundamentals and progress of an extraordinarily versatile photochrome. Chem. Soc. Rev. 2019, 48, 3406–3424. [Google Scholar] [CrossRef] [PubMed] [Green Version]
  3. Feeney, M.J.; Thomas, S.W. Tuning the Negative Photochromism of Water-Soluble Spiropyran Polymers. Macromol. 2018, 51, 8027–8037. [Google Scholar] [CrossRef]
  4. Li, X.; Li, J.; Wang, Y.; Matsuura, T.; Meng, J.-B. Synthesis of functionalized spiropyran and spirooxazine derivatives and their photochromic properties. J. Photochem. Photobiol. A: Chem. 2004, 161, 201–213. [Google Scholar] [CrossRef]
  5. Samanta, D.; Galaktionova, D.; Gemen, J.; Shimon, L.J.W.; Diskin-Posner, Y.; Avram, L.; Král, P.; Klajn, R. Reversible chromism of spiropyran in the cavity of a flexible coordination cage. Nat. Commun. 2018, 9, 641. [Google Scholar] [CrossRef] [PubMed] [Green Version]
  6. Huang, C.-Q.; Wang, Y.; Hong, C.-Y.; Pan, C.-Y. Spiropyran-Based Polymeric Vesicles: Preparation and Photochromic Properties. Macromol. Rapid Commun. 2011, 32, 1174–1179. [Google Scholar] [CrossRef]
  7. Chan, Y.-H.; Gallina, M.E.; Zhang, X.; Wu, I.-C.; Jin, Y.; Sun, W.; Chiu, D.T. Reversible Photoswitching of Spiropyran-Conjugated Semiconducting Polymer Dots. Anal. Chem. 2012, 84, 9431–9438. [Google Scholar] [CrossRef] [Green Version]
  8. Cui, L.; Zhang, H.; Zhang, G.; Zhou, Y.; Fan, L.; Shi, L.; Zhang, C.; Shuang, S.; Dong, C. Substituent effect on the acid-induced isomerization of spiropyran compounds. Spectrochim. Acta Part A: Mol. Biomol. Spectrosc. 2018, 202, 13–17. [Google Scholar] [CrossRef]
  9. Byrne, R.; Fraser, K.J.; Izgorodina, E.; Macfarlane, D.R.; Forsyth, M.; Diamond, D. Photo- and solvatochromic properties of nitrobenzospiropyran in ionic liquids containing the [NTf2]− anion. Phys. Chem. Chem. Phys. 2008, 10, 5919–5924. [Google Scholar] [CrossRef] [Green Version]
  10. Crano, J.C.; Guglielmetti, R.J. (Eds.) Organic photochromic and thermochromic compounds, 1st ed.; Springer US: New York, NY, USA, 2002. [Google Scholar]
  11. Kobatake, S.; Irie, M. 8 Photochromism. Annu. Rep. Prog. Chem. Sect. C: Phys. Chem. 2003, 99, 277–313. [Google Scholar] [CrossRef]
  12. Paramonov, S.; Lokshin, V.; Fedorova, O.A. Spiropyran, chromene or spirooxazine ligands: Insights into mutual relations between complexing and photochromic properties. J. Photochem. Photobiol. C: Photochem. Rev. 2011, 12, 209–236. [Google Scholar] [CrossRef]
  13. Berkovic, G.; Krongauz, V.; Weiss, V. Spiropyrans and Spirooxazines for Memories and Switches. Chem. Rev. 2000, 100, 1741–1754. [Google Scholar] [CrossRef] [PubMed]
  14. Levitus, M.; Glasser, G.; Neher, D.; Aramendía, P.F. Direct measurement of the dipole moment of a metastable merocyanine by electromechanical interferometry. Chem. Phys. Lett. 1997, 277, 118–124. [Google Scholar] [CrossRef]
  15. Bletz, M.; Pfeifer-Fukumura, U.; Kolb, U.; Baumann, W. Ground- and First-Excited-Singlet-State Electric Dipole Moments of Some Photochromic Spirobenzopyrans in Their Spiropyran and Merocyanine Form†. J. Phys. Chem. A 2002, 106, 2232–2236. [Google Scholar] [CrossRef]
  16. Casades, I.; Constantine, S.; Cardin, D.; García, H.; Gilbert, A.; Márquez, F. ‘Ship-in-a-Bottle’ Synthesis and Photochromism of Spiropyrans Encapsulated within Zeolite Y Supercages. Tetrahedron 2000, 56, 6951–6956. [Google Scholar] [CrossRef]
  17. Alonso, M.; Reboto, V.; Guiscardo, L.; Martin, A.S.; Rodríguez-Cabello, J.C. Spiropyran Derivative of an Elastin-like Bioelastic Polymer: Photoresponsive Molecular Machine to Convert Sunlight into Mechanical Work. Macromol. 2000, 33, 9480–9482. [Google Scholar] [CrossRef]
  18. Xia, H.; Chen, Y.; Yang, G.; Zou, G.; Zhang, Q.; Zhang, D.; Wang, P.; Ming, H. Optical Modulation of Waveguiding in Spiropyran-Functionalized Polydiacetylene Microtube. ACS Appl. Mater. Interfaces 2014, 6, 15466–15471. [Google Scholar] [CrossRef]
  19. Shiraishi, Y.; Shirakawa, E.; Tanaka, K.; Sakamoto, H.; Ichikawa, S.; Hirai, T. Spiropyran-Modified Gold Nanoparticles: Reversible Size Control of Aggregates by UV and Visible Light Irradiations. ACS Appl. Mater. Interfaces 2014, 6, 7554–7562. [Google Scholar] [CrossRef]
  20. Tian, W.; Tian, J. Synergy of Different Fluorescent Enhancement Effects on Spiropyran Appended onto Cellulose. Langmuir 2014, 30, 3223–3227. [Google Scholar] [CrossRef]
  21. Schenderlein, H.; Voss, A.; Stark, R.W.; Biesalski, M. Preparation and Characterization of Light-Switchable Polymer Networks Attached to Solid Substrates. Langmuir 2013, 29, 4525–4534. [Google Scholar] [CrossRef]
  22. Shiraishi, Y.; Miyamoto, R.; Hirai, T. Spiropyran-Conjugated Thermoresponsive Copolymer as a Colorimetric Thermometer with Linear and Reversible Color Change. Org. Lett. 2009, 11, 1571–1574. [Google Scholar] [CrossRef] [PubMed]
  23. Sheng, L.; Li, M.; Zhu, S.; Li, H.; Xi, G.; Li, Y.-G.; Wang, Y.; Li, Q.; Liang, S.; Zhong, K.; et al. Hydrochromic molecular switches for water-jet rewritable paper. Nat. Commun. 2014, 5, 3044. [Google Scholar] [CrossRef] [PubMed]
  24. Wan, S.; Zheng, Y.; Shen, J.; Yang, W.; Yin, M. “On–off–on” Switchable Sensor: A Fluorescent Spiropyran Responds to Extreme pH Conditions and Its Bioimaging Applications. ACS Appl. Mater. Interfaces 2014, 6, 19515–19519. [Google Scholar] [CrossRef] [PubMed]
  25. Abdollahi, A.; Alinejad, Z.; Mahdavian, A.R. Facile and fast photosensing of polarity by stimuli-responsive materials based on spiropyran for reusable sensors: a physico-chemical study on the interactions. J. Mater. Chem. C 2017, 5, 6588–6600. [Google Scholar] [CrossRef]
  26. Parker, R.; Gates, J.; Rogers, H.L.; Smith, P.; Grossel, M.C. Using the photoinduced reversible refractive-index change of an azobenzene co-polymer to reconfigure an optical Bragg grating. J. Mater. Chem. 2010, 20, 9118–9125. [Google Scholar] [CrossRef] [Green Version]
  27. Xu, Z.; Li, S.; Shen, Y.; Chen, M.; Shao, X. Spiropyran-azobenzene-DBU system as solvent indicator. Tetrahedron Lett. 2018, 59, 3829–3832. [Google Scholar] [CrossRef]
  28. Chen, J.; Xu, L.; Wu, S.; Su, J.; Tong, Z. Photoreversible Fluorescent Modulation of Nanoparticles via One-Step Miniemulsion Polymerization. Small 2009, 5, 970–978. [Google Scholar] [CrossRef]
  29. Cui, H.; Liu, H.; Chen, S.; Wang, R. Synthesis of amphiphilic spiropyran-based random copolymer by atom transfer radical polymerization for Co2+ recognition. Dye. Pigment. 2015, 115, 50–57. [Google Scholar] [CrossRef]
  30. Streib, M.; Kräling, K.; Richter, K.; Xie, X.; Steuber, H.; Meggers, E. An organometallic inhibitor for the human repair enzyme 7,8-dihydro-8-oxoguanosine triphosphatase. Angew. Chem. Int. Ed. 2014, 53, 305–309. [Google Scholar] [CrossRef] [Green Version]
  31. Wang, L.-F.; Chen, J.-W.; Chen, J.-W. Cyclodextrin effects on the photochromism of spiropyrans/β-cyclodextrin inclusion polymers. Mater. Chem. Phys. 2012, 136, 151–159. [Google Scholar] [CrossRef]
  32. Raymo, F.M.; Alvarado, R.J.; Giordani, S.; Cejas, M.A. Memory Effects Based on Intermolecular Photoinduced Proton Transfer. J. Am. Chem. Soc. 2003, 125, 2361–2364. [Google Scholar] [CrossRef] [PubMed]
  33. Zhu, M.-Q.; Zhang, G.-F.; Li, C.; Aldred, M.; Chang, E.; Drezek, R.A.; Li, A.D.Q. Reversible Two-Photon Photoswitching and Two-Photon Imaging of Immunofunctionalized Nanoparticles Targeted to Cancer Cells. J. Am. Chem. Soc. 2011, 133, 365–372. [Google Scholar] [CrossRef] [PubMed]
  34. Wang, Y.; Xu, Z.; Dai, X.; Li, H.; Yu, S.; Meng, W. A New Spiropyran-Based Sensor for Colorimetric and Fluorescent Detection of Divalent Cu2+ and Hg2+ Ions and Trivalent Ce3+, Cr3+ and Al3+ Ions. J. Fluoresc. 2019, 29, 569–575. [Google Scholar] [CrossRef] [PubMed]
  35. Lafuma, A.; Quinn, F.X.; Sanchez, C.; Chodorowski-Kimmes, S. Photochromic Properties of a Spirooxazine and a Spiropyran in Alcoholic Solutions of Zirconium and Aluminium Alkoxides: Influence of the Ethyl Acetoacetate Chelating Agent on the Optical Properties. Eur. J. Inorg. Chem. 2003, 2003, 331–338. [Google Scholar] [CrossRef]
  36. Lee, C.H.; Yun, H.J.; Jung, M.R.; Lee, J.G.; Kim, J.H.; Kim, J.H. Preparation and Characterization of Squaraine Dyes containing Mono- and Bis-Anchoring Groups as the Light Absorber in Dye Sensitized Solar Cells. Electrochimica Acta 2014, 138, 148–154. [Google Scholar] [CrossRef]
  37. Armarego, W.L.F.; Chai, C. Purification of Laboratory Chemicals, 7th ed.; Butterworth-Heinemann: Oxford, UK, 2013. [Google Scholar]
  38. Würth, C.; Grabolle, M.; Pauli, J.; Spieles, M.; Resch-Genger, U. Relative and absolute determination of fluorescence quantum yields of transparent samples. Nat. Protoc. 2013, 8, 1535–1550. [Google Scholar] [CrossRef]
  39. Avdeef, A.; Comer, J.E.A.; Thomson, S.J. pH-Metric log P. 3. Glass electrode calibration in methanol-water, applied to pKa determination of water-insoluble substances. Anal. Chem. 1993, 65, 42–49. [Google Scholar] [CrossRef]
  40. Herrero-Martínez, J.M.; Repollés, C.; Bosch, E.; Rosés, M.; Ràfols, C. Potentiometric determination of aqueous dissociation constants of flavonols sparingly soluble in water. Talanta 2008, 74, 1008–1013. [Google Scholar] [CrossRef]
  41. Duarte, L.G.T.A.; Germino, J.C.; de Ávila Braga, C.; Barboza, C.A.; Atvars, T.D.Z.; Santos, F.D.S.; Rodembusch, F.S. Photoacidity as a tool to rationalize excited state intramolecular proton transfer reactivity in flavonols. Photochem. Photobiol. Sci. 2018, 17, 231–238. [Google Scholar] [CrossRef]
  42. Coelho, F.L.; de Ávila Braga, C.; Zanotto, G.M.; Gil, E.S.; Campo, L.F.; Gonçalves, P.F.B.; Rodembusch, F.S.; Santos, F.D.S. Low pH optical sensor based on benzothiazole azo dyes. Sensors Actuators B: Chem. 2018, 259, 514–525. [Google Scholar] [CrossRef]
  43. Castro, G.T.; Giordano, O.S.; Blanco, S.E. Determination of the pKa of hydroxy-benzophenones in ethanol-water mixtures. Solvent effects. J. Mol. Struct. THEOCHEM 2003, 626, 167–178. [Google Scholar] [CrossRef]
  44. Frisch, M.J.; Trucks, G.W.; Schlegel, H.B.; Scuseria, G.E.; Robb, M.A.; Cheeseman, J.R.; Scalmani, G.; Barone, V.; Petersson, G.A.; Nakatsuji, H.; et al. Gaussian 16, Revision A.03; Gaussian, Inc.: Wallingford, CT, USA, 2016; Available online: https://gaussian.com/ (accessed on 29 April 2020).
  45. Ernzerhof, M.; Scuseria, G.E. Assessment of the Perdew–Burke–Ernzerhof exchange-correlation functional. J. Chem. Phys. 1999, 110, 5029–5036. [Google Scholar] [CrossRef] [Green Version]
  46. Papajak, E.; Zheng, J.; Xu, X.; Leverentz, H.R.; Truhlar, D. Perspectives on Basis Sets Beautiful: Seasonal Plantings of Diffuse Basis Functions. J. Chem. Theory Comput. 2011, 7, 3027–3034. [Google Scholar] [CrossRef] [PubMed]
  47. Tomasi, J.; Menucci, B.; Cammi, R. Quantum Mechanical Continuum Solvation Models. Chemin- 2005, 36, 2999–3093. [Google Scholar] [CrossRef]
  48. Le Bahers, T.; Adamo, C.; Ciofini, I. A Qualitative Index of Spatial Extent in Charge-Transfer Excitations. J. Chem. Theory Comput. 2011, 7, 2498–2506. [Google Scholar] [CrossRef]
  49. Lu, T. Computer Program, Multiwfn. 2017. Available online: https://www.multiwfn.codeplex.com (accessed on 24 March 2020).
  50. Chemcraft - graphical software for visualization of quantum chemistry computations. Available online: https://www.chemcraftprog.com (accessed on 24 March 2020).
  51. Allen, C.F.H.; Wilson, C. V The use of N15 as a tracer element in chemical reactions. The mechanism of the Fischer indole synthesis. J. Am. Chem. Soc. 1943, 65, 611–612. [Google Scholar] [CrossRef]
  52. Zhang, X.; Heng, S.; Abell, A.D. Photoregulation of α-chymotrypsin activity by spiropyran-based inhibitors in solution and attached to an optical fiber. Chem. Eur. J. 2015, 21, 10703–10713. [Google Scholar] [CrossRef]
  53. Armendáriz-Vidales, G.; Martínez-González, E.; Hernández-Melo, D.; Tiburcio, J.; Frontana, C. Electrochemical Characterization of Spiropyran Structures. Procedia Chem. 2014, 12, 41–46. [Google Scholar] [CrossRef] [Green Version]
  54. Ivashenko, O.; Van Herpt, J.T.; Rudolf, P.; Feringa, B.L.; Browne, W.R. Oxidative electrochemical aryl C–C coupling of spiropyrans. Chem. Commun. 2013, 49, 6737–6739. [Google Scholar] [CrossRef] [Green Version]
  55. Gerkman, M.A.; Yuan, S.; Duan, P.; Taufan, J.; Schmidt-Rohr, K.; Han, G.G.D. Phase transition of spiropyrans: impact of isomerization dynamics at high temperatures. Chem. Commun. 2019, 55, 5813–5816. [Google Scholar] [CrossRef]
  56. Tangso, K.J.; Fong, W.-K.; Darwish, T.A.; Kirby, N.; Boyd, B.J.; Hanley, T.L. Novel Spiropyran Amphiphiles and Their Application as Light-Responsive Liquid Crystalline Components. J. Phys. Chem. B 2013, 117, 10203–10210. [Google Scholar] [CrossRef] [PubMed]
  57. Li, X.; Li, C.; Wang, S.; Dong, H.; Ma, X.; Cao, D. Synthesis and properties of photochromic spirooxazine with aggregation-induced emission fluorophores polymeric nanoparticles. Dye. Pigment. 2017, 142, 481–490. [Google Scholar] [CrossRef]
  58. Strickler, S.J.; Berg, R.A. Relationship between Absorption Intensity and Fluorescence Lifetime of Molecules. J. Chem. Phys. 1962, 37, 814–822. [Google Scholar] [CrossRef] [Green Version]
  59. Turro, N.J.; Scaiano, J.C.; Ramamurthy, V. Principles of molecular photochemistry: An introduction, 1st ed.; University Science Books: Sausalito, CA, USA, 2009. [Google Scholar]
  60. He, T.; Zhang, J. (Eds.) Photochromic Materials: Preparation, Properties and Applications, 1st ed.; Wiley-VCH: Weinheim, Germany, 2016. [Google Scholar]
  61. Metelitsa, A.V.; Micheau, J.C.; Besugliy, S.O.; Gaeva, E.B.; Voloshin, N.A.; Voloshina, E.N.; Samat, A.; Minkin, V.I. Photochromic properties of six 5-On-alkyl, 6′-CN substituted spironaphthoxazines. Int. J. Photoenergy 2004, 6, 199–204. [Google Scholar] [CrossRef]
  62. Tiwari, S.; Ghosh, K.K.; Marek, J.; Ramalho, T.C. Spectrophotometric Determination of the Acidity Constants of Some Oxime-Based α-Nucleophiles. J. Chem. Eng. Data 2010, 55, 1153–1157. [Google Scholar] [CrossRef]
  63. Islamoglu, F.; Kahveci, B.; Ozil, M.; Akyuz, E. Studies on the protonation constants of some triazoles in ethanol-water mixtures. Asian J. Chem. 2008, 20, 3569–3578. [Google Scholar]
  64. Islamoglu, F.; Kahveci, B.; Ozil, M.; Akyuz, E.; Mentesf, E.; Ekinci, A.P. Determination of the protonation constants of triazole derivatives in non-aqueous solvents. Asian J. Chem. 2009, 21, 1453–1459. [Google Scholar]
  65. Ferreira, Q.; Gomes, P.J.; Ribeiro, P.; Jones, N.C.; Hoffmann, S.V.; Mason, N.J.; Oliveira, O.N.; Raposo, M. Determination of Degree of Ionization of Poly(allylamine hydrochloride) (PAH) and Poly[1-[4-(3-carboxy-4 hydroxyphenylazo)benzene sulfonamido]-1,2-ethanediyl, sodium salt] (PAZO) in Layer-by-Layer Films using Vacuum Photoabsorption Spectroscopy. Langmuir 2012, 29, 448–455. [Google Scholar] [CrossRef]
  66. Zheng, T.; Xu, Z.; Zhao, Y.; Li, H.; Jian, R.; Lu, C. Multiresponsive polysiloxane bearing photochromic spirobenzopyran for sensing pH changes and Fe3+ ions and sequential sensing of Ag+ and Hg2+ ions. Sensors Actuators B: Chem. 2018, 255, 3305–3315. [Google Scholar] [CrossRef]
  67. Roxburgh, C.J.; Sammes, P.G.; Abdullah, A. Steric and electronically biasing substituent effects on the Photoreversibility of novel, 3′-, 5′- and 3-substituted indolospirobenzopyrans. Thermal evaluation using 1H NMR spectroscopy and Overhauser enhancement studies. Dye. Pigment. 2009, 83, 31–50. [Google Scholar] [CrossRef]
  68. Brauer, G.M.; Durany, G.; Argentar, H. Ionization Constants of Substituted Benzoic Acids in Ethanol-Water. J. Res. Natl. Bur. Stand. Sect. A: Phys. Chem. 1967, 71, 379–384. [Google Scholar] [CrossRef] [PubMed]
  69. Sułkowska, A. Interaction of drugs with bovine and human serum albumin. J. Mol. Struct. 2002, 614, 227–232. [Google Scholar] [CrossRef]
  70. Lakowicz, J.R. Principles of fluorescence spectroscopy; Springer: Berlin/Heidelberg, Germany, 2006. [Google Scholar]
  71. Feng, X.-Z.; Lin, Z.; Yang, L.-J.; Wang, C.; Bai, C. Investigation of the interaction between acridine orange and bovine serum albumin. Talanta 1998, 47, 1223–1229. [Google Scholar] [CrossRef]
  72. Scatchard, G. THE ATTRACTIONS OF PROTEINS FOR SMALL MOLECULES AND IONS. Ann. New York Acad. Sci. 1949, 51, 660–672. [Google Scholar] [CrossRef]
Scheme 1. Basic equilibrium between the spiropyran and merocyanine species of a non-substituted spiropyran.
Chemosensors 08 00031 sch001
Scheme 2. Synthesis of spiropyran 7, where (i) CH3COOH/reflux; (ii) CH3CN/56 °C, and (iii) MeOH, CH3COONH4, reflux.
Chemosensors 08 00031 sch002
Figure 1. (a) Cyclic voltammogram of spiropyran 7 on a glassy carbon electrode in 0.1 TBAPF6/CH2Cl2 at 100 mV s−1 and (b) the oxidation peak detail.
Chemosensors 08 00031 g001
Figure 2. Thermogravimetric analysis plot of compound 7 at 10 °C·min−1. The inset shows the respective derivative thermogravimetric curve.
Chemosensors 08 00031 g002
Figure 3. (a) UV-Vis absorption, (b) steady-state fluorescence emission, and (c) excitation spectra in solution of different organic solvents of spiropyran 7 [ca. 10−5 M] (DCM is dichloromethane, and DMSO is dimethylsulfoxide.).
Chemosensors 08 00031 g003
Figure 4. UV-Vis absorbance spectra of spiropyran 7 [10−5 mol·L−1] in acetonitrile solution, at (a) 300 nm and (b) 365 nm irradiation for 5 min, and at (c) 300 nm and (d) 365 nm irradiation every 2 min for 50 min.
Chemosensors 08 00031 g004
Figure 5. (a) UV-Vis absorption spectra of spiropyran in ethanol/water solution (1:1 v/v) in indicated pH values at 25 °C and (b) dependence on the absorbance intensity vs. pH recorded at 270 nm. The dotted line was fitted according to the Boltzmann sigmoidal curve function.
Chemosensors 08 00031 g005
Figure 6. UV-Vis absorption (a) and fluorescence emission (b) spectra (λexc = 279 nm) of BSA in PBS solution (7.33 mM) in the presence of different amounts of spiropyran (10−5 M). The blank sample is pure BSA.
Chemosensors 08 00031 g006
Figure 7. Stern–Volmer equation plots of BSA fluorescence intensity vs. spiropyran concentration in the suppression experiment (a) and log-log plot of BSA fluorescence intensity vs. spiropyran concentration (b) used to obtain the binding constant (Ka) and binding sites (n) from Equation (5).
Chemosensors 08 00031 g007
Figure 8. Geometries in the ground (a) and the first excited state (b) of spiropyran 7 obtained at PBE1PBE/cc-pVDZ level of theory in dichloromethane.
Chemosensors 08 00031 g008
Figure 9. HOMO and LUMO orbitals involved in the S0→S1 transition of spiropyran 7 obtained at PBE1PBE/jun-cc-pVTZ level of theory in dichloromethane.
Chemosensors 08 00031 g009
Figure 10. Depletion (blue) and increment (purple) regions for spiropyran 7 in dichloromethane (a), acetonitrile (b) and methanol (c) for the S0→S1 transition.
Chemosensors 08 00031 g010
Table 1. Electrochemical and electronic properties of spiropyran 7.
ParametersExperimental Data
E o x i o n s e t (V) a1.17
E r e d o n s e t (V) b−1.54
λonset (nm) c332.90
E g a p o p t (eV) d3.72
IP (HOMO) (eV) e−5.61
EA (LUMO) (eV) f−1.89
Notes: E o x i o n s e t is the onset potential of oxidation, E r e d o n s e t   is the onset potential of reduction, IP (HOMO) is the ionization potential, EA (LUMO) is the electron affinity, E g a p o p t is the band-gap, and λonset is the absorption onset wavelength. a E o x i o n s e t (vs. NHE) = E o x i o n s e t (vs. Ag/Ag+) + 0.25; b E r e d o n s e t (vs. NHE) = E r e d o n s e t (vs. Ag/Ag+) + 0.25; c λonset: absorption onsets wavelength; d Optical band gap calculated on the low energetic edge of the absorption spectrum ( E g a p o p t = 1240/λonset); eIP = – ( E o x i o n s e t + 4.44) eV; f EA calculated from IP and E g a p o p t .
Table 2. Photophysical data of compound 7 from UV-Vis absorption, steady-state fluorescence emission, and excitation spectroscopies.
Solventλabsεfke0τ0λexc a)λem b)ΔλSTQY
Dichloromethane2992.490.626.931.4431935859/55120.4
Methanol2962.330.617.011.4332136771/65360.4
Acetonitrile2982.420.576.411.5631735961/57020.4
Dimethylsulfoxide2982.210.606.731.4932135961/57020.5
Note: λabs, λem, and λexc are the absorption, emission, and excitation maxima (nm), ε is the molar extinction coefficient (×104 M−1·cm−1), f is the calculated oscillator strength, ke0 is the calculated radiative rate constant (108 s−1), t0 is the calculated pure radiative lifetime (ns), ΔλST is the Stokes shift (nm/cm−1), and QY is the fluorescence quantum yield (%). a) Obtained from the excitation spectra. b) Obtained using the absorption maxima as excitation wavelengths.
Table 3. Calculated photophysical proprieties of spiropyran 7 at PBE1PBE/jun-cc-pVTZ level of theory.
SolventλabsΔabsμGSfλemfΔemμESΔλST
Dichloromethane309104.810.78114020.18324411.377487
Acetonitrile311134.990.87243950.24073611.316838
Methanol311154.990.86943950.23843211.316838
Note: λabs and λexc are the absorption and emission wavelengths (nm), Δabs and Δem are the absolute difference between the experimental and the theoretical wavelengths, μGS and μES are the dipole moments of the ground state and excited state respectively, f is the oscillator strength and ΔλST is the Stokes shift (cm−1).

