Article

Impedance Study of Dopamine Effects after Application on 2D and 3D Neuroblastoma Cell Cultures Developed on a 3D-Printed Well

by
Georgia Paivana
1,*,
Theofylaktos Apostolou
1,
Sophie Mavrikou
1,
Dimitris Barmpakos
2,3,
Grigoris Kaltsas
2 and
Spyridon Kintzios
1
1
Laboratory of Cell Technology, Department of Biotechnology, Agricultural University of Athens, 118 55Athens, Greece
2
microSENSES Laboratory, Department of Electrical and Electronic Engineering, University of West Attica, 122 44 Athens, Greece
3
Institute of Nanoscience and Nanotechnology (INN), National Centre for Scientific Research “Demokritos”, 153 41 Athens, Greece
*
Author to whom correspondence should be addressed.
Chemosensors 2019, 7(1), 6; https://doi.org/10.3390/chemosensors7010006
Submission received: 30 November 2018 / Revised: 25 January 2019 / Accepted: 30 January 2019 / Published: 5 February 2019
(This article belongs to the Special Issue Printed Electroanalytical Tools for De-Centralized Applications)

Abstract

:
In this work, the assessment of the interactions of a bioactive substance applied to immobilized cells in either a two-dimensional (2D) or three-dimensional (3D) arrangement mimicking in vivo tissue conditions is presented. In particular, dopamine (DA) was selected as a stimulant for the implementation of an impedance analysis with a specific type of neural cells (murine neuroblastoma). The aim of this study was the extraction of calibration curves at various frequencies with different known dopamine concentrations for the description of the behavior of dopamine applied to 2D and 3D cell cultures. The results present the evaluation of the mean impedance value for each immobilization technique in each frequency. The differential responses showed the importance of the impedance when frequency is applied in both 2D and 3D immobilization cases. More specifically, in 2D immobilization matrix impedance shows higher values in comparison with the 3D cell culture. Additionally, in the 3D case, the impedance decreases with increasing concentration, while in the 2D case, an opposite behavior was observed.

1. Introduction

In literature, the term impedance constitutes a generalization of resistance, as it is defined as the complex ratio of the voltage to the current in an alternating/direct current circuit [1]. The most common impedance-related measurements are known as electrochemical impedance spectroscopy (EIS) and are widely used for many different forms of analysis [1]. EIS measurements are efficient for the characterization of single cells on the basis of cellular electrical response over a particular frequency range and also of cellular physiological responses over a long period of time [2]. In addition, the overall biological property of a cell is related to the electrical properties of cytoplasm and the cell membrane [3,4].
Bioimpedance is known as an inexpensive and noninvasive technology that is used in many areas of biomedicine. The human body cells are arranged in groups by function in order to form tissues and organs. As they react to the alternate current flow, useful information can be obtained about the health status of the subject, since body functions depend on the respective cellular ones [5].
In the mammalian brain, various senses, such as sight, hearing, and touch combined with signals from throughout the body, provide vast amounts of information received from the subject’s environment. Neurotransmitters are released by exocytosis from synaptic vesicles fused with the cell membrane. Since amino acid neurotransmitters play crucial role in control and regulation of various functions in the peripheral and central nervous system, they have also been the focus of much attention in medical diagnostics, clinical chemistry, biomedical research and pharmaceutical industry [6,7,8].
Cells’ immobilization procedure onto an electrode’s surface constitutes a desired integral part of whole-cell electrochemical biosensors, since redox reactions take place and also it may simplify operation and efficiently improve operational and storage stability. Immobilization procedure is able to preserve cell’s functionality and viability and ensure effective access of analyte molecules to the cells and of product molecules that derive from the intracellular enzymatic activity to electrode’s surface [9].
With the immobilization of a biorecognition element (e.g., cell) on a transducer, the cell blocks electrical current that passes directly through the electrode as its anchored plasma membrane interferes above the electrode surface. Thus, the current that flows from the electrode to an attached cell disperses through the narrow cell-substrate spaces that are available [10].
Dopamine ((3,4-dihydroxyphenyl) ethylamine, DA) constitutes one of the essential catecholamine neurotransmitters not only in the mammalian central nervous system, but also in the peripheral [11]. Additionally, it significantly affects the functioning of the hormonal, renal and central nervous systems [12]. More specifically, in major diseases and pathological conditions such as schizophrenia, Parkinson’s disease, drug addiction, Tourette syndrome, hyperprolactinemia [13], Harrington’s disease [14], senile dementia, epilepsy, and HIV infection [15], DA receptors (D1–D5) including their subtypes are the basis of the treatment for the diseases mentioned, considering pharmacological modification of the responsiveness of the various DA receptors. The direct and accurate detection of DA neurotransmission may contribute useful comprehensions into this function and this substantial information may in turn be beneficial in the design of treatment for illnesses related to DA systems [16].
It is essential to design simple and quick devices for DA detection [17], using various methods such as spectrophotometry [18], high performance liquid chromatography (HPLC) [19], and ion chromatography [20]. Despite the high specificity and sensitivity of these methods, they are time-consuming and also require expensive and sophisticated instrumentation. Electrochemical approaches provide a simple, highly sensitive, and rapid solution for the detection of multiple analytes on-line and in situ on the field [21]. DA is an easily oxidizable compound and this makes its quantitative determination possible by the use of electrochemical methods through its two electron oxidation reaction [22].
Point-of-care (POC) devices provide a benefit in health care especially for diagnostics purposes. POC devices display numerous advantages, like a quick, cheap and accurate response and portability. The major advantage of a POC diagnostic device is the capability to examine different analytes in complex samples in small volumes in situ [23,24]. The development of these small portable devices focuses on the use of state-of-the-art micro-fabrication techniques, through the utilization of automated sample preparation, detection of signals, assay steps and analysis [25].
Three-dimensional printing constitutes an inexpensive technology that allows the creation of sophisticatedly shaped bodies in short time span. Moreover, it provides fast manufacturing, including engineering applications [26,27,28]. Polymers that are used in 3D printing technology depend on specific characteristic required for microfabricated devices (e.g., polydimethylsiloxanepolyurethane (PDMS), polycarbonate, polymethyl methacrylate (PMMA), polystyrene and polyethylene terephthalate glycol (PETG)) [29,30,31,32]. Mehta et al. [33] have reported an assembly comprised of PDMS and rigid polymers for the construction of a perfusion biocompatible system. More specifically, they fabricated PETG channels bonded to flexible PDMS membranes for studies of stem and embryonic cell differentiation, cancer and ischemia.
In this study, two silver (Ag) electrodes were embedded in a 3D-printed PETG well for impedance analysis measurements on immobilized N2a mouse neuroblastoma cells treated with DA. Two different cell immobilization systems were used, allowing for either 2D or 3D cell spatial ordering. In this way, the application of electric impedance analysis on an in vitro system mimicking in vivo conditions was possible.

2. Materials and Methods

2.1. Theory

During the impedance measurement procedure, a frequency-dependent excitation signal is implemented to the system in order to measure the response [1]. This system can be an electrical circuit that is used to characterize the cellular electrical properties. Both resistance and capacitance prevail the cell properties as determined by the cellular structure. In lower frequencies, cell membrane is immune to the electric field. As frequency increases, currents start to penetrate the cytosol and thus the cytoplasm and the membrane are represented by a resistor and a capacitor respectively, that constitute a circuit model [2]. Then, the complex impedance of the system can be calculated in Equation (1) [1]. More specifically,
Z(ω) = (U(ω))/(I(ω)) = ZRE + j ZIM,
where j = √(−1) and ω defines the frequency. The real part of the complex impedance represents the resistance and respectively the imaginary part reactance. The calculation of magnitude and phase angle are shown in Equations (2) and (3).
|Z|= √((ZRE) 2 + (ZIM)2),
θ = arctan (ZIM/ZRE),
In most cases, cells can be found in a medium as suspensions or adherent to a substrate. The approaches of cell measurements vary under these statuses and as a result there are different models of these sub-techniques though sharing fundamental theories [1].

2.2. Cells Preparation/ Immobilization

Mouse neuroblastoma (N2a) cell line was originally provided from LGC Promochem (Teddington, UK). Cells were subcultured in Dulbecco’s medium supplemented with 10% fetal bovine serum (FBS), 2mM L-glutamine and 1U μg−1 antibiotics (penicillin/streptomycin), which were purchased from Invitrogen (Carlsbad, CA, USA). All other reagents were provided from Sigma-Aldrich (Taufkirchen, Germany). The procedure followed for the cell culture is described in detail in [11,34].
For the construction of the well, PETG was used as a material for the 3D printing procedure, due to its unique transparency and its great thermal stability [35,36]. By adding 40 μL nutrient in the well, the resulting volume was 90 μL. DA solutions in double distilled water were prepared freshly on the day of each assay. For measurements, DA was applied in different concentrations (1, 10, 100, and 1000 μM). PLL was also used as immobilization matrix due to its stability in order to measure the impedance of the solution not only at the same concentrations, but also in lower concentrations. 40 μL of PLL were placed in the well and then left for 1h in the incubation chamber. In order to rinse the electrode’s well, distilled water was used. After it was dried out, cells were placed on the bottom of the well. Three-dimensional culture was performed on bactoagar gel (as an immobilization matrix) in concentration 1.2%, sterilized by autoclave (121 °C, 20 min). Briefly, 50.000 N2a cells were mixed with 50 μL of the Bactoagar gel (1% final concentration) and poured together in the well of the electrode. During the experimental procedure, the corresponding nM concentrations were also measured in order to compare the results obtained for both immobilization techniques.

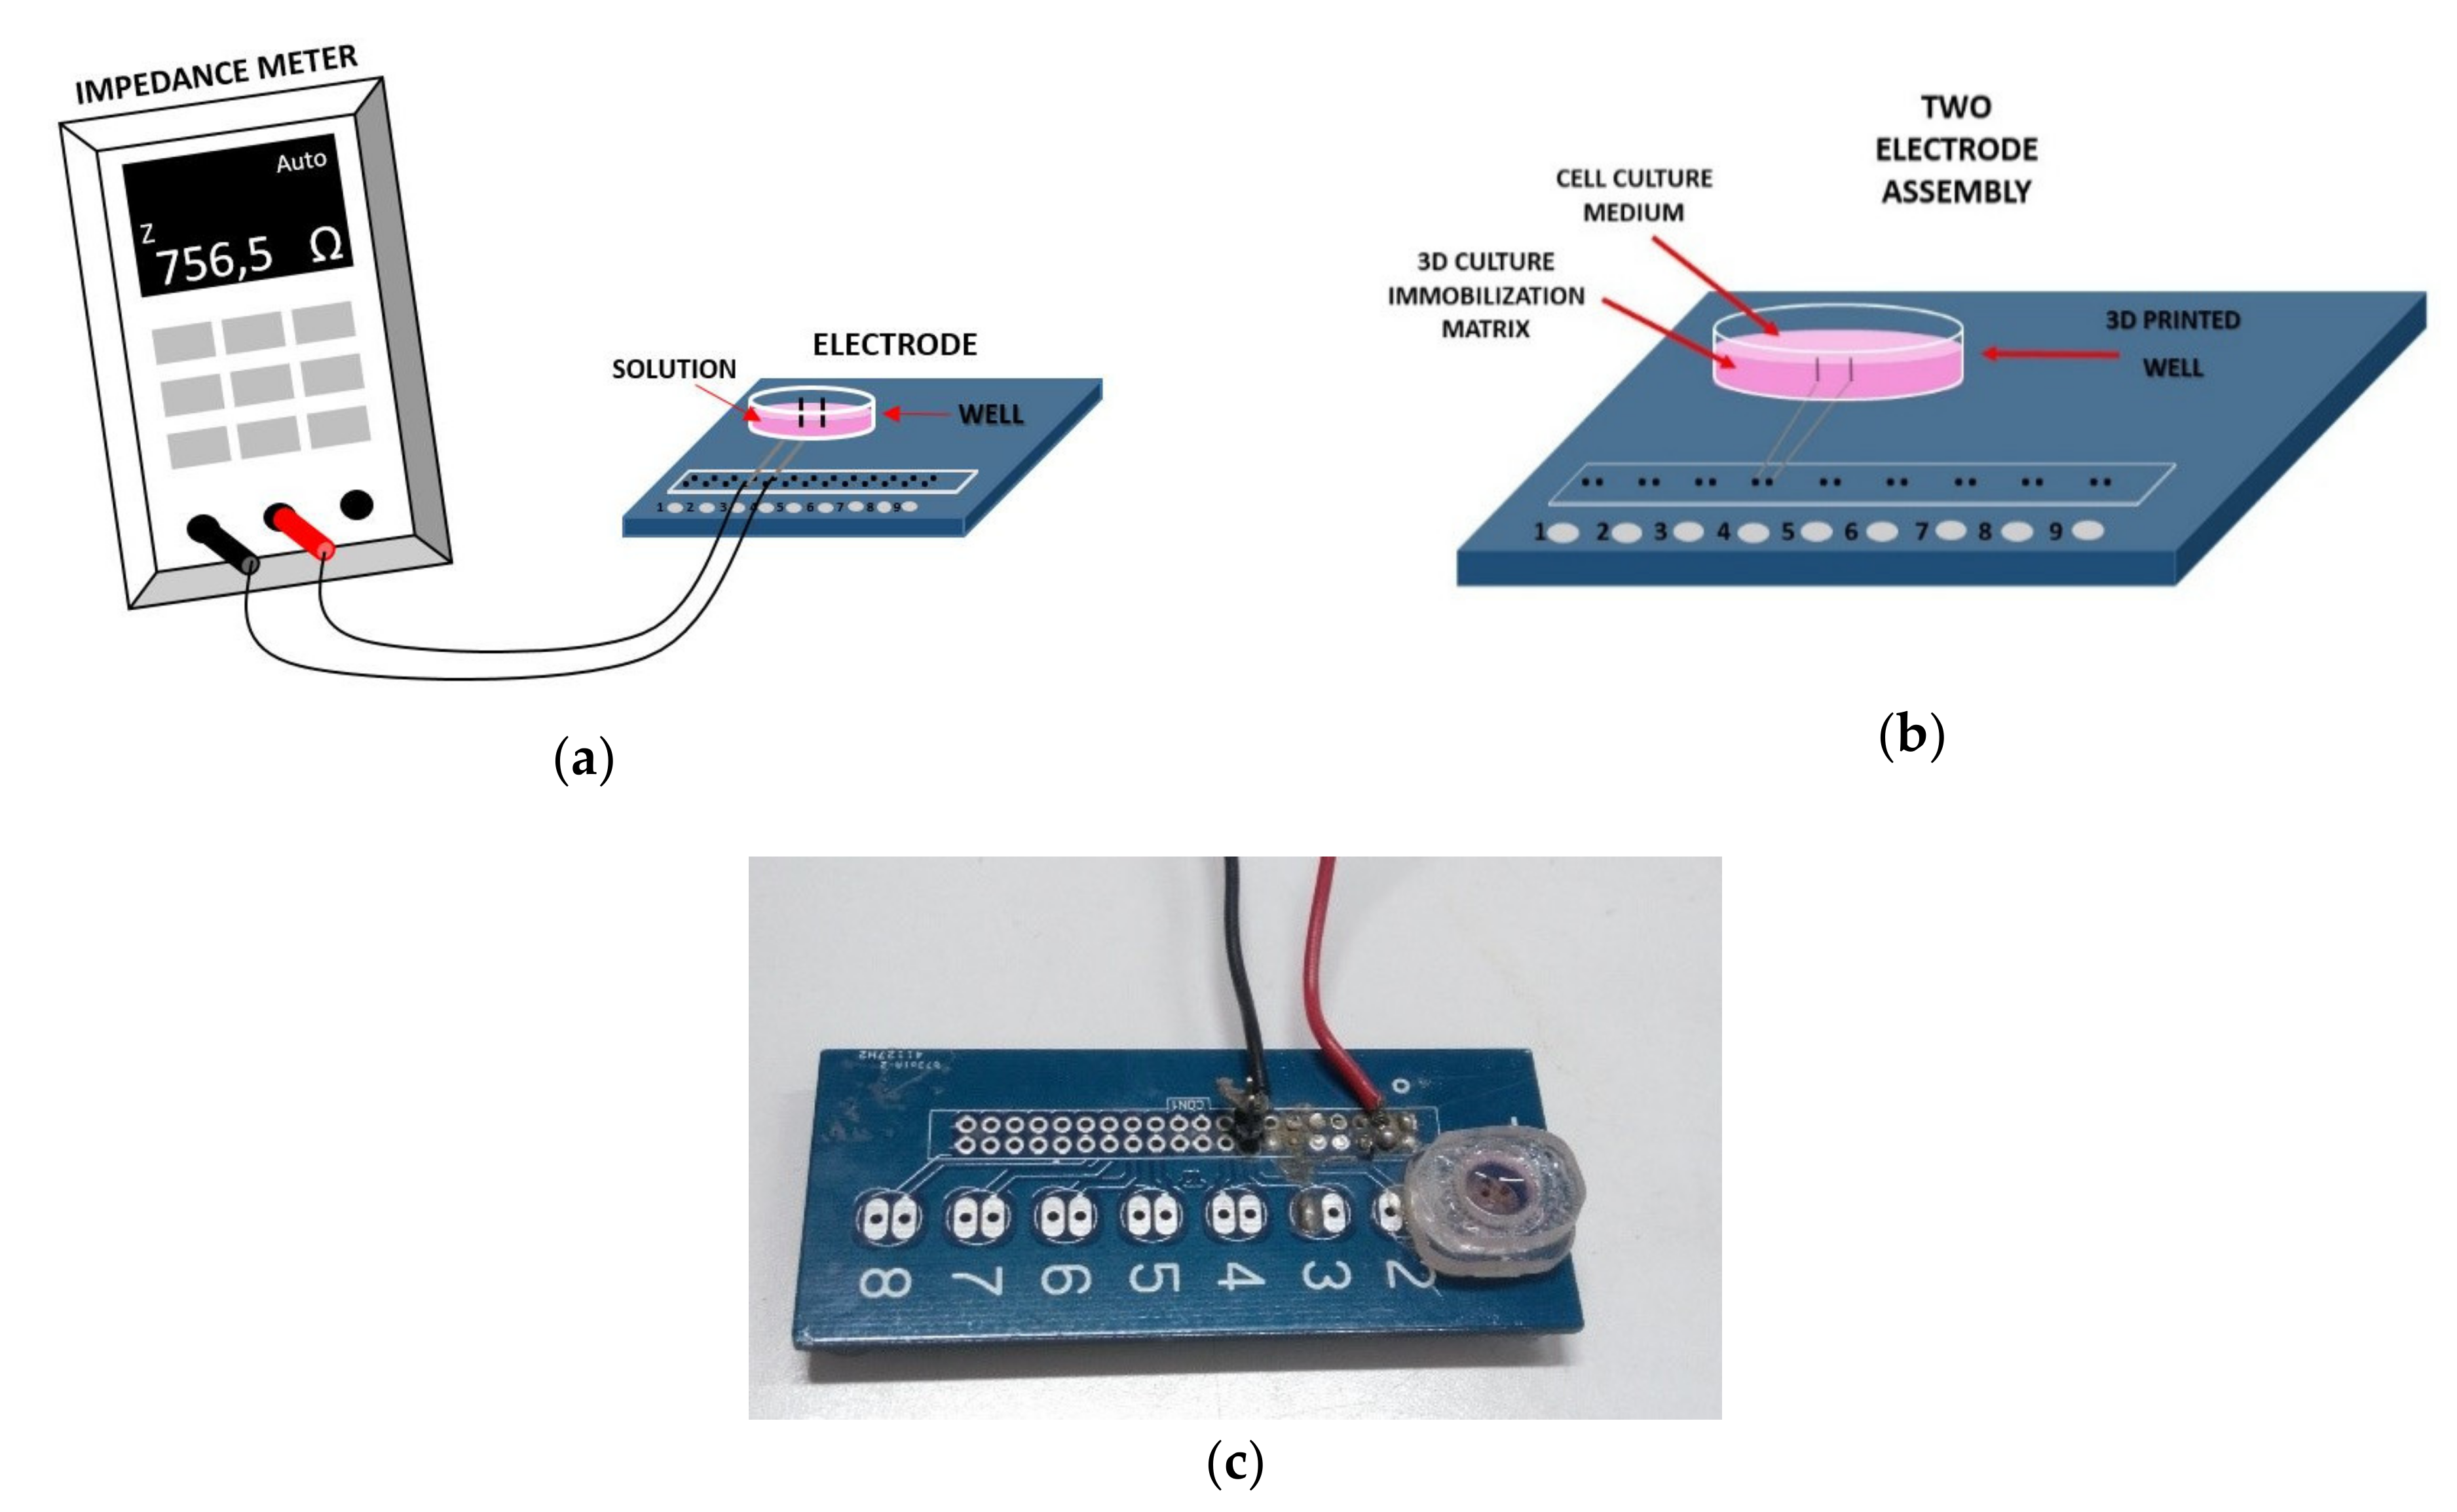
2.3. Experimental Setup

For this study, a specific electrode assembly was designed. It contains two silver (Ag) electrodes that are placed perpendicular into a custom-made transparent 3D printed well, as shown in Figure 1. The electrodes are connected to the handheld LCR meter U1733C (Figure 1a) from Keysight Technologies; the instrument is capable of directly extracting the impedance magnitude of the sample under test, allowing for measurements in five different frequencies: 100 Hz, 120 Hz, 1 KHz, 10 KHz, 100 KHz. In order to measure the impedance, a voltage of 0.74 Vrms ± 50 mVrms is applied via the two terminals to the silver electrodes. Apart from the immobilized cells, the solution in the well was either nutrient either mixture cells applied to DA. Each measurement lasted three minutes (one measurement per sec); thus, the total values obtained for each run were 180 for the measurement frequency of 1 Hz.

3. Results

This study evaluates the interactions on impedance when DA is applied onto mammalian cells using two different immobilization techniques. DA was used as a stimulant for impedance measurements on a specific type of cells and different cell populations (25.000, 50.000, 100.000). Due to previous experiments, the population chosen was 50.000. The aim is to describe the behavior of DA applied to 2D and 3D cell cultures by extracting calibration curves in various frequencies with known DA concentrations.

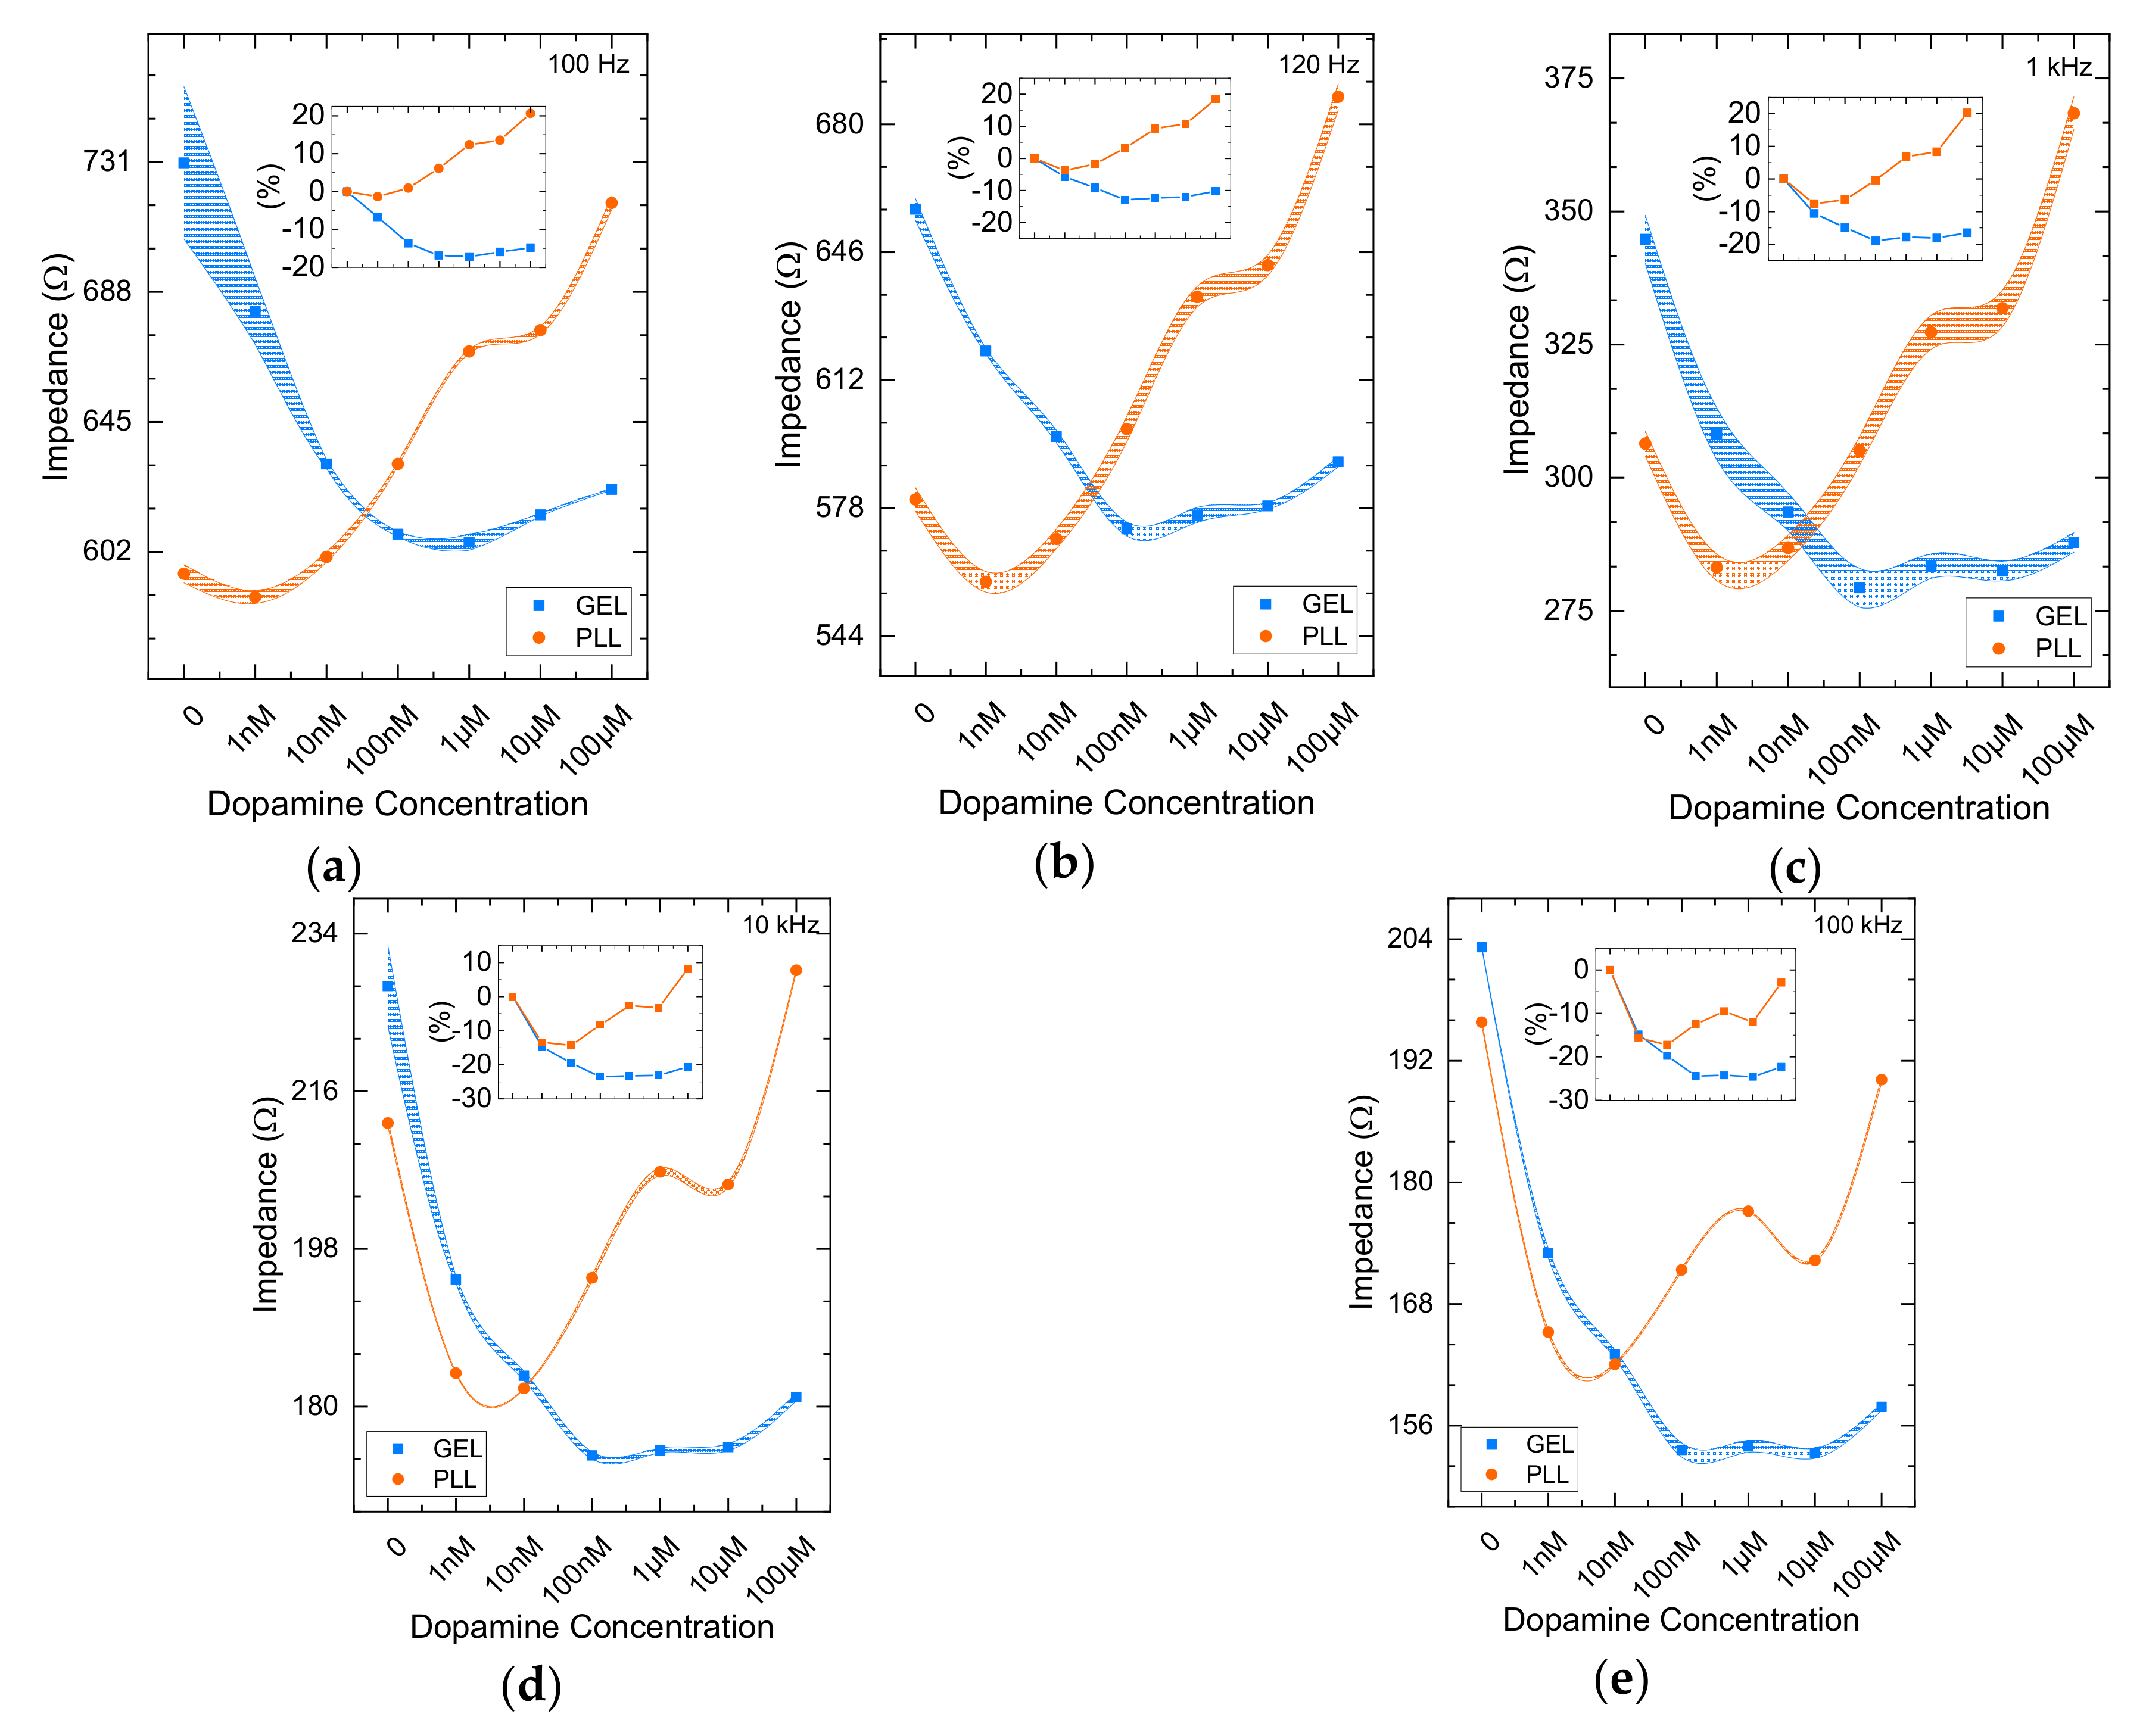
3.1. Impedance Comparative Results from 2D and 3D Cell Cultures

During this evaluation stage, two experiments were carried out. The first experimental approach was the impedance analysis referring to immobilized cells in gel in comparison with PLL immobilization matrix. Figure 2 depicts the mean impedance (n = 3) of the immobilized cells treated to six known DA concentrations (1 nM, 10 nM, 100 nM, 1 μM, 10 μM, 100 μM) for each frequency provided by the device. In all measurements, the notation (0) in the graphs indicates the control solution, which is the nutrient medium.
As shown from recent work [37], impedance magnitude measured in various concentrations drops with increasing frequency. Though, corresponding the 3D cell culture, as the concentration increases (1 nM–100 μM), the mean impedance retains almost a constant value according to all frequencies tested, with the exception of the control solution. Gel immobilized cells (blue lines) responded in each DA concentration in a similar, if not identical pattern as frequency increases (R2 > 0.96 as shown in Table 1). On the other hand, impedance values referring to PLL-immobilized cells (orange lines) treated with DA present a different behavior compared to the gel immobilization matrix. For each frequency, a clear increase of the impedance is observed. Generally, a reducing behavior of the impedance is observed as frequency increases with the presence of gel. Additionally, significantly larger values of the impedance of the cells immobilized with PLL is indicated in frequencies below 1 KHz (Table 1). Figure 3 presents the data for all measured frequencies alongside with the error bands defined by the standard deviation.

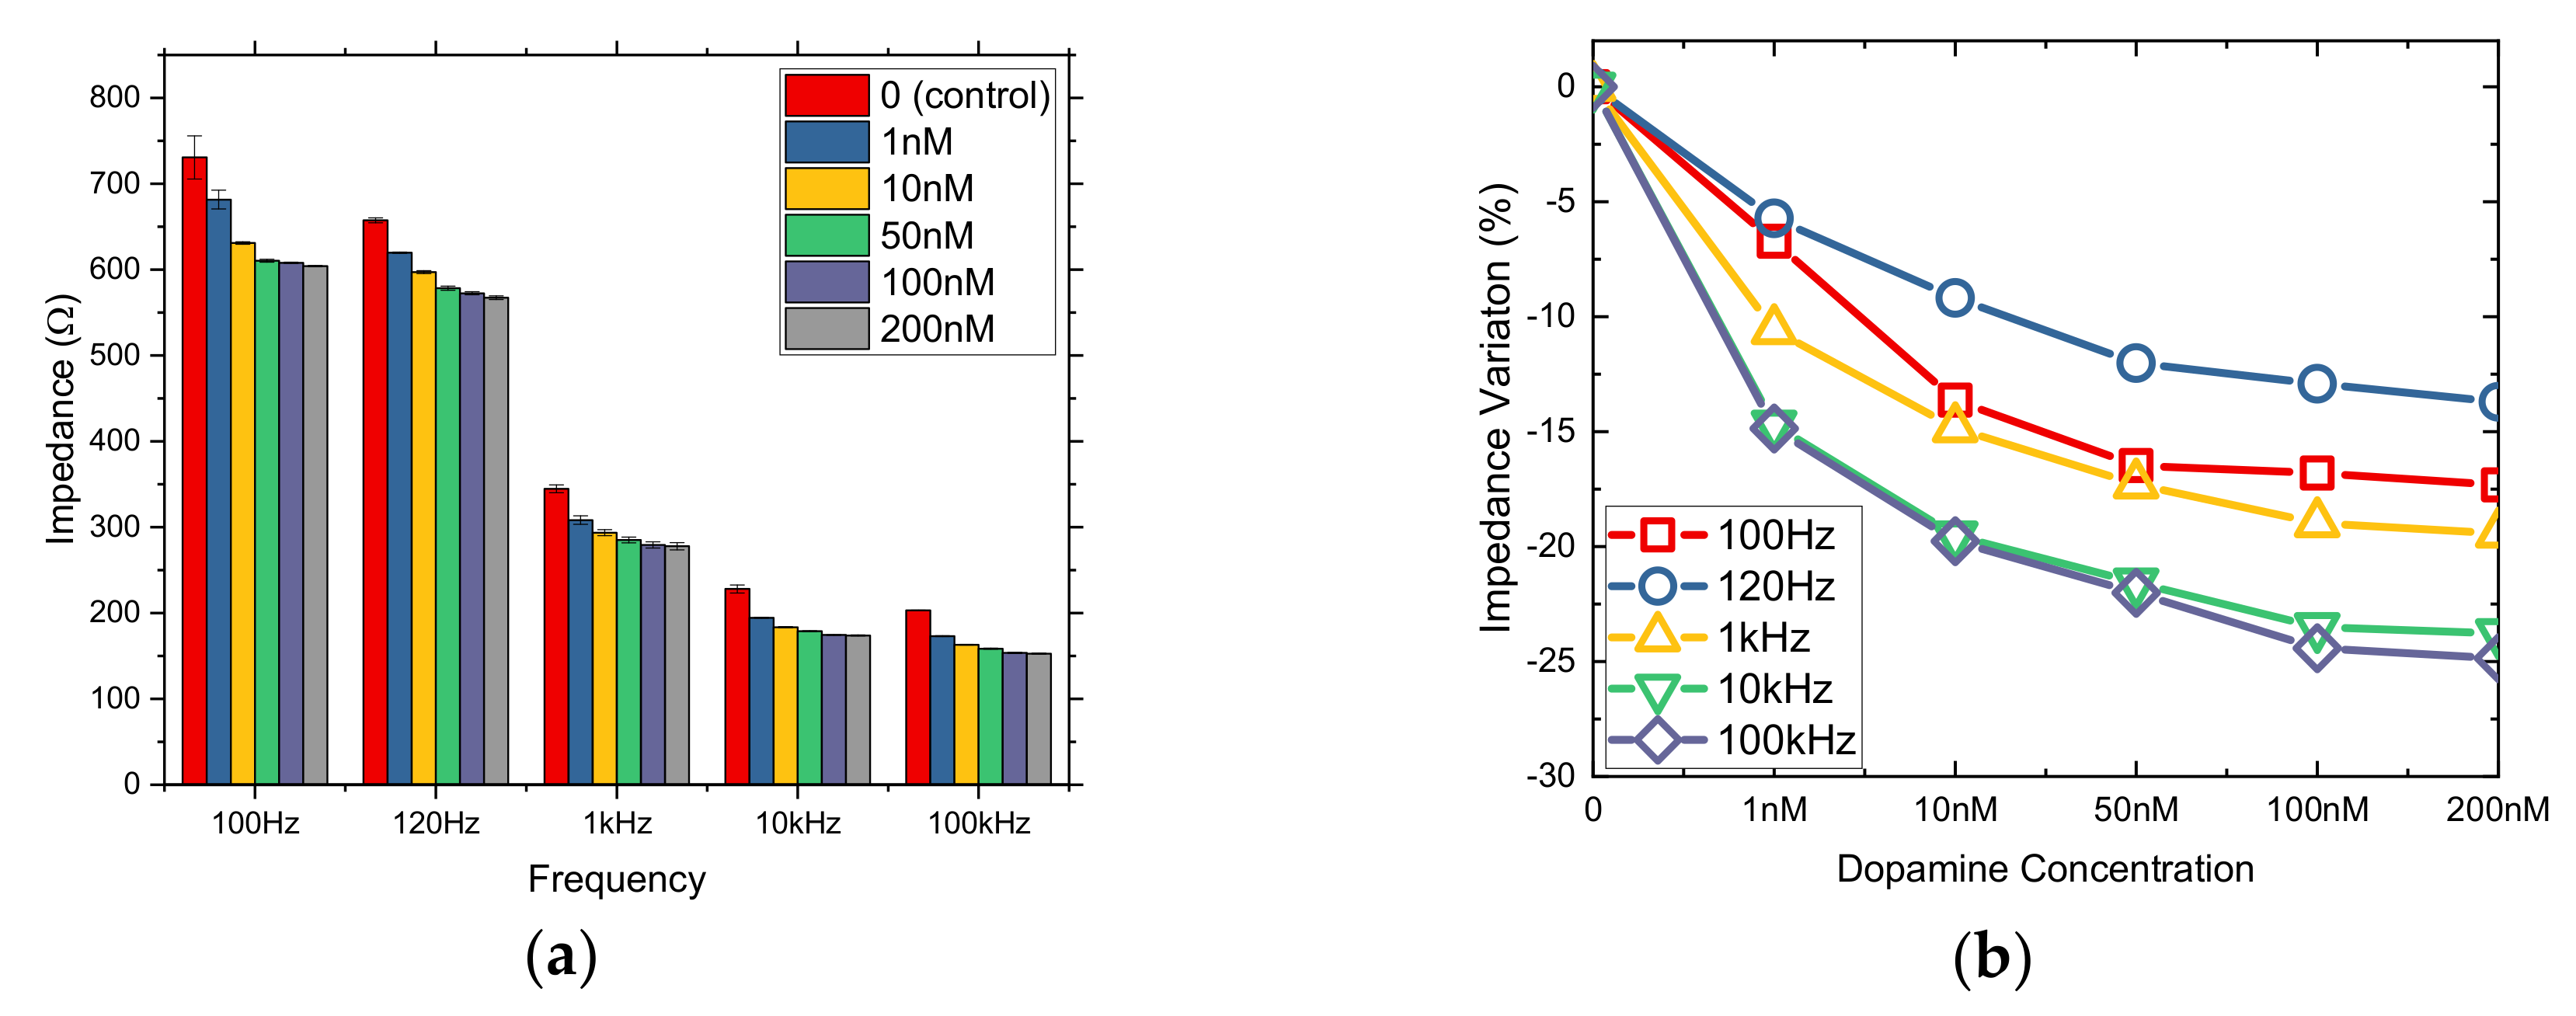
3.2. nM DA Effects on Cells Immobilized in Bactoagar Matrix

Immobilization in Bactoagar matrix presented remarkable changes in lower DA concentrations. Thus, in this case, a various range of nM DA concentrations was applied. More specifically, 1, 10, 50, 100, and 200 nM DA concentrations were tested to 3D cell culture. Figure 4 depicts the results of the mean impedance values for these specific DA concentrations. It can be easily observed that impedance decreases as concentration increases for all five frequencies tested, with quite good R2 (Table 2), especially up to 50 nM DA. This can be explained due to the fact that cells immobilization in a gel constitutes a three-dimensional configuration, which means that cells are surrounded by the gel and thus every substance diffuses with gradation of concentration toward them.

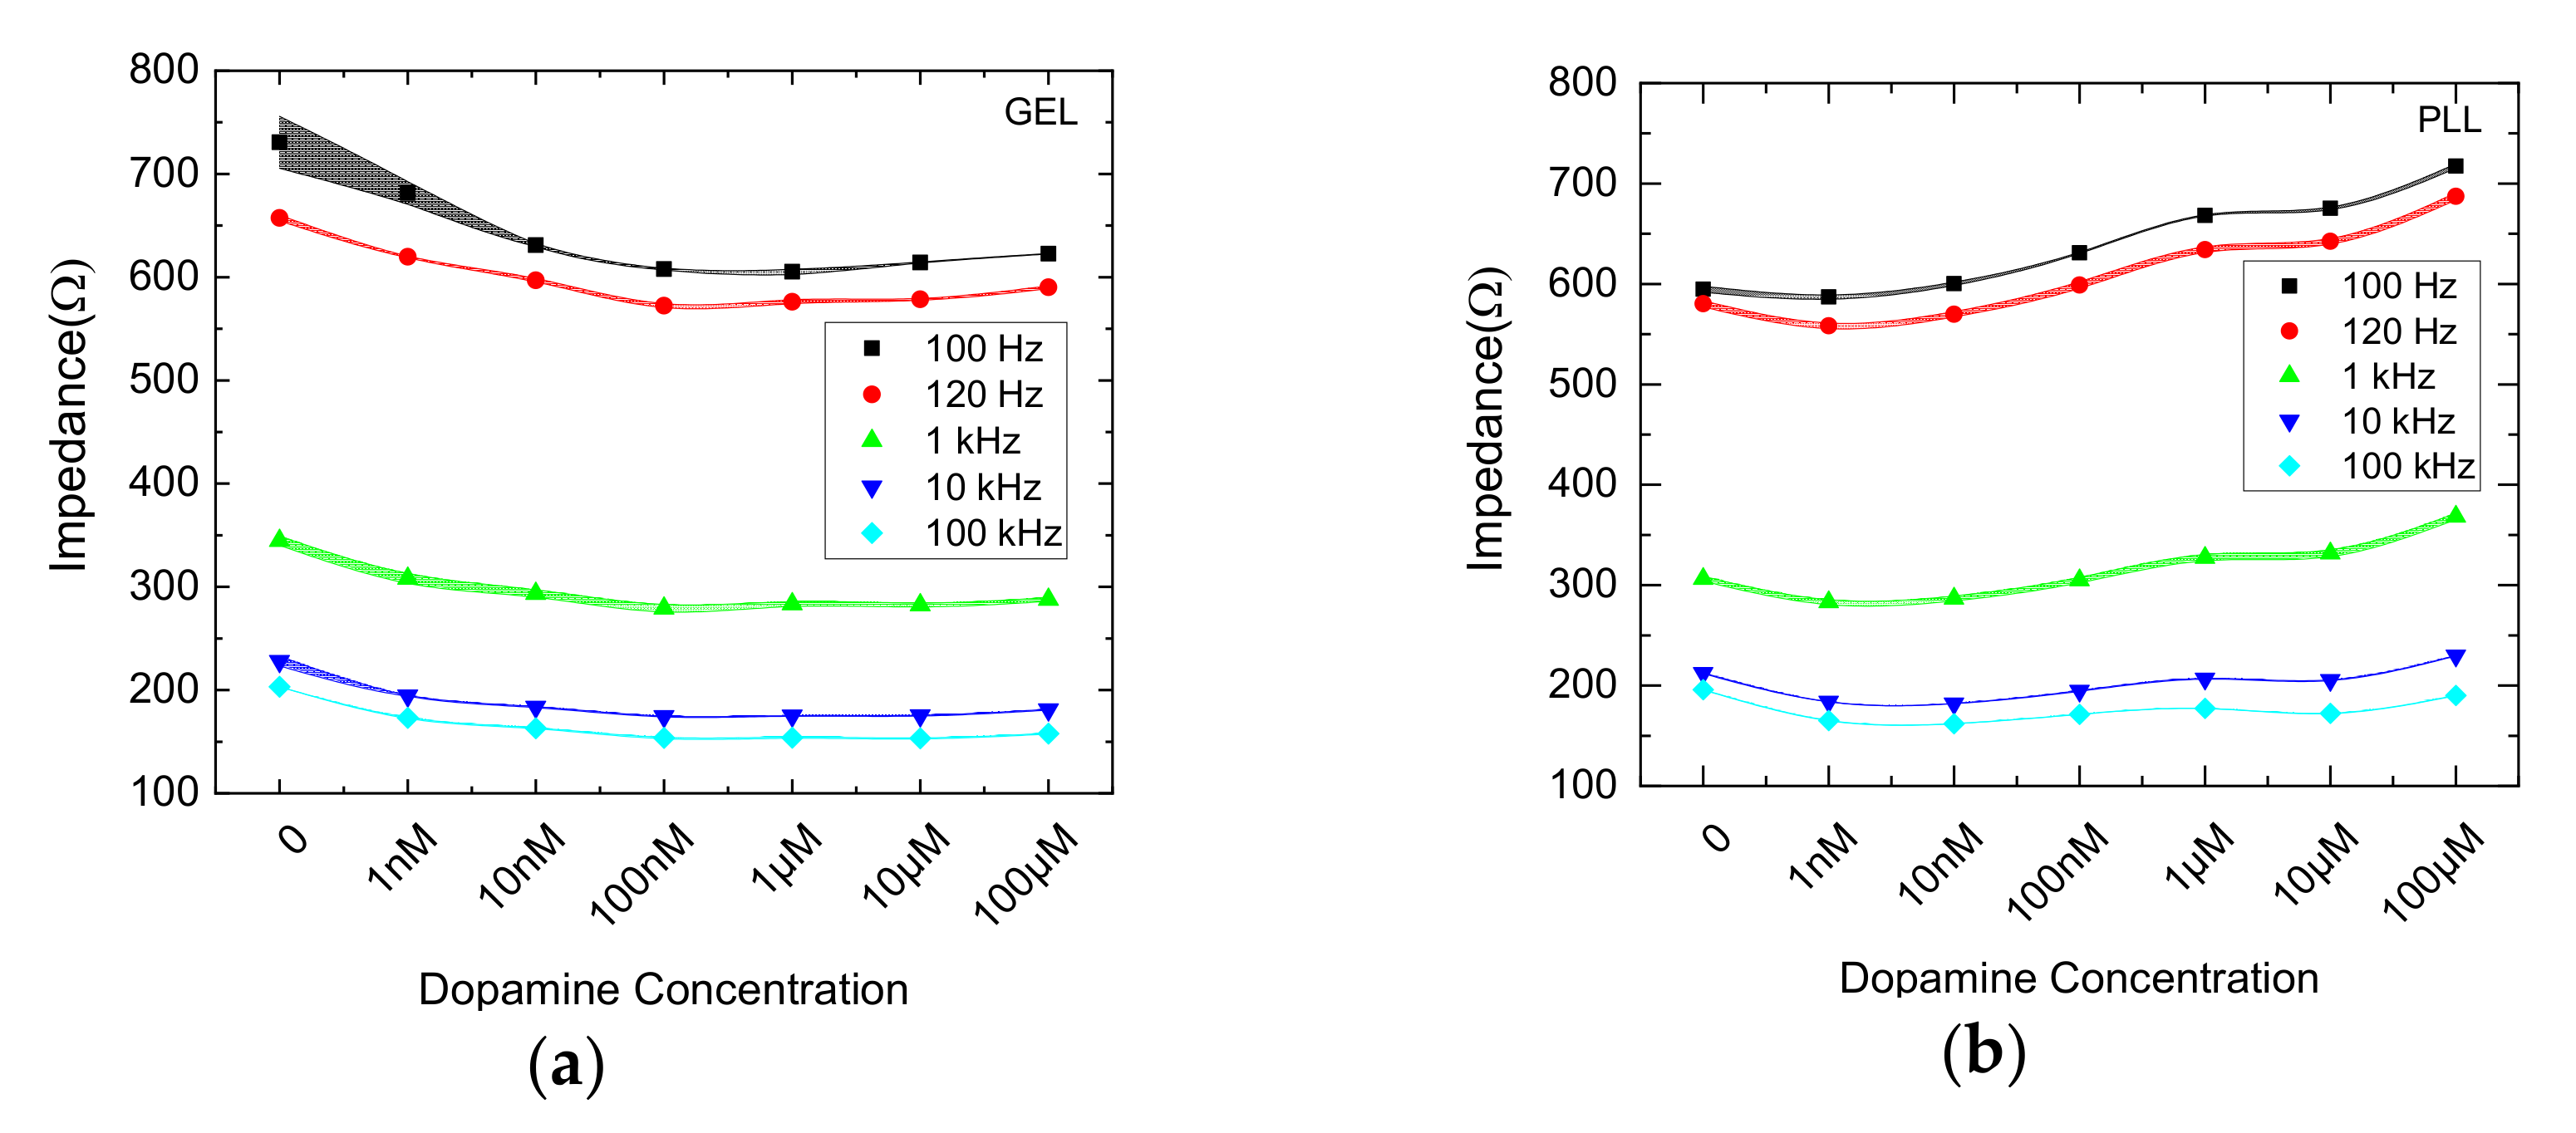
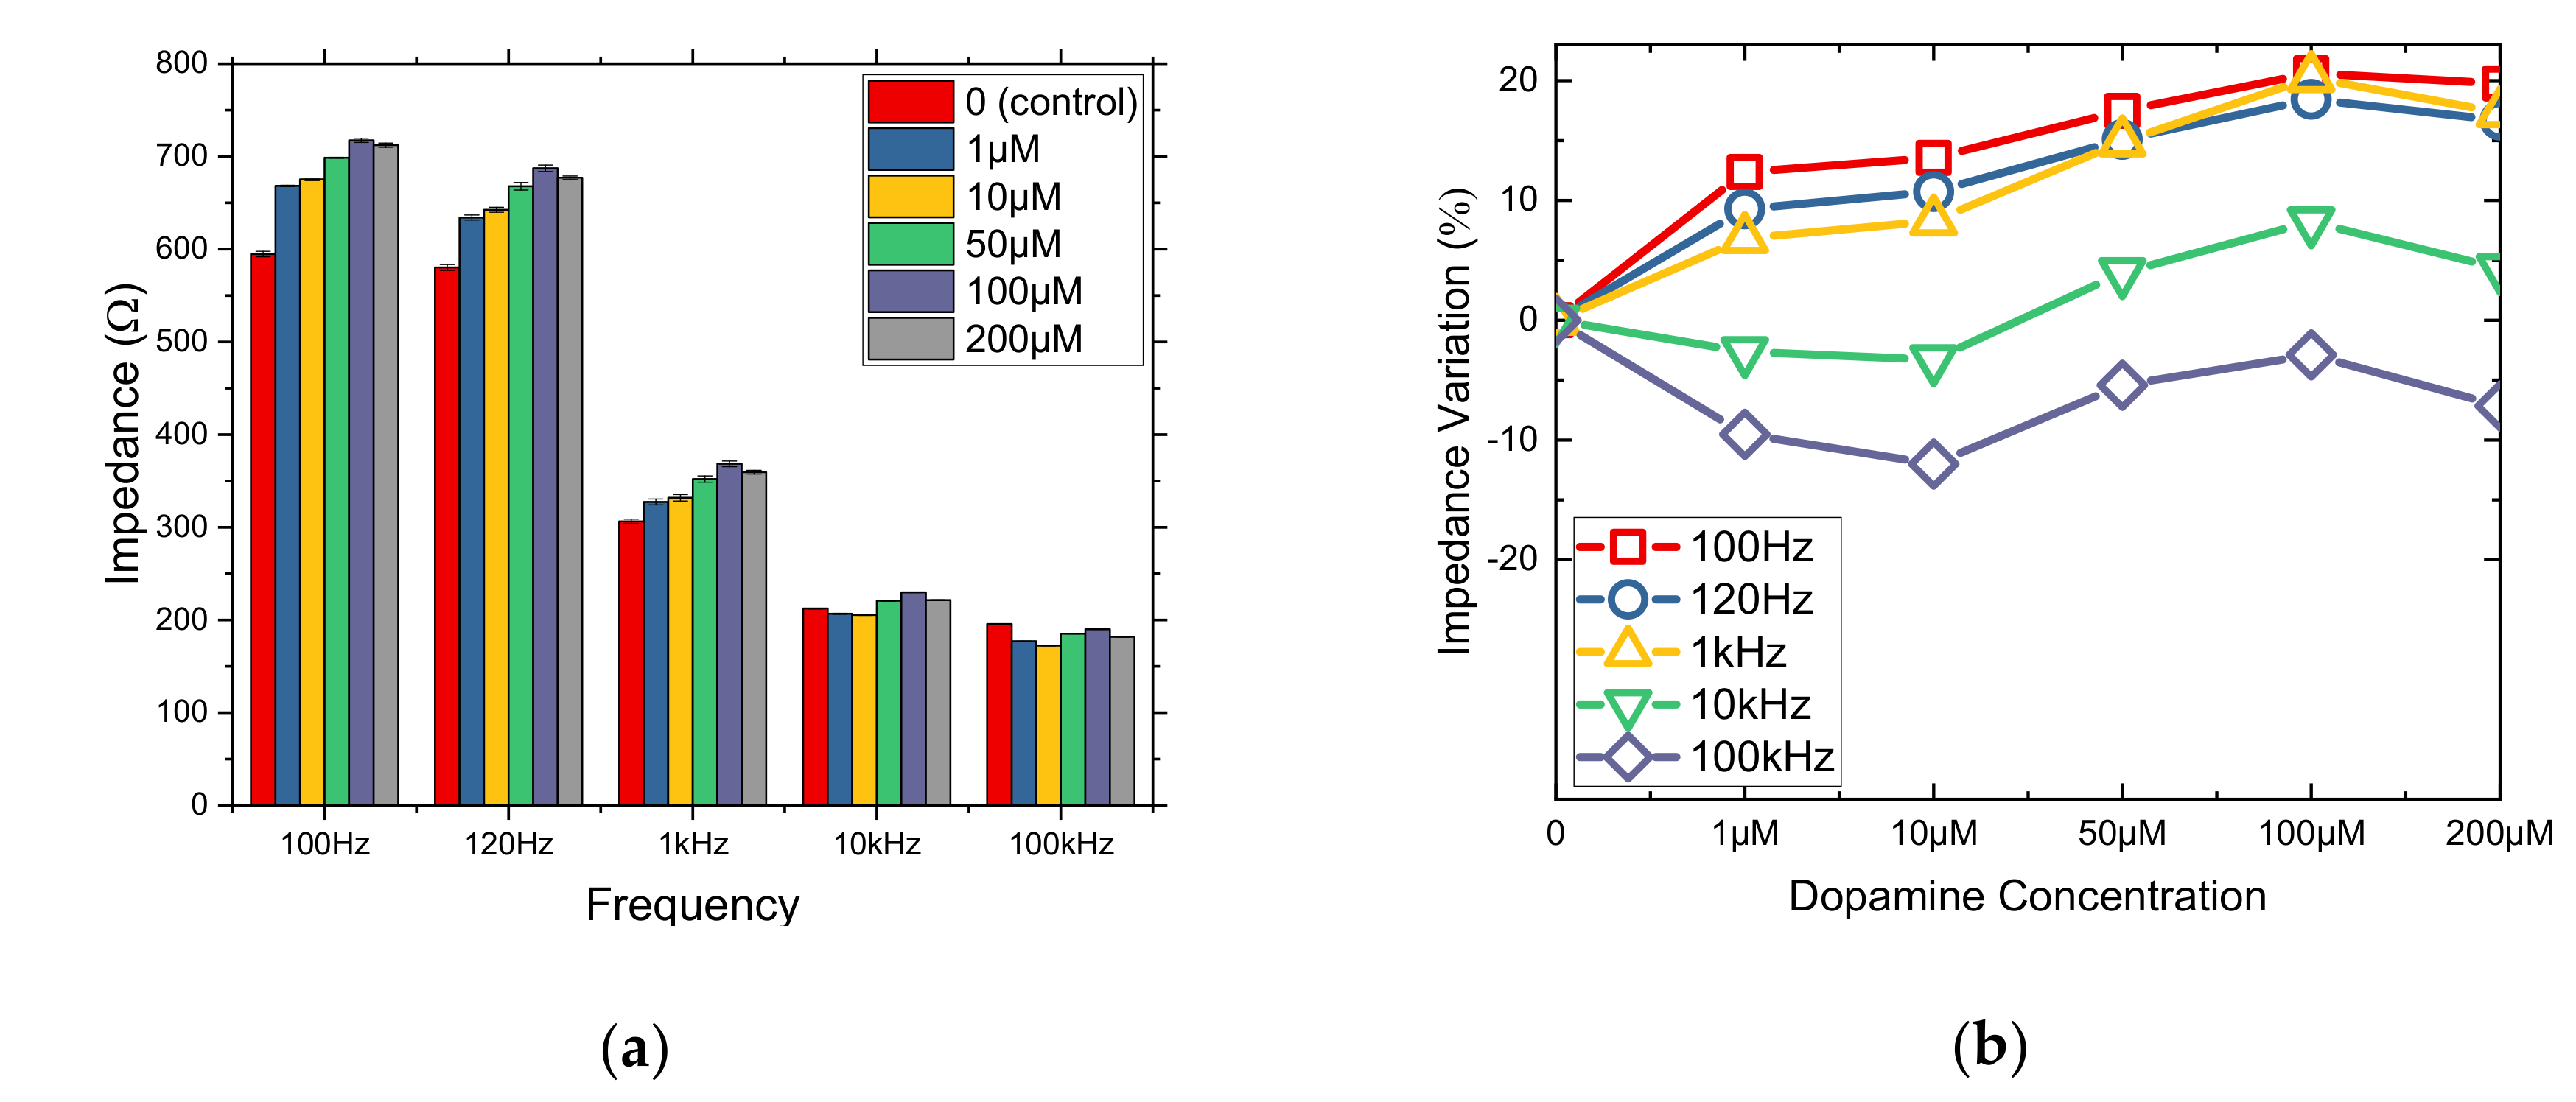
3.3. μM DA Effects on Cells Immobilized in PLL

PLL shows a great stability as an immobilization matrix. Hence, μM concentrations (1, 10, 50, 100 and 200 μM) were tested in order to make a further analysis (Figure 5), as PLL results showed almost a linear increase in concentrations between 1–100 μM DA (Figure 2).
Using PLL as an immobilization matrix, the lower DA concentrations might not be perceived from the cells due to diffusion and as a result the DA solution does not affect cells in order to reduce the impedance values. In this case, the behavior can be explained as cells immobilization using PLL is a two-dimensional immobilization which means that cells are gathered in the bottom of the electrode’s well and they come in direct contact with the solution, which is indicated from higher DA concentrations. Thus, cells with PLL react better with DA’s molecules and an impedance increase is observed in all five frequencies, especially at frequencies below 1 KHz, where R2 > 0.93 (Table 2).

4. Discussion

In bioanalytical researches, 3D printing has become a valuable technology that enables the fabrication of a plethora of analytical devices and custom-made labware in the last decade. In addition, this useful tool appears to have numerous advantages, such as ease of learning, fast manufacturing procedure, as it is able to make complex structures with satisfactory resolution. Furthermore, 3D printing technology displays a wide application field, including tissue scaffolding, biomedical engineering, pharmacodynamics/ pharmacokinetics, surgical preparation, medical and forensic science. Moreover, the use of polymeric materials has extremely fascinated commercial manufacturers, due to their low cost and easy fabrication steps, compared to silicon and glass [38,39].
In this study, an analysis on impedance system was implemented in N2a cell cultures after application to different DA concentrations. The investigation was further enriched by the study of the impedance changes in 2D or 3D cell immobilization matrices. Cells were cultured in a custom made PETG 3D printed well, which includes two silver electrodes used for the measurement procedure. The material for the electrode’s construction was chosen on the basis that provides non-polarization and considers to be used for clinical tests as it is associated with low noise, motion artifact and low electrode-skin impedance [40]. The results have shown the importance of impedance observed under different cell immobilization regimes, as it provides differential responses when frequency is applied. More specifically, referring to the 3D cell immobilization, impedance shows lower values as concentration increases, while larger impedance values are observed with increased concentration corresponding to the 2D immobilization matrix. Shavali et al. demonstrated that a concentration of DA up to 100 μM was the minimal level that would elicit a significant loss of cell viability after following 24 h of exposure on SH-SY5Y neuroblastoma cells in 2D cultures [41]. In addition, the diffusion time of the solution in the immobilization matrix is a possible explanation due to the fact that in a specific frequency range, the solution seems to pass through either easily (PLL) or not (Bactoagar).
Thus, an increase in mean impedance values in PLL might be observed due to the direct contact of the electrodes with a more condensed cells – DA solution. Many studies have demonstrated that there is a contribution of the ions to the electric current in the external circuit. Due to a sinusoidal dependence of the external voltage on time, researchers have defined the impedance of a cell filled with KCl solution and investigated the frequency dependence of its real and imaginary parts. In general, a wide frequency range is preferred in order to improve the efficiency in impedance measurements [42]. The impedance interface of the metal-electrolyte plays a fundamental role in the low frequencies (<100 Hz) [43]. This information can be helpful for medicine evaluation that interfere DA’s absorption from cells, since the activation of D2-like receptors has been associated with inhibition of cAMP accumulation [44].
Our group is currently studying the repeatability and robustness other printed materials (such as PEDOT:PSS, whose optical transparency can be exploited for other optical measurements as well), and their interactions with the 3D-printed well and the cell cultures. Also, a wider measurement frequency is being investigated, especially for lower frequency range. We envision that the optimization of the immobilized cell impedimetric system will contribute to the analysis of the various analyte types with bioactive properties.

5. Conclusions

In this work, cell cultures were performed on a 3D-printed well for impedance analysis. More specifically, N2a cells were immobilized in two different immobilization matrices (2D and 3D) in a custom made PETG 3D printed well that includes two silver electrodes. Different DA concentrations were applied to each cell solution. The observed impedance under different cell immobilization regimes seems to have an important role, as it provides differential responses when frequency is applied. In the 3D cell immobilization case, impedance shows lower values as concentration increases, while larger impedance values are observed with increased concentration corresponding to the 2D immobilization matrix. Furthermore, it was shown that cells with PLL react better with DA’s molecules and an impedance increase is observed in all frequencies tested. By results, the significance of the impedance tested in cells immobilization matrices is emphasized, as it describes the responses of the cell medium in different frequency range. Cell culture analysis and measurements can greatly benefit from additive manufacturing processes because of its rapid time-to-protype and by allowing for flexible, ad-hoc design of both the tools and the sensors required.

Author Contributions

Conceptualization—G.K. and S.K.; Data curation—D.B.; Formal analysis—G.P. and T.A.; Investigation—G.P., T.A., and S.M.; Methodology—G.K. and S.K.; Resources—T.A., and S.M.; Validation—G.P.; Visualization—D.B..

Funding

This research received no external funding.

Conflicts of Interest

The authors declare no conflict of interest.

References

  1. Xu, Y.; Xie, X.; Duan, Y.; Wang, L.; Cheng, Z.; Cheng, J. A review of impedance measurements of whole cells. Biosens. Bioelectron. 2016, 77, 824–836. [Google Scholar] [CrossRef]
  2. Tsai, S.L.; Wang, M.H. 24-h observation of a single HeLa cell by impedance measurement and numerical modeling. Sensor. Actuators B Chem. 2016, 229, 225–231. [Google Scholar] [CrossRef]
  3. Morgan, H.; Sun, T.; Holmes, D.; Gawad, S.; Green, N.G. Single cell dielectric spectroscopy. J. Phys. D Appl. Phys. 2007, 40, 61–70. [Google Scholar] [CrossRef]
  4. Valero, A.; Braschler, T.; Renaud, P. A unified approach to dielectric single cell analysis: Impedance and dielectrophoretic force spectroscopy. Lab. Chip. 2010, 10, 2216–2225. [Google Scholar] [CrossRef] [PubMed]
  5. Noveletto, F.; Bertemes Filho, P.; Dutra, D.; Soares, A.V. Low-cost body impedance analyzer for healthcare applications. In Proceedings of the II Latin American Conference on Bioimpedance, Montevideo, Uruguay, 30 September–2 October 2015; pp. 56–59. [Google Scholar]
  6. Salvadore, G.; van der Veen, J.W.; Zhang, Y.; Marenco, S.; Machado-Vieira, R.; Baumann, J.; Ibrahim, L.A.; Luckenbaugh, D.A.; Shen, J.; Drevets, W.C.; et al. An investigation of amino-acid neurotransmitters as potential predictors of clinical improvement to ketamine in depression. Int. J. Neuropsychop. 2012, 15, 1063–1072. [Google Scholar] [CrossRef] [PubMed]
  7. Marc, D.T.; Ailts, J.W.; Campeau, D.C.A.; Bull, M.J.; Olson, K.L. Neurotransmitters excreted in the urine as biomarkers of nervous system activity: Validity and clinical applicability. Neurosci. Biobehav. R. 2011, 35, 635–644. [Google Scholar] [CrossRef] [PubMed]
  8. Nurullah, S.; Tague, S.E.; Lunte, C. Analysis of amino acid neurotransmitters from rat and mouse spinalcords by liquid chromatography with fluorescence detection. J. Pharmaceut. Biomed. 2015, 107, 217–222. [Google Scholar]
  9. Yoetz-Kopelman, T.; Dror, Y.; Shacham-Diamand, Y.; Freeman, A. Cells-on-Beads: A novel immobilization approach for the construction of whole-cell amperometric biosensors. Sensor. Actuators B Chem. 2016, 232, 758–764. [Google Scholar] [CrossRef]
  10. Asphahani, F.; Zhang, M. Cellular impedance biosensors for drug screening and toxin detection. Analyst 2007, 132, 835–841. [Google Scholar] [CrossRef]
  11. Wang, H.S.; Li, T.H.; Jia, W.L.; Xu, H.Y. Highly selective and sensitive determination of dopamine using a Nafion/carbon nanotubes coated poly(3-methylthiophene) modified electrode. Biosens. Bioelectron. 2006, 22, 664–669. [Google Scholar] [CrossRef]
  12. Song, W. Dopamine sensor based on molecularly imprinted electrosynthesized polymers. J. Solid State Electr. 2010, 14, 1909–1914. [Google Scholar] [CrossRef]
  13. Glezer, A.; Bronstein, M.D. Hyperprolactinemia. In Endotext; De Groot, L.J., Chrousos, G., Dungan, K., Feingold, K.R., Grossman, A., Hershman, J.M., Koch, C., Korbonits, M., McLachlan, R., New, M.J., et al., Eds.; MDText.com, Inc.: South Dartmouth, MA, USA, 2000. [Google Scholar]
  14. Komathi, S.; Gopalan, A.; Lee, K.P. Nanomolar detection of dopamine at multi-walled carbon nanotube grafted silica network/gold nanoparticle functionalised nanocomposite electrodes. Analyst 2010, 135, 397–404. [Google Scholar] [CrossRef] [PubMed]
  15. Adekunle, A.S.; Agboolab, B.O.; Pillayc, J.; Ozoemena, K.I. Electrocatalytic detection of dopamine at single-walled carbon nanotubes–iron (III) oxide nanoparticles platform. Sensor. Actuators B Chem. 2010, 148, 93–102. [Google Scholar] [CrossRef]
  16. Wightman, R.M.; May, L.J.; Michael, A.C. Detection of dopamine dynamics in the brain. Anal. Chem. 1988, 60, 769–779. [Google Scholar] [CrossRef]
  17. Łuczak, T. Preparation and characterization of the dopamine film electrochemically deposited on a gold template and its applications for dopamine sensing in aqueous solution. Electrochim. Acta 2008, 53, 5725–5731. [Google Scholar] [CrossRef]
  18. Li, Q.; Li, J.; Yanga, Z. Study of the sensitization of tetradecyl benzyl dimethyl ammonium chloride for spectrophotometric determination of dopamine hydrochloride using sodium 1,2-naphthoquinone-4-sulfonate as the chemical derivative chromogenic reagent. Anal. Chim. Acta 2007, 583, 147–152. [Google Scholar] [CrossRef]
  19. Muzzi, C.; Bertocci, E.; Terzuoli, L.; Porcelli, B.; Ciari, I.; Pagani, R.; Guerranti, R. Simultaneous determination of serum concentrations of levodopa, dopamine, 3-O-methyldopa and α-methyldopa by HPLC. Biomed. Pharmacother. 2008, 62, 253–258. [Google Scholar] [CrossRef]
  20. Heidbreder, C.A.; Lacroix, L.; Atkins, A.R.; Organ, A.J.; Murray, S.; West, A.; Shah, A.J. Development and application of a sensitive high performance ion-exchange chromatography method for the simultaneous measurement of dopamine, 5-hydroxytryptamine and norepinephrine in microdialysates from the rat brain. J. Neurosci Meth. 2001, 112, 135–144. [Google Scholar] [CrossRef]
  21. Jo, S.; Jeong, H.; Bae, S.R.; Jeon, S. Modified platinum electrode with phytic acid and single-walled carbon nanotube: Application to the selective determination of dopamine in the presence of ascorbic and uric acids. Microchem. J. 2008, 88, 1–6. [Google Scholar] [CrossRef]
  22. Henstridge, M.C.; Dickinson, E.J.F.; Aslanoglu, M.; Batchelor-McAuley, C.; Compton, R.G. Voltammetric selectivity conferred by the modification of electrodes using conductive porous layers or films: The oxidation of dopamine on glassy carbon electrodes modified with multiwalled carbon nanotubes. Sensor. Actuators B Chem. 2010, 145, 417–427. [Google Scholar] [CrossRef]
  23. Luppa, P.B.; Müller, C.; Schlichtiger, A.; Schlebusch, H. Point-of-care testing (POCT): Current techniques and future perspectives. Trends Anal. Chem. 2011, 30, 887–898. [Google Scholar] [CrossRef]
  24. Gubala, V.; Harris, L.F.; Ricco, A.J.; Tan, M.X.; Williams, D.E. Point of care diagnostics: Status and future. Anal. Chem 2012, 84, 487–515. [Google Scholar] [CrossRef] [PubMed]
  25. Srinivasan, B.; Tung, S. Development and Applications of Portable Biosensors. J. Lab. Autom. 2015, 20, 365. [Google Scholar] [CrossRef] [PubMed]
  26. Kitson, P.J.; Rosnes, M.H.; Sans, V.; Dragone, V.; Cronin, L. Configurable 3D-printed millifluidic and microfluidic ’lab on a chip’ reactionware devices. Lab. Chip 2012, 12, 183267–183271. [Google Scholar] [CrossRef] [PubMed]
  27. Waldbaur, A.; Rapp, H.; Lange, K.; Rapp, B.E. Let there be chip—towards rapid prototyping of microfluidic devices: One-step manufacturing processes. Anal. Methods 2011, 3, 2681–2716. [Google Scholar] [CrossRef]
  28. Munshi, A.S.; Martin, R.S. Microchip-Based Electrochemical Detection using a 3-D Printed Wall-Jet Electrode Device. Analyst 2016, 141, 862–869. [Google Scholar] [CrossRef]
  29. Kwon, K.W.; Park, M.C.; Lee, S.H.; Kim, S.M.; Suh, K.Y.; Kim, P. Soft lithography for microfluidics: A review. Biochip J. 2008, 2, 1–11. [Google Scholar]
  30. Liu, K.; Fan, Z.H. Thermoplastic microfluidic devices and their applications in protein and DNA analysis. Analyst 2011, 136, 1288–1297. [Google Scholar] [CrossRef]
  31. Becker, H.; Nevitt, M.; Gray, B.L. Selecting and designing with the right thermoplastic polymer for your microfluidic chip: A close look into cyclo-olefin polymer. Microfluid. BioMEMS Med. Microsyst. XI 2013, 8615, 86150F. [Google Scholar]
  32. Bhattacharyya, A.; Klapperich, C.M. Thermoplastic microfluidic device for on-chip purification of nucleic acids for disposable diagnostics. Anal. Chem. 2006, 78, 788–792. [Google Scholar] [CrossRef]
  33. Mehta, G.; Lee, J.; Cha, W.; Tung, Y.C.; Linderman, J.J.; Takayama, S. Hard top soft bottom microfluidic devices for cell culture and chemical analysis. Anal. Chem. 2009, 81, 3714–3722. [Google Scholar] [CrossRef] [PubMed]
  34. Di Mauro, A.; Mirabella, F.; D’Urso, A.; Randazzo, R.; Purrello, R.; Fragala, M.E. Spontaneous deposition of polylysine on surfaces: Role of the secondary structure to optimize noncovalent strategies. J. Colloid Interf. Sci. 2015, 437, 270–276. [Google Scholar] [CrossRef] [PubMed]
  35. Chen, T.; Zhang, J.; You, H. Photodegradation behavior and mechanism of poly(ethylene glycol-co-1,4-cyclohexanedimethanol terephthalate) (PETG) random copolymers: Correlation with copolymer composition. RSC Adv. 2016, 6, 102778–102790. [Google Scholar] [CrossRef]
  36. Chen, T.; Zhang, J. Surface hydrophilic modification of acrylonitrile-butadiene-styrene terpolymer by poly(ethylene glycol-co-1,4-cyclohexanedimethanol terephthalate): Preparation, characterization, and properties studies. Appl. Surf. Sci. 2016, 388, 133–140. [Google Scholar] [CrossRef]
  37. Paivana, G.; Apostolou, T.; Kaltsas, G.; Kintzios, S. Study of the dopamine effect into cell solutions by impedance analysis in Conference on Bio-Medical Instrumentation and related Engineering and Physical Sciences, Athens. J. Phys. 2017, 931, 012010. [Google Scholar]
  38. Gross, B.C.; Erkal, J.L.; Lockwood, S.Y.; Chen, C.; Spence, D.M. Evaluation of 3D printing and its potential impact on biotechnology and the chemical sciences. Anal. Chem. 2014, 86, 3240–3253. [Google Scholar] [CrossRef] [PubMed]
  39. Ventola, C.L. Medical applications for 3D printing: Current and projected uses. Pharm. Ther. 2014, 39, 704–711. [Google Scholar]
  40. Albulbul, A. Evaluating major electrode types for idle biological signal measurements for modern medical technology. Bioengineering 2016, 3, 2. [Google Scholar] [CrossRef]
  41. Shavali, S.; Sens, D.A. Synergistic neurotoxic effects of arsenic and dopamine in human dopaminergic neuroblastoma SH-SY5Y cells. Toxicol. Sci. 2008, 102, 254–261. [Google Scholar] [CrossRef]
  42. Yang, L.; Dai, M.; Xu, C.; Zhang, G.; Li, W.; Fu, F.; Shi, X.; Dong, X. The frequency spectral properties of electrode-skin contact impedance on human head and its frequency-dependent effects on frequency-difference eit in stroke detection from 10 Hz to 1 MHz. PloS ONE 2017, 12, e0170563. [Google Scholar] [CrossRef]
  43. Becchi, M.; Avendano, C.; Strigazzi, A.; Barbero, G. Impedance spectroscopy of water solutions: The Role of Ions at the liquid-electrode interface. J. Phys. Chem. B 2005, 109, 23444–23449. [Google Scholar] [CrossRef] [PubMed]
  44. Apostolou, T.; Moschopoulou, G.; Kolotourou, E.; Kintzios, S. Assessment of in vitro dopamine-neuroblastoma cell interactions with a bioelectric biosensor: perspective for a novel in vitro functional assay for dopamine agonist/antagonist activity. Talanta 2017, 170, 69–73. [Google Scholar] [CrossRef] [PubMed]
Figure 1. (a) Experimental setup. The electrode is connected to the LCR (Inductance (L), Capacitance (C), and Resistance (R)) meter. (b) Cross section of the cell chamber filled with 3D immobilization matrix. (c) Picture of the well and the electrodes interface.
Chemosensors 07 00006 g001
Figure 2. Mean impedance magnitude values (n = 3) for cells in 3D (blue lines) and 2D (orange lines) cultures treated with dopamine (DA) at five different frequencies: (a) 100 Hz, (b) 120 Hz, (c) 1 KHz, (d) 10 KHz, (e) 100 KHz, with ± SD values. Insets indicate the % impedance variation.
Chemosensors 07 00006 g002
Figure 3. Comparison of mean impedance magnitude values for cells in 3D (GEL) (a) and 2D (PLL) (b) cultures treated with DA at five different frequencies (100Hz/ 120Hz/ 1KHz/ 10KHz/ 100KHz), with ± SD values.
Chemosensors 07 00006 g003
Figure 4. Mean impedance values (a) and % impedance variation (b) for cells immobilized in Bactoagar matrix treated with nM DA concentrations (1, 10, 50, 100, 200 nM) at five different frequencies.
Chemosensors 07 00006 g004
Figure 5. Mean impedance values (a) and % impedance variation (b) for cells immobilized in PLL matrix treated with μM DA concentrations (1, 10, 50, 100, 200 μM) at five different frequencies.
Chemosensors 07 00006 g005
Table 1. R2 values for mean cell impedance responses in gel and polylysine (PLL) matrices after application of DA.
FrequencyR2
GELPLL
100 Hz0.98820.9649
120 Hz0.98920.9492
1 kHz0.96850.9306
10 kHz0.96270.7987
100 kHz0.96720.6571
Table 2. R2 values for mean cell impedance responses in gel for nM DA and in PLL for μM DA concentrations.
FrequencyR2
GEL (nM)PLL (μM)
100 Hz0.9210.9468
120 Hz0.9970.9612
1 kHz0.980.9358
10 kHz0.96080.5526
100 kHz0.96320.28

