Article

E-Nose Classification of Muscles in Dry-Cured Bísaro Ham Using Piercing-Assisted Volatile Extraction


1
CIMO, LASusTEC, Instituto Politécnico de Bragança, Campus de Santa Apolónia, 5300-253 Bragança, Portugal
2
Department of Food Hygiene and Technology, University of León, Campus Vegazana S/N, 24007 León, Spain
*
Author to whom correspondence should be addressed.
Chemosensors 2026, 14(7), 158; https://doi.org/10.3390/chemosensors14070158
Submission received: 28 April 2026 / Revised: 26 June 2026 / Accepted: 7 July 2026 / Published: 10 July 2026
(This article belongs to the Topic Advances in Analysis of Food and Beverages, 2nd Edition)

Abstract

This study evaluated the use of an E-nose using a piercing-assisted volatile extraction as a practical and non-destructive tool for distinguishing between three muscle types (biceps femoris—BF; semitendinosus—ST; and semimebranosus—SM) in 30-month ripened dry-cured Bísaro hams (n = 23). The muscles were analyzed for volatile organic compounds (VOC) using gas chromatography-mass spectrometry (GC-MS) and for signal profiles obtained from an E-nose system composed of metal oxide (SnO2) sensors. Sensor signals were standardized using Z-score normalization prior to chemometric modeling. Linear discriminant analysis (LDA) was used to evaluate the capability of the MOS-based E-nose to differentiate the VOC profiles of Bísaro ham across its main muscle types. The model trained on Z-score-standardized sensor signals achieved classification accuracies of 94.3% and 80.0% for the training and external test sets, respectively, demonstrating good predictive performance and robustness. When compared with the VOC-based LDA model (94.4% and 78.6% for the training and test sets, respectively), the E-nose showed comparable classification performance and slightly higher predictive capability in the external validation set. The first two discriminant functions explained 88.01% and 11.99% of the discriminant variance, respectively, indicating that most of the discrimination occurred along a single dominant axis. To chemically interpret the sensor-based discrimination, multiple linear regression models were established between the LDA scores and VOC concentrations. The first discriminant function was significantly associated with compounds related to lipid oxidation and aroma development, particularly 2-pentylfuran, butanoic acid, hexanoic acid, hexanal, and benzaldehyde (R2 = 0.617; p < 0.001), whereas the second discriminant function showed a weaker but significant relationship with hexanal, 3-methylbutanal, butanoic acid, and hexanoic acid (R2 = 0.202; p = 0.006). These findings demonstrate that the E-nose is capable of capturing meaningful chemical information associated with muscle-specific volatile profiles and can provide a rapid, non-destructive, and cost-effective alternative for the characterization and classification of dry-cured Bísaro ham.

1. Introduction

Dry-cured Bísaro ham is a traditional cured meat product from the Trás-os-Montes region in northeastern Portugal, where its longstanding tradition of consumption persists [1]. Safeguarded by a protected geographical indication (PGI) designation, its consumer acceptance, much like other dry-cured hams, is driven by sensory quality [1,2]. This quality depends on both maturation conditions and factors affecting raw meat characteristics such as pig age, diet, and breed [3,4,5,6,7].
Flavor is one of the most important quality attributes of dry-cured hams, with most of its characteristics determined by specific volatile organic compounds (VOC) that comprise the aroma profile [3,8,9,10]. These VOCs may originate either from the raw materials or develop from precursors during processing and storage [11]. Consequently, the distinctive characteristics and aroma of traditional dry-cured ham are attributed to a set of key volatile compounds derived from animal feed or that arise during the ripening process. These arise through complex chemical and enzymatic reactions such as lipolysis, chemical and enzymatic oxidation, proteolysis, Strecker degradation, and Maillard reactions [8]. These chemical changes occurring during ripening also depend on the variability between anatomical regions, specifically the muscle type, which consequently influences the analytical results obtained [5].
The study of VOC in dry-cured hams is usually performed using gas chromatography-mass spectrometry (GC-MS) procedures [9]. Despite their accuracy, these conventional analyses reveal that only a limited number of volatile compounds contribute significantly to the overall aroma, while others are often below detection limits. Furthermore, conventional analytical techniques fail to respond quickly or efficiently to industrial demands, making them unsuitable for inline or real-time applications. In this context, the development of rapid, objective, and reliable methods is essential to support quality control, classification, and certification systems. To this end, an odor indicator capable of mimicking the human olfactory system, such as the electronic nose (E-nose), should be considered as a practical, non-destructive sensory tool well-suited to augment or complement conventional methodologies.
The application of electronic nose systems for VOC analysis has gained increasing attention in food quality assessment due to their rapid response and non-destructive nature. Previous studies demonstrated that E-nose devices combined with chemometric tools such as PCA and support vector machines (SVMs) can efficiently discriminate VOC patterns with high classification accuracy [12]. In the specific context of the food industry, these systems provide vital information regarding fraud, deterioration, and chemical or biological contamination [13], while offering valuable insights into animal feeding regimes, processing conditions, and composition traits of meat products [14]. Generally, a standard E-nose comprises three main components: a sample acquisition system, an array of chemical sensors, and a signal processing system for pattern recognition. The sensor array can be composed of different materials with distinct selectivities, including metal-oxide-semiconductor (MOS), field-effect metal-oxide-semiconductor transistor sensors (MOSFET), mass-sensitive sensors, conducting organic polymers (CP), solid electrolyte sensors (SESs), semiconducting polymers, and piezoelectric sensors such as BAW, surface acoustic wave (SAW), or quartz crystal microbalances (QCM) [15,16]. Optical, calorimetrical, and biosensors can also be incorporated [17]. Within the array, each gas sensor operates individually and simultaneously converts complex gas mixtures into a unique, measurable electronic signature. Through these sensor arrays, E-noses capture volatile patterns that allow recognition of similarities and differences in sample characteristics [18]. Among the available sensor types, MOS are the most widely used due to their strong commercial base, because they have sensitivity as low as 1 ppm to key flavor active compounds. Their detection mechanism is based on changes in the oxide’s electrical conductivity, which are triggered when the sensor surface interacts with oxidizing or reducing gases [19]. Therefore, this approach should not be interpreted as a direct replacement for the high sensitivity of GC-MS or human sensory perception regarding trace compounds. Instead, the sensor array captures a non-specific, global, volatile fingerprint, where the classification performance relies on pattern-based differences in the combined response to multiple VOCs rather than the detection of individual aroma-active compounds at trace concentrations.
Following measurement, the system collects E-nose signals and employs multivariate data analysis to compare sample variation against internal reference standards. This allows for sample classification [20,21,22] or the development of predictive models for sensory and physicochemical attributes [23,24]. Machine learning encompasses data-driven pattern recognition techniques used for regression or classification. Feature sets are typically split into training and testing subsets to ensure rigorous model evaluation [25]. These signals are processed by a pattern recognition module to execute specific tasks. Principally, these systems are characterized by short analysis times, ease of application and training, an absence of sensory fatigue, and rapid response signals. The E-nose is a sensitive electronic tool; therefore, in an analytical system for volatile compounds, one must consider sample preparation, the measurement method, and data analysis [26].
Despite these advances, several challenges remain, including sensor drift caused by different factors such as aging and contamination, uncontrolled experimental conditions (pressure, humidity, temperature, and gas velocity), overlapping selectivity, interfering environmental odors, signal noise, and meat sample variability [18,25,26]. Additionally, as reported by Tan et al. [27], the lack of detailed information on commonly used sensors and their operational principles complicates the interpretation of E-nose outputs beyond pattern recognition stages. To address these issues, studies have proposed methods to optimize sensor arrays, utilizing machine learning algorithms to develop robust classification or regression models so as to maintain predictive accuracy despite potential sensor failures.
For example, Laureati et al. [28] investigated the authenticity of dry-cured Italian protected designation of origin (PDO) hams, specifically Parma, San Daniele, and Toscano, using sensory, physicochemical, morphological, textural, and aromatic measurements. Their findings demonstrated that principal component analysis (PCA) of the electronic nose data clearly differentiated the PDO hams, suggesting that their aroma profiles are sufficiently distinct to verify their provenance. In contrast, Zhang et al. [29] noted that the classification of dry-cured ham using an electronic nose was not directly related to its physicochemical parameters, and that few studies have focused on the quantitative prediction of chemical constituents using this technology. Other studies have demonstrated strong predictive performance using random forest algorithms applied to fused sensor signals [30,31]. Qi, 2017 et al. [32] demonstrated that the quality of meat products is directly related to processing conditions. In their work, this effect was demonstrated by comparing meat cooked for 1 h with that cooked for 2 or 3 h. Evidence also indicates marked variability within seemingly homogeneous data sets [33], reinforcing the need for carefully structured experimental designs.
Despite significant technological advancements and the widespread application of E-noses, key aspects of dry-cured meat products, particularly traditional hams, remain under-researched and lack empirical support. Therefore, this study aims to address this gap by evaluating the capability of a MOS-based E-nose to differentiate the VOC profiles of Bísaro ham across its main muscle types, while providing a rapid and non-destructive analytical alternative for the industry.

2. Materials and Methods

2.1. Dry-Cured Bísaro Ham Samples

A total of 23 dry-cured hams, obtained from an equal number of Bísaro breed pigs from a local traditional company (Bísaro Salsicharia Tradicional; Gimonde, Bragança, Portugal), were used in this study. The three main muscles (biceps femoris—BF; semitendinosus—ST; and semimebranosus—SM) were analyzed. The standard manufacturing process for dry-cured Bísaro ham was previously described by the authors [1]. The dry-cured hams were ripened for 30 months.

2.2. Instrumental Volatile Compounds Analysis

Volatile compounds from three dry-cured ham muscles were analyzed on a GC 7890A gas chromatography (Agilent Technologies; Santa Clara, CA, USA) coupled with a MSD 5975C mass spectrometer (Agilent Technologies; Santa Clara, CA, USA) using an automated solid phase micro-extraction (SPME) technique following the procedure described by Carballo et al. [34] with brief modifications. The extraction of volatiles was carried out with a CTC Pal automated system (Agilent Technologies; Santa Clara, CA, USA) equipped with an automatic SPME injection device using a 30 min 250 °C conditioned 75 mm Carboxen/polydimethylsiloxane-1-cm-coated fused silica fiber, from 4 g of grounded ham sample placed into a 20 mL screw cap vials, which were previously incubated at 45 °C during 20 min, for a 40 min exposition period at 40 °C. A 60 m × 0.25 mm sized, 0.25 mm film thickness DB-5MS column (J&W Scientific, Folson, CA, USA) and helium (1 mL/min) were used for separation with the oven temperature being programmed at 35 °C (1 min), 35 °C to 50 °C (10 °C/min), 50 °C to 200 °C (4 °C/min), 200 °C to 250 °C (50 °C/min) and 250 °C (11 min). The mass spectrometer transfer line and ion source temperatures were 240 °C and 260 °C, respectively, and the detector operated in electron impact mode (70 eV) scanning from 40 m/z to 350 m/z at 3.94 scans/s. Identification was carried out by comparing the mass spectra with those contained in the NIST/EPA/NIH-98 Mass Spectral Database and the linear retention indexes, experimentally calculated using a series of n-alkanes, with those reported in the literature [35]. The concentrations of the identified compounds were expressed as area units (AU) × 106. The determination of these compounds was performed at the University of León (León, Spain).

2.3. E-Nose Analysis

2.3.1. Lab-Made Device

This equipment consists of 5 main components such as a gas sensor array, an air inlet opening, three sample inlet-ports, a pressure gauge and a vacuum pump, as previously described by Teixeira et al. [36]. Seventeen MOS sensors (MQ series from Zhengzhou Winsen Electronics Technology, Co., Ltd., Zhengzhou, China) were used as sensor array (MQ2; MQ2B; MQ3B; MQ4; MQ4B; MQ6; MQ5B; MQ8; MQ9B; MQ7B; MQ5; MQ9; MQ135; MQ136; MQ137; MQ138; MQ139) and their specifications are listed as Supplementary Material (Figure S1 presents the sensors used and Table S1 gives the description list of MQ gas sensors). The U-shaped configuration device is equipped with strategically positioned valves along the system, allowing for vacuum control and regulation of air or sample intake. The E-nose is connected to a heating system consisting of a water bath and hollow metal plates, where the 3 sampling bottles are adjusted.
The MQ series of semiconductor gas sensors, manufactured by Hanwei Electronics (Zhengzhou Hanwei Electronics Co., Ltd., Zhengzhou, China), were primarily based on metal oxides (mainly SnO2) and operate through changes in electrical resistance when exposed to different gases. Each sensor (Table S1) contained an internal heater that promoted chemical reactions on the surface of the sensor material. These sensors are widely used to detect combustible gases, toxic gases, and volatile organic compounds. Although each sensor exhibits preferential sensitivity to specific gases, they are not fully selective and may present cross-sensitivity. Sensors with the suffix “B” generally provide improved sensitivity and stability.
The sensors were housed in a hermetically sealed chamber, connected to the sampling flasks via manual gas valves (BUL and BUC stop manual valves, Shenzhen, China). Each sampling flask was equipped with inlet and outlet connections that allowed for the controlled transfer of headspace gases to the multisensor chamber.
A diaphragm vacuum pump (Mini 370 Air Pump, 12 V DC, Shenzhen, China) was used to generate a vacuum and purge the system during cleaning cycles; vacuum level was monitored using a digital pressure gauge (Mini Dial Air Vacuum Pressure Gauge Meter Digital Manometer, Gaqqee, Shenzhen, China). Additionally, a manual valve positioned between the gauge and the pump facilitated the detection of potential system leaks. All E-nose components (sample vials, sensor chamber, vacuum gauge, and pump) were connected via transparent PVC tubing. All electronic components, including the sensors, were powered by a switching power supply (Mean Well, New Taipei City, Taiwan). Data acquisition was performed using an Agilent Data Acquisition/Switch Unit (model 34970A, Santa Clara, CA, USA), controlled by Agilent BenchLink Data Logger 3 software (Agilent Technologies, 2012; Santa Clara, CA, USA). The system featured a temperature-controlled zone maintained at a constant 40 °C by a thermostatic circulating water bath (Tectron Bio, JP Selecta, Abrera, Spain), which provided stable heating via metal plates in contact with sample vials. This setup was designed to accommodate three sample vials simultaneously.

2.3.2. Pre-Procedures and Samples Analysis

Before introducing the sample volatiles into the sensor system, a vacuum was created inside the chamber to ensure sensor stabilization. Establishing these conditions required approximately 20 to 30 min with the circuit closed prior to vapor-phase analysis. Once the vacuum was established, the headspace gases from the sample were allowed to enter the sensor chamber through the sampling valves. The stabilization temperature and time settings were defined based on preliminary tests, resulting in the adoption of 40 °C for a minimum of 5 min as the optimal conditions. The sensors were exposed to the sample volatiles for 2 min. Following this exposure period, a 10 min cleaning cycle ensured the elimination of remaining volatile compounds and minimized cross-contamination between samples, thereby maintaining the stability and reproducibility of the sensor responses.
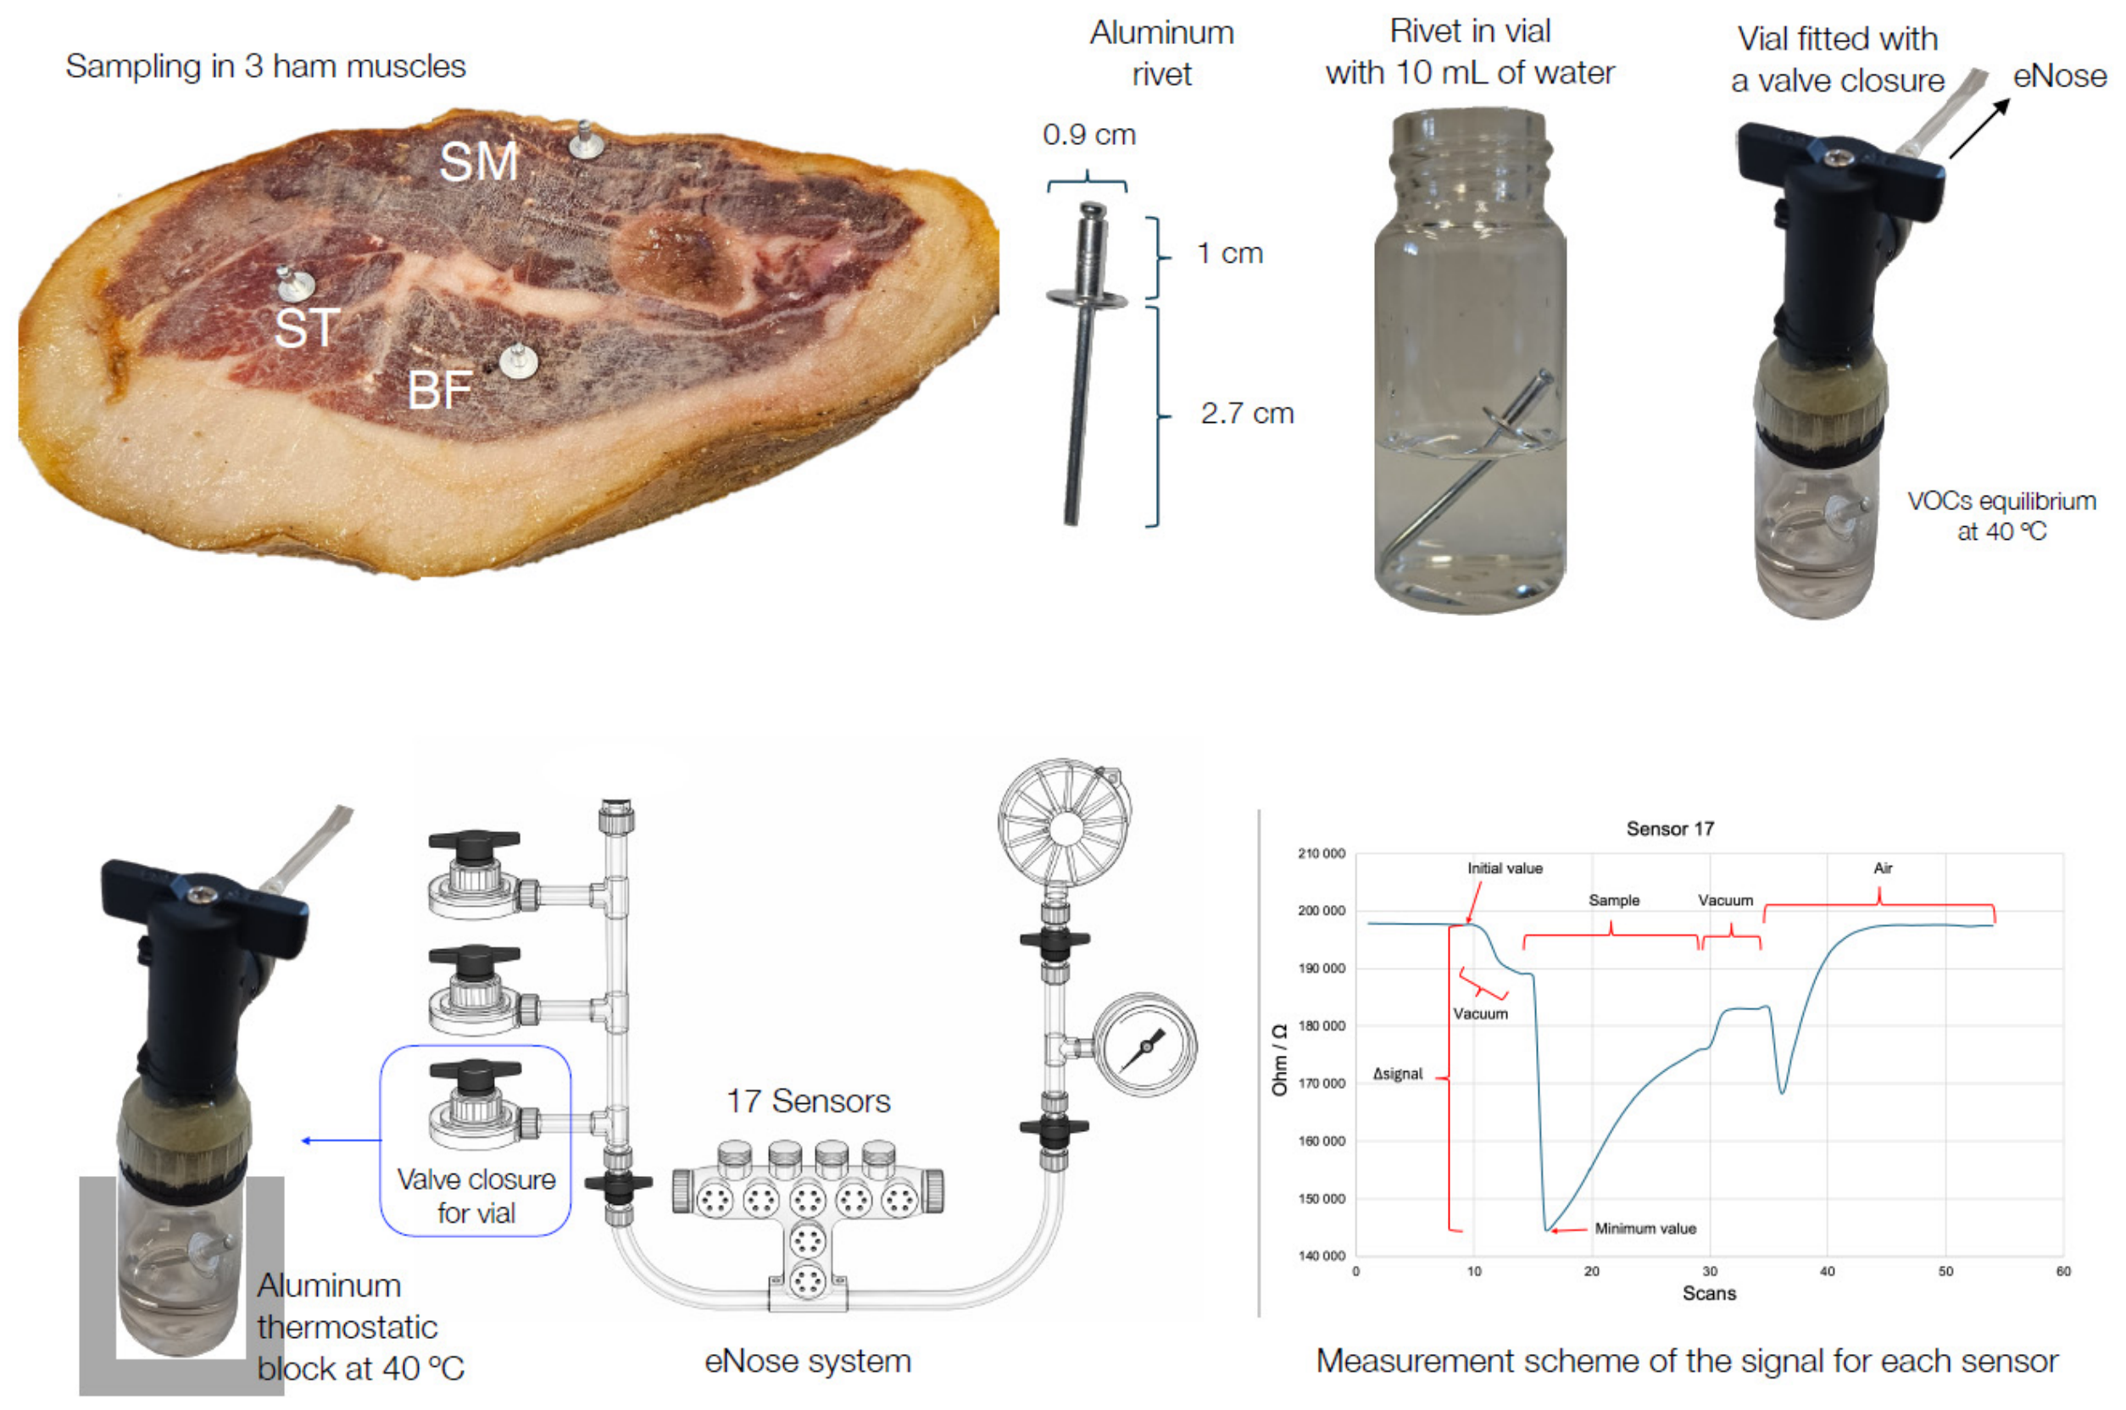
Muscle samples were divided into two equivalent portions: one portion was used for GC–MS analysis and the other for E-nose analysis. Each dry-cured ham sample was removed from its vacuum-sealed packaging immediately prior to analysis. Although the analyses were not performed on the exact same sample portion, both portions originated from the same muscle and were collected and stored under identical conditions to ensure comparability between analytical techniques. Subsequently, the three muscles under study (BF, ST, and SM) from each ham sample were sampled using aluminum rivet drilling tools for exactly 1 min (Figure 1). The piercing time was set to 1 min as a compromise between sampling efficiency, signal stability, and experimental practicality, since longer times (3, 5, and 10 min) produced similar analytical responses without significant improvement. For each repetition, a total of 69 rivets were used, corresponding to three rivets per sample (one for each muscle). After piercing, the rivets were immediately transferred to a vial containing 10 mL of deionized water. This procedure enabled the analysis of aroma compounds adsorbed onto the metal rivets during contact with the ham. Once placed into the E-nose sampling interface, the vial was heated to 40 °C using a controlled water bath to ensure thermal stability and reproducible conditions during volatile extraction. Water was used as the transfer medium to provide a simple, reproducible, and inert environment for sample handling and temperature stabilization at 40 °C prior to E-nose analysis. Although water may not retain all volatile compounds with equal efficiency, especially hydrophobic compounds, the generated headspace still reflects the volatile profile of the sampled material according to gas–liquid equilibrium principles. Furthermore, water at 40 °C has low volatility and does not saturate the sensor signals, unlike organic solvents.
Following each measurement, the vacuum pump was activated, and the system was purged for 5 min to remove the residual gases, thus ensuring effective cleaning and maintaining sensor performance.
Next, the air circuit was closed to place the equipment under vacuum again for 5 min, allowing the sensors to stabilize. Following the vacuum stabilization step, and depending on the sample characteristics, the total data acquisition time ranged from 30 to 40 min. Intermediate vacuum cycles were applied when necessary to facilitate sensor recovery towards baseline conditions. For subsequent chemometric analysis, a single scalar feature was extracted from each E-nose sensor response curve. The baseline signal was defined as the mean sensor resistance recorded immediately before vacuum application for sample headspace introduction. After sample introduction, the representative sensor response was defined as the minimum resistance value recorded, corresponding to the strongest sensor response to the volatile compounds under the experimental conditions used. The analytical signal was then calculated as the absolute difference between the baseline signal and this minimum response value (Δsignal = |baseline − minimum response|). Therefore, the complete temporal response profile was not used for chemometric modeling. Instead, each sample was represented by one scalar Δsignal value per sensor, generating the final E-nose data matrix used for statistical and multivariate analyses. No smoothing, filtering, or preprocessing procedures were applied to the raw time-dependent E-nose response curves before feature extraction.
Each sample was analyzed in a closed-loop vacuum system (Figure 1). The Agilent data logger recorded the resistance directly from the sensors’ surface. Analyses were performed in triplicate, with a reproducibility criterion requiring a coefficient of variation of less than 5%.
All E-nose analyses were performed over three consecutive days under the same controlled experimental conditions to minimize possible temporal drift effects in sensor responses. Between consecutive measurements, baseline recovery and chamber cleaning procedures were performed to ensure signal stabilization and measurement reproducibility. Furthermore, the acquisition order of the samples was randomized, and a cleaning/stabilization cycle was applied between consecutive measurements to reduce carry-over effects and maintain sensor stability. The chronological acquisition order of the samples was recorded and preserved in the data structure used for subsequent preprocessing procedures.

2.4. Statistical Analysis

All analyses were performed using R (version 4.4.1) and RStudio (version 2025.09.1+401) on a MacBook equipped with an Intel processor.

2.4.1. Descriptive and Mean Comparison Analysis

Descriptive statistical analysis was conducted to evaluate the distribution and variability of the sensor data prior to multivariate modeling. All variables were verified for numerical consistency and summarized using mean, standard deviation (SD), minimum (min), maximum (max), and interquartile range (IQR). Additional metrics, including the relative standard deviation (RSD%) and relative amplitude, were calculated to assess variability and identify low-informative variables. Extreme values were identified using the 1.5 × IQR criterion and evaluated to determine whether they should be classified as outliers.
Before applying inferential statistical tests, the assumptions of normality and homogeneity of variances were evaluated. When assumptions of these criteria were fulfilled, classical ANOVA was applied; otherwise, Welch’s ANOVA or the non-parametric Kruskal–Wallis (KW) test was used. Compounds showing p-values less than 0.05 (p < 0.05) were considered statistically significant and, therefore, informative for muscle differentiation. This procedure provided a robust basis for subsequent multivariate analysis.

2.4.2. Data Preprocessing Methods

The dataset consisted of VOC concentrations and sensor signals standardized using Z-score normalization prior to modeling, as preliminary analyses demonstrated that this approach provided better classification performance and model robustness than the use of raw sensor signals. Z-score normalization transforms each sensor variable by subtracting its mean and dividing by its standard deviation, resulting in variables with zero mean and unit variance. This procedure reduces differences in scale among sensors and allows all variables to contribute more equally to the classification models. No additional preprocessing, smoothing, filtering, or normalization procedures were applied to either the GC–MS or electronic nose datasets.

2.4.3. Model Evaluation

Classification models were evaluated under identical training/test partition conditions. Model training, parameter optimization, variable selection, and model selection were performed exclusively using the training set and internal validation procedures. Cross-validated performance metrics, including accuracy, balanced accuracy, sensitivity, and specificity, were calculated to provide a more realistic estimate of model stability. Where applicable, mean values and standard deviations across validation folds were reported. The independent external test set was not used during parameter optimization, variable selection, or model selection. It was reserved exclusively for the final evaluation of the selected models.
Data splitting, model training, and validation. The dataset was divided into training (80%; 18 hams) and test (20%; 5 hams) sets using a grouped Kennard–Stone algorithm, which ensured representative coverage of the multivariate space and maintained a balanced and informative distribution of samples between training and test sets. The training/test partition was performed using the individual ham as the experimental unit. Therefore, muscle samples originating from the same ham were never simultaneously included in both datasets. For sample splitting methods based on Leverage or the Kennard–Stone algorithm, PCA was applied as a preprocessing step to reduce data dimensionality. The PCA settings were target explained variance: 95%; minimum number of principal components: 2; maximum number of principal components: 20. This procedure allowed most of the variance (Var) in the data to be retained while reducing redundancy and noise among variables. LDA models were fitted using the caret framework with the “lda” method based on the MASS library [37].
Internal validation. Model optimization was performed using 5-fold cross-validation applied exclusively to the training set. To preserve sample independence, cross-validation was conducted using ham-level grouped folds, ensuring that samples originating from the same ham were assigned to the same fold. Classification accuracy estimated during cross-validation was used as the optimization criterion. The independent test set was not involved in model optimization and was reserved exclusively for external evaluation of the final models. Given the reduced number of independent ham samples and the small external test set, results showing perfect classification were interpreted cautiously and complemented with grouped cross-validation metrics.
Models were considered acceptable only if they simultaneously met the following criteria: accuracy ≥ 0.95; sensitivity ≥ 0.95; and specificity ≥ 0.95. Only the models fulfilling these thresholds were used to generate the final tables containing the selected variables. For these selected models, the distribution of samples in the discriminant space was examined using the first two linear discriminants (LD1 and LD2) to assess the discriminatory capacity and robustness of the classification models. Intra-group variability was quantified in the discriminant space to evaluate cluster compactness and model robustness. Group centroids were calculated based on LD1 and LD2 scores, and the Euclidean distance of each sample to its respective centroid was computed. From these distances, the following metrics were derived both globally and per group: mean distance to centroid; SD of distances; and variance of LD1 and LD2. These metrics complemented the classification results by providing information on group separation and cluster compactness. Finally, the discriminant structure was analyzed using the LDA scores obtained by projecting the data onto the discriminant axes, with the percentage of variance explained by each function calculated from the singular values of the LDA model.
Model evaluation. For each dataset, the final LDA model was trained using either all available variables or the subset selected by the Swarm algorithm. Model performance was assessed using accuracy, sensitivity, specificity, precision, and F1-score. These metrics were calculated for each class and summarized using macro-averaging to provide a balanced evaluation across groups [38]. Model selection was performed exclusively using the training set through the internal cross-validation procedure. During this stage, models were considered acceptable when they achieved accuracy, sensitivity, and specificity values ≥ 0.95 in the internal validation process. After model selection, the final models were retrained using the complete training set and subsequently evaluated on the independent external test set. The external test-set performance was used exclusively for the final assessment of model generalizability.
Linear relationship between sensor-based LDA functions and VOC concentrations. The contribution of each variable (VOC concentrations or sensor signals) to the discriminant model was assessed based on the absolute values of the LDA scaling coefficients. For each discriminant function, relative contributions were expressed as percentages, and a global contribution score was calculated.
To further interpret the discriminant structure, multiple linear regression models were established between LD1 and LD2 scores (derived from sensor signals after Z-score normalization) and VOC concentrations (used as raw data). Model performance was evaluated using the coefficient of determination (R2), root mean squared error (RMSE), F-values, and significance levels, while the individual importance of selected VOC was further examined by ANOVA, expressed as explained variance (%) and corresponding p-values. This approach allowed linking sensor-based discrimination directly to the chemical composition of the samples.

3. Results and Discussion

3.1. Analysis of Volatile Organic Compounds Profile

Table 1 shows the VOC detected in ham samples via GC-MS. A total of 23 dry-cured hams were analyzed, generating 68 muscle measurements corresponding to BF, ST and SM muscles; one sample (a SM muscle) was excluded as the quantity was insufficient for VOC analyze. The compounds identified in the present study have been previously reported in the literature for dry-cured hams and belong to specific chemical families, including aldehydes, ketones, alcohols, organic acids, esters, hydrocarbons and sulfur compounds [1,4,5,28].
Aldehydes—such as acetaldehyde, hexanal, heptanal, octanal, nonanal, 2- and 3-methylbutanal, benzaldehyde, and benzeneacetaldehyde—were the most abundant volatile compounds. These compounds were also found to be predominant in other dry-cured hams [5,7,10,39,40]. Linear aldehydes are well-established markers of unsaturated fatty acid oxidation (notably linoleic and oleic acids), whereas branched and aromatic aldehydes derive from amino acid catabolism [4]. The concentration of methyl-branched aldehydes demonstrated high discriminatory power. Regarding the former, the ST muscle differed significantly from the SM and BF muscles. Conversely, aromatic aldehydes exhibited a distinct pattern, with the SM muscle standing out from the others. These variations indicate differences in amino acid catabolism across muscle types, which directly influences flavor profiles. Specifically, compounds such as 2- and 3-methylbutanal are responsible for the fruity, almond-like, and toasted notes observed [9].
Ketones also accounted for a significant fraction of the identified volatile compounds, which have been frequently reported in dry-cured hams [8,10]. The presence of 2-ketones—including acetone, 2-butanone, 2-pentanone, 2-hexanone, 2-heptanone, and 2-octanone—indicates an active beta-oxidation pathway and secondary lipid degradation [1]. Their high relative abundance suggests controlled lipid oxidation rather than oxidative spoilage [2]. These compounds are typically associated with advanced ripening stages, contributing buttery, fruity, spicy, and blue cheese-like sensory notes to the final product [3,4]. The simultaneous presence of ketones and aldehydes reflects the interplay between lipid oxidation and proteolysis during ripening. Furthermore, both individual volatile compounds and the cumulative sums of aldehydes and ketones demonstrated the capacity to discriminate among the different muscle types.
The detected alcohols—including ethanol, 1-hexanol, 3-methylbutan-1-ol, and 2-methylpropanol—originate from aldehyde reduction or microbial activity. Their presence supports ongoing secondary metabolism and contributes mild alcoholic, green, woody, and fatty aroma notes, as well as sweet sensory nuances [4]. Notably, 1-hexanol levels differed significantly between the ST and SM muscles.
Carboxylic acids such as acetic, butanoic, 2- and 3-methylbutanoic, pentanoic, hexanoic, and 2-methylpropanoic acids are presumably derived from both lipid hydrolysis and the oxidation of aldehydes. These compounds contribute to the pungent and cheesy notes characteristic of fermented and cured meat products [39,41,42]. Their concentrations in the ham varied as a function of muscle type. For example, butanoic acid showed significant differences, with the BF muscle standing out from the SM and ST muscles, while hexanoic acid also distinguished between muscles, albeit following a different pattern.
Ethyl acetate was the only ester identified. It likely originated from the esterification reaction between ethanol and acetic acid, imparting characteristic fruity and sweet nuances to the ham [4].
The hydrocarbons pentane, hexane, heptane, octane, and 2,2,4,6,6-pentamethylheptane are considered secondary lipid oxidation products. Although they have limited direct sensory relevance due to their high odor thresholds, their presence serves as an indicator of oxidative reactions within the lipid matrix [5,7,8]. Pentane distinguishes BF from SM and ST, while octane exhibits three distinct groups among muscles.
Sulfur-containing compounds, including methanethiol, dimethyl disulfide, and carbon disulfide, are typically formed from the degradation of methionine and cysteine. In force of their low odor thresholds and despite their minor quantitative contribution, these compounds are crucial contributors to dry-cured ham aroma due to their high sensory potency, imparting notes such as onion, meaty characteristics, and sulfurous aromas [9,43]. However, it should be noted that while these volatile sulfur compounds remain detectable, their quantitative levels may be underestimated in this study, as the GC-MS sampling and analytical lines were not specifically optimized for their analysis.
The detection of 2-pentylfuran further confirms active lipid oxidation processes, particularly those involving linoleic acid, as previously reported by Lorenzo et al. [8]. Due to their low odor threshold values, furans play a significant role in the overall flavor profile of meat products [8,44]. Specifically, 2-pentylfuran provides sweet, green, fruity, vegetal, and toasty aromatic notes [10,45].
Overall, the results suggested that the specific volatile compounds profiles and the distinct differences among the BF, ST, and SM muscles were strongly associated with the biochemical mechanisms responsible for their development. This profile was dominated by controlled lipid oxidation, with secondary contributions from proteolytic and microbial pathways. Furthermore, many of the compounds identified in this study have been recognized as crucial odor-active molecules in the literature based on gas chromatography–olfactometry and aroma extract dilution analysis of Iberian and other dry-cured hams.
To identify the VOC most relevant to differentiating between the three ham muscles, a combined criterion based on detection frequency (NZeros) and statistical significance was applied. Thus, the number of samples with zero values (NZeros), the maximum value, the variability (min–max and RSD), and the statistical significance were used as indicators of the consistency of detection among samples.
Compounds detected in most samples (low NZeros) were regarded as highly representative of the product’s typical VOC profile. Given that the dataset comprised 68 samples, compounds with NZeros ≤ 14 were identified as consistently detected, corresponding to a detection frequency of approximately 85%. This threshold was adopted for the subsequent interpretation, discrimination, and characterization of the volatile profile. Utilizing detection frequency as a filtering criterion enabled the identification of VOCs consistently present across samples, thereby enhancing the robustness of statistical analyses and ensuring that the characterization was based on representative compounds. Furthermore, the statistical significance of these compounds was evaluated to assess their discriminatory power among the three muscle groups. By combining these two criteria, a subset of VOC was identified as both frequently detected and statistically relevant for distinguishing the three muscles (BF, ST, and SM). These compounds included 2-butanone, 2-methylbutanal, 3-methylbutanal, butanoic acid, pentane, hexanal, hexanoic acid, 3-methylbutanoic acid, benzeneacetaldehyde, octane, 2,2,4,6,6-pentamethylheptane, benzaldehyde, octanal, and 1-hexanol. In addition, aggregated variables such as total aldehydes, aliphatic aldehydes, and aromatic aldehydes were also relevant since they showed significant differences among muscle groups.
Considering a strictly low NZero value (≤2), the most highly relevant compounds in the volatile profile on hams were 2-methylpropanal, 2-butanone, 3-methylbutanal, 2-methylbutanal, 2-pentanone, butanoic acid, hexanal, 3-methylbutan-1-ol, pentane, acetone, hexanoic acid, and benzeneacetaldehyde. Beyond being in nearly all samples, most of these compounds were statistically relevant. They likely represent the core volatile profile of the Bísaro ham samples. Many of them are well-known markers of lipid oxidation and amino acid degradation, which are the main biochemical pathways responsible for aroma development in dry-cured meats [9,39].
Another group of compounds was characterized by a moderate number of zero-result entries (NZeros between 3 and 15) and relatively high variability; this group included methanethiol, ethanol, carbon disulfide, octane, 2-heptanone, butanoic acid, pentanoic acid, benzaldehyde, octanal, nonanal, and 2-pentylfuran. These compounds may contribute to the overall aromatic complexity, and their presence likely depends on variations in processing conditions, lipid composition, or muscle-specific microbial activity.
Finally, a third group—comprising ethyl acetate, heptane, 2-methylpropanoic acid, dimethyl disulfide, and styrene—exhibited a high frequency of non-detections and, in some instances, low concentrations, suggesting they are sporadic. These compounds may arise from localized microbial activity, packaging effects, or environmental contamination; therefore, they may not represent the core volatile profile of Bísaro ham.
Although the three muscles are anatomically and biochemically distinct, the relevance of the present study lies not merely in their discrimination but in demonstrating the capability of a low-cost E-nose system combined with chemometric tools to capture consistent volatile profile differences within dry-cured ham products. These findings support the potential application of this approach as a rapid and minimally destructive tool for process monitoring, product characterization, and quality consistency assessment during dry curing.
Since volatile profiles are closely associated with biochemical phenomena such as lipid oxidation and proteolysis, the proposed methodology may contribute to the detection of process deviations, raw material variability, or technological defects in industrial environments. Furthermore, the rivet-assisted sampling strategy may facilitate in situ aroma monitoring under practical processing conditions.

3.2. Principal Component Analysis with VOC Composition

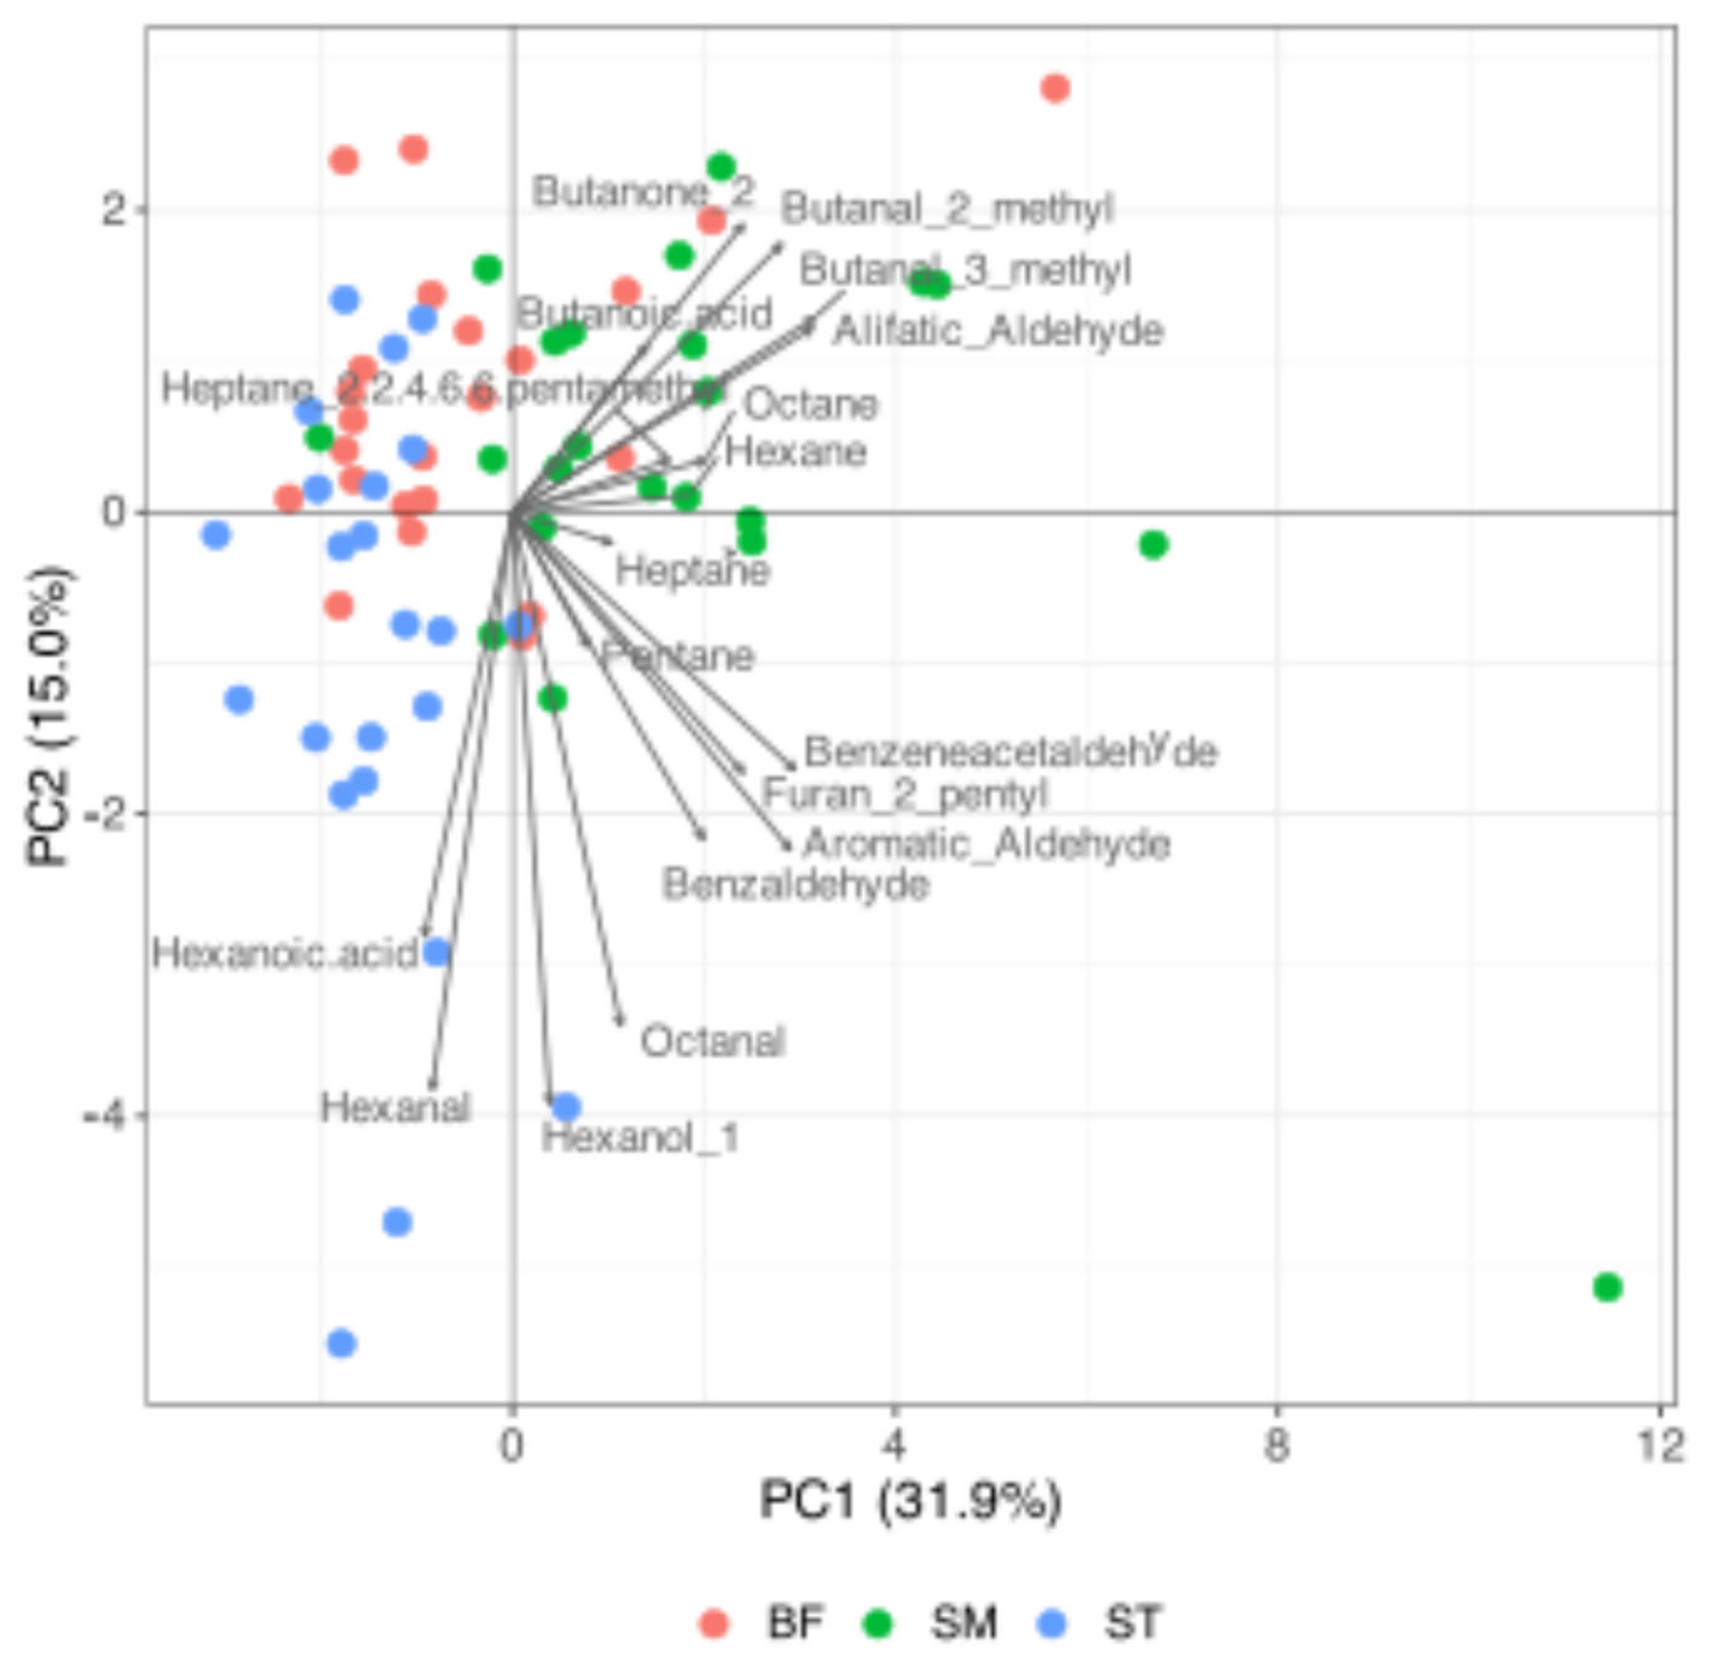
The PCA performed on the full VOC matrix produced 18 orthogonal axes. The first two components account for 46.96% of the total variance, while the first ten components explain 92.94% of the information. The biplot of PC1 vs. PC2 (Figure 2) showed the samples clustering into three distinct groups: BF, ST, and SM. The variable contributions based on squared loadings (Figure S2) reveal that PC1 was governed primarily by the sum of aliphatic aldehydes, methyl-branched aldehydes, and ketones, which dominate the BF cluster. The most influential VOCs (≥5%) for PC1 were 3-methylbutanal, aliphatic aldehyde, benzeneacetaldehyde, and 2-methylbutanal, alongside key aliphatic and aromatic aldehydes. In contrast, PC2 was driven by straight-chain aldehydes and alcohols, with hexanal and 1-hexanol as the most influential contributors, followed by octanal and benzaldehyde. This compact dimensionality confirms that the VOC fingerprint is governed by a few latent factors closely related to the chemistry of the emitted compounds.

3.3. Linear Discrimination Analysis with VOC Composition

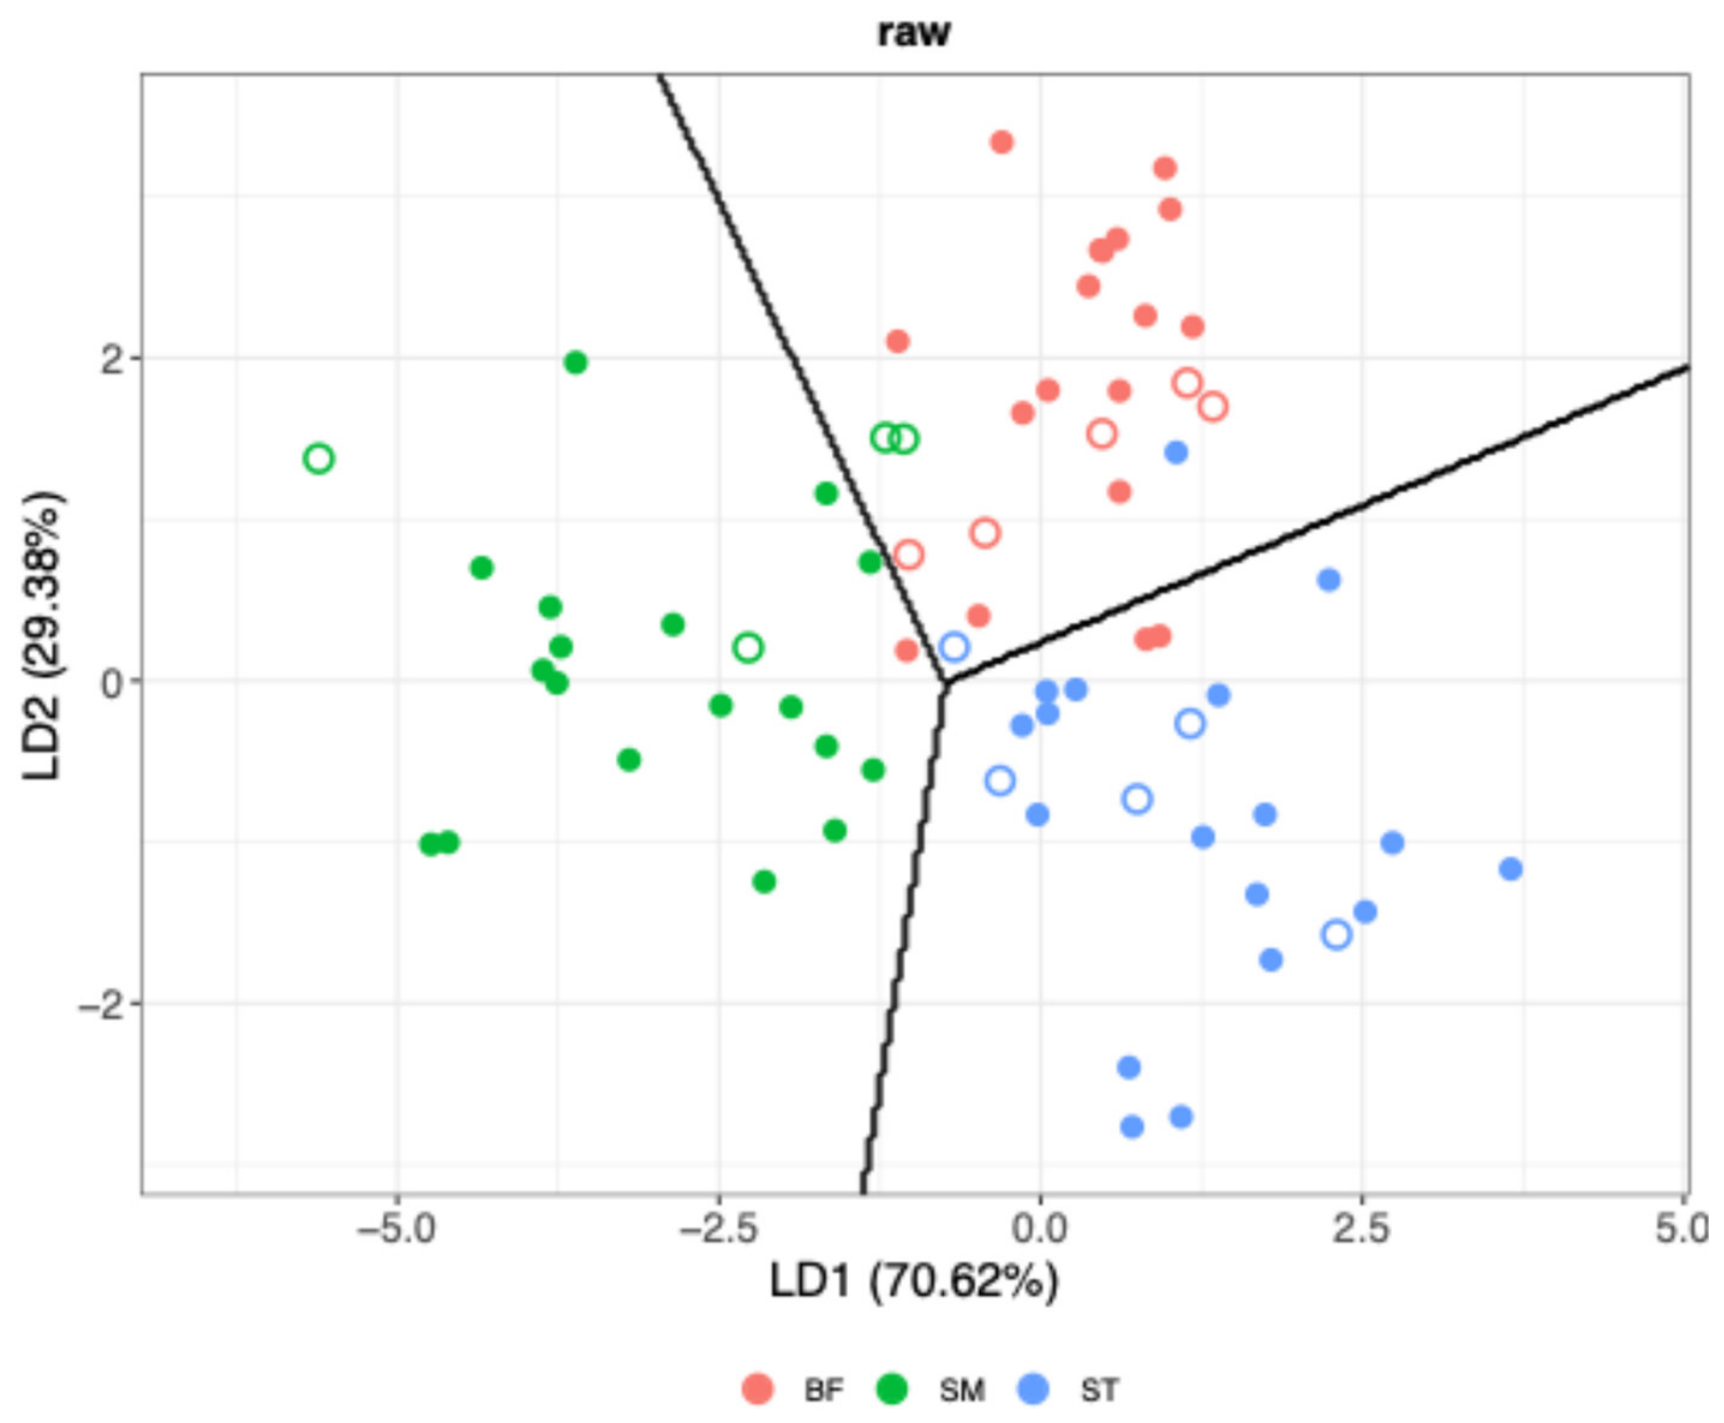
Linear discriminant analysis (LDA) was applied to evaluate the ability of VOC profiles to discriminate among the three muscles (BF, ST, and SM). The corresponding two-dimensional LDA score plot (LD1 vs. LD2) is presented in Figure 3, while the overall classification results and additional LDA-derived metrics are summarized in Table 2.
As shown in Figure 3, the LDA model based on raw VOC concentrations demonstrated clear discriminative capacity among the three muscles, indicating that the volatile profile evolved differently according to muscle type during the maturation process. The first discriminant function (LD1) explained 70.62% of the total discriminant variance, showing that most of the separation among muscles occurred along this axis. The score plot revealed the formation of relatively compact and distinguishable clusters for BF, ST, and SM, supporting the existence of muscle-specific VOC patterns associated with maturation.
The model achieved classification accuracies of 92.6% and 78.6% on the training and test sets, respectively, with test sensitivity of 76.7%, specificity of 88.9%, and an F1 score of 77.5%. Class-level results further confirmed the ability of the model to identify samples from the three muscles, with sensitivities ranging from 50.0% to 100.0% in the test set. These results demonstrate that the VOC information contains sufficient discriminatory power to separate the muscles and correctly classify previously unseen samples, indicating that differences in the maturation process are reflected in their volatile composition.
The test samples showed a lower mean distance in the discriminant space (mean = 1.199; SD = 0.732) compared with the training set (mean = 1.249; SD = 0.579), suggesting a more compact distribution of the external samples. Moreover, the reduction in the variance explained by the discriminant functions from training to testing (LD1: 4.25 to 3.80; LD2: 2.33 to 1.16) indicates that the test samples were located within the variability space defined by the training samples, which is consistent with the use of the Kennard–Stone algorithm for representative sample selection. This observation supports the reliability of the external validation results and suggests that the model captured meaningful differences among muscles rather than overfitting the training data.
Among the VOCs contributing most strongly to discrimination, benzaldehyde, 2-pentylfuran, and octanal showed the highest overall contributions (Table S2). The discriminant space was mainly structured by aromatic aldehydes, particularly benzaldehyde and benzeneacetaldehyde, which contributed strongly to LD1 and defined the main gradient separating the muscle groups. In contrast, LD2 provided complementary discrimination through the contribution of 2-pentylfuran, hexanoic acid, and other minor VOCs, allowing a more refined differentiation among samples. These results suggest that muscle-specific maturation processes are reflected in distinct volatile pathways, leading to the observed separation among BF, ST, and SM muscles.
Despite encouraging classification results and demonstrated ability to correctly classify new samples, the relatively limited number of hams included in this study restricts the development of robust predictive models. Therefore, additional studies involving larger and more heterogeneous sample sets will be necessary to strengthen model robustness, improve prediction accuracy, and confirm the generalizability of the proposed approach.

3.4. Descriptive Analysis of Sensor Signals

A descriptive statistical analysis of the sensor signals was performed to evaluate their dynamic range and variability across dry-cured ham samples (n = 68). The descriptive data was presented in Table S3. The sensor responses covered a wide range of values, with a global minimum of 1662.38 (Sensor 8) and a maximum of 224,223.05 (Sensor 3), highlighting the heterogeneous sensitivity of the sensor array. The mean signal intensity varied substantially among sensors, ranging from 2089.02 ± 240.82 (Sensor 8) to 138,653.27 ± 23,766.11 (Sensor 3). This substantial dispersion indicates that the sensors possess distinct signal scales and likely respond differently to VOC. Signal variability, assessed via the relative standard deviation (RSD), showed that most sensors exhibited acceptable performance. High repeatability, characterized by low variability (RSD < 10%), was observed for Sensors 2, 11, 14, 15, and 17. Meanwhile, moderate variability (10% ≤ RSD ≤ 20%) characterized sensors 3, 4, 5, 6, 7, 8, 10, and 16, reflecting a balance between sensitivity and stability. In contrast, sensors 1, 9, 12, and 13 showed higher variability (RSD > 20%), suggesting increased responsiveness to sample differences, albeit potentially associated with greater signal dispersion. The sensor signal amplitudes supported these findings; wider ranges were generally associated with higher variability, indicating greater sensitivity to compositional differences among the samples. Furthermore, most sensors exhibited slight positive skewness, suggesting asymmetric distributions driven by pronounced responses in specific samples. Overall, the sensor array demonstrated a broad dynamic range and predominantly acceptable variability, confirming its suitability for multivariate analysis.

3.5. Linear Discrimination Analysis with Signals from E-Nose

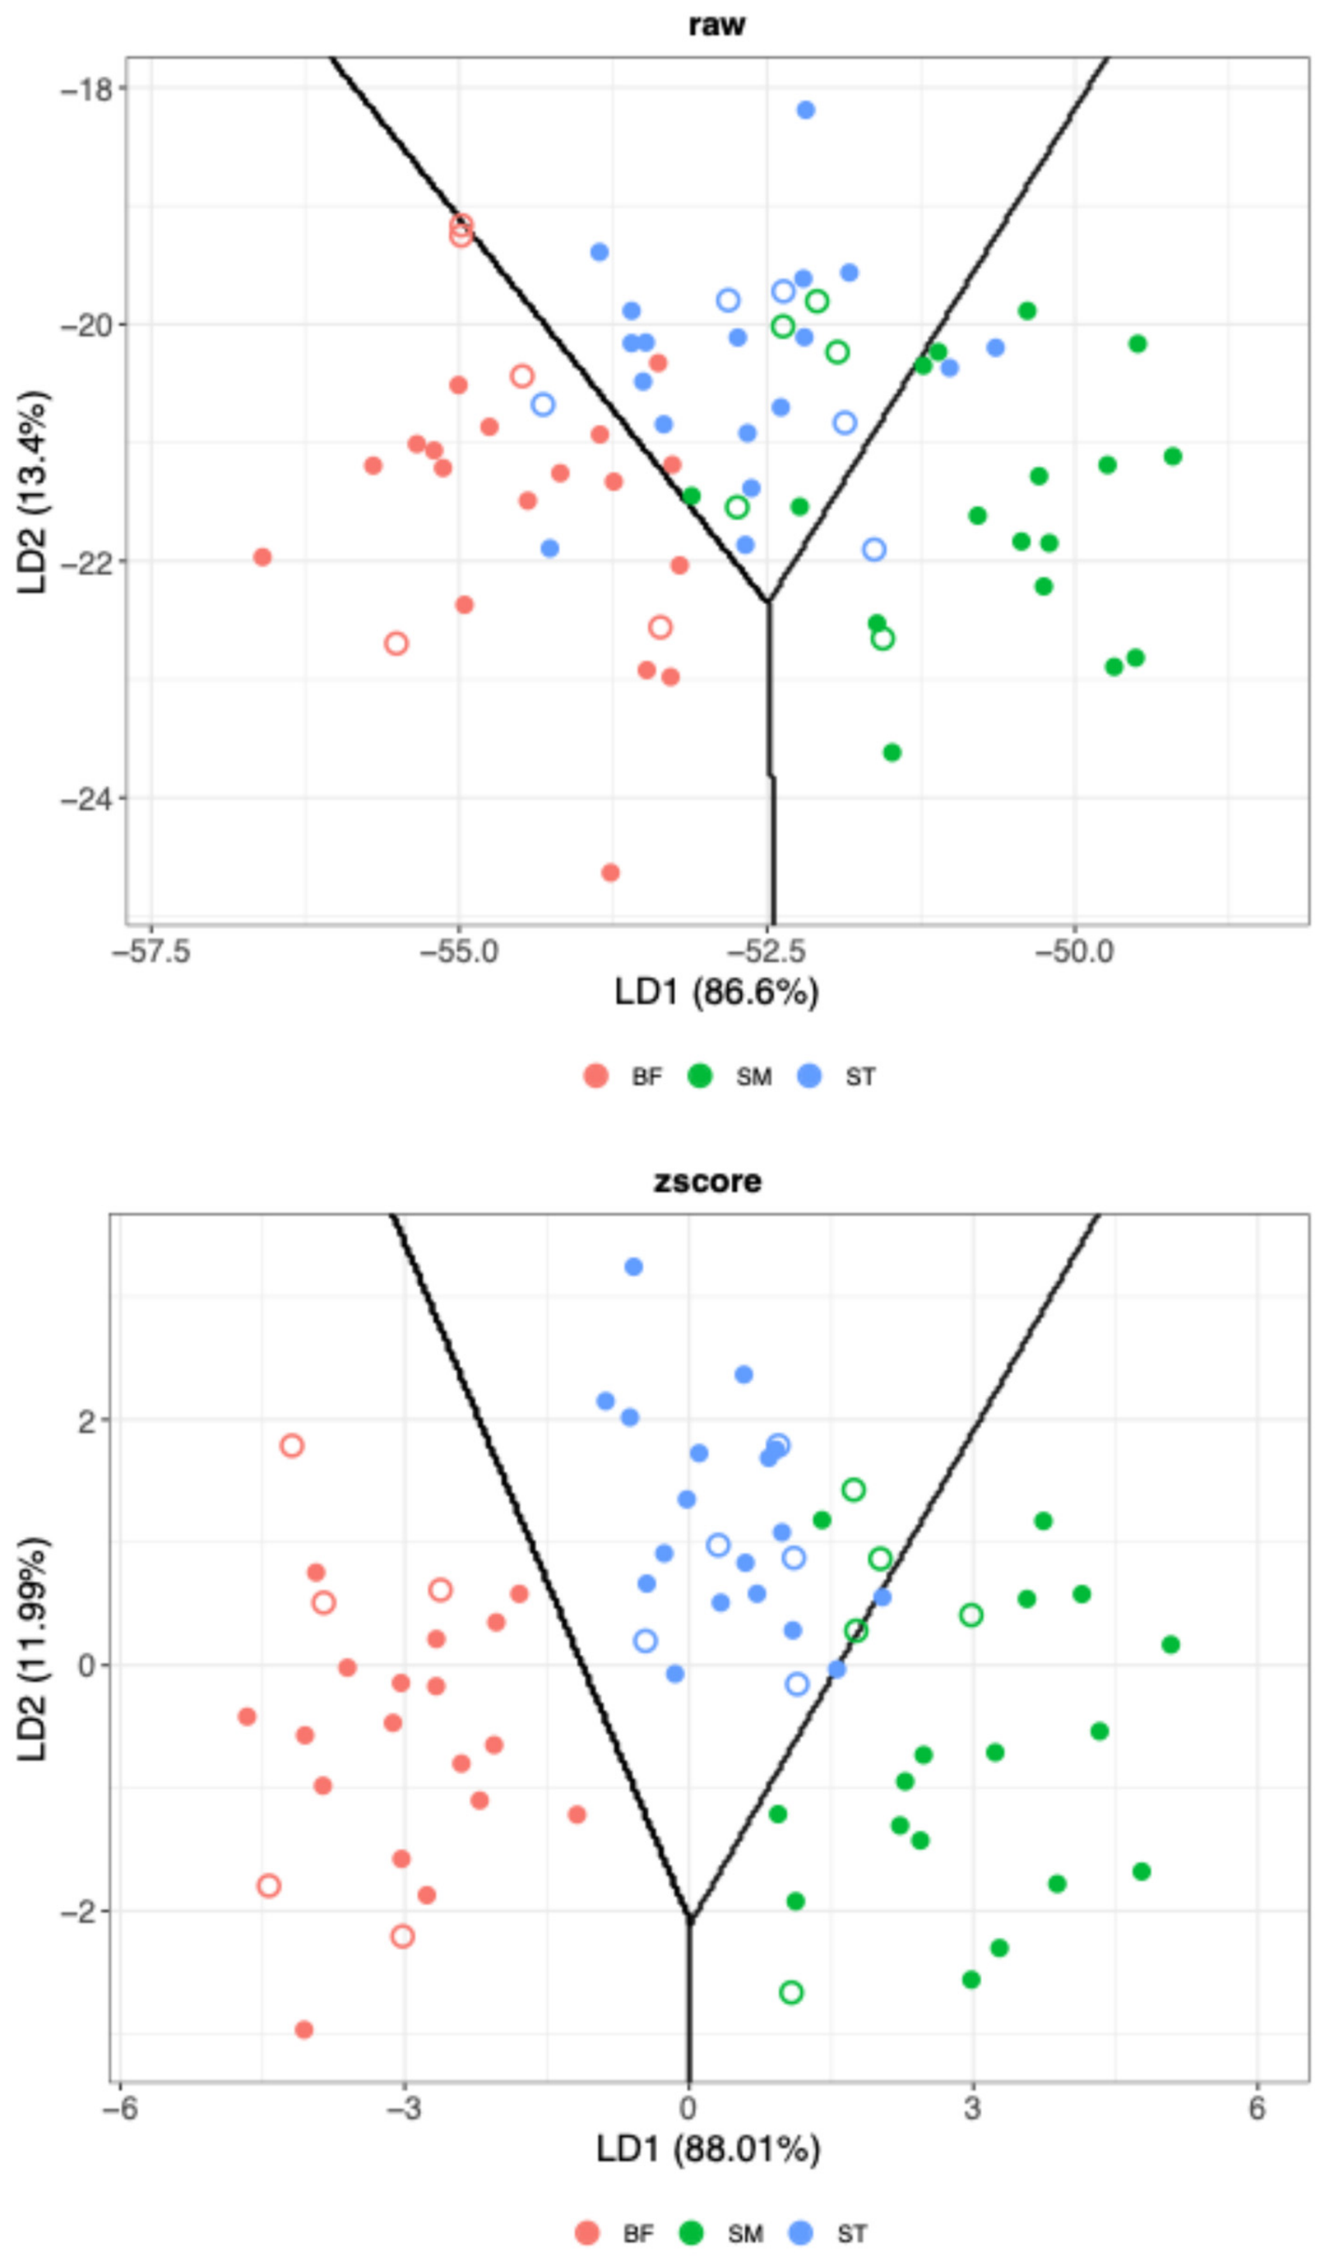
This study aimed to evaluate the capacity of LDA models based on E-nose sensor responses to discriminate among the three dry-cured ham muscles (BF, ST, and SM). The corresponding two-dimensional score plots (LD1 vs. LD2) obtained from raw and Z-score standardized sensor data are presented in Figure 4, while the main classification metrics are summarized in Table 3, and detailed results are provided in Table S4.
For both (raw and Z-score standardized sensor data), the LDA score plots revealed a clear tendency for separation among the three muscle groups, although some overlap between classes remained, particularly in the external validation set, which is consistent with the moderate classification performance observed for the raw data and the improved but not perfect performance obtained after Z-score normalization. This observation is consistent with the VOC-based analysis, supporting the hypothesis that the maturation process evolves differently in BF, ST, and SM muscles and generates distinct volatile fingerprints. In both cases, most of the discrimination was explained by LD1, while LD2 provided complementary information that improved the differentiation among groups.
The LDA model built using raw sensor responses explained 86.60% of the discriminant variance through LD1 and achieved an accuracy of 86.8% in the training set. However, its performance decreased markedly when applied to the external test set, where the accuracy dropped to 60.0%, accompanied by a sensitivity of 60.0%, a specificity of 80.0%, and an F1 score of 0.56. The reduction in classification performance between training and testing indicates limited model robustness and reduced generalization capability when predicting previously unseen samples. Although the test-set samples exhibited relatively compact clustering (mean distance to centroid = 1.28; SD = 0.56), the variance values observed for the discriminant functions (Var LD1 = 1.86; Var LD2 = 1.51) suggest a less expressive discriminant space, limiting the model’s ability to capture the variability associated with different muscle types.
In contrast, Z-score normalization substantially improved model performance. After standardization, LD1 accounted for 88.01% of the total discriminant variance, indicating that the separation among muscles became more structured along a single discriminant direction. The model achieved accuracies of 94.3% and 80.0% on the training and test sets, respectively, along with a test sensitivity of 80.0%, a specificity of 90.0%, and an F1 score of 0.78. Class-level results further demonstrated good predictive performance, with sensitivities ranging from 40.0% to 100% in the external validation set.
The superior performance obtained after Z-score normalization can be attributed to the standardization of sensor responses, which removes differences in scale and variance among sensors, preventing variables with larger signal amplitudes from dominating the discriminant model. Consequently, all sensors contribute on a more comparable basis, allowing the classification to be driven by relative response patterns associated with muscle-specific aroma profiles rather than by absolute signal intensities. Interestingly, the mean distances to the centroid and dispersion values were similar for raw and Z-score data (1.28 ± 0.56 vs. 1.24 ± 0.71, respectively), indicating comparable within-group compactness. Therefore, the improvement observed after standardization was not due to tighter clustering, but rather to a more informative and balanced discriminant structure. This interpretation is further supported by the higher variance values obtained for the Z-score model (Var LD1 = 6.43; Var LD2 = 1.89), suggesting a more expressive discriminant space capable of capturing biologically meaningful differences among muscles while maintaining strong predictive performance.
When compared with the VOC-based LDA model, the E-nose coupled with Z-score preprocessing showed comparable discrimination performance and slightly superior predictive capability. The VOC model achieved training and test accuracies of 94.4% and 78.6%, respectively, whereas the E-nose model reached 94.3% and 80.0%. Similarly, the E-nose showed slightly higher sensitivity (80.0% vs. 78.3%), specificity (90.0% vs. 88.9%), and F1 score (78.0% vs. 79.5%, comparable overall performance). While VOC analysis demonstrated that muscle-specific maturation generates distinct volatile profiles, the E-nose provided an effective representation of these differences. This performance is likely related to the ability of the sensor array to integrate the combined effect of numerous volatile compounds simultaneously, capturing the overall aroma fingerprint associated with each muscle rather than relying on the quantification of individual VOCs. As a result, the E-nose was more effective at detecting complex chemical changes associated with muscle-specific maturation and in correctly classifying new samples.
Overall, the results demonstrate that E-nose responses contain sufficient information to discriminate among BF, ST, and SM muscles and to correctly classify previously unseen samples with moderate to high accuracy, particularly after Z-score standardization. The observed separation confirms that the maturation process develops differently according to muscle type and that these differences are reflected in the aroma patterns detected by the sensor array. Similar to the results obtained in Section 3.3 for the VOC data, the sensor signals also require further validation. The use of larger and more heterogeneous sample sets will be necessary to develop robust predictive models.

3.6. Linear Relationship Between LD1 and LD2 and VOC Concentration: Chemical Interpretation

The chemical basis underlying the discriminant structure obtained from the Z-score standardized E-nose sensor signals was investigated by combining linear discriminant analysis (LDA), sensor contribution analysis, and multiple linear regression between the discriminant scores and VOC concentrations. This approach enabled the identification of the volatile compounds associated with the discrimination pattern captured by the sensor array.
The LDA model explained 100% of the discriminant variability using the first two discriminant functions, with LD1 accounting for 88.01% and LD2 for 11.99% of the total variance. Therefore, LD1 represented the primary source of discrimination among groups, whereas LD2 captured secondary variability patterns. The contribution analysis of the sensor signals revealed that LD1 was mainly influenced by Sensor 2 (20.22%), Sensor 16 (10.07%), Sensor 10 (9.07%), Sensor 9 (8.66%), and Sensor 4 (7.14%), indicating that these sensors captured the principal chemical gradients associated with group differentiation. In contrast, LD2 showed a more distributed contribution pattern, being primarily influenced by Sensor 15 (17.15%), Sensor 12 (14.70%), Sensor 5 (12.83%), Sensor 3 (7.90%), and Sensor 7 (6.69%), suggesting that this axis reflected more subtle differences in sensor responses.
The relationship between LD1 and VOC concentrations was evaluated through multiple linear regression using stepAIC variable selection. The final model included ten VOCs (2-pentylfuran, butanoic acid, hexanoic acid, benzaldehyde, 2,2,4,6,6-pentamethylheptane, hexanal, 1-hexanol, heptane, 2-butanone, and 2-methylbutanal) and was statistically significant (R2 = 0.617; adjusted R2 = 0.550; p < 0.001), explaining 61.7% of the variability of LD1. Among the selected compounds, 2-pentylfuran was the dominant contributor, accounting for 53.6% of the explained variation, followed by butanoic acid (12.0%), hexanoic acid (6.35%), hexanal (5.87%), and benzaldehyde (5.79%). Standardized coefficients confirmed 2-pentylfuran (β = 0.492) as the strongest positive contributor, whereas hexanoic acid (β = −0.352) showed the strongest negative effect on the discriminant axis. All predictor variables exhibited low multicollinearity (VIF = 1.26–3.12), supporting the robustness of the model.
The VOC profile associated with LD1 comprised compounds belonging to several chemical families, including furans, aldehydes, alcohols, hydrocarbons, ketones, aromatic compounds, and organic acids. This diversity suggests that LD1 reflects an integrated chemical signature associated with lipid oxidation, microbial metabolism, and aroma development processes. In particular, the predominance of 2-pentylfuran and aldehydes indicates an important contribution of oxidative reactions, whereas the presence of organic acids suggests the involvement of degradation and fermentation-related pathways. The coexistence of positive and negative regression coefficients further indicates that discrimination along LD1 is driven by contrasting VOC patterns rather than by a uniform increase in all compounds.
For LD2, the final regression model included hexanal, hexanoic acid, butanoic acid, and 3-methylbutanal and remained statistically significant (R2 = 0.202; adjusted R2 = 0.151; p = 0.006), although it explained a lower proportion of variability (20.2%). Hexanal was the most relevant variable, contributing 34.7% of the explained variation, followed by 3-methylbutanal (27.5%), butanoic acid (20.7%), and hexanoic acid (17.2%). Standardized coefficients indicated that hexanal (β = 0.509) and hexanoic acid (β = −0.399) were the main positive and negative contributors, respectively. As observed for LD1, multicollinearity was low among predictors (VIF = 1.33–2.12).
Compared with LD1, the VOC profile associated with LD2 was more restricted and mainly composed of aldehydes and organic acids related to lipid oxidation and amino acid degradation pathways. These findings suggest that LD2 captures a complementary chemical dimension associated with secondary changes in volatile composition, potentially including sources of variation not fully explained by the quantified VOCs.
Overall, the combined interpretation of sensor contributions and VOC associations demonstrated that the discriminant structure obtained from the E-nose signals has a clear chemical basis and is supported by measurable differences in volatile composition. The stronger association between LD1 and VOC concentrations, reflected by its substantially higher explained variance compared with LD2 (61.7% vs. 20.2%), indicates that the primary discrimination among groups is largely driven by differences in volatile profiles. These findings demonstrate the ability of the E-nose sensor array to capture meaningful chemical information and support the integration of sensor responses with VOC-based chemometric modeling for robust sample characterization and classification. Similar observations have been reported by Shooshtari and Salehi [12], who demonstrated the usefulness of combining E-nose responses with chemometric approaches for VOC discrimination and sample classification.

4. Conclusions

The present study demonstrates the feasibility of combining a low-cost E-nose system with chemometric analysis to characterize muscle-specific volatile patterns in dry-cured Bísaro ham. The results suggest that both volatile compound profiles and electronic nose signals, when combined with chemometric techniques, can effectively discriminate between different muscle types in dry-cured Bísaro ham. Several volatile compounds, including furans, aldehydes, organic acids, alcohols, ketones, and hydrocarbons, contributed to the discrimination among muscle types, indicating that aroma differentiation arises from a complex combination of chemical families rather than from a single dominant compound class. The E-nose responses seemed to reflect these differences indirectly, indicating high sensitivity to variations in aroma-related compounds without requiring individual compound quantification. Rather than relying on individual compounds, the sensor array captured complex aroma patterns that reflected the overall volatile profile of each muscle, enabling clear separation between sample groups. This discrimination was supported by statistically significant relationships between sensor responses and VOC composition, particularly for compounds associated with lipid oxidation and aroma development such as 2-pentylfuran, hexanal, butanoic acid, and hexanoic acid. However, the explanatory power of the regression models differed between discriminant functions (R2 = 0.617 for LD1 and R2 = 0.202 for LD2), indicating that only part of the sensor-derived discrimination can be directly attributed to the quantified volatile compounds.
The primary advantages of the E-nose lie in its ability to detect global volatile profile patterns in a non-destructive, rapid, and cost-effective manner, requiring minimal sample preparation compared to chromatographic analysis. Furthermore, the rivet-assisted (piercing-based) sampling method proved to be an efficient strategy for extracting volatile compounds, facilitating consistent and rapid measurements under controlled conditions. This supports its viability for in situ applications, showing significant potential for quality control, process monitoring, and product authentication. Despite these promising results, some limitations should be considered. Although this study was conducted using dry-cured Bisaro ham, the proposed piercing-assisted E-nose methodology could potentially be extended to other dry-cured ham products. Nevertheless, differences in breed, feeding regime, ripening conditions, fat composition, and processing technology may affect volatile profiles and model transferability, requiring additional calibration and validation for each specific product type.
MOS sensors are inherently cross-sensitive and susceptible to environmental influences, sensor drift, and aging effects, which may affect long-term reproducibility under industrial conditions. To minimize these effects in the present study, all samples were analyzed over three consecutive days under the same controlled experimental conditions. Further validation is still required before these systems can be considered reliable alternatives to conventional sensory or analytical methods, particularly regarding the robustness, long-term stability, reproducibility, and drift compensation of MOS sensor arrays under industrial conditions. The moderate association observed between LDA scores and VOC profiles suggests that additional chemical factors not quantified in the present study may also contribute to the sensor responses. Therefore, interpretations regarding the chemical basis of discrimination should be considered within the scope of the measured VOC dataset.
Consequently, future research should investigate additional volatile and non-volatile chemical markers that may contribute to the unexplained variability in the discriminant functions, thereby improving the understanding of the relationship between E-nose responses and product chemistry. In particular, efforts should also focus on improving the development of drift-monitoring tools, reference standards, adaptive recalibration strategies, and signal-correction algorithms, which will be essential to ensuring reproducibility over time. Finally, the integration of E-nose systems with advanced machine learning approaches and data fusion strategies that combine sensor, chromatographic, and sensory data may further enhance predictive performance and robustness.

Supplementary Materials

The following supporting information can be downloaded at: https://www.mdpi.com/article/10.3390/chemosensors14070158/s1. Figure S1: Two representative sensors from the MQ series as examples of the gas sensors used in the electronic nose system: MQ-2 and MQ-3; Figure S2: Representation of the percentage contribution of each volatile organic compound (VOC) variable to the first two principal components (PC1 and PC2). Table S1: Description list of MQ gas sensors used in analysis of E-nose sensor array device; Table S2: The percentage contribution of each VOC in the LDA-raw model; Table S3: Descriptive analysis of sensor signals; Table S4: The percentage contribution of each sensor in the LDA-Z-score model.

Author Contributions

Conceptualization, L.G.D. and A.T.; methodology, L.V., N.A.S.D. and A.L.; validation, L.V., S.S.Q.R., L.G.D. and J.M.; resources, A.T., S.S.Q.R., L.G.D. and J.M.; software, L.G.D. and N.A.S.D.; formal analysis, L.V., J.M. and A.L.; investigation, L.V., A.L., N.A.S.D., S.S.Q.R., L.G.D. and J.M.; data curation, L.V., L.G.D. and J.M.; writing—original draft preparation, L.V.; writing—review and editing, L.V., A.L., N.A.S.D., L.G.D., J.M., S.S.Q.R. and A.T.; visualization, L.G.D. and L.V.; supervision, L.G.D., J.M., S.S.Q.R. and A.T.; project administration, S.S.Q.R., L.G.D. and J.M.; funding acquisition: A.T. and S.S.Q.R. All authors have read and agreed to the published version of the manuscript.

Funding

This research was funded by the project “BisOlive: Use of olive pomace in the feeding of Bísaro swine. Evaluation of the effect on meat quality” (NORTE-01-0247-FEDER-072234). Financial support under the CIMO project (UIDB/00690/2020).

Institutional Review Board Statement

Not applicable.

Informed Consent Statement

Not applicable.

Data Availability Statement

The original contributions presented in the study are included in the article; further inquiries can be directed to the corresponding author.

Acknowledgments

The authors are grateful to the Foundation for Science and Technology (FCT, Portugal) for financial support through national funds FCT/MCTES (PIDDAC) to CIMO (UIDB/00690/2020 and UIDP/00690/2020) and SusTEC (LA/P/0007/2020); and the Laboratory of Carcass and Meat Quality of the Agriculture School of the Polytechnic Institute of Bragança. The grants for L.V., N.S.A.D., and A.L. are due to NORTE-01-0247-FEDER-072234. The authors S.S.Q.R., L.G.D., and A.T. are members of the Healthy Meat network, funded by CYTED (ref: 119RT0568). This study is part of a project between a research center (the Carcass and Meat Quality and Technology Laboratory of the Agrarian School of Bragança) and the meat manufacturing industry (Bísaro Salsicharia Tradicional®) to develop and add value to animals reared in the extensive system and create new processed meat products.

Conflicts of Interest

The authors declare no conflicts of interest.

References

  1. Vasconcelos, L.; Dias, L.G.; Leite, A.; Lorenzo, J.M.; Teixeira, A.; Rodrigues, S.S.Q.; Mateo, J. Dry-Cured Bísaro Ham: Differences in Physicochemical Characteristics, Fatty Acid Profile and Volatile Compounds Between Muscles. Foods 2025, 14, 2474. [Google Scholar] [CrossRef] [PubMed]
  2. Rodrigues, S.; Teixeira, A. Sensory evaluation of Bísaro pork meat products. Rev. Ciênc. Agrár. 2017, 40, 353–358. [Google Scholar] [CrossRef]
  3. Flores, M.; Grimm, C.C.; Toldrá, F.; Spanier, A.M. Correlations of sensory and volatile compounds of Spanish “serrano” dry-cured ham as a function of two processing times. J. Agric. Food Chem. 1997, 45, 2178–2186. [Google Scholar] [CrossRef]
  4. Sabio, E.; Vidal-Aragón, M.C.; Bernalte, M.J.; Gata, J.L. Volatile compounds present in six types of dry-cured ham from south European countries. Food Chem. 1998, 61, 493–503. [Google Scholar] [CrossRef]
  5. Sánchez-Peña, C.M.; Luna, G.; García-González, D.L.; Aparicio, R. Characterization of French and Spanish dry-cured hams: Influence of the volatiles from the muscles and the subcutaneous fat quantified by SPME-GC. Meat Sci. 2005, 69, 635–645. [Google Scholar] [CrossRef] [PubMed]
  6. Hierro, E.; De la Hoz, L.; Ordónez, A. Headspace volatile compounds from salted and occasionally smoked dried meats (cecinas) as affected by animal species. Food Chem. 2004, 85, 649–657. [Google Scholar] [CrossRef]
  7. Nárváez-Rivas, M.; Vicario, I.M.; Alcade, M.J.; León-Camacho, M. Volatile hydrocarbon profile of Iberian dry-cured hams. A possible tool for authentication of hams according to the fattening diet. Talanta 2010, 81, 1224–1228. [Google Scholar] [CrossRef] [PubMed]
  8. Lorenzo, J.M.; Carballo, J.; Franco, D. Effect of the inclusion of chestnut in the finishing diet on volatile compounds of dry-cured ham from celta big breed. J. Integr. Agric. 2013, 12, 2002–2012. [Google Scholar] [CrossRef] [PubMed]
  9. Carrapiso, A.I.; Ventanas, J.; García, C. Characterization of the most odor-active compounds of Iberian ham headspace. J. Agric. Food Chem. 2002, 50, 1996–2000. [Google Scholar] [CrossRef] [PubMed]
  10. García-González, D.L.; Tena, N.; Aparicio-Ruiz, R.; Morales, M.T. Relationship between sensory attributes and volatile compounds qualifying dry-cured hams. Meat Sci. 2008, 80, 315–325. [Google Scholar] [CrossRef] [PubMed]
  11. Baietto, M.; Wilson, A.D. Electronic-Nose Applications for Fruit Identification, Ripeness and Quality Grading. Sensors 2015, 15, 899–931. [Google Scholar] [CrossRef]
  12. Shooshtari, M.; Salehi, A. An electronic nose based on carbon nanotube-titanium dioxide hybrid nanostructures for detection and discrimination of volatile organic compounds. Sens. Actuators B Chem. 2022, 357, 131418. [Google Scholar] [CrossRef]
  13. Loutfi, A.; Coradeschi, S.; Mani, G.K.; Shankar, P.; Rayappan, J.B.B. Electronic noses for food quality: A review. J. Food Eng. 2015, 144, 103–111. [Google Scholar] [CrossRef]
  14. Wojnowski, W.; Majchrzaka, T.; Dymerskia, T.; Gębickib, J.; Namieśnik, J. Electronic noses: Powerful tools in meat quality assessment. Meat Sci. 2017, 131, 119–131. [Google Scholar] [CrossRef] [PubMed]
  15. Aouadi, B.; Zaukuu, J.L.Z.; Vitális, F.; Bodor, Z.; Fehér, O.; Gillay, Z.; Bazar, G.; Kovacs, Z. Historical evolution and food control achievements of near infrared spectroscopy, electronic nose, and electronic tongue—Critical overview. Sensors 2020, 20, 5479. [Google Scholar] [CrossRef] [PubMed]
  16. Swain, K.K.; Mishra, P.M.; Behera, B.K. Semiconductor Metal Oxide Thin Films. In Metal Oxide Nanocomposite Thin Films for Optoelectronic Device Applications; Zargar, R.A., Ed.; Wiley: Hoboken, NJ, USA, 2023. [Google Scholar]
  17. Górska-Hdrczyczak, E.; Guzek, D.; Mdlęda, Z.; Wdjtasik-Kalindwska, I.; Brdddwska, M.; Wierzbicka, A. Applications of electronic noses in meat analysis. Food Sci. Technol. 2016, 36, 389–395. [Google Scholar] [CrossRef]
  18. Qian, K.; Bao, Y.; Zhu, J.; Wang, J.; Wei, Z. Development of a portable electronic nose based on a hybrid filter-wrapper method for identifying the Chinese dry-cured ham of different grades. J. Food Eng. 2021, 290, 110250. [Google Scholar] [CrossRef]
  19. Calvini, R.; Pigani, L. Toward the Development of Combined Artificial Sensing Systems for Food Quality Evaluation: A Review on the Application of Data Fusion of Electronic Noses, Electronic Tongues and Electronic Eyes. Sensors 2022, 22, 577. [Google Scholar] [CrossRef] [PubMed]
  20. Wang, B. Flavor enhancement during the drying of scallop (Patinopecten yessoensis) as revealed by integrated metabolomic and lipidomic analysis. Food Chem. 2024, 432, 137218. [Google Scholar] [CrossRef] [PubMed]
  21. Wang, M. Electronic nose and its application in the food industry: A review. Eur. Food Res. Technol. 2024, 250, 21–67. [Google Scholar] [CrossRef]
  22. Moraes, G.N.; Pereira, J.G. Utilização do nariz eletrônico (e-nose) como ferramenta de análise rápida de alimentos. Vet. Zootec. 2020, 27, 1–10. [Google Scholar] [CrossRef]
  23. Ji, H.; Pu, D.; Yan, W.; Zhang, Q.; Zuo, M.; Zhang, Y. Recent advances and application of machine learning in food flavor prediction and regulation. Trends Food Sci. Technol. 2023, 138, 738–751. [Google Scholar] [CrossRef]
  24. Zeng, X.; Cao, R.; Xi, Y.; Li, X.; Yu, M.; Zhao, J.; Cheng, J.; Li, J. Food flavor analysis 4.0: A cross-domain application of machine learning. Trends Food Sci. Technol. 2023, 138, 116–125. [Google Scholar] [CrossRef]
  25. Sarno, R.; Wijaya, D.R. Recent development in electronic nose data processing for beef quality assessment. Telkomnika 2019, 17, 337–348. [Google Scholar] [CrossRef]
  26. Boeker, P. On ‘Electronic Nose’ methodology. Sens. Actuators B Chem. 2014, 204, 2–17. [Google Scholar] [CrossRef]
  27. Tan, J.; Xu, J. Applications of electronic nose (e-nose) and electronic tongue (e-tongue) in food quality-related properties determination: A review. Artif. Intell. Agric. 2020, 4, 104–115. [Google Scholar] [CrossRef]
  28. Laureati, M.; Buratti, S.; Giovanelli, G.; Corazzin, M.; Lo Fiego, D.P.; Pagliarini, E. Characterization and differentiation of Italian Parma, San Daniele and Toscano dry-cured hams: A multi-disciplinary approach. Meat Sci. 2014, 96, 288–294. [Google Scholar] [CrossRef] [PubMed]
  29. Zhang, B.; Wang, Y.; Wang, J.; Zhang, Y.; Wang, W.; Cao, J.; Kong, B.; Teng, W. The establishment of ham grade, sensory scores and key flavor substances prediction models for Jinhua ham via E-nose combined with machine learning. Food Chem. 2025, 472, 142847. [Google Scholar] [CrossRef] [PubMed]
  30. Xu, M.; Wang, J.; Gu, S. Rapid identification of tea quality by E-nose and computer vision combining with a synergetic data fusion strategy. J. Food Eng. 2019, 241, 10–17. [Google Scholar] [CrossRef]
  31. Xu, M.; Wang, J.; Zhu, L. The qualitative and quantitative assessment of tea quality based on E-nose, E-tongue and E-eye combined with chemometrics. Food Chem. 2019, 289, 482–489. [Google Scholar] [CrossRef] [PubMed]
  32. Qi, J.; Wang, H.H.; Zhou, G.H.; Xu, X.L.; Li, X.; Bai, Y.; Yu, X.B. Evaluation of the taste-active and volatile compounds in stewed meat from the Chinese yellow-feather chicken breed. Int. J. Food Prop. 2017, 20, S2579–S2595. [Google Scholar] [CrossRef]
  33. Wijaya, D.R.; Sarno, R.; Zulaika, E. DWTLSTM for electronic nose signal processing in beef quality monitoring. Sens. Actuators B Chem. 2021, 326, 128931. [Google Scholar] [CrossRef]
  34. Carballo, D.E.; Andrés, S.; Giráldez, F.J.; Khanjari, A.; Caro, I.; Llamazares, D.; Operta, S.; Mateo, J. The effects of storage and hop extract on aroma and flavour compounds in Balkan-style sausages packed under a CO2-containing anaerobic atmosphere. Heliyon 2020, 6, e05251. [Google Scholar] [CrossRef] [PubMed]
  35. Zuorro, A. Water Activity Prediction in Sugar and Polyol Systems Using Theoretical Molecular Descriptors. Int. J. Mol. Sci. 2021, 22, 11044. [Google Scholar] [CrossRef] [PubMed]
  36. Teixeira, G.G.; Peres, A.M.; Estevinho, L.; Geraldes, P.; Garcia-Cabezon, C.; Martin-Pedrosa, F.; Rodriguez-Mendez, M.L.; Dias, L.G. Enose Lab Made with Vacuum Sampling: Quantitative Applications. Chemosensors 2022, 10, 261. [Google Scholar] [CrossRef]
  37. Venables, W.N.; Ripley, B.D. Modern Applied Statistics with S, 4th ed.; Springer: New York, NY, USA, 2002; 504p. [Google Scholar]
  38. Eberhart, R.C.; Shi, Y.; Kennedy, J. Swarm Intelligence; Elsevier: San Francisco, CA, USA, 2001; 512p, Available online: https://books.google.pt/books?hl=pt-PT&lr=&id=Z1z3byh1JAsC&oi=fnd&pg=PR13&dq=book+for+model+evaluation+by+swarm+algorithms&ots=rCHZBp21sF&sig=NCKhayGmyET5-8hEdvAY_fcxVcs&redir_esc=y#v=onepage&q=book%20for%20model%20evaluation%20by%20swarm%20algorithms&f=false (accessed on 3 January 2026).
  39. Domínguez, R.; Purriños, L.; Pérez-Santaescolástica, C.; Pateiro, M.; Barba, J.F.; Tomasevic, I.; Bastianello-Campagnol, P.C.; Lorenzo, J.M. Caracterization of Volatile Compounds of dry-cured meat products using HS-SPME-GC/MS. Tech. Food Anal. Methods 2019, 12, 1263–1284. [Google Scholar] [CrossRef]
  40. Segura-Borrego, M.P.; Callejón, R.M.; Morales, M.L. Iberian dry-cured ham sliced: Influence of vacuum packaging on volatile profile during chill-storage. Food Packag. Shelf Life 2023, 39, 101155. [Google Scholar] [CrossRef]
  41. Picon, A.; Nuñez, M. Volatile compounds in high-pressure-treated dry-cured ham: A review. Meat Sci. 2022, 184, 108673. [Google Scholar] [CrossRef] [PubMed]
  42. Leite, A.; Vasconcelos, L.; Ferreira, I.; Domínguez, R.; Pereira, E.; Rodrigues, S.; Lorenzo, J.M.; Teixeira, A. Effect of the Inclusion of Olive Cake in the Diet on the Physicochemical Characteristics of Dry-Cured Loin and Dry-Cured “Cachaço” of Bísaro Pig. Appl. Sci. 2023, 13, 1439. [Google Scholar] [CrossRef]
  43. Pham, A.J.; Schilling, M.W.; Mikel, W.B.; Williams, J.B.; Martin, J.M.; Coggins, P.C. Relationships between sensory descriptors, consumer acceptability and volatile flavor compounds of american dry-cured ham. Meat Sci. 2008, 80, 728–737. [Google Scholar] [CrossRef] [PubMed]
  44. Akköse, A.; Ünal, N.; Yahnkrhç, B.; Kaban, G.; Kaya, M. Volatile compounds and some physico-chemical properties of pastirma produced with different nitrate levels. Asian-Australas. J. Anim. Sci. 2017, 30, 1168–1174. [Google Scholar] [CrossRef] [PubMed]
  45. Lorenzo, J.M.; Fonseca, S. Volatile compounds of Celta dry-cured ‘lacón’ as affected by crossbreeding with Duroc and Landrace genotypes. J. Sci. Food Agric. 2014, 94, 2978–2985. [Google Scholar] [CrossRef] [PubMed]
Figure 1. Experimental procedure of piercing-assisted volatile extraction and E-nose analysis of dry-cured Bísaro ham: (up) sampling of ham muscles using aluminum rivets and moving a rivet into a vial with water for volatile equilibrium; (down) schematic diagram of the E-nose system and a representative sensor response profile (Sensor 17).
Chemosensors 14 00158 g001
Figure 2. Biplot of principal component analysis (PCA) of VOC concentrations: BF—biceps femoris; ST—semitendinosus; SM—semimebranosus muscles based on volatile compound profiles.
Chemosensors 14 00158 g002
Figure 3. Two-dimensional LDA score plots (LD1 vs. LD2) for VOC data from the three ham muscles (BF—biceps femoris; ST—semitendinosus; SM—semimebranosus): filled circles represent the training data and hollow circles represent the test data.
Chemosensors 14 00158 g003
Figure 4. Two-dimensional LDA score plots (LD1 vs. LD2) for sensor-based LDA models from the three ham muscles (BF—biceps femoris; ST—semitendinosus; SM—semimebranosus): raw and Z-score data; filled circles represent the training data and hollow circles represent the test data.
Chemosensors 14 00158 g004
Table 1. Volatile compound contents (106 AU/g of sample) of dry-cured Bísaro ham samples (KW significance evaluation).
CompoundsMinMaxNZerosKW p-ValueBFSMST
Acetaldehyde021220.684aaa
Acetic acid0800280.939aaa
Acetone054620.647aaa
Aliphatic aldehyde25946320<0.001aab
Aromatic aldehyde028.51<0.001bab
Benzaldehyde012.3140.016abab
Benzeneacetaldehyde016.220.003bab
2-Methylbutanal60.224480<0.001aab
3-Methylbutanal85.821780<0.001aab
Butanoic acid8.390.000.002abb
2-Methylbutanoic acid074.160.254aaa
3-Methylbutanoic acid013430.042aab
3-Methylbutan-1-ol053610.946aaa
2-Butanone7.613500.001abab
Carbon disulfide026760.135aaa
Disulfide dimethyl0272500.248aaa
Ethanol058130.480aaa
Ethyl acetate068.0410.124aaa
2-Pentylfuran043.314<0.001cab
Heptanal025.8220.249aaa
Heptane0176030<0.001bab
2,2,4,6,6-Pentamethylheptane011260.005bab
2-Heptanone028720.436aaa
Hexanal048110.0003bba
Hexane011318<0.001bab
Hexanoic acid010820.008aba
1-Hexanol078.2160.006abba
2-Hexanone077.0160.682aaa
Methanethiol0162120.515aaa
Nonanal09.01150.655aaa
Octanal012.4100.019baba
Octane03256<0.001bac
2-Octanone013.6170.199aaa
Pentane08311<0.001baa
Pentanoic acid058.690.198aaa
2-Pentanone9.3227400.112aaa
2-Methylpropanal4.4737700.888aaa
2-Methylpropanoic acid0412410.814aaa
2-Methylpropanol096.3210.353aaa
Styrene0114520.466aaa
N/Zeros—number of samples in which each compound was not detected; Min—minimum; Max—maximum; point scale with the extremes representing either the minimum (low-detected) or the maximum (high-detected); BF—biceps femoris; ST—semitendinosus; SM—semimebranosus; Different lowercase letters (a, b, c) in the same column indicate significant differences between muscles (p < 0.05, Kruskal–Wallis test, KW).
Table 2. LDA metrics and intra-group variability for VOC-raw data.
VOC MetricTrainTest
LD1 explained variance (%)70.6270.62
LD2 explained variance (%)29.3829.38
Accuracy (%)92.5978.57
Mean distance to centroid1.251.20
SD (distance)0.580.73
Variance LD14.253.80
Variance LD22.331.16
Sensitivity (%)92.5976.67
Specificity (%)96.3088.89
Precision (%)92.6587.50
F1-score (%)92.4777.49
VOC—volatile organic compound; LDA—linear discriminant analysis; LD—linear discriminant; SD—standard deviation.
Table 3. LDA metrics and intra-group variability for raw and Z-score standardized sensor signals.
Sensors MetricRaw Z-Score
TrainTestTrainTest
LD1 explained variance (%)86.6086.6088.0188.01
LD2 explained variance (%)13.4013.4011.9911.99
Accuracy (%)86.7960.0094.3480.00
Mean distance to centroid1.221.281.231.24
SD (distance)0.640.560.620.71
Variance LD13.361.867.066.43
Variance LD21.331.511.791.89
Sensitivity (%)86.8260.0094.3480.00
Specificity (%)93.3980.0097.2090.00
Precision (%)87.1058.7394.3487.50
F1-score (%)86.9156.4994.2978.02
LDA—linear discriminant analysis; SD—standard deviation; LD—linear discriminant.
Disclaimer/Publisher’s Note: The statements, opinions and data contained in all publications are solely those of the individual author(s) and contributor(s) and not of MDPI and/or the editor(s). MDPI and/or the editor(s) disclaim responsibility for any injury to people or property resulting from any ideas, methods, instructions or products referred to in the content.