Abstract
A carbon nanotube (CNT)-integrated microfluidic electrochemical sensor was developed for sensitive nanoparticle detection using gold nanoparticles (AuNPs) as the model analyte. The device incorporated screen-printed polyethylene terephthalate (PET) electrodes, a polydimethylsiloxane (PDMS) microchannel, and a CNT membrane that simultaneously served as a filtration layer and working electrode. This configuration enhanced analyte trapping, increased the electroactive surface area, and accelerated electron transfer under convective flow. The CNT membrane was fabricated by vacuum filtration and torch-assisted bonding, ensuring strong adhesion without adhesives or plasma treatment. Electrochemical analysis showed that the filter-integrated CNT sensor exhibited an oxidation current of 63 µA compared to 11 µA for the non-filter sensor, representing a fifteen-fold sensitivity enhancement. The detection limit improved from 1.0 × 10⁻³ to 7.5 × 10⁻⁴ mol·L−1 with excellent reproducibility (RSD < 5%) and ∼90% accuracy. These findings validated the filtration-assisted accumulation mechanism and demonstrated the effectiveness of CNT-integrated microfluidic sensors for enhanced nanoparticle detection, while highlighting their potential for future adaptation to biosensing applications.
1. Introduction
Electrochemical sensors are widely used analytical tools that convert chemical information into electrical signals, enabling sensitive, rapid, and cost-effective detection of a wide range of analytes. Owing to their simplicity, portability, and compatibility with miniaturized platforms, electrochemical sensors have been extensively applied in environmental monitoring, materials analysis, and biosensing applications, including the detection of heavy metals, biomarkers, and nanomaterials [1,2]. The integration of electrochemical sensing with microfluidic technologies has further improved analytical performance by enabling precise control of fluid transport, reduced sample consumption, and enhanced mass transfer at the electrode interface, often resulting in faster response times and improved detection limits compared to macroscale systems [3].
Recent advances in nanotechnology have significantly contributed to the development of high-performance electrochemical sensors through the incorporation of nanostructured materials, including metal nanoparticles, nanocomposites, and CNT-based nanomaterials. These materials enhance electroactive surface area, promote favorable analyte–electrode interactions, and improve electron-transfer kinetics [4,5]. Among them, CNT-based electrodes have attracted particular attention due to their high electrical conductivity, large surface-to-volume ratio, chemical stability, and mechanical robustness. CNT-modified electrodes have been reported to improve electrochemical sensitivity by one to two orders of magnitude compared to conventional planar electrodes, making them especially suitable for integration into microfluidic electrochemical sensors [6].
Despite these advantages, reliable detection at low analyte concentrations remains challenging, particularly in microfluidic systems where limited mass transport and background interference can suppress electrochemical signals. To address these challenges, filtration-assisted sensing and analyte preconcentration strategies have emerged as effective approaches for enhancing detection sensitivity. Filtration selectively removes interfering species, while accumulation enhances target concentration at the electrode surface, amplifying the electrochemical signal and improving detection sensitivity by up to 80% compared to unfiltered systems [7,8,9].
Filtration-based sample processing has been widely employed in biological and environmental monitoring. For example, membrane-based filtration significantly enhances polymerase chain reaction (PCR) sensitivity by concentrating bacterial cells prior to lysis and DNA amplification, improving both purity and yield while eliminating inhibitory components [10,11]. Similar approaches are used in water quality monitoring, where membranes capture bacterial or particulate contaminants for subsequent electrochemical or optical detection [12,13]. Depending on the application, polymeric, ceramic, and carbon-based membranes have been implemented. Polymeric membranes are well suited for macromolecule or microbial separation, while ceramic membranes offer superior chemical resistance for industrial and environmental applications [14].
Among available materials, CNT membranes have gained increasing attention due to their dual functionality—acting as both conductive electrodes and active filtration interfaces [15,16]. CNT membranes exhibit high electrical conductivity, large surface area, and exceptional mechanical strength, enabling efficient electron transfer and robust biomolecule immobilization. These membranes can be fabricated using techniques such as chemical vapor deposition (CVD), layer-by-layer assembly, or vacuum filtration, with vacuum filtration being particularly attractive for producing uniform and controllable films suitable for biosensor integration [17,18]. In addition, covalent and noncovalent functionalization strategies can be employed to improve biocompatibility and specificity, allowing CNT-based biosensors to achieve detection limits as low as 100 pM for selected analytes, such as cortisol [19,20].
Beyond size-based exclusion, analyte retention within CNT membranes is governed by a combination of physical and chemical interactions, including – stacking, electrostatic adsorption, van der Waals forces, and hydrogen bonding [21,22,23]. These interaction mechanisms allow even small molecules to be retained within the porous CNT network through adsorption or charge-mediated interactions, while larger particles may become physically trapped depending on membrane geometry and surface chemistry. The interplay between convective transport, adsorption, and electron-transfer processes transforms CNT membranes from passive filters into active preconcentration platforms, enhancing both sensitivity and selectivity in electrochemical detection.
Such characteristics are particularly advantageous for the capture and signal amplification of nanomaterials with high surface reactivity, such as gold nanoparticles (AuNPs). AuNPs have become prominent in biosensing owing to their excellent electrical, optical, and catalytic properties, widely utilized for biomolecule labeling, signal enhancement, and targeted delivery, achieving sensitivities of up to 99% in the detection of disease biomarkers [24,25].
Leveraging these properties, in this study, a CNT membrane-based microfluidic electrochemical sensor was developed for the detection of nanoparticles. The device integrates a CNT membrane within a microfluidic system in which a PDMS layer is directly bonded to a conductive PET) substrate. The novelty of this approach lies in combining size-selective filtration with time-dependent accumulation, enabling enhanced nanoparticle detection without complex surface modification.
AuNPs were selected as a model analyte due to their well-defined size, uniform surface chemistry, and excellent electrochemical stability [26]. The use of monodisperse AuNPs enables systematic evaluation of physical filtration and accumulation mechanisms without the confounding effects of heterogeneous surface functionalities or aggregation. Particle size plays a critical role in determining filtration efficiency within porous CNT membranes, while surface charge and coating chemistry influence electrostatic interactions and adsorption strength within the CNT network. Particle composition further governs intrinsic charge-transfer kinetics, providing a well-controlled model system for assessing filtration-assisted electrochemical sensing.
2. Materials and Methods
2.1. Materials
All materials were selected and handled to preserve their integrity and ensure reproducibility. Silver/silver chloride (Ag/AgCl) and graphene conductive pastes were purchased from Sun Chemical (Parsippany, NJ, USA). Single-walled carbon nanotubes (CNTs, >85% purity) were obtained from Ossila (Sheffield, UK) and stored under dry conditions to prevent agglomeration. Nitrocellulose paper (pore size ∼0.45 µm), sodium dodecyl sulfate, gold nanoparticles (AuNPs, 60 nm diameter, dispersed in sodium citrate buffer), sodium citrate solution (≥99% purity), and potassium ferricyanide (K3[Fe(CN)6]) and potassium ferrocyanide (K4[Fe(CN)6]·3H2O) powders were purchased from Sigma-Aldrich (St. Louis, MO, USA). The ferri/ferrocyanide pair was used as a reversible redox mediator system for electrochemical measurements and stored in tightly sealed amber containers to prevent moisture absorption and photodegradation. The AuNP suspension was diluted to the required concentrations, aliquoted, and stored at 4 °C to maintain colloidal stability and prevent aggregation. Dow Sylgard 184 PDMS and its curing agent were obtained from Newark Premier Farnell (Mississauga, ON, Canada) and stored in sealed containers at ambient temperature to minimize contamination. Device fabrication, including photolithography, PDMS bonding, and CNT integration, was performed in the NanoQAM cleanroom (ISO Class 6; temperature 22 ± 1 °C; relative humidity 45 ± 5%; pressure 5–10 Pa above ambient; particle concentration < 35,000 particles/ft3 ≥ 0.5 µm). All experiments were carried out at room temperature (22 ± 2 °C) to ensure consistent performance across replicates.
2.2. Preparation of the Sensor
The fabrication of the sensor involved a comprehensive process encompassing electrode preparation, CNT membrane fabrication, and microfluidic channel assembly, designed to ensure high precision and functionality.
Electrode fabrication, as illustrated in Figure 1A, began by defining the sensing area, which consisted of two electrodes and three elongated contact pads screen-printed onto a pre-cleaned PET substrate. Carbon–graphene conductive paste was first deposited to form the counter electrode and the contact pads, followed by thermal curing at 120 °C. In a second printing step, an Ag/AgCl paste was applied using a rotated alignment mask to define the reference electrode, after which the substrate was cured once more. This screen-printing layout enabled the production of 12 identical electrode sets in a single batch. A circular opening was incorporated at the center of the counter and reference electrodes to accommodate the CNT membrane. The original working-electrode region was then removed and replaced with the CNT membrane, completing the sensing interface.
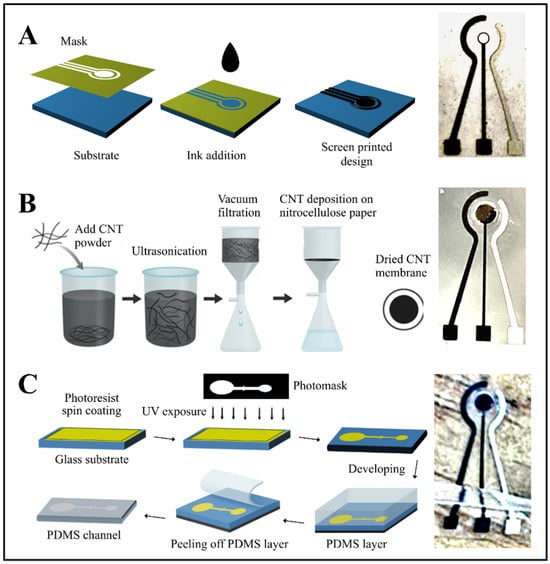
Figure 1.
(A) Schematic illustration of the screen-printing process for sensor fabrication, showing mask alignment, ink deposition, and pattern transfer onto the substrate. (B) Preparation of the CNT membrane through ultrasonication-assisted dispersion, vacuum filtration onto nitrocellulose paper, and membrane drying. (C) Photolithography and PDMS channel fabrication steps, including photoresist spin coating, UV exposure through a photomask, development, and PDMS casting; the final assembly shows the integration of the PDMS microchannel and printed electrode with the CNT membrane.
The CNT membrane was fabricated using a vacuum filtration process [27]. Initially, a solution of 1 g SDS in 100 mL of deionized water was blended for 5 min. To this, 0.1 g of SWCNTs was added and mixed for 20 min, followed by sonication for 5 h to ensure thorough dispersion. The mixture was centrifuged for 60 min to eliminate nanotube aggregates, and the upper 80% of the supernatant was decanted for further use.
A CNT film was prepared by vacuum-filtering 100 mL of deionized water containing 10 mL of the CNT dispersion through a nitrocellulose membrane. After filtration, the film was thoroughly rinsed with deionized water to remove residual surfactants. The dried CNT layer was then cut to the required dimensions and briefly immersed in chlorobenzene (20–30 s) to facilitate its release and transfer onto the PET substrate containing the printed electrodes. The underlying nitrocellulose membrane was subsequently dissolved by immersing the assembly in acetone for 60 s, leaving behind a uniform CNT film with a thickness of 0.35–0.6 µm, adjustable through the initial CNT volume. To ensure reliable mechanical attachment and electrical contact, a small amount of silver conductive paste was applied locally at the edge of the CNT membrane, outside the active sensing area. This localized fixation did not block membrane pores or interfere with electrochemical measurements. Figure 1B summarizes the fabrication and transfer steps used to integrate the CNT membrane onto the PET surface.
Microfluidic channels were fabricated using standard photolithography followed by PDMS casting. Glass substrates were first cleaned with acetone and isopropanol, then dried thoroughly. A photoresist layer was spin-coated onto the glass at a controlled speed and duration, soft-baked to remove residual solvents, and subsequently aligned with a photomask before UV exposure for 40 s. Development of the exposed substrate revealed the microchannel features, after which the mold was hard-baked to enhance feature stability and adhesion. PDMS was prepared by mixing the base and curing agent at a 10:1 weight ratio and degassed under vacuum to remove entrapped air. The mixture was poured over the mold, cured in an oven for 1 h, and carefully peeled off to preserve the microstructures. The final microfluidic design incorporated a main chamber connected to inlet and outlet channels, along with a stop-flow valve to prevent backflow and ensure controlled fluid delivery [28].
The main chamber is sized to fully cover the PET substrate’s sensing area, ensuring that the fluid flows uniformly over the electrodes Figure 1C). The chamber’s dimensions are depicted in Figure 2, with the main chamber having a diameter of 3.5 mm, a stop valve with a 1 mm diameter, and a 3 mm connecting channel leading to the valve. Figure 2 also shows images of the microfluidic channel with a stop valve and two chambers.
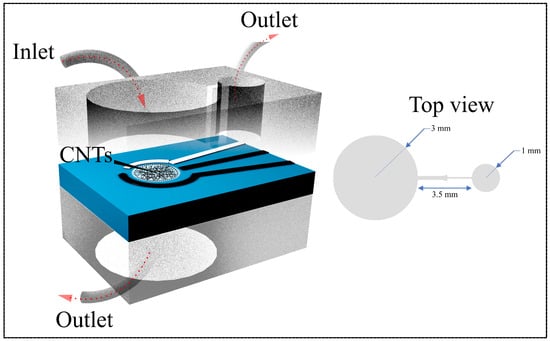
Figure 2.
Front-view schematic of the microfluidic channel integrated with the PET substrate (left) and top-view illustration of the dual-channel configuration (right). The design includes defined inlet and outlet ports for controlled fluid flow across the CNT-coated electrode area, ensuring stable operation and efficient coupling with the CNT membrane–based sensing platform.
The PDMS microfluidic channel was then aligned and bonded to the PET substrate so that the chamber was positioned directly over the sensing area. Precise alignment was essential to ensure consistent fluid contact with the electrodes and to prevent misregistration that could diminish signal quality or compromise overall sensor performance [29]. Inlet and outlet ports were punched into the PDMS layer to enable controlled sample injection and removal. These ports facilitated smooth, directed flow through the chamber and supported stable, continuous fluid management within the sensing system.
A second PDMS microfluidic channel was bonded to the PET substrate below the sensing area to create a secondary outlet (Figure 2). This additional outlet allowed fluid flow to continue after it had passed over the sensing area, preventing backpressure and ensuring efficient fluid circulation.
The dual-outlet design enhanced the microfluidic system’s functionality, allowing better fluid control and adaptability for various sample types. Bonding the PET electrodes to the PDMS microfluidic channels was a critical step, as the hydrophobic surfaces of PET and PDMS posed adhesion challenges. A torch heat bonding method was employed to address this issue [30]. Brief flame treatment on the PET surface enhanced its surface energy, while localized heat from a torch promoted adhesion. Careful alignment and controlled heat exposure ensured the integrity of the microfluidic structures without thermal damage or misalignment. This method avoided the use of adhesives or plasma treatment, ensuring a clean and effective bonding process.
2.3. Principles of the Electrochemical Measurements
The operation of the developed sensing platform relies on the dual functionality of the CNT membrane, which simultaneously serves as a filtration interface and a conductive working electrode. Under flow, the porous CNT network selectively traps target analytes such as AuNPs while allowing smaller species and solvent molecules to pass through. This selective retention promotes progressive analyte accumulation at the electroactive surface, thereby enhancing charge-transfer efficiency, amplifying the electrochemical signal, and ultimately lowering the detection limit [27].
Under convective flow, analytes are driven through the porous CNT layer, which significantly enhances both mass transport and surface adsorption compared with diffusion-limited systems. The resulting accumulation and charge-transfer processes follow adsorption-limited kinetics, during which electroactive sites gradually become saturated over time. In this study, rather than fitting a specific kinetic model, sensitivity and accumulation behavior were evaluated empirically using the measured current–concentration–time data. The effective sensitivity () was obtained from the slope of the steady-state current versus analyte concentration, while the accumulation rate () was determined from the slope of oxidation current versus accumulation time. These empirical parameters provide a direct measure of sensor performance without requiring assumptions about specific rate constants and are used consistently in Section 3 and Section 4 to quantify the impact of filtration-assisted enrichment and convective transport.
Electrochemical detection was carried out by cyclic voltammetry (CV), where the peak current () follows the Randles–Ševčík relation,
indicating dependence on the number of electrons transferred (n), electroactive area (A), diffusion coefficient (D), analyte concentration (C), and scan rate () [31,32,33]. Although CNTs do not alter the diffusion coefficient directly, their high conductivity and large surface area substantially increase the effective electroactive area and improve charge-transfer efficiency, thereby amplifying the voltammetric response.
As illustrated in Figure 3, a syringe pump continuously delivers the analyte solution through the CNT-integrated microchannel toward the electrode connected to a potentiostat. All experiments were performed under controlled convective flow at a constant flow rate of 1 mL·min−1, selected to ensure stable transport of AuNPs toward the CNT membrane while avoiding excessive hydrodynamic stress or membrane displacement. Considering a chamber volume of approximately 650 µL, this flow rate corresponds to a residence time of approximately 40 s, resulting in moderate linear velocities within the sensing chamber. Under these conditions, no membrane displacement, leakage, or signal instability was observed during continuous operation and repeated injection–pause–measurement cycles. Convective flow through the porous CNT membrane ensures efficient analyte contact with the electroactive surface, minimizes diffusion limitations, and enables reproducible accumulation dynamics.
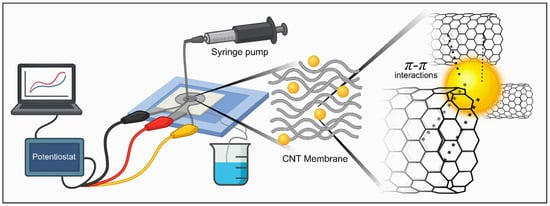
Figure 3.
Schematic illustration of the experimental setup and detection mechanism. The electrochemical sensing platform integrates a syringe pump–controlled microfluidic system with a CNT membrane connected to a potentiostat. During operation, AuNPs are selectively trapped within the CNT network through – interactions, promoting analyte accumulation and enhancing charge-transfer efficiency at the electrode interface.
Electrochemical measurements were conducted within a potential window of −0.35 V to +0.80 V (vs. Ag/AgCl) at a scan rate of 50 mV·s−1. These parameters were selected to ensure reproducible faradaic responses while minimizing capacitive contributions associated with the high surface area of the CNT membrane. The chosen potential window fully encompasses the reversible redox behavior of the ferro/ferricyanide probe while avoiding water electrolysis and irreversible CNT oxidation processes. The scan rate of 50 mV·s−1 was determined through preliminary optimization, in which lower scan rates led to increased double-layer charging currents and broader capacitive backgrounds, whereas higher scan rates caused peak distortion and reduced signal stability under flow conditions. The selected scan rate therefore represents an optimal compromise that suppresses CNT capacitive effects while preserving well-defined faradaic peaks and stable peak separation.
The combined effects of controlled filtration performance, enhanced mass transport, and dynamic accumulation result in a highly sensitive and stable electrochemical response, forming the basis for the results discussed in Section 3 and Section 4. All measurements were performed using identical electrochemical parameters to ensure consistency and reproducibility across experiments and to enable reliable comparison between filter and non-filter configurations.
2.4. Morphological Characterization of the Sensor
Figure 4 presents a comprehensive surface and structural characterization of the CNT-based working electrode. In Figure 4A, AFM imaging of the pristine CNT membrane revealed a dense, interwoven nanotube network with uniform nanoscale porosity, providing a high electroactive surface area and efficient electron transport pathways. After exposure to AuNPs, Figure 4B showed increased surface roughness and distinct bright spherical features attributed to AuNP adsorption through π–π stacking and physisorption, confirming the membrane’s capability to selectively capture nanoscale analytes.
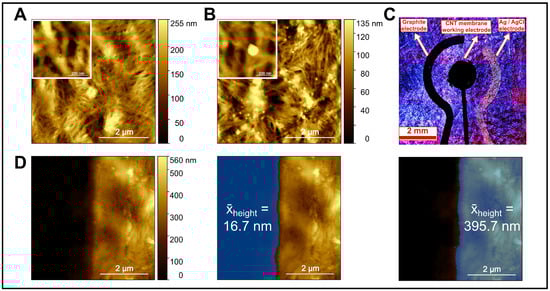
Figure 4.
Surface and structural characterization of the CNTs membrane and integrated electrode. (A) AFM image of the bare CNTs membrane showing a uniform fibrous network. (B) AFM image of the CNTs membrane after AuNPs injection. (C) Confocal microscopic image of the electrode assembly. (D) AFM tip-scratch of the CNT membrane showing the step-height used to measure CNT membrane thickness, with averages taken from both sides of the scratched region. Insets in (A,B) are high-resolution magnifications of the bare CNTs and the AuNP–CNT composite, respectively.
The membrane’s porosity was further analyzed through nitrogen adsorption–desorption measurements, yielding a BET surface area of 168.35m2g−1 and an average pore diameter of 10.77 nm, classifying it as mesoporous. These characteristics facilitate analyte infiltration and accumulation, thereby enhancing electrochemical sensitivity.
In Figure 4C, confocal laser scanning microscopy (CLSM) was employed to visualize the spatial arrangement of the electrodes on the microfabricated substrate. Confocal imaging was preferred over conventional optical microscopy due to its superior image clarity, contrast, and edge definition achieved by eliminating out-of-focus light through a spatial pinhole. This enabled clear discrimination between the graphite counter electrode, Ag/AgCl reference electrode, and CNT-based working electrode, despite the reflective and irregular surface of the CNT film. The technique verified accurate alignment, uniform CNT coverage, and well-defined electrode boundaries, confirming the precision and reproducibility of the fabrication process.
Figure 4D presents an AFM tip-scratch experiment conducted to determine the CNT membrane thickness. The AFM tip mechanically removed a narrow section of the CNT layer, exposing the underlying substrate and creating a measurable step between the scratched and intact regions. The average height difference across this step was approximately 395.7 nm, compared to the adjacent bare substrate region (∼16.7 nm), confirming successful CNT membrane deposition and strong adhesion to the substrate. This quantitative thickness measurement supports the observed electrochemical stability and efficient conductive network formation within the sensor.
SEM and EDS analyses confirmed the morphological and elemental characteristics of the CNT membrane before and after interaction with AuNPs (Figure 5). In Figure 5A, the pristine CNT membrane exhibited a porous, fibrous network with uniform entanglement, supporting a high surface area and facilitating efficient analyte access. After exposure to AuNPs (Figure 5B), distinct spherical nanoparticles were observed adhered to the CNT surface, distributed uniformly across the membrane with sizes consistent with the expected particle dimensions. This morphological evidence confirmed successful AuNP retention, likely driven by π–π and physisorption interactions.
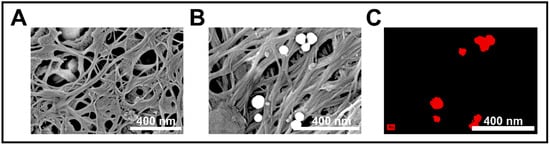
Figure 5.
(A) SEM image of the bare CNT membrane showing a porous fibrous structure with nanoscale interconnections. (B) SEM image after AuNP exposure, revealing uniformly distributed spherical gold nanoparticles embedded on the CNT network. (C) EDS elemental mapping confirming the presence and distribution of Au (shown in red) on the CNT surface, indicating successful nanoparticle trapping via surface interaction.
To verify elemental composition, EDS mapping revealed strong, localized signals corresponding to gold (Au) on the spherical features. The presence of these Au signals confirmed selective trapping and accumulation of AuNPs on the CNT membrane, validating the membrane’s dual role as both a physical filter and a chemical anchoring surface within the sensing system.
2.5. Raman Analysis
Raman spectroscopy was used to compare four electrode materials: Ag/AgCl electrode, CNT working electrode, CNT powder, and graphene electrode (Figure 6). The CNT-based electrodes exhibited characteristic D and G bands at approximately 1350 cm−1 and 1580 cm−1, respectively, corresponding to disordered carbon and sp2-hybridized graphitic domains. A distinct D′ band near 1620 cm−1 was also observed, typically associated with lattice defects and edge-plane contributions in CNTs and graphene. The 2D band, located around 2700 cm−1, appeared most prominently in the carbon graphene electrode spectrum, confirming its multilayer structure.
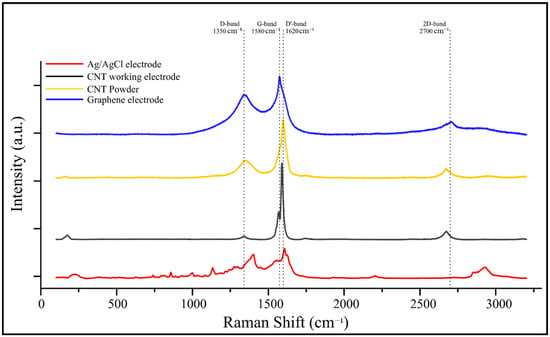
Figure 6.
Raman spectra of different electrode materials used in the sensor platform. The spectra include Ag/AgCl reference electrode (red), CNT working electrode (black), CNT powder (yellow), and graphene electrode (blue). Key Raman bands are labeled, including the D-band (∼1350 cm−1), G-band (∼1580 cm−1), D′-band (∼1620 cm−1), and 2D-band (∼2700 cm−1), indicating structural features, disorder, and graphitization levels of the carbon-based materials.
Red shifts and variations in intensity ratios among the D and G bands across the samples indicated structural differences and varying degrees of disorder, with the Ag/AgCl electrode showing the largest shift—likely due to background interference. The CNT working electrode exhibited a well-defined graphitic structure with moderate disorder, confirming preservation of π–π conjugation essential for efficient charge transfer in electrochemical sensing applications.
3. Results
3.1. Filter Performance
The sensor’s filtration behavior was assessed using two microfluidic configurations: a filter-integrated CNT membrane, where a CNT membrane was positioned over a through-hole in the PET substrate to enable through-membrane filtration, and a non-filter chip, where the CNT membrane was deposited directly onto an intact PET surface. Both designs incorporated microchannels to direct electrolyte flow, but only the filter chip allowed the solution to pass through the CNT layer, thereby establishing a true filtration-driven interaction with the electrode interface.
Both devices were first flushed with 0.1 mol·L−1 sodium citrate buffer to remove baseline artifacts and stabilize the electrochemical response. Subsequently, an AuNP solution in sodium citrate buffer (0.1 mol·L−1 value corresponds to the total molar concentration of gold atoms (from HAuCl4 precursor) in the sodium citrate buffer, not the number of nanoparticles) was introduced via a syringe pump. The solution was injected continuously, and every two minutes the flow was paused to record cyclic voltammograms (CVs). For each measurement, a 5 mmol·L−1 ferro/ferricyanide (K4[Fe(CN)6]/K3[Fe(CN)6]) redox probe was used. This injection–pause–measure cycle was repeated until the current stabilized, indicating surface saturation and a steady electrode interface.
AuNPs formed on the CNT surface via electrochemical reduction of tetrachloroaurate ions according to the equation:
Progressive AuNP growth increased the electroactive area and enhanced charge-transfer pathways within the CNT network, while the ferro/ferricyanide couple served as a consistent one-electron redox probe for monitoring interfacial kinetics.
Figure 7 shows the electrochemical measurements of the CNT membrane under different conditions, highlighting the influence of electrolyte flow and electrode configuration on redox behavior.
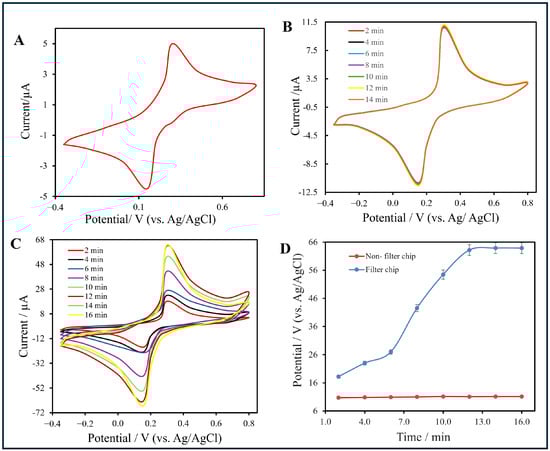
Figure 7.
(A) Cyclic voltammogram (CV) of sodium citrate buffer showing baseline current behavior. (B) CV responses of the non-filter chip recorded at different time intervals (2–14 min). (C) CV responses of the filter-integrated chip measured from 2 min to 16 min. (D) Plot of oxidation peak current () versus accumulation time for both configurations. For (B,C), measurements were conducted using a 0.1 mol·L−1 AuNP solution at a scan rate of 50 mV·s−1 under identical flow conditions. The time baseline (0 min) corresponds to the initiation of AuNP injection into the microfluidic channel.
As a baseline, Figure 7A presents the cyclic voltammetry (CV) responses of both the bare CNT/PET and the filter-type electrodes after a 2 min injection of sodium citrate buffer. In both cases, broad and shallow redox peaks were observed, indicating sluggish electron-transfer kinetics and a predominantly capacitive process. This similarity supports that, prior to functionalization, the CNT network exhibits limited electrochemical activity regardless of flow configuration.
Figure 7B shows the CV response of the non-filter chip after functionalization, where the electrolyte did not pass through the CNT layer. Small and nearly constant peaks appeared at +0.35 V (oxidation) and +0.16 V (reduction), suggesting diffusion-controlled, mixed faradaic behavior and restricted ion accessibility within the CNT matrix.
In contrast, Figure 7C displays the CV response of the filter-type chip, where the electrolyte solution flowed directly through the CNT layer. Two well-defined peaks at approximately +0.30 V (oxidation) and +0.16 V (reduction) correspond to the reversible [Fe(CN)6]3−/[Fe(CN)6]4− redox couple. The peak-to-peak separation (ΔEp ≈ 0.14 V) indicates quasi-reversible electron-transfer kinetics. Progressive current enhancement across successive scans validated the continuous nucleation of AuNPs and the formation of a stable, conductive CNT–AuNP interface.
To enable a better comparison between the two configurations, Figure 7D summarizes the variation of the oxidation peak current (Ip) as a function of accumulation time. For the filter chip, Ip increased steadily from approximately 20 μA at 2 min to 63.3 μA at 14 min before reaching a plateau, indicating the saturation of active sites. In contrast, the non-filter chip maintained a nearly constant current (∼10 μA) throughout, confirming limited accumulation and inferior charge-transfer efficiency.
Table 1 summarizes the repeatability of the electrochemical sensor responses obtained from three independently fabricated devices, with and without the integrated CNT filter membrane. The mean, standard deviation (SD), and relative standard deviation (RSD%) were calculated according to [34]:
and
where xi represents each individual current measurement, is the mean value, and n is the number of replicates. SD indicates the absolute variability of the data, while RSD expresses this variability relative to the mean in percentage form, allowing for direct comparison between datasets of different magnitudes. A smaller RSD% reflects greater measurement consistency and improved sensor stability.

Table 1.
Repeatability comparison of CNT-based electrochemical sensors with and without integrated filter membranes at 0.1 mol·L−1 AuNPs concentration ().
For the filter-equipped sensors (Table 1), the maximum oxidation currents ranged from 62.7–63.3 µA, with a mean of 63.0 ± 0.3 µA and an RSD = 3%, confirming excellent reproducibility and uniform electrochemical performance. This stability can be attributed to the CNT membrane’s ability to promote consistent analyte accumulation, enhance electron transfer, and minimize diffusion-related fluctuations.
In contrast, the non-filter devices exhibited substantially lower peak currents (10.9–11.1 μA) but a slightly lower relative standard deviation (RSD = 2.86%) compared with the filter-based sensors (RSD = 3.0%). This indicates that, although the non-filter configuration provided marginally more consistent measurements, the absence of electrolyte filtration significantly reduced the effective charge-transfer efficiency and overall electrochemical performance.
Error bars in Figure 7D represent the SD obtained from three independent measurements (n = 3) at each analyte concentration. For the filter-integrated CNT membrane sensor, visible error bars reflect minor device-to-device variability associated with analyte accumulation and transport through the CNT network. In contrast, the error bars for the non-filter configuration are extremely small and are not visually discernible at the scale of the plotted data, indicating highly consistent but significantly lower signal responses. This observation is consistent with the limited analyte accumulation and reduced charge-transfer efficiency of the non-filter device.
In this study, all AuNP concentrations are expressed in mol·L−1 based on the molar concentration of gold atoms, rather than the molar concentration of individual nanoparticles. This convention reflects the preparation of the AuNP suspensions and is commonly used when reporting concentrations of metallic nanoparticles synthesized and stabilized in solution.
For clarity and reproducibility, the relationship between gold atomic molarity, the corresponding number of nanoparticles per liter, and the equivalent molar concentration of gold nanoparticles is explicitly defined. The conversion is based on the physical properties of gold and the geometric volume of a spherical AuNPs with a diameter of 60 nm. Specifically, each 60 nm AuNP contains approximately 6.7 × 10⁶ gold atoms, calculated using the bulk density of gold (19.3 g·cm−3), the molar mass of gold (197 g·mol−1), the particle volume (1.13 × 10⁻¹⁶ cm3), and Avogadro’s number (6.022 ×10²³ mol−1).
Table 2 summarizes the mathematical conversion between gold atomic molarity (mol·L−1), the number concentration of AuNPs (particles·L−1), and the corresponding molar concentration of AuNPs (mol·L−1). The table includes a general conversion example as well as the converted values corresponding to the experimentally determined limits of detection for the non-filtered and filter-integrated CNT sensor configurations reported in this work.
Table 2.
LOD unit conversion from the molarity of gold atoms (mol·L−1) to the molarity of gold particles (mol·L−1) detected by the non-filtered and filtered CNT sensor membranes.
3.2. Concentration-Dependent Electrochemical Behavior and Calibration Analysis
The influence of analyte concentration on the electrochemical response was systematically investigated for both the filter and non-filter sensor configurations using (CV) in redox probe. All measurements were conducted within a potential window of −0.35 V to +0.80 V (vs. Ag/AgCl) at a scan rate of 50 mV·s−1. For each concentration, the current response was recorded at steady state after the saturation time was reached, since lower concentrations required longer accumulation due to slower diffusion and adsorption kinetics.
As shown in Figure 8, the baseline CV (Figure 8A) obtained in sodium-citrate buffer containing the ferro/ferricyanide redox couple exhibited weakly faradaic, capacitive-dominated behavior. In the non-filter configuration (Figure 8B), CVs recorded at AuNP concentrations from 0.1 mol·L−1 to 0.0001 mol·L−1 displayed nearly constant oxidation and reduction peaks at +0.32 V and +0.18 V, respectively, with currents between 5 µA and 11 µA. No significant current increase was observed with decreasing concentration, confirming diffusion-limited transport and the absence of active accumulation. Below 0.001 mol·L−1, the faradaic response merged with the baseline, establishing the experimental LOD for the non-filter chip at approximately 1.0 × 10⁻³ mol·L−1.
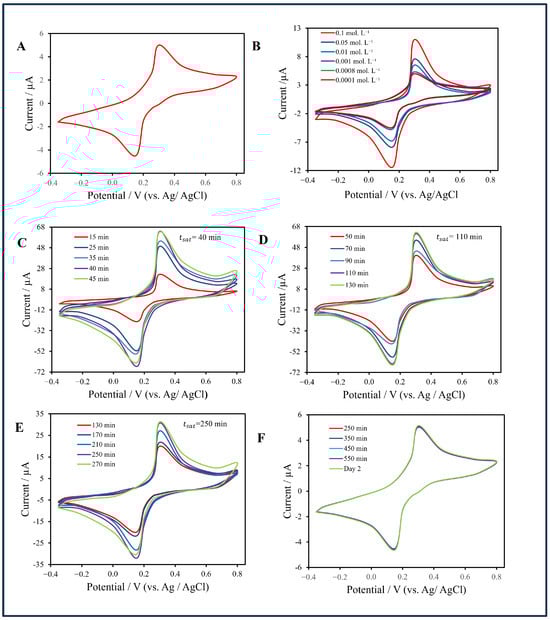
Figure 8.
(A) Baseline cyclic voltammogram (CV) in sodium-citrate buffer with ferro/ferricyanide redox couple. (B) CVs of the non-filter chip recorded at AuNP concentrations from 0.1 to 0.0001 (mol·L−1. (C–E) CV responses of the filter-integrated CNT membrane chip at 0.01, 0.001, and 0.00075 (mol·L−1, respectively, showing concentration-dependent current enhancement. (F) CV responses of the filter-integrated CNT membrane at a concentration of 0.0001 mol·L−1, demonstrating the reproducibility of the electrochemical response at concentrations below the detection limit.
In contrast, the filter-integrated CNT membrane sensor (Figure 8C–F) showed pronounced concentration-dependent current amplification. At 0.01 mol·L−1, the oxidation peak reached approximately 63 µA after 40 min; at 0.001 mol·L−1, the current plateaued at 60 µA after 110 min; and at 0.00075 mol·L−1, it stabilized at 33 µA after 250 min. Below this level, the voltammogram merged with the baseline, giving an experimental LOD of 7.5 × 10⁻⁴ mol·L−1—about fifteen times lower than that of the non-filter configuration. This improvement arises from perpendicular convective flow through the CNT membrane, which enhances analyte trapping, increases the electroactive surface area, and accelerates charge transfer.
Unlike the diffusion-controlled non-filter system, the filter-integrated configuration operates under a convective–adsorptive transport regime. An effective sensitivity (Seff) was defined as:
where is the steady-state current, is the baseline current, and is the analyte concentration [35]. Practically, was defined as the point at which the oxidation peak current () varied by less than 5% between two consecutive measurement cycles under identical flow and electrochemical conditions, indicating stabilization of the system and saturation of the available electroactive sites within the CNT membrane. The accumulation rate was given by:
showing a near-linear dependence on , consistent with a first-order accumulation mechanism [36].
The experimental data were fitted with empirical calibration equations:
The higher exponent () for the filter sensor indicates faster accumulation and stronger mass transport compared with the non-filter sensor ().
3.3. Detection Limits and Accuracy
The theoretical limits of detection (LODs), calculated using
with = 0.16 μA, were 9.0 × 10⁻² mol·L−1 for the non-filter sensor and 1.8 × 10⁻³ mol·L−1 for the filter-integrated sensor. Experimentally, the LODs were 1.0 × 10⁻³ mol·L−1 and 7.5 × 10⁻⁴ mol·L−1, respectively.
Measurement accuracy (%) was calculated according to:
The mean accuracy values were 88.7% for the non-filter chip and 90.5% for the filter-integrated configuration, indicating stable and quantitatively reliable electrochemical performance in both cases. A comparative summary of the key analytical metrics for each sensor type is provided in Table 3.
Table 3.
Analytical performance comparison between the filter-integrated and non-filter CNT-based electrochemical sensors.
Experimentally, concentrations below 7.5 × 10⁻⁴ (mol·L−1) produced no discernible oxidation peaks in the filter configuration, establishing a practical LOD of 7.5 × 10⁻⁴ mol·L−1, which corresponds to the molar concentration of gold atoms in the citrate buffer.
The filter-integrated sensor demonstrated a broader linear response range, a substantially lower detection limit, and an accumulation rate up to four times higher than that of the non-filter configuration. Its enhanced sensitivity and reduced LOD indicate that the CNT membrane effectively promotes mass transport and strengthens quantitative performance. In contrast, the non-filter device, while stable, remained limited by diffusion-controlled transport, resulting in slower analyte accumulation and weaker current amplification. These results confirm that the filtration-assisted CNT architecture provides superior sensitivity and robust calibration across an extended concentration range, making it well suited for trace-level electrochemical detection.
Table 4 presents the reproducibility and accuracy data for both configurations across different analyte concentrations, including the mean current (I), SD, and relative standard deviation (RSD%). For the filter-integrated sensor, SD values ranged between 0.19 and 2.1 μA, with corresponding RSD values of 3.02–5.17%, depending on analyte concentration. At higher concentrations (0.1–0.001 mol·L−1), RSD values remained below 3.5%, confirming stable electrochemical performance and uniform analyte accumulation. The slightly elevated RSD (∼5.17%) observed at 0.00075 (mol·L−1) is attributed to diffusion limitations and minor variability in nanoparticle trapping at low analyte levels.
Table 4.
Reproducibility and accuracy of the CNT-based electrochemical sensors (filter and non-filter configurations) across different AuNP concentrations, showing mean current (I), standard deviation (SD), relative standard deviation (RSD), and number of replicates (n).
The non-filter configuration also exhibited strong repeatability, with SD values between 0.18 and 0.32 μA and RSD values ranging from 2.91–4.40%, well within the acceptable range (RSD < 5%) for electrochemical sensors. However, because the overall current magnitude was lower, the diffusion-limited non-filter system offered precision at the expense of sensitivity. Both configurations demonstrated reliable and repeatable electrochemical responses, but the filter-integrated CNT sensor achieved superior signal amplification while maintaining excellent reproducibility, making it more advantageous for quantitative sensing applications.
4. Discussion
The electrochemical results collectively underscore the pivotal role of the CNT membrane’s filtration mechanism in enhancing sensor performance. Comparing the filter-integrated CNT membrane and non-filter configurations shows that introducing a convective flow pathway through the CNT network fundamentally alters the system’s behavior—shifting it from a diffusion-limited interface to a highly efficient convective–adsorptive sensing platform.
4.1. Influence of Filtration on Electrochemical Behavior
The filter-integrated CNT chip consistently produced higher oxidation currents (up to ∼63 μA) compared with the non-filter device (∼11 μA). This enhancement arises from perpendicular electrolyte flow through the CNT membrane, which actively drives analyte molecules through the porous conductive structure. As a result, analytes experience repeated interaction with the electroactive CNT–AuNP interface, leading to rapid accumulation and improved electron-transfer kinetics. The well-defined, symmetric redox peaks and reduced peak-to-peak potential separation (ΔEp ≈ 0.14 V) observed for the filter configuration confirm quasi-reversible kinetics and superior charge transfer.
In contrast, the non-filter configuration—limited to lateral diffusion along the CNT surface—exhibited small, broad peaks and slow current stabilization, typical of diffusion-controlled systems. While the non-filter sensor achieved slightly lower variability (RSD = 2.86%) than the filter chip (RSD = 3.0%), its response was considerably weaker, underscoring the decisive advantage of convective mass transport over non-filter system.
Although the CNT membrane thickness was reproducibly measured to be approximately 0.4 μm using AFM tip-scratch analysis and profilometry (Figure 4D), further refinement of membrane thickness control may further enable optimized tuning of flow resistance, mass transport, and accumulation behavior in future studies.
4.2. Concentration Dependence and Accumulation Kinetics
When analyte concentration was varied, the differences between the two sensor architectures became more pronounced. The filter-integrated sensor displayed a strong concentration-dependent current amplification, while the non-filter chip showed nearly constant responses across concentrations from 0.1 to 0.0001 (mol·L−1). The filter configuration achieved an experimental LOD of 7.5 ×10⁻⁴ (mol·L−1), approximately fifteen times lower than that of the non-filter device (1.0 × 10⁻³ (mol·L−1)).
This improvement reflects the CNT membrane’s dual role as a filtration and preconcentration medium. Continuous perpendicular flow through the porous CNT structure enhances analyte entrapment and accumulation at electroactive sites, accelerating electron transfer and amplifying the faradaic signal. The convective–adsorptive regime established by this architecture leads to faster saturation times and higher steady-state currents across all tested concentrations.
4.3. Calibration Behavior and Analytical Parameters
Empirical calibration modeling revealed distinct accumulation dynamics between the two systems. The time exponents in the current–concentration–time relationships (n = 0.42 for the filter and n = 0.32 for the non-filter) both fall below unity, confirming sublinear accumulation kinetics typical of adsorption-limited growth. However, the higher exponent for the filter configuration indicates faster current development and more efficient analyte delivery to active sites.
The effective sensitivity () and accumulation rate () of the filter-based device were substantially higher, indicating that current growth is dominated by mass transport rather than limited by diffusion. These results are consistent with the observed increase in electroactive surface area and the formation of conductive AuNP networks under convective flow.
4.4. Accuracy and Reproducibility
In addition to sensitivity, the accuracy and reproducibility of the CNT-based sensor was comprehensively evaluated. The filter-integrated CNT chip achieved an average accuracy of 90.5%, slightly higher than the 88.7% obtained for the non-filter configuration. This improvement reflects a stronger correlation between experimental and theoretical current responses, underscoring the stability and predictability of the convective sensing mechanism. Both sensor configurations exhibited excellent precision, with (RSD) values below 5% across all tested concentrations.
A slightly higher RSD (∼5.17%) was observed at trace concentration levels for the filter-integrated sensor, likely due to minor variations in nanoparticle trapping within the CNT pores, which become more pronounced at very low analyte concentrations. Nevertheless, this variation remains well within the acceptable range for electrochemical sensors and does not compromise analytical reliability. The consistent redox profiles, steady saturation behavior, and narrow standard deviations confirm that the CNT membrane structure enables uniform adsorption and reproducible electrochemical performance.
As summarized in Table 5, the proposed CNT membrane sensor exhibits distinct advantages compared with other reported filter-based nanomaterial platforms. Its dual functionality—as both a conductive electrode and an active filtration medium—enables efficient signal amplification with minimal fabrication complexity. Unlike conventional polymeric or oxide-based filters that require complex nanoparticle coatings or SERS enhancement steps, the unmodified CNT membrane achieves comparable or superior sensitivity (LOD = 1.12 × 10⁻¹⁰ (mol·L−1), particles) and excellent reproducibility (RSD 3–5%) at a fraction of the cost (~US$5 per chip).
Table 5.
Comparison of this work with recent nanoparticle detection systems.
Beyond analytical precision, the operational stability of the CNT membrane is critical for practical microfluidic sensing. The CNT-integrated filter chip maintained stable electrochemical behavior under continuous flow for up to 24 h, as evidenced by reproducible current plateaus and minimal signal drift across multiple devices and repeated injection–pause–measurement cycles. No membrane delamination or degradation of the electrochemical response was observed, supporting the robustness of the bonding strategy and the mechanical integrity of the CNT network.
Although quantitative permeability or pressure-drop measurements were not performed, qualitative observations during prolonged operation indicate stable flow-through behavior. The absence of signal decay or abrupt current fluctuations suggests that significant membrane clogging did not occur under the applied conditions. While local variations in membrane thickness or pore distribution may influence flow resistance, the consistent electrochemical responses obtained across independently fabricated devices indicate reproducible hydraulic performance within the operating range of this study.
4.5. Limitations Affecting Detection Limit and Perspectives for Further Optimization
Although the filter-integrated CNT membrane sensor demonstrates a clear improvement in detection limit compared to the non-filter configuration, the magnitude of this enhancement remains moderate. This outcome reflects both the deliberate design choices of the present study and intrinsic limitations associated with a purely physical accumulation mechanism. In the current configuration, analyte enrichment relies primarily on size-selective filtration and non-specific adsorption within the CNT network, without the incorporation of chemical or affinity-based functionalization.
Beyond size-based exclusion, nanoparticle surface chemistry and material composition play a crucial role in governing filtration efficiency and electrochemical response within the CNT membrane [42]. Surface charge and stabilizing ligands influence electrostatic and π–π interactions with the CNT network, thereby affecting adsorption strength, accumulation rate, and effective residence time [43]. For example, nanoparticles with positively charged or aromatic surface groups may exhibit stronger retention within the CNT matrix, leading to enhanced current amplification, whereas highly hydrophilic or neutrally charged coatings may reduce interaction strength and limit accumulation [44]. Particle composition further affects electron-transfer kinetics and catalytic behavior at the CNT–nanoparticle interface.
Additional technical limitations arise from the structural characteristics of CNT membranes fabricated by vacuum filtration. While this method enables reproducible, large-area membrane formation, small variations in membrane thickness, porosity, and nanotube packing density can influence local flow resistance, analyte residence time, and adsorption efficiency, particularly at ultra-low concentrations. In this study, the CNT membrane thickness was experimentally measured using both AFM tip-scratching (Figure 4D) and profilometry, with both methods consistently indicating an average thickness of approximately 0.4 μm. Although this thickness was reproducible across devices, further refinement of membrane thickness control and structural uniformity could enable more precise tuning of mass transport and accumulation behavior in future studies.
It should also be noted that monodisperse and colloidally stable AuNPs were intentionally employed as model analytes to enable systematic investigation of size-dependent filtration and accumulation mechanisms. While this choice provides mechanistic clarity, real-world nanoparticle systems often exhibit broader size distributions, aggregation, or surface heterogeneity, which may influence transport dynamics and membrane interactions. These factors should be considered when extending the present approach to more complex analytical targets.
Despite these limitations, the proposed filtration-assisted sensing architecture provides a robust and scalable foundation for future development. The incorporation of analyte-specific functionalization strategies, combined with improved control over membrane structure, is expected to significantly magnify sensitivity and expand applicability toward more complex analytical scenarios.
5. Conclusions
A CNT-integrated microfluidic electrochemical sensor was successfully developed and evaluated using gold nanoparticles AuNPs as a model analyte. The platform incorporated screen-printed electrodes on a PET substrate, a PDMS microchannel, and a CNT membrane that operated simultaneously as a filtration layer and a working electrode. This configuration enhanced analyte trapping, increased the electroactive surface area, and accelerated electron transfer under convective flow. The use of AuNPs provided a controlled system to examine particle transport, adsorption, and size-dependent retention within the CNT network, validating the filtration-assisted accumulation mechanism and supporting the theoretical basis for nanoparticle preconcentration prior to potential biosensing extension.
Comparative electrochemical analysis revealed that the filter-integrated CNT sensor exhibited markedly superior analytical performance compared with the non-filter device. The filter-based chip achieved a linear range of 1 × 10⁻⁴–1 × 10⁻³ (mol·L−1), an experimental LOD of 7.5 × 10⁻⁴ (mol·L−1), and of 265 μA·mol−1 s−1.
In contrast, the non-filter system demonstrated a narrower range of 1 × 10⁻²–1 × 10⁻¹ mol·L−1, a higher LOD of 1.0 × 10⁻³ mol·L−1, and a lower of 5.3 μA·mol−1 s−1 The () also showed a distinct enhancement for the filter configuration (0.13–1.58 μA·min−1) compared to the non-filter chip (0.40–0.44 μA·min−1).
Both configurations exhibited reliable reproducibility, with RSD values between 2.9–5.2% and accuracy between 88.7 and 90.5%, confirming consistent electrochemical responses. The results demonstrate that convective flow through the porous CNT membrane effectively enhances mass transport, analyte enrichment, and electrochemical signal amplification. The filtration-assisted mechanism validated the theoretical model of size-selective preconcentration, providing a robust foundation for extending this platform to biological and clinical analyte detection.
Overall, the CNT-integrated microfluidic sensor represents a scalable and versatile platform for high-performance electrochemical sensing and on-chip sample preparation. By combining selective filtration with enhanced electrochemical transduction, it offers strong potential for integration into next-generation diagnostic technologies and lab-on-chip systems, including emerging nano-biosensor platforms.
Author Contributions
Conceptualization, A.U.B., P.-V.C. and R.I.; methodology, A.U.B.; software, A.U.B. and M.J.; validation, A.U.B. and M.J.; formal analysis, A.U.B. and M.J.; resources, R.I. and P.-V.C.; data curation, A.U.B. and M.J.; writing—original draft preparation, A.U.B.; writing—review and editing, M.J., R.I. and P.-V.C.; visualization, A.U.B. and M.J.; supervision, P.-V.C. and R.I.; project administration, P.-V.C. and R.I.; funding acquisition, P.-V.C. and R.I. All authors have read and agreed to the published version of the manuscript.
Funding
This research was funded by the Natural Sciences and Engineering Research Council of Canada (NSERC) through Discovery Grants awarded to Ricardo Izquierdo and Paul-Vahe Cicek.
Institutional Review Board Statement
Not applicable.
Informed Consent Statement
Not applicable.
Data Availability Statement
The original contributions presented in this study are included in the article. Further inquiries can be directed to the corresponding author.
Acknowledgments
The authors acknowledge the use of the LaCIME research facilities at École de technologie supérieure (ÉTS) and the NanoQAM cleanroom facilities at the Université du Québec à Montréal (UQAM). The authors also thank the Québec research networks ReSMiQ (Réseau de recherche en microsystèmes du Québec) and CQMF (Centre québécois sur les matériaux fonctionnels) for their support.
Conflicts of Interest
The authors declare no conflicts of interest.
Abbreviations
The following abbreviations are used in this manuscript:
| AFM | Atomic force microscopy |
| Au | Gold |
| AuNPs | Gold nanoparticles |
| BET | Brunauer–Emmett–Teller |
| Bulk concentration | |
| CNT | Carbon nanotube |
| CV | Cyclic voltammetry |
| DIW | Deionized water |
| EDS | Energy-dispersive X-ray spectroscopy |
| Baseline current | |
| Steady-state oxidation current | |
| Peak current | |
| Maximum current | |
| LOD | Limit of detection |
| MWCNT | Multi-walled carbon nanotube |
| NPs | Nanoparticles |
| PDMS | Polydimethylsiloxane |
| PET | Polyethylene terephthalate |
| RSD | Relative standard deviation |
| Accumulation rate | |
| Effective sensitivity | |
| SD | Standard deviation |
| SDS | Sodium dodecyl sulfate |
| SEM | Scanning electron microscopy |
| Standard deviation of baseline current (noise) | |
| SWCNT | Single-walled carbon nanotube |
| UV–Vis | Ultraviolet–visible spectroscopy |
References
- Bhardwaj, J.; Sharma, A.; Jang, J. Vertical flow-based paper immunosensor for rapid electrochemical and colorimetric detection of influenza virus using a different pore size sample pad. Biosens. Bioelectron. 2019, 126, 36–43. [Google Scholar] [CrossRef]
- Rizzotto, F.; Khalife, M.; Hou, Y.; Chaix, C.; Lagarde, F.; Scaramozzino, N.; Vidic, J. Recent Advances in Electrochemical Biosensors for Food Control. Micromachines 2023, 14, 1412. [Google Scholar] [CrossRef] [PubMed]
- Islam, M.A.; Karim, A.; Ethiraj, B.; Raihan, T.; Kadier, A. Antimicrobial peptides: Promising alternatives over conventional capture ligands for biosensor-based detection of pathogenic bacteria. Biotechnol. Adv. 2022, 55, 107901. [Google Scholar] [CrossRef] [PubMed]
- Rajarathinam, T.; Kang, M.; Hong, S.; Chang, S.C. Nanocomposite-Based Electrochemical Sensors for Neurotransmitters Detection in Neurodegenerative Diseases. Chemosensors 2023, 11, 103. [Google Scholar] [CrossRef]
- Leau, S.A.; Lete, C.; Lupu, S. Nanocomposite Materials Based on Metal Nanoparticles for the Electrochemical Sensing of Neurotransmitters. Chemosensors 2023, 11, 179. [Google Scholar] [CrossRef]
- Camilli, L.; Passacantando, M. Advances on Sensors Based on Carbon Nanotubes. Chemosensors 2018, 6, 62. [Google Scholar] [CrossRef]
- Malik, S.; Sachan, R.S.K.; Devgon, I.; Devgon, J.; Pant, G.; Panchpuri, M.; Ahmad, A.; Alshammari, M.B.; Hossain, K.; Kumar, G. Gold Nanoparticles in Nanobiotechnology: From Synthesis to Biosensing Applications. ACS Omega 2024, 9, 14562–14576. [Google Scholar] [CrossRef]
- Johnson, B.J.; Nasir, M.; Siefert, R.L.; Leska, I.A.; Erickson, J.S.; Charles, P.T.; Melde, B.J.; Taft, J.R. Electrochemical Detection with Preconcentration: Nitroenergetic Contaminants. Chemosensors 2014, 2, 131–144. [Google Scholar] [CrossRef]
- Singh, R.; Gupta, R.; Bansal, D.; Bhateria, R.; Sharma, M. A Review on Recent Trends and Future Developments in Electrochemical Sensing. ACS Omega 2024, 9, 21345–21364. [Google Scholar] [CrossRef]
- Takasaki, K.; Aihara, H.; Imanaka, T.; Matsudaira, T.; Tsukahara, K.; Usui, A.; Minamoto, T.; Yamamoto, S. Water Pre-filtration Methods to Improve Environmental DNA Detection by Real-Time PCR and Metabarcoding. PLoS ONE 2021, 16, e0250162. [Google Scholar] [CrossRef]
- Zhang, Y.; Xu, C.; Guo, T.; Hong, L.; Zhang, W. An Automated Bacterial Concentration and Recovery System for Pre-enrichment Required in Rapid Escherichia coli Detection. Sci. Rep. 2018, 8, 17808. [Google Scholar] [CrossRef] [PubMed]
- Lin, X.; Huang, X.; Zhu, Y.; Urmann, K.; Xie, X.; Hoffmann, M.R. Asymmetric Membrane for Digital Detection of Single Bacteria in Milliliters of Complex Water Samples. ACS Nano 2018, 12, 10281–10290. [Google Scholar] [CrossRef] [PubMed]
- Le Brun, G.; Hauwaert, M.; Leprince, A.; Glinel, K.; Mahillon, J.; Raskin, J.P. Electrical Characterization of Cellulose-Based Membranes towards Pathogen Detection in Water. Biosensors 2021, 11, 57. [Google Scholar] [CrossRef]
- Sahu, L.R.; Yadav, A.; Mishra, P.K. Polymeric Membranes for Liquid Separation: Innovations in Materials, Fabrication and Performance. Polymers 2024, 16, 3240. [Google Scholar] [CrossRef] [PubMed]
- Jarrar, R.; Abbas, M.K.G.; Al-Ejji, M. Environmental Remediation and the Efficacy of Ceramic Membranes in Wastewater Treatment—A Review. Emergent Mater. 2024, 7, 1295–1327. [Google Scholar] [CrossRef]
- Wen, Y.; Yang, X.; Li, Y.; Yan, L.; Zhao, Y.; Shao, L. Progress Reports of Metal-Phenolic Network Engineered Membranes for Water Treatment. Sep. Purif. Technol. 2023, 320, 124225. [Google Scholar] [CrossRef]
- Formoso, P.; Pantuso, E.; De Filpo, G.; Nicoletta, F.P. Electro-Conductive Membranes for Permeation Enhancement and Fouling Mitigation: A Short Review. Membranes 2017, 7, 39. [Google Scholar] [CrossRef]
- Regmi, C.; Kshetri, Y.K.; Wickramasinghe, S.R. Carbon-Based Nanocomposite Membranes for Membrane Distillation: Progress, Problems and Future Prospects. Membranes 2024, 14, 160. [Google Scholar] [CrossRef]
- Zhou, Y.; Fang, Y.; Ramasamy, R.P. Non-Covalent Functionalization of Carbon Nanotubes for Electrochemical Biosensor Development. Sensors 2019, 19, 392. [Google Scholar] [CrossRef]
- Trusso Sfrazzetto, G.; Santonocito, R. Nanomaterials for Cortisol Sensing. Nanomaterials 2022, 12, 3790. [Google Scholar] [CrossRef]
- Arora, B.; Attri, P. Carbon Nanotubes (CNTs): A Potential Nanomaterial for Water Purification. J. Compos. Sci. 2020, 4, 135. [Google Scholar] [CrossRef]
- Pyrzynska, K. Recent Applications of Carbon Nanotubes for Separation and Enrichment of Lead Ions. Separations 2023, 10, 152. [Google Scholar] [CrossRef]
- Pérez, E.M.; Martín, N. π–π Interactions in Carbon Nanostructures: Significance for Trapping Aromatic Molecules. Chem. Soc. Rev. 2015, 44, 6425–6433. [Google Scholar] [CrossRef]
- Ferrari, E.; D’Agata, R.; Spoto, G. Gold Nanoparticle-Based Plasmonic Biosensors. Biosensors 2023, 13, 411. [Google Scholar] [CrossRef]
- Li, C.H.; Chan, M.H.; Chang, Y.C.; Hsiao, M. Gold Nanoparticles as a Biosensor for Cancer Biomarker Determination. Molecules 2023, 28, 364. [Google Scholar] [CrossRef] [PubMed]
- Duman, H. Gold Nanoparticles: Multifunctional Properties, Synthesis, and Future Prospects. Nanomaterials 2024, 14, 1805. [Google Scholar] [CrossRef]
- Rashid, M.H.O.; Ralph, S.F. Carbon Nanotube Membranes: Synthesis, Properties, and Future Filtration Applications. Nanomaterials 2017, 7, 99. [Google Scholar] [CrossRef]
- Dincer, C.; Kling, A.; Chatelle, C.; Armbrecht, L.; Kieninger, J.; Weber, W.; Urban, G.A. Designed Miniaturization of Microfluidic Biosensor Platforms Using the Stop-Flow Technique. Analyst 2016, 141, 6073–6079. [Google Scholar] [CrossRef] [PubMed]
- Buttkewitz, M.A.; Heuer, C.; Bahnemann, J. Sensor Integration into Microfluidic Systems: Trends and Challenges. Curr. Opin. Biotechnol. 2023, 83, 102978. [Google Scholar] [CrossRef]
- Abdulbari, H.A.; Basheer, E.A.M. Electrochemical Biosensors: Electrode Development, Materials, Design, and Fabrication. ChemBioEng Rev. 2017, 4, 92–105. [Google Scholar] [CrossRef]
- Compton, R.G.; Banks, C.E. Understanding Voltammetry, 3rd ed.; Imperial College Press: London, UK, 2018; pp. 125–128. [Google Scholar]
- Bard, A.J.; Faulkner, L.R. Electrochemical Methods: Fundamentals and Applications, 2nd ed.; Wiley: New York, NY, USA, 2001; pp. 236–239. [Google Scholar]
- Elgrishi, N.; Rountree, K.J.; McCarthy, B.D.; Rountree, E.S.; Eisenhart, T.T.; Dempsey, J.L. A Practical Beginner’s Guide to Cyclic Voltammetry: Review and Tutorial. J. Chem. Educ. 2017, 94, 1123–1136. [Google Scholar] [CrossRef]
- American Laboratory. Part 48—Relative Standard Deviations (RSDs); American Laboratory: San Francisco, CA, USA, 2010. [Google Scholar]
- Wang, J. Analytical Electrochemistry, 3rd ed.; Wiley: Hoboken, NJ, USA, 2006. [Google Scholar]
- Park, S.; Kaufman, D.; Ben-Yoav, H.; Yossifon, G. On-Chip Electrochemical Sensing with an Enhanced Detecting Signal Due to Concentration Polarization-Based Analyte Preconcentration. Anal. Chem. 2024, 96, 6501–6510. [Google Scholar] [CrossRef]
- Jiang, Y.; Li, F.; Zhang, H.; Wang, S. Silver Nanostars Arrayed on GO/MWCNT Composite Membranes for Enrichment and SERS Detection of Polystyrene Nanoplastics in Water. Water Res. 2024, 255, 121444. [Google Scholar] [CrossRef]
- Yang, X.; Chen, L.; Zhao, Q.; Liu, R. One-Step Detection of Nanoplastics in Aquatic Environments Using a Portable SERS Chessboard Substrate. Talanta 2024, 275, 127076. [Google Scholar] [CrossRef]
- Ruan, X.; Zhang, Y.; Liu, H.; Li, J. Nanoplastics Detected in Commercial Sea Salt by a Combined SERS and SRS Approach Using Au-Coated AAO Membrane Substrates. Environ. Sci. Technol. 2024, 58, 6542–6551. [Google Scholar] [CrossRef]
- Liu, L.; Patel, D.; Kim, J.; Huang, Y. A Biosensor-Integrated Filtration Device for Nanoparticle Isolation and Label-Free Imaging. Lab Chip 2025, 25, 589–598. [Google Scholar] [CrossRef]
- Benjamin, S.R.; de Lima, F.; Nascimento, V.A.; de Andrade, G.M.; Oriá, R.B. Advancement in Paper-Based Electrochemical Biosensing. Biosensors 2023, 13, 689. [Google Scholar] [CrossRef] [PubMed]
- Georgeous, J.; AlSawaftah, N.; Abuwatfa, W.H.; Husseini, G.A. Review of Gold Nanoparticles: Synthesis, Properties, Shapes, Cellular Uptake, Targeting, Release Mechanisms and Applications in Drug Delivery and Therapy. Pharmaceutics 2024, 16, 1332. [Google Scholar] [CrossRef]
- Saha, C.; Ghosh, S.K.; Kumari, P.; Perla, V.K.; Singh, H.; Mallick, K. Electrocatalytic Efficiency of Carbon Nitride Supported Gold Nanoparticle Based Sensor for Iodide and Cysteine Detection. Anal. Biochem. 2025, 696, 115660. [Google Scholar] [CrossRef] [PubMed]
- Xiao, F.; Pignatello, J.J. π+–π Interactions between (Hetero)aromatic Amine Cations and the Graphitic Surfaces of Pyrogenic Carbonaceous Materials. Environ. Sci. Technol. 2015, 49, 9066–9074. [Google Scholar] [CrossRef] [PubMed]


Disclaimer/Publisher’s Note: The statements, opinions and data contained in all publications are solely those of the individual author(s) and contributor(s) and not of MDPI and/or the editor(s). MDPI and/or the editor(s) disclaim responsibility for any injury to people or property resulting from any ideas, methods, instructions or products referred to in the content. |
© 2026 by the authors. Licensee MDPI, Basel, Switzerland. This article is an open access article distributed under the terms and conditions of the Creative Commons Attribution (CC BY) license.