Article

Nanoparticle-Coated Optical Hydrogen Sensor for Early Gas Detection of Lithium-Ion Battery Failure

by
Leonard Kropkowski
1,2,*,
Ahmad Abdalwareth
1,2,
Christoff Brüdigam
2,
Martin Angelmahr
2 and
Wolfgang Schade
1,2
1
Institute of Energy Research and Physical Technologies, Clausthal University of Technology, Leibnizstraße 4, 38678 Clausthal-Zellerfeld, Germany
2
Department Fiber Optical Sensor Systems, Fraunhofer Institute for Telecommunications, Heinrich-Hertz-Institut, HHI, Am Stollen 19H, 38640 Goslar, Germany
*
Author to whom correspondence should be addressed.
Chemosensors 2025, 13(9), 348; https://doi.org/10.3390/chemosensors13090348
Submission received: 8 August 2025 / Revised: 4 September 2025 / Accepted: 9 September 2025 / Published: 11 September 2025
(This article belongs to the Section Optical Chemical Sensors)

Abstract

This research investigates the use of a fiber optic sensor for detecting hydrogen gas during a thermal runaway of lithium-ion batteries (LIBs). Timely detection of thermal runaway in LIBs, particularly in storage and logistics, is crucial for effective safety management and preventing the escalation of incidents to adjacent cells. The sensors employed in this study utilize fiber Bragg grating (FBG) technology. The FBG sensors are coated with palladium nanoparticles, enabling the detection of hydrogen concentrations up to 5%. In abuse tests, the sensors successfully identified hydrogen emissions. Cross-sensitivity effects were observed during a secondary test and were thoroughly investigated. These interferences were found to be primarily caused by carbon monoxide (CO), a common byproduct of battery venting. While the presence of CO can interfere with hydrogen detection, both signals remain independently valuable as indicators of cell malfunction. This dual-response behavior enhances the robustness of fault detection under real-world battery failure scenarios.

1. Introduction

The transportation, stationary energy storage and consumer electronics sectors are becoming increasingly dependent on lithium-ion battery-based energy systems each year [1,2]. This development is mainly driven by the high gravimetric and volumetric energy density offered by the technology [3,4]. However, the growing demand for lithium-ion batteries combined with the high energy density creates new challenges in terms of safety. While the probability of a single cell failing is minuscule, the sheer number of cells entering the market increases the absolute probability of critical failures [5,6]. This threat is even more significant in lithium-ion battery-storage facilities, where millions of individual cells are packed into a limited space. While internal contamination within the cells can lead to failure, external factors can exacerbate this risk [7,8]. These external factors can occur during logistical processes such as mishandling of the LIBs or errors in the storage environment. These processes can lead to cell crushing, LIB dropping or excessive storage temperatures that may exacerbate existing internal defects in cells or even whole packs. These internal defects might result in a heat generation within the cell. If the generated heat causes the cell to exceed a critical threshold temperature, a thermal runaway (TR) may occur. The TR is an uncontrollable exothermic decomposition of the active cell materials, beginning with the decomposition of the solid electrolyte interface, which produces a toxic and flammable gas mixture [9,10]. This exothermic reaction further leads to the decomposition of the anode material in combination with the electrolyte, generating more heat and gases. The rise in temperature causes the cathode materials to decompose, releasing oxygen that further fuels a possible combustion. The separator may melt during this phase, causing a short circuit that further accelerates the runaway process [11]. The duration of this chain reaction ranges from a fraction of a second to several seconds. This runaway results in a rapid release of energy and large amounts of gases that can potentially ignite, causing a fire or explosion [12]. While the gas emitted from the LIB consists of a mixture of various toxic and flammable gases, the main components are hydrogen ( H 2 ), carbon monoxide (CO), carbon dioxide ( CO 2 ) and a mixture of different hydrocarbons ( C n H m ) such as methane, ethylene and ethane as summarized in Table 1 [13,14,15,16,17]. In lower concentrations, toxic gases such as hydrogen fluoride, nitrogen oxide, sulfur dioxide or ammonia have also been reported to be detected in the gas mixture [18,19,20].
In the literature, the volume of the venting gas and the composition of the gas mixture were found to correlate with the SOC of the battery [21]. A reduction in electrical charge resulted in a decrease in the gas volume, as well as a decrease in the proportion of H 2 and CO and a higher concentration of CO 2 in the gas composition [14,16,22]. As shown by Lammer et al., the state of health of the cell also influences the composition of the venting gases [23]. As a result, H 2 is a reasonable choice as an indicator gas to detect an anomaly due to the high content in vent gases and the danger it poses when combusting. Furthermore, the amount of H 2 in the atmosphere is low under normal conditions [24], unlike CO 2 , which can change with living organisms in the environment around the sensor. Although the thermal runaway of an individual cell is unstoppable, early detection can help mitigate the propagation to adjacent cells or modules. Therefore, a sensor capable of detecting both chemical and thermal changes could provide significant value. Previous research in the TR early detection spans from temperature, voltage and current monitoring to pressure and gas detection [25,26]. However, gas sensors have been found to provide a faster detection rate than other means of surveillance such as temperature or voltage monitoring [25,26]. While previous gas-detection systems were based on electrochemical sensors, the sensor system presented in this work relies on fiber optics and an optochemical working principle. One key advantage of this sensor type is the ability to simultaneously monitor both gas composition and temperature within a single sensor array, enabling a compact, multisensor-based detection system. Additional benefits include high sensitivity, fast response times, immunity to electromagnetic interference and potential for remote or distributed sensing in harsh environments.

2. Materials and Methods

2.1. Optical Fiber Hydrogen-Detection Sensor

Optical fiber hydrogen sensors are well-suited for hydrogen detection due to their inherent safety and immunity to electromagnetic interference. Unlike electric sensors, they contain no wires that could produce sparks and potentially ignite flammable gas mixtures. Optical hydrogen sensors based on different working principles have been developed over the last 40 years, like interference sensors [27,28,29,30,31], micro-mirror sensors [32,33,34], evanescent sensors [35,36,37,38,39,40], surface plasmon resonance (SPR) sensors [41,42,43,44,45] and fiber grating sensors [46,47,48,49,50,51,52,53].
Pd is commonly used as functional sensor material, which allows the selective detection of hydrogen [54,55,56,57,58,59]. Therefore, the properties of the sensors are closely related to the physical or chemical interaction of Pd layers in hydrogen atmospheres. The nanoparticles have a high surface-area-to-volume ratio, offering an acceleration in hydrogen absorption and desorption rates by overcoming the diffusion barrier formed by already absorbed hydrogen, which plays a significant role in thick layers of Pd films [60,61]. This high surface-to-volume ratio makes these nanoparticles attractive for gas sensors, where short response and recovery times are needed [62]. Therefore, instead of sputtering thin layers of selective metal layers on the surface of the sensor, we deposited a layer of Pd nanoparticles. In this work, optical hydrogen sensors are based on the evaluation of the back reflected fiber Bragg grating signal, as shown in Figure 1. For manufacturing the optical fiber hydrogen sensors, single-mode glass fibers coated with acrylate coatings (Fibercore SM1250BI 9.8/125) were used. The FBGs were inscribed with a point-by-point (PbP) technique using femtosecond laser pulses. The applied setup and inscription process are described in [63,64]. Two FBGs were inscribed into the fiber core having center wavelengths around 1530 nm and 1550 nm. The first FBG is used as a temperature (Temp-FBG) to monitor and compensate for intensity fluctuations of the light source as well as any temperature changes during measurements from the hydrogen-detection FBG ( H 2 -FBG).
An approach for the usage of FBG as a sensing element is to utilize the change in effective refractive index for chemical detection. The effective refractive index is linearly correlated to the Bragg wavelength and hence a spectral shift is correlated to the change in the refractive index of the surrounding medium. However, for chemical detection in an untreated standard fiber no interaction occurs with the surrounding media and the fiber core, because the fiber core is shielded by the fiber cladding. In order for the FBG to be sensitive to the surrounding media, the cladding has to be removed. The fiber core without cladding directly enables the interaction of the evanescent light at the surface of the fiber with the surrounding media. Figure 2 is a schematic representation of an FBG before and after the removal of the cladding. A more detailed description of the manufacturing of the H 2 -FBG sensor can be found in our earlier work in [27], where we discussed the manufacturing process, detection range, response and recovery times, hysteresis and temperature effects. At room temperature, the detection range is from 0.3% H 2 to 5% H 2 . The sensor has a short response time and recovery time of less than 90 s and 140 s, respectively.

2.2. Device Under Test

The cells used in this study were pouch-type lithium-ion batteries with nominal capacities of 40 Ah and employing NMC-based cathodes. The capacities determined by measurement are listed in Table 2, with both cells exhibiting a state of health (SOH) above 98%, indicating only minimal aging. The SOC was set to 40% for two key reasons: first, a low SOC is commonly used for the storage and transportation of lithium-ion batteries [65]; second, at this SOC, the probability of emitted venting gases igniting is lower compared to higher charge states [66], which aligns with the safety-focused objectives of this study. A summary of the battery parameters is provided in Table 2.

2.3. Experimental Setup and Procedure

Two tests were conducted on individual cells using the same optical sensor, to evaluate the sensor’s capability to detect venting gases during lithium-ion battery failure. All subsequent experimental tests were carried out in an explosion-proof battery test chamber (Fraunhofer HHI Institute, Goslar, Germany) with an internal volume of 10 m3, which is comparable to the environment of a small to medium-sized battery-storage area.
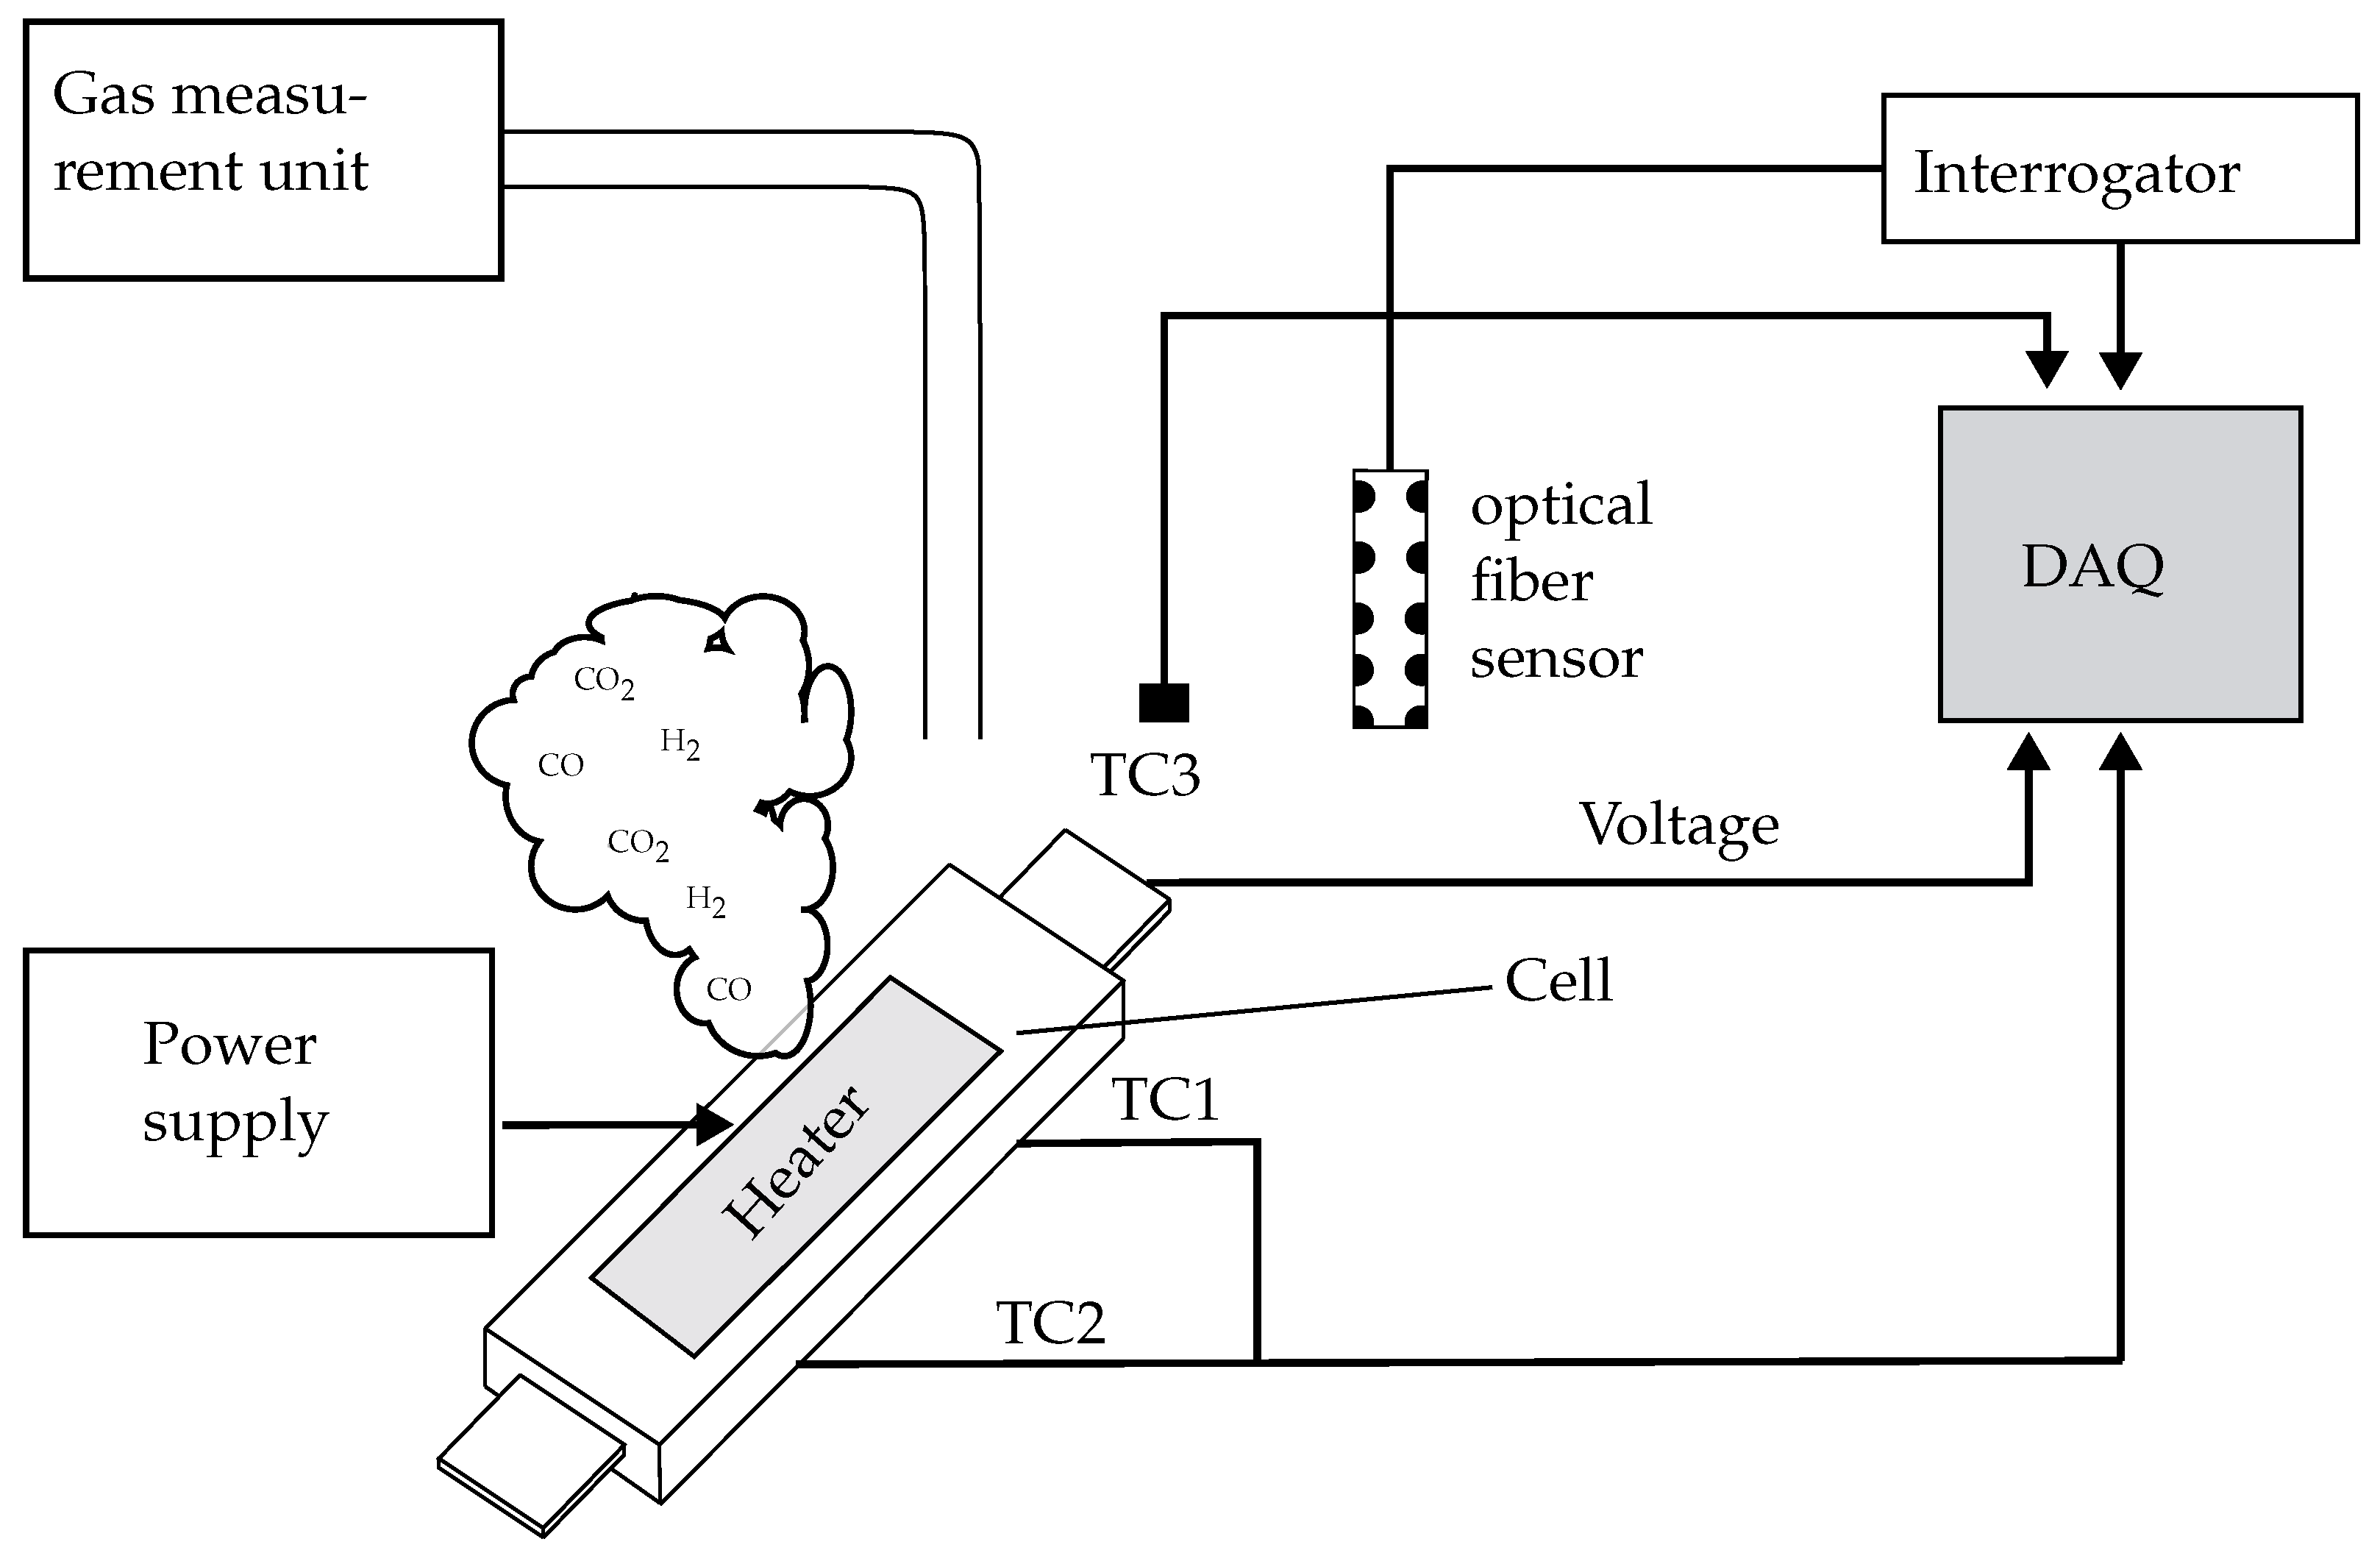
The experimental setup (Figure 3) for the cell tests consisted of four thermocouples: two to monitor the surface temperature of the specimen (TC1 and TC2), one to monitor the surface temperature of the heater and an additional sensor to monitor the gas temperature above the cell (TC3). To observe the electrical state of the battery cell, the voltage was monitored continuously. Both temperature and voltage were recorded using a Q.bloxx measurement unit (Gantner Instruments, Schruns, Austria). To initiate the TR, a heating pad with a peak power of 750 W (Heating Element Mica Strip, RS PRO, Corby, UK) was controlled using a high DC voltage power source (PSB 10080, Elektro-Automatik, Viersen, Germany) as an adjustable trigger method. The heating rate was slowly increased in order to promote the accumulation of gases in the battery. During the cell venting event, the fumes created were extracted from the test environment and replaced with clean air in the chamber, affecting the concentration of venting gases in the test atmosphere. Therefore, a lower concentration of venting gases is expected compared to the autoclave experiments mentioned in Table 1.
The optical fiber, containing the H 2 -FBG and the Temp-FBG sensor, was placed adjacent to the gas temperature thermocouple as shown in Figure 3. To improve the mechanical stability of the sensor, the optical fiber was integrated into a protective polypropylene tube, while the FBGs were attached to a custom 3D-printed fiber holder and then enclosed in a metal sieve to allow gas ingress to interact with the FBGs (Figure 4).
The influence of the housing on the effectiveness of the sensor was tested in the laboratory and showed no significance in temperature or hydrogen detection. It is worth mentioning that the sensor has been subjected to different gases in the laboratory, such as CO 2 . The tests were conducted in an N 2 atmosphere and in synthesized air. The measurements showed no interference from these gases. The optical data was detected using a measurement system consisting of a fiber-coupled broadband-emitting superluminescent diode (SLED, COVEGA SLD-6960, Jessup, MD, USA), a 1.5 μ m optical circulator and a spectrometer (NQ512, OceanOptics, optical resolution 2 nm, Orlando, FL, USA). The total intensity variation of the measurement system was less than 0.05%.
In addition, an inlet for a reference hydrogen-measurement unit (Advance Optima, ABB, Zurich, Switzerland) was installed to monitor the H 2 concentration in the test chamber during the experiment. This unit operates on an electrochemical measurement principle to detect gases, based on the thermal conductivity of different gases, providing an independent reference value for H 2 -concentration using an alternative measurement method. However, due to its placement outside the test area and the several-meter-long tubing that adds additional delay, along with a response time of up to 20 s of the unit itself. Because of the experimental setup, the sensor is only suitable for detecting the presence of hydrogen and is not capable of providing accurate concentration measurements or real-time monitoring.

3. Results

3.1. First Test

The first test on the application of the optical hydrogen sensor ended with thermal runaway of the test cell, producing a jet flame. Figure 5 presents the key events of the test, extracted from the video footage, along with their respective times of occurrence. The heating pad self-ignited shortly before the first vent of the pouch bag around 4002 s into the test. However, for the first 19 s after the initial vent (4010 s) the gases have been emitted from the cell without an ignition occurring. After 20 s of venting, the gases ignited for the remainder of the event as seen in Figure 5. After a delay of 40 s, a secondary venting occurred on the opposite side, which lasted for 7 s before igniting as well.
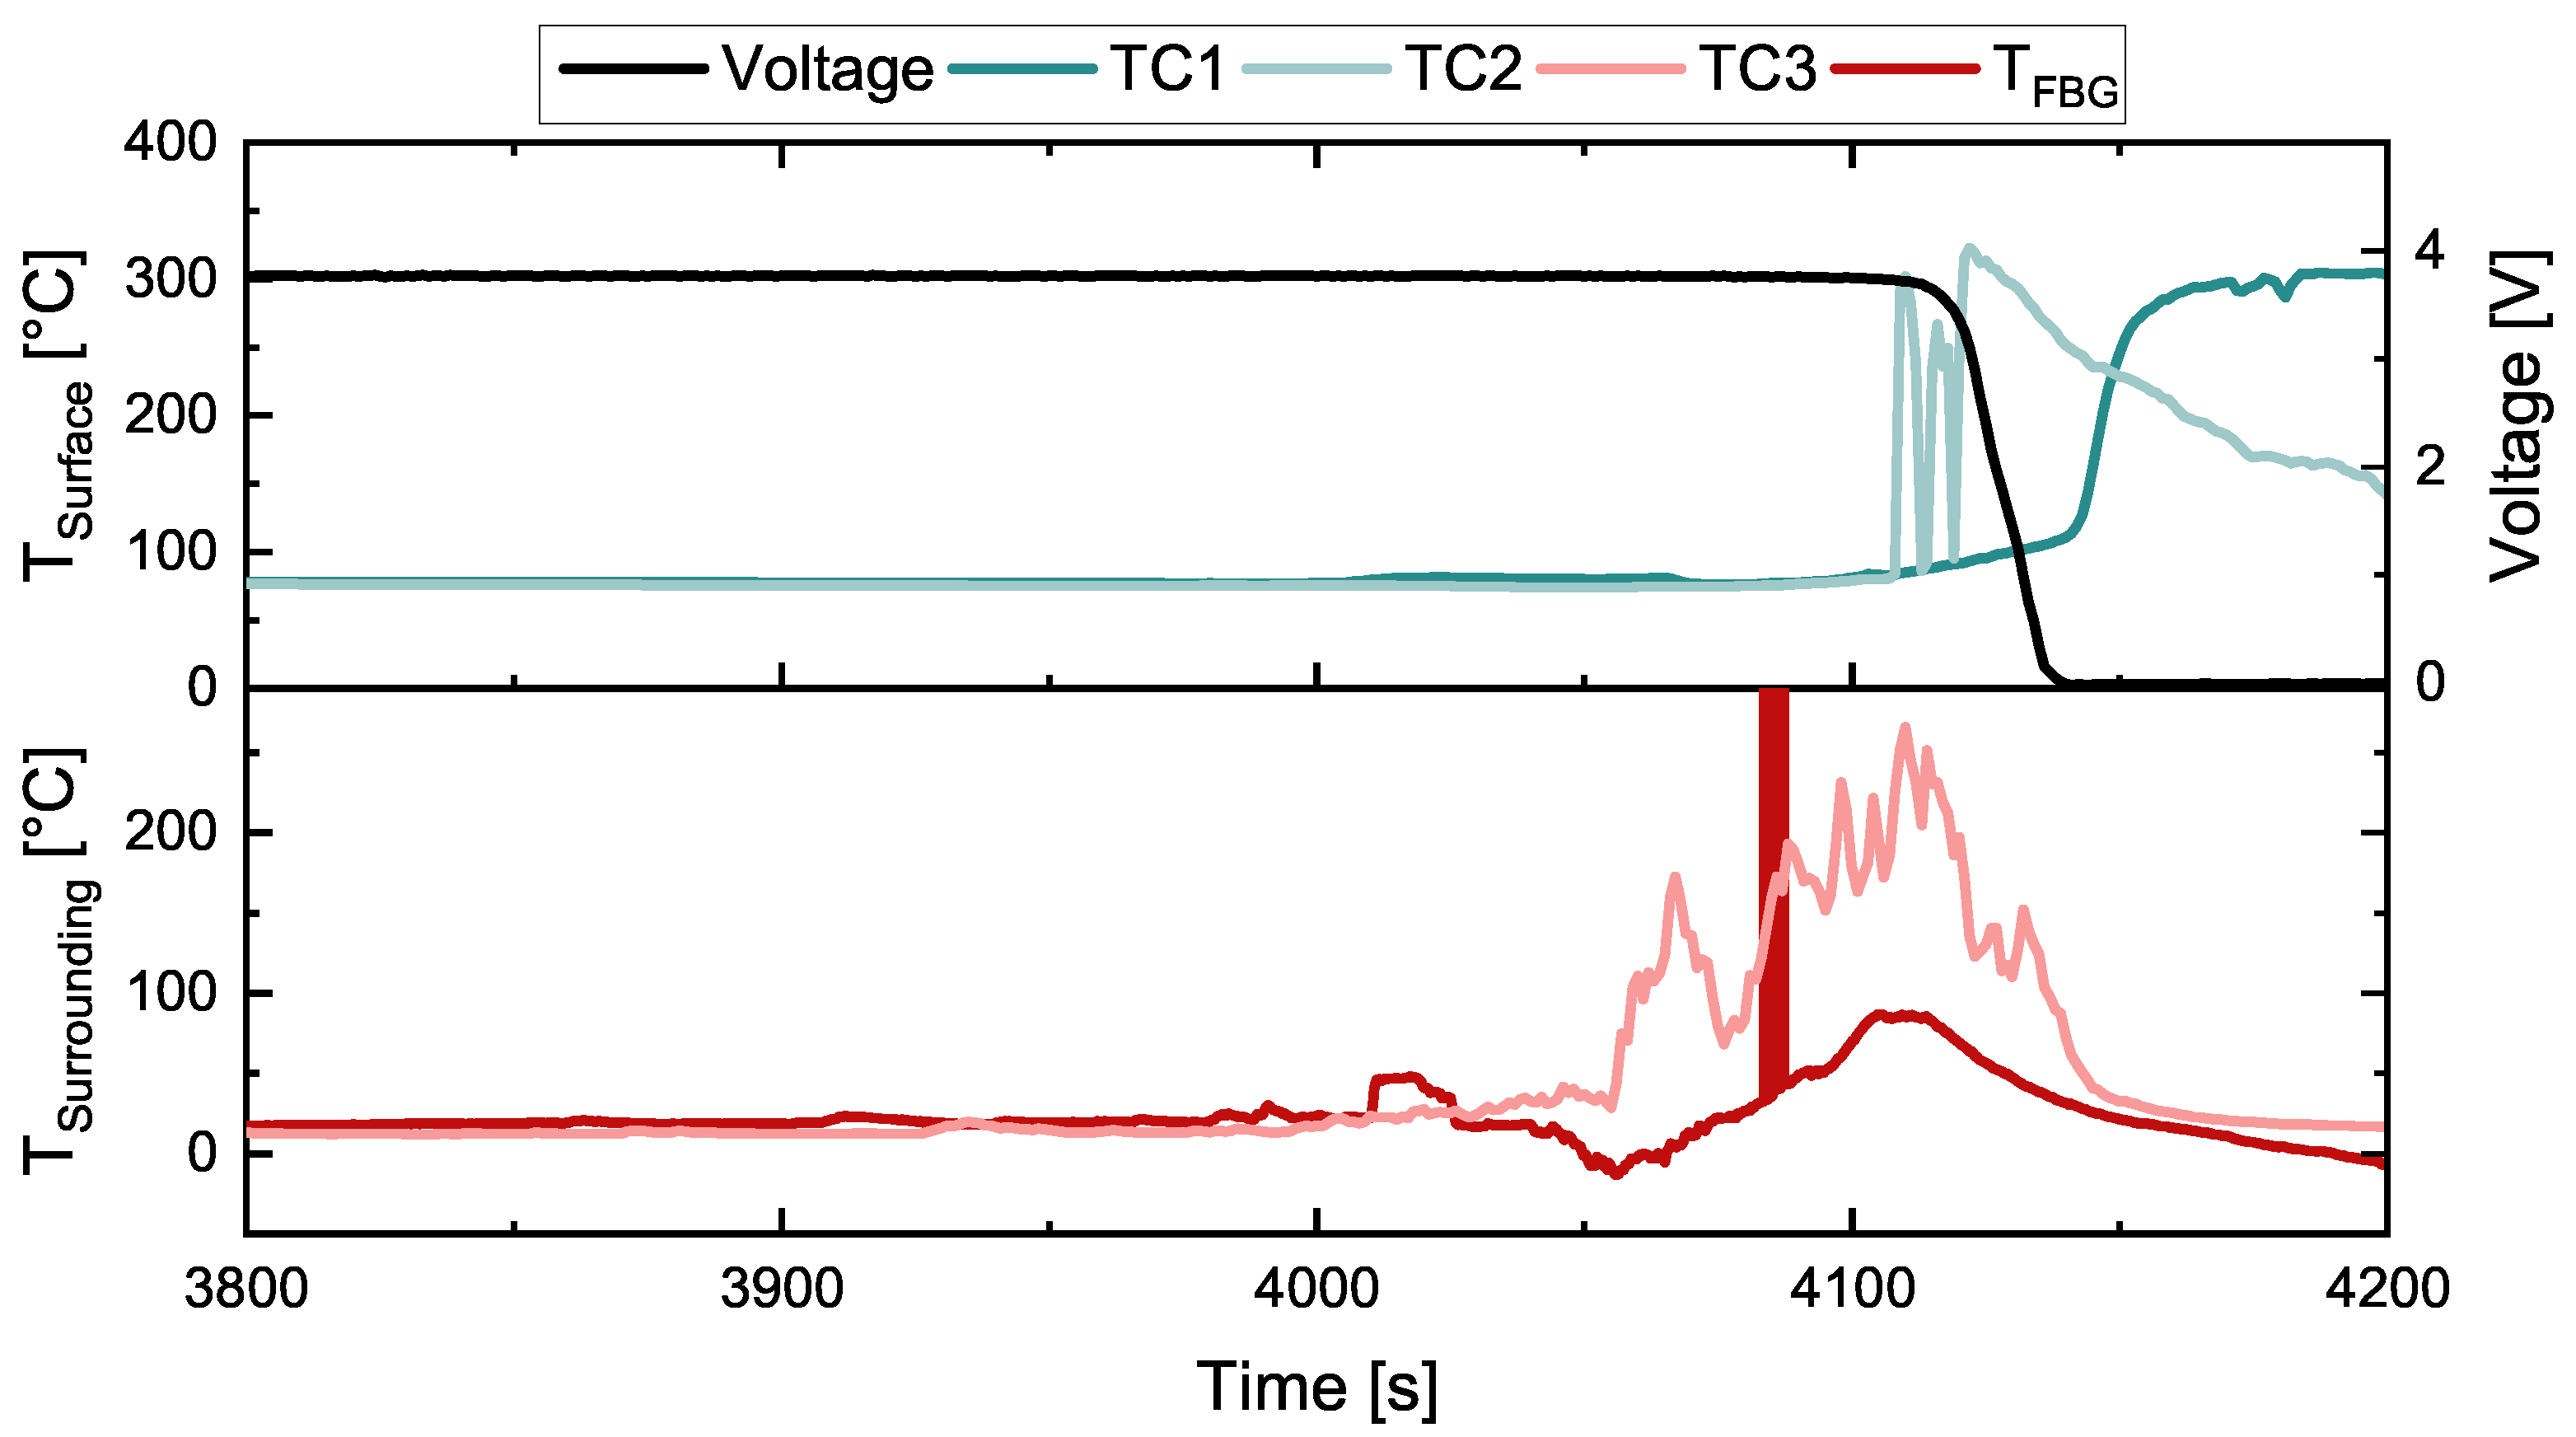
Before the main venting event, no visible gas leakage was observed, which is supported by sensor data as none of the sensors involved detected changes in temperature or sensing of any gases, as illustrated in Figure 6. After the ignition of the venting gases, an increase in temperature was detected by both the optical and electrical temperature sensors (TC3) positioned above the experimental setup. However, both types of sensor showed some degree of delay. The thermocouple took around 20 s after ignition to detect a significant increase in the measured temperature. Meanwhile, the optical sensor showed a negative shift in wavelength. This behavior is attributed to the deflagration of the venting gases and the jet of flames that exert mechanical forces on the Bragg grating, resulting in a strain-induced shift. Furthermore, the heat emitted by the flames can affect the adhesive joint (Figure 4) between the metal sieve and the fiber. The upward trend of the optical sensor signal corresponds with the temperature increase detected by TC3, showing a similar response and pattern for the remainder of the venting event, however offset by the initial negative signal drift.
The cell voltage began to drop after more than 100 s after the primary venting, with the voltage decreasing over a duration of 30 s, without ripples in the signal observed. The thermal runaway ended as the voltage dropped to 0 V, coinciding with the cessation of the flame jet. The thermocouples positioned on the cell surface exhibited a delay of approximately 90 to 120 s prior to an exponential increase in temperature as a result of the thermal runaway, as illustrated in Figure 6. This observation is associated with the cell’s thermal conductivity and heat capacity, which delay heat conduction throughout the cell and its dissipation to the exterior of the pouch bag. As previously reported, thermal runaway propagation in larger cells takes longer [67]. This effect is further amplified at a low state of charge (40%), where the energy released during thermal runaway is significantly lower compared to that of fully charged cells. Consequently, the reaction proceeds more slowly, resulting in a delay in heat propagation to the measurement points. Additionally, the rapid release of accumulated gases induces a Joule-Thomson effect due to the pressure drop as the venting gases escape from the cell pouch, resulting in a temporary cooling effect on the cell [68].
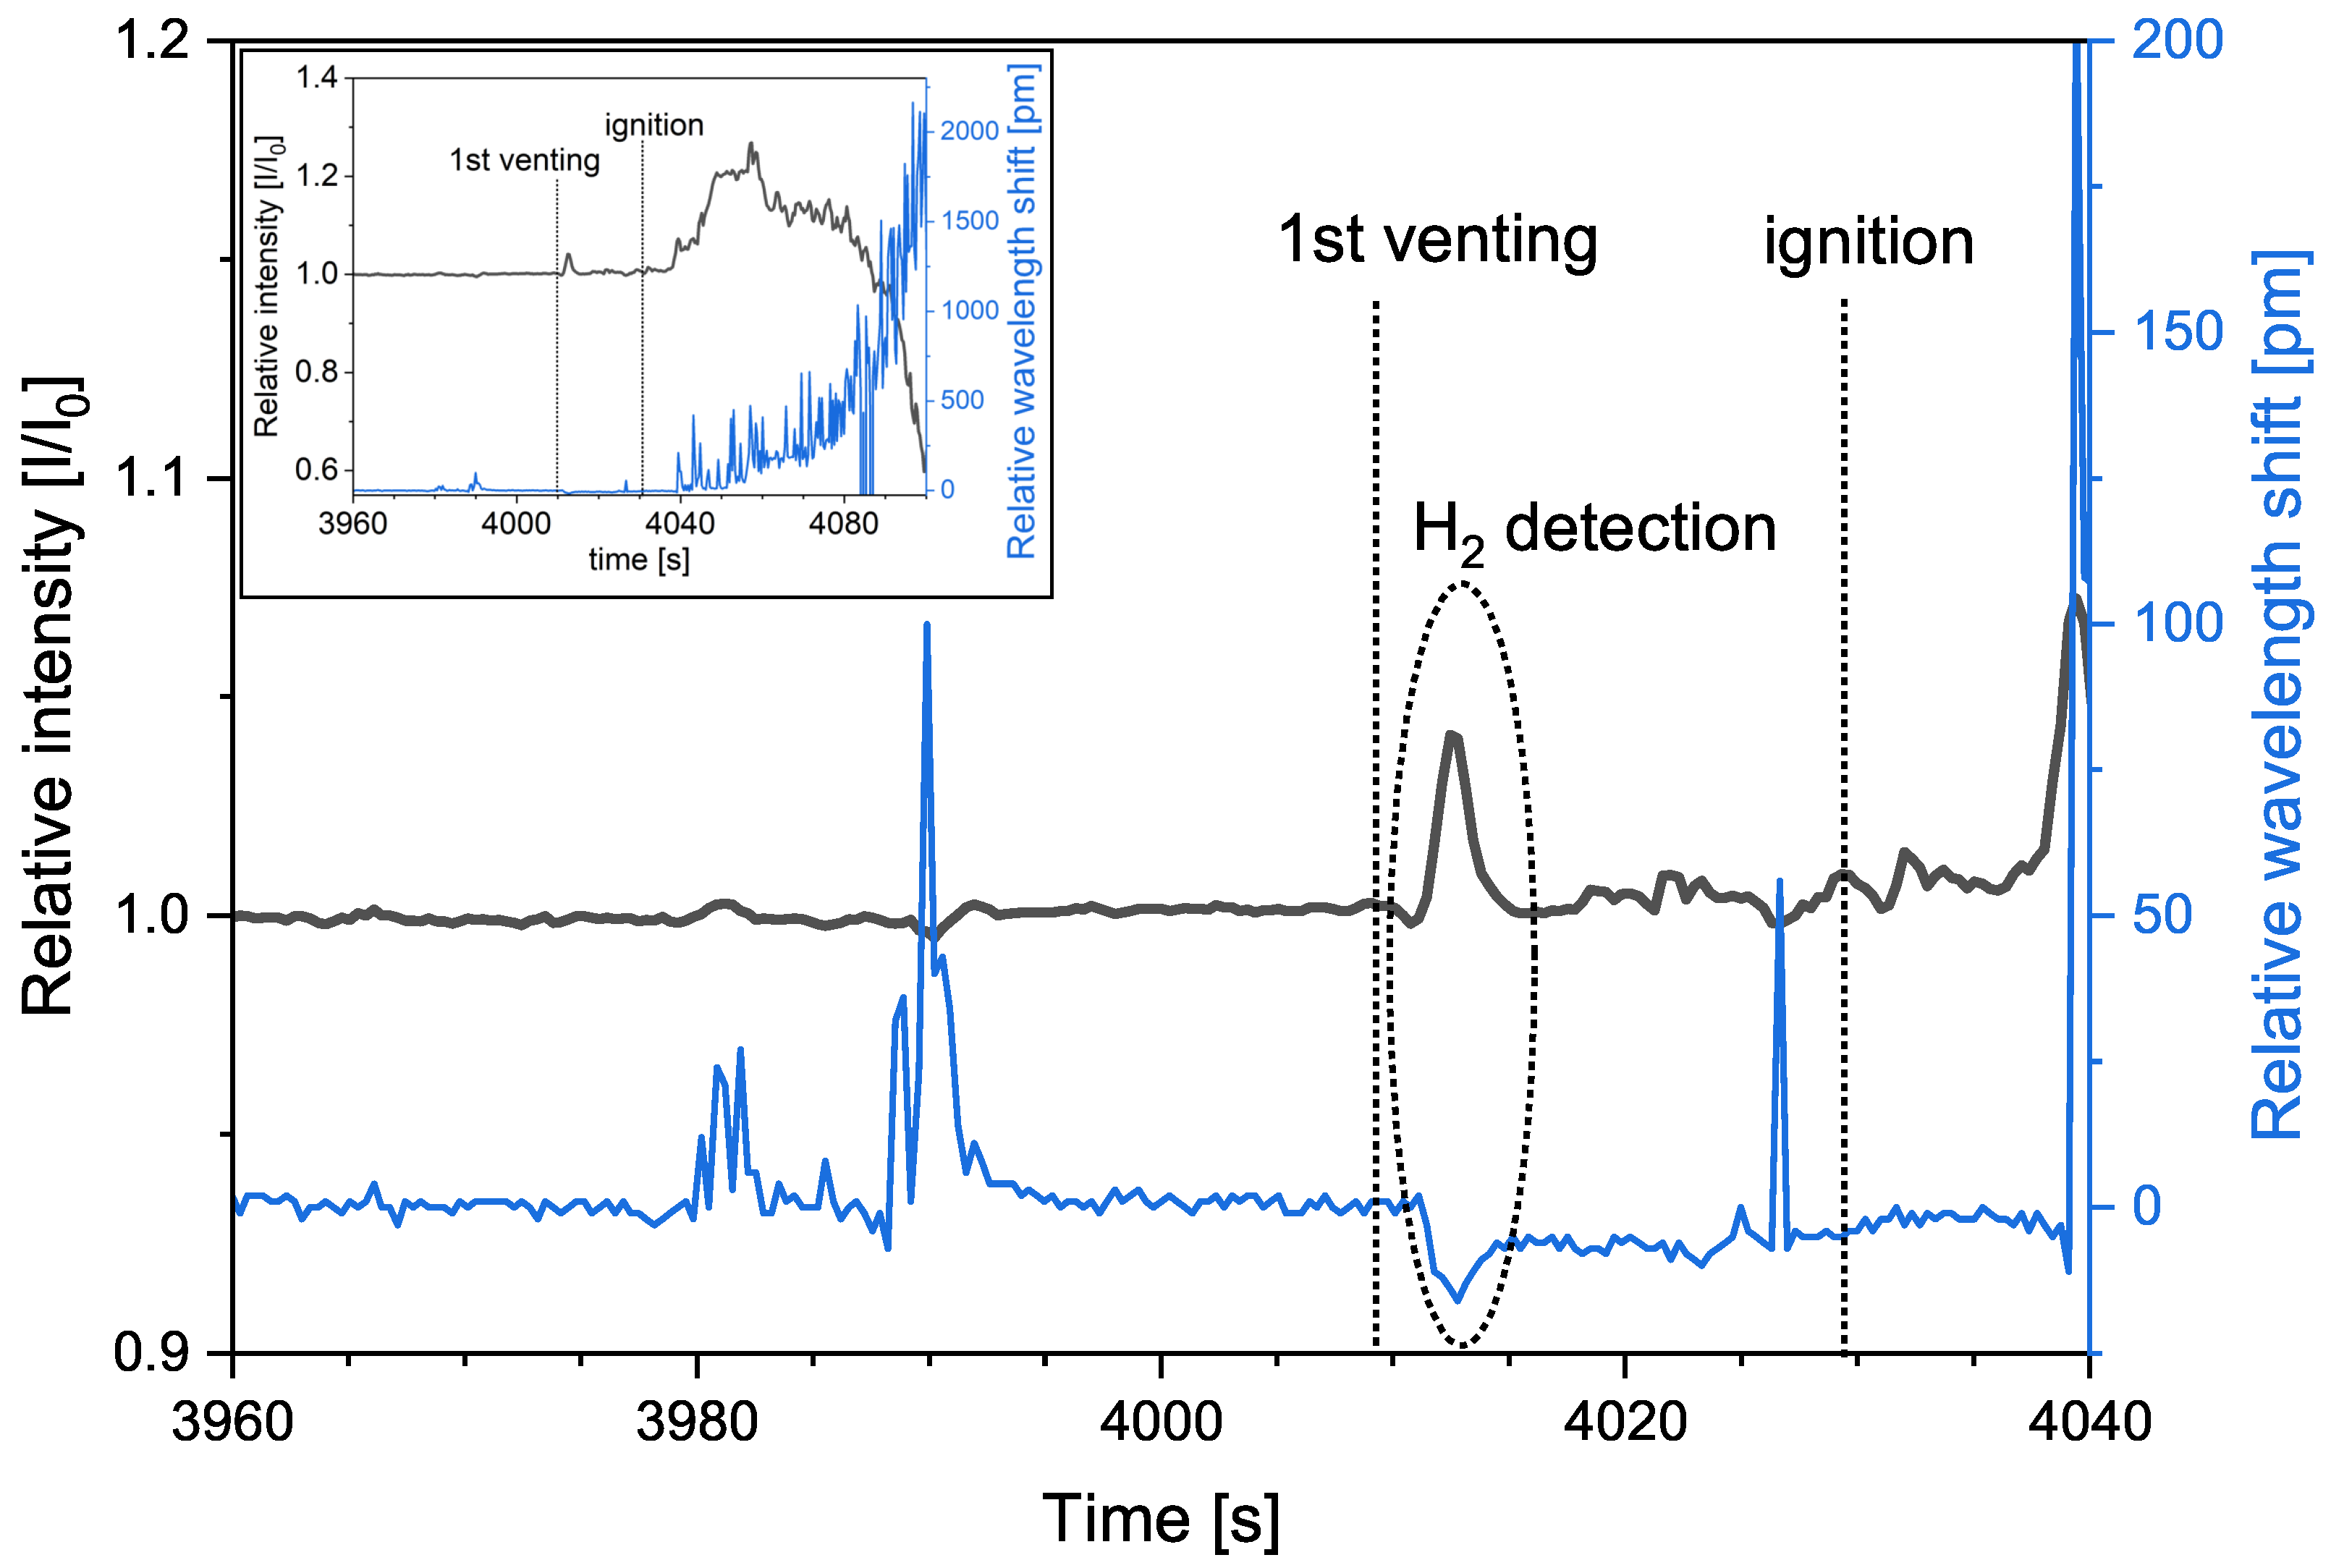
The results for the H 2 -FBG during the first test can be seen in Figure 7. The ignition of the heating pad resulted in two minor shifts of the wavelength for H 2 -FBG, while no changes in intensity could be observed. Therefore, these changes are not attributable to the presence of H 2 , consistent with expectations, as the cell exhibited no visible signs of leakage at this point in time. Following cell venting, an increase in signal intensity paired with a negative shift in wavelength indicates the detection of H 2 . The first changes in signals of both intensity and wavelength could be observed approximately two seconds after the first venting occurred and reached a peak value three seconds after venting started. Based on the intensity peak of around 4.7% an H 2 concentration greater than 5% is detected in the first seconds after venting as supported by our previous work [27]. This is substantiated by a negative shift in the wavelength of around 18 pm. In addition, the reference hydrogen-measurement unit detected a concentration of at least 1% H 2 , further indicating that the observed changes in the optical signal are due to H 2 in the venting gases. After the first seconds the H 2 concentration dropped between 1% and 2.5% as supported by an ongoing change in intensity of 1.2% and 6 pm for the wavelength values [27]. Following the ignition of the gases, a significant change in both wavelength and intensity was observed. These changes are attributed to the heat and vibrations generated by the jet flame emitted from the cell. Although the second vent described earlier released gas for multiple seconds, no distinct signal change could be observed in the H 2 -FBG signal as it was already dominated by the effects of flame exposure at that point, as can be seen in the inlet of Figure 7. Furthermore, the second gas event lasted a shorter amount of time, and venting gases had been effected away from the gas sensor.

3.2. Second Test

The TR process of LIBs is an event with a high degree of possible variability, as a result of the complex process that takes place during decomposition [69]. Therefore, a secondary test is conducted under identical conditions to further investigate the viability of the sensor array. For the second test, although conducted at the same SOC and ambient temperature as for the first cell, the TR unfolded differently, as can be observed in Figure 8. Although the TR unfolded faster than the first test, no flames occurred. Initially, the cell started to build up gas and therefore pressure during heating, resulting in a strong bloating seen between 1320 s and 2520 s in the test.
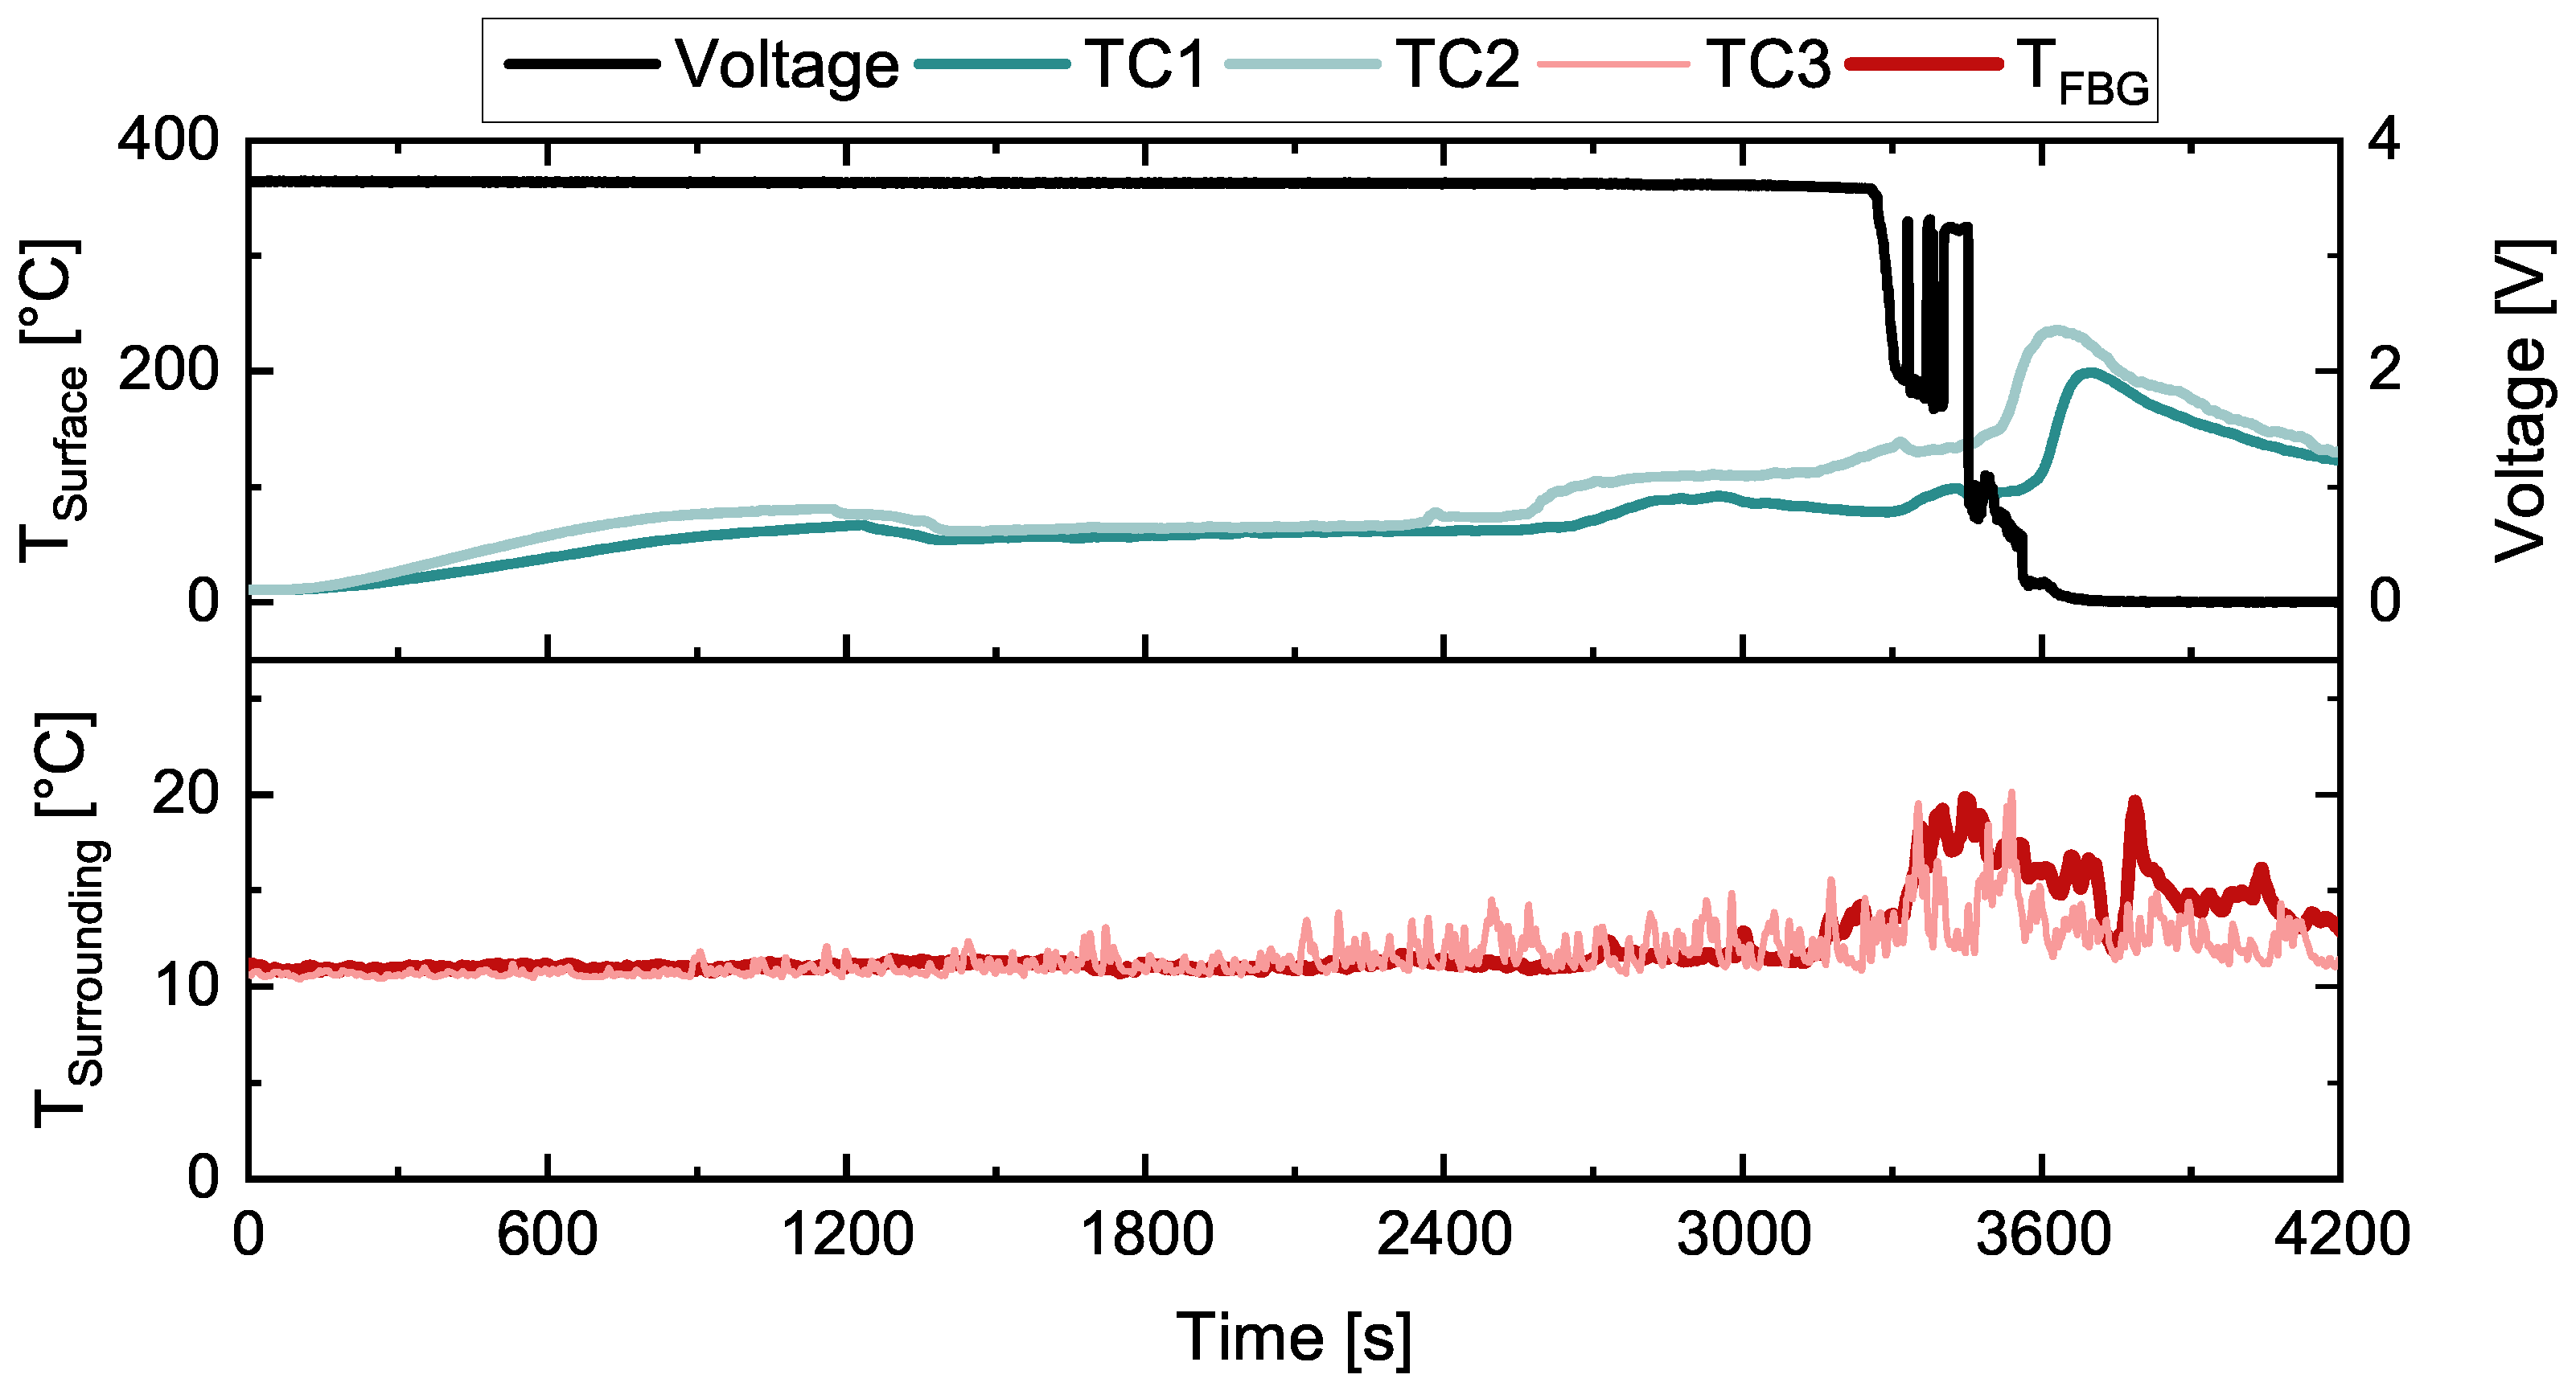
The main venting event at 2790 s was preceded by a smaller venting event around 2570 s in the experiment, which was not detected by any of the sensors used, but could be observed in the video footage. The absence of a measurable response from the hydrogen sensor in this case is attributed to the initial venting being primarily driven by electrolyte evaporation, rather than by the release of decomposition gases from the active materials [70]. Furthermore, none of the applied temperature sensors have been able to clearly detect changes in the environment because of the low amount of traceable gases, which results in a low thermal reaction on both applied thermal sensors. Following this minor venting, a continuous gas release was visually detected, which continued for about 10 min before the main venting event started, which was detected by both the thermocouple TC3 and the Temp-FBG as shown in Figure 9. Prior to this, a voltage drop was detected as the first measurement-based detection of the thermal runaway. As the surface temperature sensor showed a time delay in the exponential temperature rise expected from a TR. The observed delay in detection and its duration are consistent with the effects noted in the first cell, providing validation for the previously reported observations.
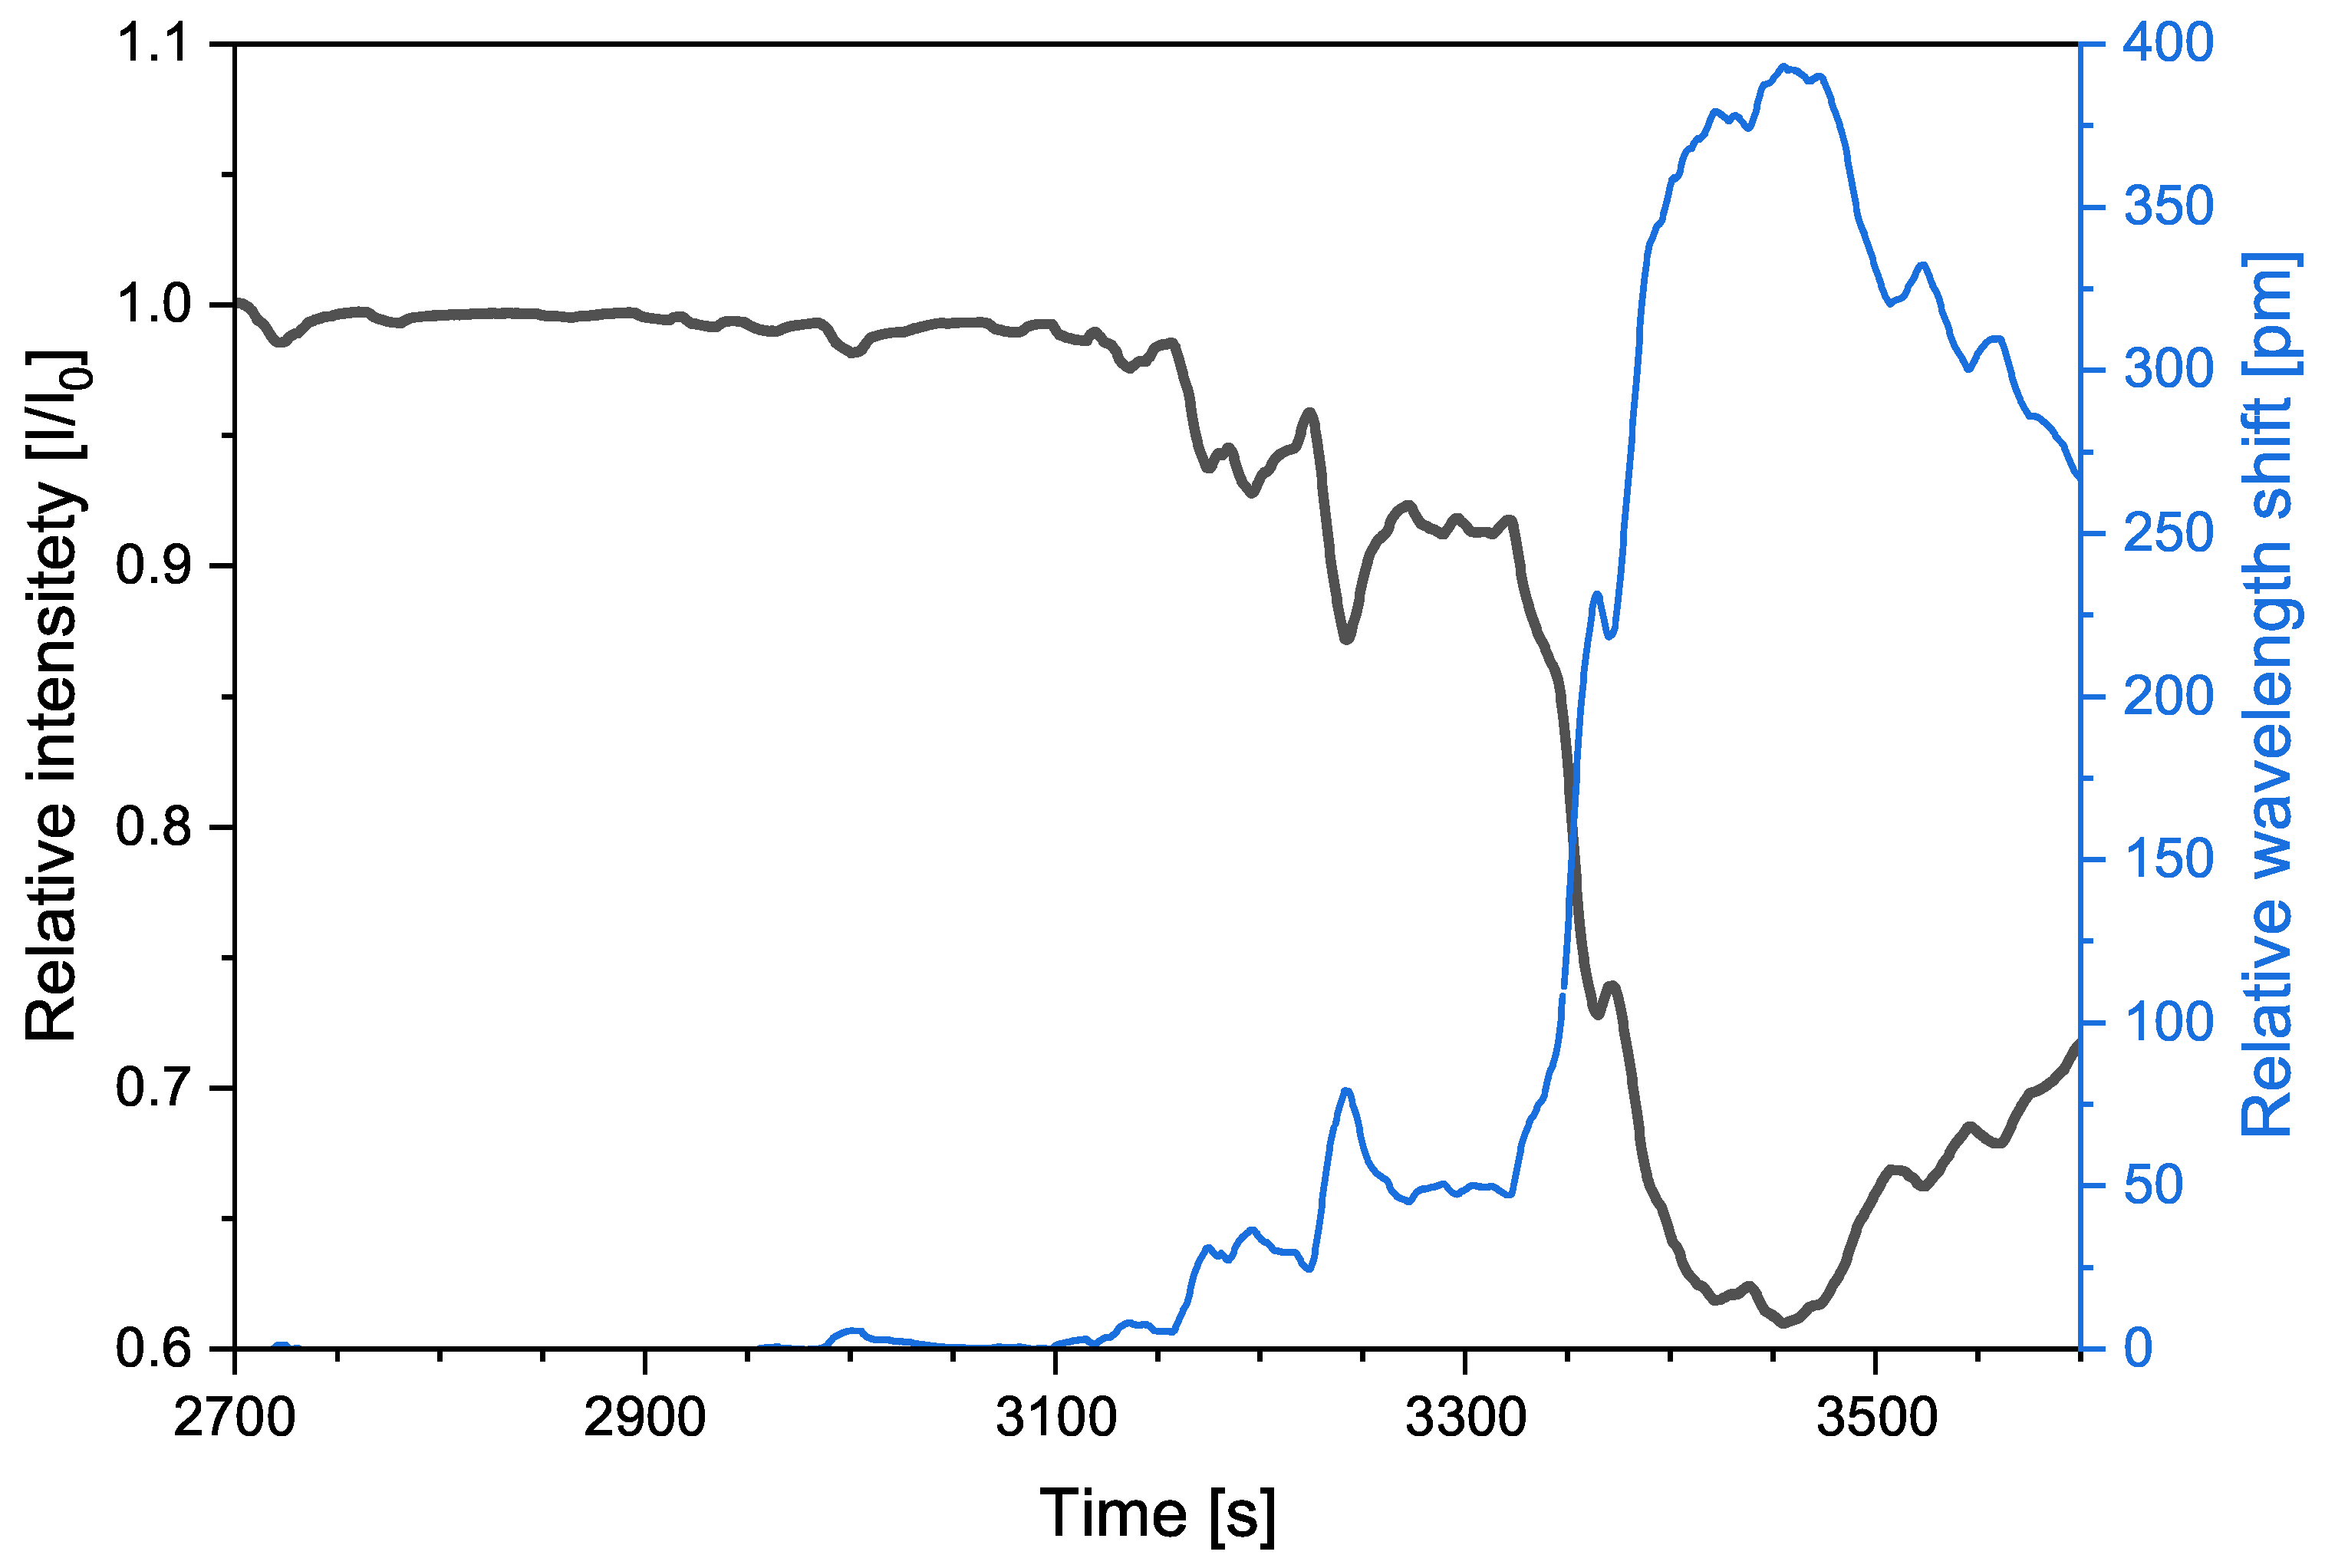
The Temp-FBG optical sensor exhibited a response approximately after 15 s of the visual observation of the cell venting event, which lasted for 1 min. This delay is attributed to the free volume of the test chamber, which affects the time required to create an environment with a detectable amount of gas that elevates the local temperature. The recorded wavelength shift was approximately 90 pm, corresponding to 8 K, matching the detected value of the thermocouple as seen in Figure 9. Figure 10 provides a detailed view of the H 2 sensor’s response during the venting event. The uncompensated H 2 -FBG displayed a decrease in signal intensity of up to 40% and a wavelength shift of nearly 400 pm. Although the Temp-FBG sensor’s wavelength shifted in response to temperature changes, the intensity reduction occurred exclusively in the H 2 -FBG, with no corresponding effect in the reference FBG. This behavior contrasts with those of both the laboratory measurements and the first battery test, where an increase in intensity was observed as a reaction of hydrogen detection. Under typical conditions, the presence of hydrogen in the ambient environment is anticipated to reduce the optical absorption coefficient of palladium, thereby increasing the FBG signal intensity.
This suggests that this decrease in the intensity signal is a result of some kind of cross-sensitivity. A possible gas contained in battery venting gases might be CO that is being absorbed onto the Pd nanoparticles while the Temp-FBG remained unaffected. RaviPrakash et al. [71] studied the effect in which the sensor did not return to its original value within a reasonable time and exhibited drift, similar to the behavior observed in the H 2 -FBG sensors, which is attributed to changes in signal caused by interactions within the evanescent field. In conclusion the H 2 -FBG sensor did not detect any hydrogen during the event, although this would be expected based on literature finding described earlier. Furthermore, the reference hydrogen-measurement unit displayed only minor signal variations, up to 0.02%, which did not provide conclusive evidence of H 2 presence. Since this venting event lasted longer and produced more visible gas, it likely lowered the oxygen levels. With less oxygen, oxidation of the electrolyte solvent at the cathode was reduced, leading to a higher CO ratio compared to the first test [72]. This oxygen depletion may have also increased the impact of sensor poisoning on both sensors. As both the wavelength shift and the change in intensity peaked at the time of cell venting and subsequently decreased steadily as seen in Figure 10, this supports the interpretation that the observed variations are linked to reactions involving components of the venting gases.

3.3. Influence of CO on the H 2 Sensor Performance

As mentioned above, the gas emitted from the LIB consists of a mixture of H 2 , CO, CO 2 and various other gases. The binding energy of CO on Pd has been reported to be higher than that of H 2 , indicating that CO adsorbs more effectively on the Pd surface than H 2 [73]. The investigation of the dynamics of CO blocking the surface of Pd-based materials and how small concentrations of CO affect hydrogen absorption was reported by Ogura et al. [74,75]. RaviPrakash et al. investigated the effect of competing gases, such as CO, on surface adsorption sites on a 100 nm thick layer of Pd, which affects the response of the H 2 sensor [71]. The reported measurements were conducted with a gas mixture of 1% H 2 and 5% CO in an argon atmosphere. The response of the sensor was remarkably sluggish, exhibiting a significant time delay before reaching a steady state value.
To further explore this phenomenon, the optical hydrogen sensor presented in this work was subjected to CO and H 2 measurements in a nitrogen atmosphere in the laboratory to further investigate the observed results from the cell tests. A gas chamber with a controlled gas flow rate of 100 standard cubic centimeters per minute (SCCM) was maintained throughout the experiment. The sensor was first exposed to two cycles of 4% H 2 to confirm its functionality and response to H 2 . In both cycles, the sensor responded with a clear increase in signal intensity and returned to its original state after flushing with nitrogen as shown in Figure 11. This indicates that no permanent damage of the sensor occurred as a result of the cell test experiments. In the third cycle, a mixture of 4% H 2 and 0.5% CO in N 2 was introduced. Although the sensor still responded to hydrogen, the response time was clearly longer and the recovery time of the sensor was significantly longer than in the first two cycles, by approximately 10 min. Nevertheless, the sensor recovered to its original signal value after sufficient recovery time. The subsequent fourth cycle with 4% H 2 , the response remained slow, indicating residual CO absorption on the Pd nanoparticles. To study the effect of CO alone, a fifth cycle was conducted using only 0.5% CO. The sensor exhibited a rapid drop in the signal intensity—down to approximately 0.6%—within the first minute. However, after 10 min of nitorgen flushing, the sensor signal was fully recovered. In the sixth cycle with 4% H 2 , the sensor again exhibited a response time twice as long to reach the maximum signal change. The same recovery time of 30 min was recorded, indentical to that of the third cycle. In the seventh and final cycle, the sensor’s response and recovery times matched those observed in the first two cycles, suggesting that the sensor had not sustained any permanent damage.
These findings are similar to those reported in the literature and attributed to sensor poisoning [73]. However, the sensor based on Pd nanoparticles of 8 nm diameter presented in this work, showed no deactivation of the sensor due to the small concentration of CO, only signal interference that could be reversible.

4. Conclusions

Nanoparticle-coated eFBG sensors based on intensity signal changes due to interaction within the evanescent field underwent real-world testing for hydrogen detection during LIB failures. Although hydrogen was detected successfully in the first test, the second trial failed due to significant sensor poisoning caused by CO. This outcome underscores the limitations of palladium-based coatings in environments containing CO and highlights a commonly underexplored issue in the literature. Various strategies have been proposed to address this challenge, including the application of effective protective coating layers, which may impact sensor response times, or the use of alternative sensor coatings. Notably, Darmadi et al. [76] developed an optical hydrogen sensor based on localized surface plasmon resonance (LSPR) utilizing PdAuCu ternary alloy nanoparticles, demonstrating long-term stability and resistance to CO poisoning in synthetic air containing 4% H 2 and 0.5% CO. Future research should investigate the utilization of such coatings on eFBG sensors and assess the performance in real-world scenarios, such as LIB failures.
Despite the observed CO poisoning issue, the sensors showed promising results in detecting chemical changes associated with all unique venting events during the field tests. Furthermore, the response time of the fiber optic sensors was comparable to, or in some cases faster than, conventional electrical or electrochemical systems. While CO poisoning limited the ability to quantify the amount of H 2 in the gas mixture, the venting gases from both failure events were successfully detected. These findings indicate that the tested sensors hold potential for real-time monitoring of gas emissions in battery-storage facilities, particularly for the early detection of unexpected releases of hazardous gases. Since venting gases typically contain both H 2 and CO, the presented sensors demonstrate strong applicability in such environments. These observations are also relevant for emerging battery chemistries such as lithium–sulfur and sodium-ion, which are likewise known to release hydrogen during thermal runaway events [77,78]. This indicates that the proposed sensor system is not limited to lithium-ion batteries but may also be applicable to next-generation chemistries, thereby broadening its potential for safety monitoring across diverse battery technologies. To achieve these goals, compensation methods and reference sensors will play an important role in the next steps.

Author Contributions

Conceptualization, A.A. and L.K.; methodology, L.K.; validation, A.A. and C.B.; formal analysis, A.A. and L.K.; investigation, L.K.; resources, A.A. and L.K.; data curation, A.A. and L.K.; writing—original draft preparation, A.A. and L.K.; writing—review and editing, M.A., C.B. and W.S.; visualization, A.A. and L.K.; supervision, M.A. and W.S. All authors have read and agreed to the published version of the manuscript.

Funding

This research was funded by the Federal Ministry of Education and Research as part of the project InnoLogBat (grant number 02J21E020).

Data Availability Statement

The data presented in this study is available on request from the corresponding author (L.K.) or (A.A.).

Acknowledgments

The authors gratefully acknowledge the support from the Open Access Publishing Fund of Clausthal University of Technology.

Conflicts of Interest

The authors declare no conflict of interest.

Abbreviations

The following abbreviations are used in this manuscript:
COCarbon monoxide
eFBGetched optical fiber with FBG
FBGFiber-Bragg grating
fccface-centered cubic
LIBLithium-ion battery
LSPRlocalized surface plasmon resonance
NMCLithium nickel manganese cobalt oxides
PbPpoint-by-point
PdPalladium
SCCMStandard cubic centimeters per minute
SOCState of charge
SOHStage of health
TCThermocouple
TRThermal runaway

References

  1. Maisel, F.; Neef, C.; Marscheider-Weidemann, F.; Nissen, N.F. A forecast on future raw material demand and recycling potential of lithium-ion batteries in electric vehicles. Resour. Conserv. Recycl. 2023, 192, 106920. [Google Scholar] [CrossRef]
  2. Xu, C.; Dai, Q.; Gaines, L.; Hu, M.; Tukker, A.; Steubing, B. Future material demand for automotive lithium-based batteries. Commun. Mater. 2020, 1, 99. [Google Scholar] [CrossRef]
  3. Placke, T.; Kloepsch, R.; Dühnen, S.; Winter, M. Lithium ion, lithium metal, and alternative rechargeable battery technologies: The odyssey for high energy density. J. Solid State Electrochem. 2017, 21, 1939–1964. [Google Scholar] [CrossRef]
  4. Frith, J.T.; Lacey, M.J.; Ulissi, U. A non-academic perspective on the future of lithium-based batteries. Nat. Commun. 2023, 14, 420. [Google Scholar] [CrossRef] [PubMed]
  5. Degen, F.; Winter, M.; Bendig, D.; Tübke, J. Energy consumption of current and future production of lithium-ion and post lithium-ion battery cells. Nat. Energy 2023, 8, 1284–1295. [Google Scholar] [CrossRef]
  6. Hendricks, C.; Williard, N.; Mathew, S.; Pecht, M. A failure modes, mechanisms, and effects analysis (FMMEA) of lithium-ion batteries. J. Power Sources 2015, 297, 113–120. [Google Scholar] [CrossRef]
  7. Feng, X.; Ren, D.; He, X.; Ouyang, M. Mitigating Thermal Runaway of Lithium-Ion Batteries. Joule 2020, 4, 743–770. [Google Scholar] [CrossRef]
  8. Liu, L.; Feng, X.; Rahe, C.; Li, W.; Lu, L.; He, X.; Sauer, D.U.; Ouyang, M. Internal short circuit evaluation and corresponding failure mode analysis for lithium-ion batteries. J. Energy Chem. 2021, 61, 269–280. [Google Scholar] [CrossRef]
  9. Zhang, H.; Xue, J.; Qin, Y.; Chen, J.; Wang, J.; Yu, X.; Zhang, B.; Zou, Y.; Hong, Y.; Li, Z.; et al. Full-Dimensional Analysis of Gaseous Products to Unlocking In Depth Thermal Runaway Mechanism of Li-Ion Batteries. Small 2024, 20, e2406110. [Google Scholar] [CrossRef]
  10. Jia, Z.; Qin, P.; Li, Z.; Wei, Z.; Jin, K.; Jiang, L.; Wang, Q. Analysis of gas release during the process of thermal runaway of lithium-ion batteries with three different cathode materials. J. Energy Storage 2022, 50, 104302. [Google Scholar] [CrossRef]
  11. Mallick, S.; Gayen, D. Thermal behaviour and thermal runaway propagation in lithium-ion battery systems—A critical review. J. Energy Storage 2023, 62, 106894. [Google Scholar] [CrossRef]
  12. Feng, X.; Ouyang, M.; Liu, X.; Lu, L.; Xia, Y.; He, X. Thermal runaway mechanism of lithium ion battery for electric vehicles: A review. Energy Storage Mater. 2018, 10, 246–267. [Google Scholar] [CrossRef]
  13. Koch, S.; Fill, A.; Birke, K.P. Comprehensive gas analysis on large scale automotive lithium-ion cells in thermal runaway. J. Power Sources 2018, 398, 106–112. [Google Scholar] [CrossRef]
  14. Essl, C.; Golubkov, A.W.; Fuchs, A. Comparing Different Thermal Runaway Triggers for Two Automotive Lithium-Ion Battery Cell Types. J. Electrochem. Soc. 2020, 167, 130542. [Google Scholar] [CrossRef]
  15. Wang, H.; Xu, H.; Zhang, Z.; Wang, Q.; Jin, C.; Wu, C.; Xu, C.; Hao, J.; Sun, L.; Du, Z.; et al. Fire and explosion characteristics of vent gas from lithium-ion batteries after thermal runaway: A comparative study. eTransportation 2022, 13, 100190. [Google Scholar] [CrossRef]
  16. Amano, K.O.A.; Hahn, S.K.; Tschirschwitz, R.; Rappsilber, T.; Krause, U. An Experimental Investigation of Thermal Runaway and Gas Release of NMC Lithium-Ion Pouch Batteries Depending on the State of Charge Level. Batteries 2022, 8, 41. [Google Scholar] [CrossRef]
  17. Said, A.O.; Lee, C.; Stoliarov, S.I. Experimental investigation of cascading failure in 18650 lithium ion cell arrays: Impact of cathode chemistry. J. Power Sources 2020, 446, 227347. [Google Scholar] [CrossRef]
  18. Ribière, P.; Grugeon, S.; Morcrette, M.; Boyanov, S.; Laruelle, S.; Marlair, G. Investigation on the fire-induced hazards of Li-ion battery cells by fire calorimetry. Energy Environ. Sci. 2012, 5, 5271–5280. [Google Scholar] [CrossRef]
  19. Nedjalkov, A.; Meyer, J.; Köhring, M.; Doering, A.; Angelmahr, M.; Dahle, S.; Sander, A.; Fischer, A.; Schade, W. Toxic Gas Emissions from Damaged Lithium Ion Batteries—Analysis and Safety Enhancement Solution. Batteries 2016, 2, 5. [Google Scholar] [CrossRef]
  20. Liu, P.; Li, Y.; Mao, B.; Chen, M.; Huang, Z.; Wang, Q. Experimental study on thermal runaway and fire behaviors of large format lithium iron phosphate battery. Appl. Therm. Eng. 2021, 192, 116949. [Google Scholar] [CrossRef]
  21. Zhang, Q.; Niu, J.; Zhao, Z.; Wang, Q. Research on the effect of thermal runaway gas components and explosion limits of lithium-ion batteries under different charge states. J. Energy Storage 2022, 45, 103759. [Google Scholar] [CrossRef]
  22. Willstrand, O.; Pushp, M.; Andersson, P.; Brandell, D. Impact of different Li-ion cell test conditions on thermal runaway characteristics and gas release measurements. J. Energy Storage 2023, 68, 107785. [Google Scholar] [CrossRef]
  23. Lammer, M.; Königseder, A.; Gluschitz, P.; Hacker, V. Influence of aging on the heat and gas emissions from commercial lithium ion cells in case of thermal failure. J. Electrochem. Sci. Eng. 2018, 8, 101–110. [Google Scholar] [CrossRef]
  24. Brimblecombe, P. Air Composition and Chemistry; Air Composition & Chemistry, Cambridge University Press: Cambridge, UK, 1996. [Google Scholar]
  25. Wang, X.X.; Li, Q.T.; Zhou, X.Y.; Hu, Y.M.; Guo, X. Monitoring thermal runaway of lithium-ion batteries by means of gas sensors. Sens. Actuators B Chem. 2024, 411, 135703. [Google Scholar] [CrossRef]
  26. Hu, D.; Huang, S.; Wen, Z.; Gu, X.; Lu, J. A review on thermal runaway warning technology for lithium-ion batteries. Renew. Sustain. Energy Rev. 2024, 206, 114882. [Google Scholar] [CrossRef]
  27. Abdalwareth, A.; Flachenecker, G.; Angelmahr, M.; Schade, W. Optical fiber evanescent hydrogen sensor based on palladium nanoparticles coated Bragg gratings. Sens. Actuators A Phys. 2023, 361, 114594. [Google Scholar] [CrossRef]
  28. Butler, M.A. Optical fiber hydrogen sensor. Appl. Phys. Lett. 1984, 45, 1007–1009. [Google Scholar] [CrossRef]
  29. Zeakes, J.; Murphy, K.; Elshabini-Riad, A.; Claus, R. Modified extrinsic Fabry-Perot interferometric hydrogen gas sensor. In Proceedings of the Proceedings of LEOS’94, Boston, MA, USA, 31 October–3 November 1994; IEEE: Piscataway, NJ, USA, 1994; Volume 2, pp. 235–236. [Google Scholar] [CrossRef]
  30. Li, Y.C.; Wang, H.W.; Tian, J.Y.; Li, R.L.; Rahman, Z.U.; Kong, Q.P. Cultural diffusion of Indo-Aryan languages into Bangladesh: A perspective from mitochondrial DNA. Mitochondrion 2018, 38, 23–30. [Google Scholar] [CrossRef]
  31. Wu, B.; Zhao, C.; Xu, B.; Li, Y. Optical fiber hydrogen sensor with single Sagnac interferometer loop based on vernier effect. Sens. Actuators B Chem. 2018, 255, 3011–3016. [Google Scholar] [CrossRef]
  32. Butler, M.A. Micromirror optical-fiber hydrogen sensor. Sens. Actuators B Chem. 1994, 22, 155–163. [Google Scholar] [CrossRef]
  33. Slaman, M.; Dam, B.; Pasturel, M.; Borsa, D.; Schreuders, H.; Rector, J.; Griessen, R. Fiber optic hydrogen detectors containing Mg-based metal hydrides. Sens. Actuators B Chem. 2007, 123, 538–545. [Google Scholar] [CrossRef]
  34. Xu, B.; Chang, R.; Li, P.; Wang, D.N.; Zhao, C.L.; Li, J.Q.; Yang, M.; Duan, L.Z. Reflective optical fiber sensor based on light polarization modulation for hydrogen sensing. J. Opt. Soc. Am. B 2019, 36, 3471. [Google Scholar] [CrossRef]
  35. Sekimoto, S.; Nakagawa, H.; Okazaki, S.; Fukuda, K.; Asakura, S.; Shigemori, T.; Takahashi, S. A fiber-optic evanescent-wave hydrogen gas sensor using palladium-supported tungsten oxide. Sens. Actuators B Chem. 2000, 66, 142–145. [Google Scholar] [CrossRef]
  36. Dai, J.; Yang, M.; Yu, X.; Cao, K.; Liao, J. Greatly etched fiber Bragg grating hydrogen sensor with Pd/Ni composite film as sensing material. Sens. Actuators B Chem. 2012, 174, 253–257. [Google Scholar] [CrossRef]
  37. Dai, J.; Yang, M.; Yu, X.; Lu, H. Optical hydrogen sensor based on etched fiber Bragg grating sputtered with Pd/Ag composite film. Opt. Fiber Technol. 2013, 19, 26–30. [Google Scholar] [CrossRef]
  38. Tabib-Azar, M.; Sutapun, B.; Petrick, R.; Kazemi, A. Highly sensitive hydrogen sensors using palladium coated fiber optics with exposed cores and evanescent field interactions. Sens. Actuators B Chem. 1999, 56, 158–163. [Google Scholar] [CrossRef]
  39. Sumida, S.; Okazaki, S.; Asakura, S.; Nakagawa, H.; Murayama, H.; Hasegawa, T. Distributed hydrogen determination with fiber-optic sensor. Sens. Actuators B Chem. 2005, 108, 508–514. [Google Scholar] [CrossRef]
  40. Cao, R.; Wu, J.; Liang, G.; Ohodnicki, P.R.; Chen, K.P. Functionalized PdAu Alloy on Nanocones Fabricated on Optical Fibers for Hydrogen Sensing. IEEE Sens. J. 2020, 20, 1922–1927. [Google Scholar] [CrossRef]
  41. Lin, K.; Lu, Y.; Chen, J.; Zheng, R.; Wang, P.; Ming, H. Surface plasmon resonance hydrogen sensor based on metallic grating with high sensitivity. Opt. Express 2008, 16, 18599. [Google Scholar] [CrossRef]
  42. Nugroho, F.A.A.; Eklund, R.; Nilsson, S.; Langhammer, C. A fiber-optic nanoplasmonic hydrogen sensor via pattern-transfer of nanofabricated PdAu alloy nanostructures. Nanoscale 2018, 10, 20533–20539. [Google Scholar] [CrossRef]
  43. Tobiška, P.; Hugon, O.; Trouillet, A.; Gagnaire, H. An integrated optic hydrogen sensor based on SPR on palladium. Sens. Actuators B Chem. 2001, 74, 168–172. [Google Scholar] [CrossRef]
  44. Perrotton, C.; Westerwaal, R.J.; Javahiraly, N.; Slaman, M.; Schreuders, H.; Dam, B.; Meyrueis, P. A reliable, sensitive and fast optical fiber hydrogen sensor based on surface plasmon resonance. Opt. Express 2013, 21, 382. [Google Scholar] [CrossRef]
  45. Aray, A.; Ranjbar, M.; Shokoufi, N.; Morshedi, A. Plasmonic fiber optic hydrogen sensor using oxygen defects in nanostructured molybdenum trioxide film. Opt. Lett. 2019, 44, 4773. [Google Scholar] [CrossRef]
  46. Sutapun, B.; Tabib-Azar, M.; Kazemi, A.A. Fiber optic Bragg grating sensors for hydrogen gas sensing. In Proceedings of the Optical Engineering for Sensing and Nanotechnology (ICOSN ’99), Yokohama, Japan, 16–18 June 1999; Yamaguchi, I., Ed.; SPIE: Amsterdam, The Netherlands, 1999; Volume 3740, pp. 278–283. [Google Scholar] [CrossRef]
  47. Fisser, M.; Badcock, R.A.; Teal, P.D.; Janssens, S.; Hunze, A. Palladium-Based Hydrogen Sensors Using Fiber Bragg Gratings. J. Light. Technol. 2018, 36, 850–856. [Google Scholar] [CrossRef]
  48. Fisser, M.; Badcock, R.A.; Teal, P.D.; Hunze, A. Optimizing the sensitivity of palladium based hydrogen sensors. Sens. Actuators B Chem. 2018, 259, 10–19. [Google Scholar] [CrossRef]
  49. Fisser, M.; Badcock, R.A.; Teal, P.D.; Hunze, A. Improving the Sensitivity of Palladium-Based Fiber Optic Hydrogen Sensors. J. Light. Technol. 2018, 36, 2166–2174. [Google Scholar] [CrossRef]
  50. Buric, M.; Chen, K.P.; Bhattarai, M.; Swinehart, P.R.; Maklad, M. Active Fiber Bragg Grating Hydrogen Sensors for All-Temperature Operation. IEEE Photonics Technol. Lett. 2007, 19, 255–257. [Google Scholar] [CrossRef]
  51. Xiang, F.; Wang, G.; Qin, Y.; Yang, S.; Zhong, X.; Dai, J.; Yang, M. Improved Performance of Fiber Bragg Hydrogen Sensors Assisted by Controllable Optical Heating System. IEEE Photonics Technol. Lett. 2017, 29, 1233–1236. [Google Scholar] [CrossRef]
  52. Yang, S.; Wang, G.; Xiang, F.; Qin, Y.; Dai, J.; Yang, M. Pt nanoparticles encapsulated in mesoporous tungsten oxide to enhance the repeatability of a FBG hydrogen sensor. Opt. Mater. Express 2018, 8, 1493. [Google Scholar] [CrossRef]
  53. Yang, M.; Qin, Y.; Ma, Y.; Wang, G.; Xiang, F.; Wang, M.; Dai, J.; Chen, Z.; Xia, J.; Zhou, L. High-sensitivity fiber optic hydrogen sensor in air by optimizing a self-referenced demodulating method. Appl. Opt. 2018, 57, 8011. [Google Scholar] [CrossRef]
  54. Wicke, E.; Brodowsky, H.; Züchner, H. Hydrogen in palladium and palladium alloys. In Hydrogen in Metals II; Springer: Berlin/Heidelberg, Germany, 1978; pp. 73–155. [Google Scholar] [CrossRef]
  55. Blackford, B.L.; Arnold, C.S.; Mulhern, P.J.; Jericho, M.H. A scanning tunneling microscope study of a palladium sphere in hydrogen gas: Expansion and surface topology. J. Appl. Phys. 1994, 76, 4054–4060. [Google Scholar] [CrossRef]
  56. Kawasaki, A.; Itoh, S.; Shima, K.; Kato, K.; Ohashi, H.; Ishikawa, T.; Yamazaki, T. Change in the crystalline structure during the phase transition of the palladium–hydrogen system. Phys. Chem. Chem. Phys. 2015, 17, 24783–24790. [Google Scholar] [CrossRef]
  57. Syrenova, S.; Wadell, C.; Nugroho, F.A.A.; Gschneidtner, T.A.; Diaz Fernandez, Y.A.; Nalin, G.; Świtlik, D.; Westerlund, F.; Antosiewicz, T.J.; Zhdanov, V.P.; et al. Hydride formation thermodynamics and hysteresis in individual Pd nanocrystals with different size and shape. Nat. Mater. 2015, 14, 1236–1244. [Google Scholar] [CrossRef] [PubMed]
  58. Tew, M.W.; Miller, J.T.; van Bokhoven, J.A. Particle Size Effect of Hydride Formation and Surface Hydrogen Adsorption of Nanosized Palladium Catalysts: L3 Edge vs K Edge X-ray Absorption Spectroscopy. J. Phys. Chem. C 2009, 113, 15140–15147. [Google Scholar] [CrossRef]
  59. Frieske, H.; Wicke, E. Magnetic Susceptibility and Equilibrium Diagram of PdHn. Ber. Bunsenges. Phys. Chem. 1973, 77, 48–52. [Google Scholar] [CrossRef]
  60. Metzroth, L.J.T.; Miller, E.M.; Norman, A.G.; Yazdi, S.; Carroll, G.M. Accelerating Hydrogen Absorption and Desorption Rates in Palladium Nanocubes with an Ultrathin Surface Modification. Nano Lett. 2021, 21, 9131–9137. [Google Scholar] [CrossRef]
  61. Johnson, N.J.J.; Lam, B.; MacLeod, B.P.; Sherbo, R.S.; Moreno-Gonzalez, M.; Fork, D.K.; Berlinguette, C.P. Facets and vertices regulate hydrogen uptake and release in palladium nanocrystals. Nat. Mater. 2019, 18, 454–458. [Google Scholar] [CrossRef]
  62. Shooshtari, M. Gold-decorated vertically aligned carbon nanofibers for high-performance room-temperature ethanol sensing. Microchim. Acta 2025, 192, 517. [Google Scholar] [CrossRef]
  63. Burgmeier, J.; Schippers, W.; Emde, N.; Funken, P.; Schade, W. Femtosecond laser-inscribed fiber Bragg gratings for strain monitoring in power cables of offshore wind turbines. Appl. Opt. 2011, 50, 1868. [Google Scholar] [CrossRef]
  64. Eisner, L.; Flachenecker, G.; Schade, W. Doped silica sol layer coatings on evanescent field fiber Bragg gratings for optical detection of nitroaromate based explosives. Sens. Actuators A Phys. 2022, 343, 113687. [Google Scholar] [CrossRef]
  65. Shen, H.; Zhang, Y.; Wu, Y. A comparative study on air transport safety of lithium-ion batteries with different SOCs. Appl. Therm. Eng. 2020, 179, 115679. [Google Scholar] [CrossRef]
  66. Li, H.; Duan, Q.; Zhao, C.; Huang, Z.; Wang, Q. Experimental investigation on the thermal runaway and its propagation in the large format battery module with Li(Ni1/3Co1/3Mn1/3)O2 as cathode. J. Hazard. Mater. 2019, 375, 241–254. [Google Scholar] [CrossRef] [PubMed]
  67. Huang, Z.; Yu, Y.; Duan, Q.; Qin, P.; Sun, J.; Wang, Q. Heating position effect on internal thermal runaway propagation in large-format lithium iron phosphate battery. Appl. Energy 2022, 325, 119778. [Google Scholar] [CrossRef]
  68. Golubkov, A.W.; Fuchs, D.; Wagner, J.; Wiltsche, H.; Stangl, C.; Fauler, G.; Voitic, G.; Thaler, A.; Hacker, V. Thermal-runaway experiments on consumer Li-ion batteries with metal-oxide and olivin-type cathodes. RSC Adv. 2014, 4, 3633–3642. [Google Scholar] [CrossRef]
  69. Masalkovaitė, K.; Gasper, P.; Finegan, D.P. Predicting the heat release variability of Li-ion cells under thermal runaway with few or no calorimetry data. Nat. Commun. 2024, 15, 8399. [Google Scholar] [CrossRef]
  70. Essl, C.; Golubkov, A.W.; Gasser, E.; Nachtnebel, M.; Zankel, A.; Ewert, E.; Fuchs, A. Comprehensive Hazard Analysis of Failing Automotive Lithium-Ion Batteries in Overtemperature Experiments. Batteries 2020, 6, 30. [Google Scholar] [CrossRef]
  71. RaviPrakash, J.; McDaniel, A.; Horn, M.; Pilione, L.; Sunal, P.; Messier, R.; McGrath, R.; Schweighardt, F. Hydrogen sensors: Role of palladium thin film morphology. Sens. Actuators B Chem. 2007, 120, 439–446. [Google Scholar] [CrossRef]
  72. Xu, C.; Fan, Z.; Zhang, M.; Wang, P.; Wang, H.; Jin, C.; Peng, Y.; Jiang, F.; Feng, X.; Ouyang, M. A comparative study of the venting gas of lithium-ion batteries during thermal runaway triggered by various methods. Cell Rep. Phys. Sci. 2023, 4, 101705. [Google Scholar] [CrossRef]
  73. Neurock, M. First-principles analysis of the hydrogenation of carbon monoxide over palladium. Top. Catal. 1999, 9, 135–152. [Google Scholar] [CrossRef]
  74. Ogura, S.; Okada, M.; Fukutani, K. Near-Surface Accumulation of Hydrogen and CO Blocking Effects on a Pd–Au Alloy. J. Phys. Chem. C 2013, 117, 9366–9371. [Google Scholar] [CrossRef]
  75. Ogura, S.; Fukutani, K. Dynamic Blocking by CO of Hydrogen Transport across Pd70Au30(110) Surfaces. J. Phys. Chem. C 2017, 121, 3373–3380. [Google Scholar] [CrossRef]
  76. Darmadi, I.; Nugroho, F.A.A.; Kadkhodazadeh, S.; Wagner, J.B.; Langhammer, C. Rationally Designed PdAuCu Ternary Alloy Nanoparticles for Intrinsically Deactivation-Resistant Ultrafast Plasmonic Hydrogen Sensing. ACS Sens. 2019, 4, 1424–1432. [Google Scholar] [CrossRef]
  77. Li, Z.; Yu, Y.; Wang, J.; Wang, C.; He, X.; Cheng, Z.; Li, H.; Mei, W.; Wang, Q. Thermal runaway and gas venting behaviors of large-format prismatic sodium-ion battery. Energy Storage Mater. 2025, 77, 104197. [Google Scholar] [CrossRef]
  78. Huang, L.; Lu, T.; Xu, G.; Zhang, X.; Jiang, Z.; Zhang, Z.; Wang, Y.; Han, P.; Cui, G.; Chen, L. Thermal runaway routes of large-format lithium-sulfur pouch cell batteries. Joule 2022, 6, 906–922. [Google Scholar] [CrossRef]
Figure 1. Schematic of the FBG sensor system setup consisting of a reference temperature FBG and an H 2 -FBG. The system includes a light source, a spectrometer for signal acquisition and data evaluation for spectral analysis.
Chemosensors 13 00348 g001
Figure 2. Illustration of etched optical fiber with FBG (eFBG) and the evanescent wave exposed to the surroundings.
Chemosensors 13 00348 g002
Figure 3. Schematic of the experimental setup showing the sensors applied during testing, including optical gas measurement, optical and electrical temperature sensing and an electrochemical reference gas-measurement unit.
Chemosensors 13 00348 g003
Figure 4. (left) The optical fiber showing the low mechanical stability, (center) FBGs fixed to a custom-made 3D-printed fiber holder, (right) the FBGs enclosed in the metal sieve.
Chemosensors 13 00348 g004
Figure 5. Images of the cell before venting, during venting and the ignition of the venting gases with the corresponding time in seconds.
Chemosensors 13 00348 g005
Figure 6. Results of the first cell test showing the change in surface temperature, cell voltage and the gas temperature measured using the optical sensor and thermocouple.
Chemosensors 13 00348 g006
Figure 7. Changes in intensity signal and wavelength shift of the H 2 -FBG sensor during the first venting event are shown. The inset illustrates the detailed progression of intensity and wavelength shift during the flame occurrence.
Chemosensors 13 00348 g007
Figure 8. Snapshots of the cell at different points in the experiment, showing the cell swelling related to a gas buildup inside the cell followed by a reduction in thickness due to venting of the gases.
Chemosensors 13 00348 g008
Figure 9. Results of the second cell test showing the change in surface temperature, cell voltage and the gas temperature measured using the optical sensor and thermocouple.
Chemosensors 13 00348 g009
Figure 10. Changes in the intensity signal and wavelength shift for H 2 -FBG sensor during the second test.
Chemosensors 13 00348 g010
Figure 11. Intensity changes in the H 2 -FBG sensor with response to 4% H 2 , 4% H 2 mixed with 0.5% CO, 0.5% CO and again 4% H 2 .
Chemosensors 13 00348 g011
Table 1. Overview results from different works on the produced gas volume and the most important components contained in the venting gas during thermal runaway of different lithium-ion batteries utilizing a Nickel Manganese Cobalt (NMC) cathode. All works displayed utilized cells at 100% state of charge (SOC).
CathodeGas Vol. H 2 CO CO 2 OtherSource
(l  Ah 1 )Concentration in %
NMC1.9622283713[13]
NMC2.0221 (±5)27 (±4)24 (±5)28[14]
NMC318 (±3)20 (±4)38 (±4)24[15]
NMC-8 (±8)--92[16]
NMC-11312434[17]
Table 2. Information about cell parameters used in the individual tests.
TestCathodeCapacityCell TotalSOCFormat
#1NMC39.6 Ah140%pouch
#2NMC40.1 Ah140%pouch
Disclaimer/Publisher’s Note: The statements, opinions and data contained in all publications are solely those of the individual author(s) and contributor(s) and not of MDPI and/or the editor(s). MDPI and/or the editor(s) disclaim responsibility for any injury to people or property resulting from any ideas, methods, instructions or products referred to in the content.