Article

Electrochemical Monitoring of Bisphenol A Degradation in Leachate by Trichoderma harzianum Using a Sensitive Sensor of Type SPE in Microbial Fuel Cells

by
Serge Mbokou Foukmeniok
1,*,
Jean-Philippe Theodore Silga
1,
Adil Ait Yazza
1,
Honorine Hortense Bougna Tchoumi
1,
Malak Dia
1,
Maxime Pontie
1 and
Vladimir Urošević
2
1
Group of Analysis and Processes (GA&P), Department of Chemistry, University of Angers, 49045 Angers, Cedex 01, France
2
Zentrix Lab, Miloša Trebinjca 12, 26000 Pančevo, Vojvodina, Serbia
*
Author to whom correspondence should be addressed.
Chemosensors 2025, 13(9), 317; https://doi.org/10.3390/chemosensors13090317
Submission received: 18 July 2025 / Revised: 15 August 2025 / Accepted: 18 August 2025 / Published: 22 August 2025
(This article belongs to the Special Issue Nanomaterial-Based Sensors: Design, Development and Applications)

Abstract

This study reports the development of a simple and sensitive electrochemical sensor based on activated screen-printed electrodes modified by electrodeposition of nickel(II) tetrasulfonated phthalocyanine film (poly-NiTSPc), denoted SPE-A-polyNiTSPc, for the direct determination of BPA in landfill leachate samples. BPA concentrations in raw landfill leachate solutions and in residual solutions after a reverse osmosis (RO) treatment were determined, using differential pulse voltammetry (DPV) on SPE-A-polyNiTSPc, to be 29.7 mgL−1 and 6.4 µgL−1, respectively. The obtained BPA concentrations were very close to those found by the accredited lab in the same samples, which were 29.6 mgL−1 and 6.0 µgL−1, respectively. The applicability of SPE-A-polyNiTSPc for BPA bioremediation was investigated in landfill leachate samples using Trichoderma harzianum fungus in a microbial fuel cell (MFC), where the kinetics data were modeled. The first results showed an IC50 of 175 mgL−1 BPA, indicating that the inhibition factor could be negligeable for MFC experiments at 30 mgL−1 BPA. The biodegradation kinetics was found to be of first order, with a kinetic constant of 0.795 h−1 at 22 °C and a half-degradation time of 0.872 h for an initial concentration of 29 mgL−1. The developed MFC displayed higher stability, offering a maximum power of 100 mWm−3.

1. Introduction

Bisphenol A (BPA) is a monomeric compound used in the synthesis of epoxy resin and polycarbonate plastics, but also in the production of food packaging and plastic products [1,2]. The widespread use of BPA followed by the negative public sentiment built up around BPA leads to growing awareness of its presence in the environment. The European Union has banned the use of BPA, known as a carcinogenic, mutagenic, and reprotoxic molecule [3,4]. In fact, BPA is an endocrine disruptor that can disrupt the normal functioning of the hormone system [5,6,7]. Moreover, BPA can affect reproductive function, mammary gland development, cognitive function, and metabolism, leading to serious eye problems, allergic skin reactions, and respiratory irritation [8,9]. Microplastics were reported as a potential source for hydrophobic organic pollutants such as BPA [10]. BPA is highly resistant to chemical degradation and has been frequently detected in many environmental samples. Recently, BPA was found in natural waters, not only due to the migration of BPA-based products but also through the effluent of wastewater, e.g., 568 ngL−1 of BPA in bottled water [11] and 16 μgL−1 of BPA in the wastewater from an industrial park located in southern Taiwan [12]. Landfill sites were also identified as significant environmental sources of BPA due to the higher presence of weathered plastic materials and aging of microplastic particles in waste landfills [13]. Numerous studies have documented the analysis of BPA in landfill leachates [14]. As a typical example, Takashi et al. [15] reported in 1996 that the presence of BPA ranged from 1.3 to 17,200 µgL−1, with a median concentration of 269 µgL−1, in hazardous waste landfill leachates collected in Japan. More recently, Narevski et al. [16] reported the presence of BPA in leachate samples of all investigated landfill sites in the southeast of Europe, where the average concentration levels of BPA from 0.70 to 2.72 mgL−1 were related to the content of microplastics. To limit the harmful effects of BPA on infants, several states have imposed restrictive measures on the production and sale of milk bottles containing BPA [17]. Nowadays, many analytical techniques are being developed for BPA determination, including chromatography [18], spectrophotometry [19], immunoassay [20], ELISA technology [21], and electrochemical sensors [22,23,24,25]. Except for electrochemical sensors, most of these techniques are cost-expensive, time-consuming, and require skilled manpower [26]. Electrochemical sensors offer various advantages, such as fast analyte detection, high sensitivity, a relatively low cost, minimum requirements, and convenience for on-site monitoring purposes [27,28,29]. Moreover, there is a possibility to modify the electrode surface with novel materials that have great affinities for BPA, leading to an increase in the sensitivity of the sensor [27]. Also, the surface modification could be helpful in solving surface passivation issues, caused by the oxidation products of BPA, which foul and obstruct the active surface area, reducing the performance of the electrode [30].
Numerous technologies have been developed for the removal of micropollutants from landfill leachates, including chromatography [14,15], advanced oxidation-based processes [31], constructed wetlands [32], coagulation–flocculation-based chemical treatment [33], and membrane bioreactors [34]. Membrane bioreactors, which combine biodegradation and microfiltration, are useful for treating old landfill leachates, particularly when conventional processes become inefficient [35]. The primary benefit of the biodegradation technologies is thought to be the lack of hazardous byproducts [36,37]. One of these technologies includes microbial fuel cells (MFCs), which are a type of bioelectrochemical system that utilizes the metabolic activity of microorganisms to generate energy while simultaneously removing pollutants. A single-strain fungus called Trichoderma harzianum has been efficiently used in MFCs to degrade phenolic compounds, which represent persistent and complex pollutants in wastewater treatment plants [38]. Trichoderma species are characterized by their metabolic potentialities and the robust enzymatic activities, offering them a great ability to be more efficient in varied environmental conditions [39]. In fact, Trichoderma species possess a redox-active enzyme, namely laccases, that can oxidize phenolic compounds and aromatic amines, leading to complete mineralization [40,41]. Our motivation for using Trichoderma harzianum fungus as a degrading agent in the MFC is to break down the aromatic rings and avoid BPA byproducts.
The last of the abovementioned studies clearly demonstrated that most of the landfill sites are polluted by BPA, and this led us to investigate the levels of BPA in landfill leachate located in Pera Galini, in Crete. Our study provides details on the elaboration and characterizations of an ultrasensitive electrochemical sensor (SPE-A-polyNiTSPc) dedicated to BPA analysis in landfill leachate waters and bioremediation in the fungal MFC. Using fungal-based microbial fuel cells (FMFCs), our investigations consisted of studying the degradation of BPA in both the phosphate buffer solution (PBS) and a landfill leachate solution by Trichoderma harzianum fungus. Furthermore, we explored the biodegradation kinetics of BPA inside the MFCs, providing the kinetic models and their half-degradation times. Our study presents original results on leachate wastewater treatment and the generation of renewable energy using fungal MFCs.

2. Materials and Methods

2.1. Reagents and Solutions

Bisphenol A, Nickel(II) tetrasulfonated phthalocyanine, sulfuric acid (H2SO4, 98%), sodium hydroxide (NaOH, 99%), and sodium acetate (CH3COONa, 99%) were purchased from Merck (France)without further purification. A total of 0.1 M phosphate-buffered solution (PBS) at pH = 7.4 was prepared from sodium dihydrogen phosphate dihydrate (NaH2PO4.2H2O) and disodium hydrogen phosphate heptahydrate (Na2HPO4.7H2O), which were procured from Merck (France). Unless stated otherwise, analytical-grade chemicals and ultra-pure water were employed to prepare all aqueous solutions.

2.2. Instrumentation

The potentiostat EmStat 4X electrochemical analyzer (PalmSens Instruments, Houten, Netherlands) was employed to conduct all electrochemical measurements. The potentiostat was connected to a laptop and controlled by the software PSTrace 5.10. Electrochemical measurements were performed using DropSens screen-printed electrodes (DRP-110, France), comprising graphite working and counter electrodes and silver pseudo-reference electrodes.
An electro-chemical impedance spectroscopy (EIS) study was carried out using an Origaflex potentiostat (Origalys, Lyon, France) connected to a laptop and controlled via the software Origa-Master 5. Sessile drop contact measurements were recorded to assess the hydrophobic properties of modified and non-modified electrodes. A numerical microscope (Keyence VHX, Bois-Colombes, France) was utilized to evaluate the surface of SPEs and estimate their roughness under a magnification of ×100 in a window of 6 mm2. Microscopic analysis of carbon cloth was conducted via a scanning electron microscope equipped with a field emission gun (JSM-6301 F apparatus from JEOL). All figures and graphs were plotted using licensed ORIGIN software (license N° GAP (UA): GF3S5-6089-7183940).

2.3. Elaboration Protocol of SPE-A-polyNiTSPc Electrochemical Sensor

The commercialized SPEs were activated by recording two cyclic voltammograms in H2SO4 (0.5 M) at a scan rate of 100 mVs−1 in a potential range from −2.5 to 2.5 V/Ag [42]. Poly-NiTSPc film deposition was completed in two steps: the first step consisted of recording 5 successive cyclic voltammograms on the activated SPE in the presence of 0.1 M NaOH at a scan rate of 100 mVs−1 from 0 to 1.3 V/Ag [43]. The aim of this step was to generate oxygen atoms on the SPE surface, essential for poly-NiTSPc deposition. The second step was the electrodeposition of the poly-NiTSPc film, which was then achieved by performing 100 cyclic scans in the presence of 2 mM NiTSPc solution prepared in 0.1 M NaOH. The number of cycles of poly-NiTSPc film was optimized to obtain the highest electrochemical response for BPA, and the optimum number of scans was found to be 100 cycles.

2.4. Electrochemical Measurements

A linear sweep voltammetry method (LSV) at a scan rate of 100 mVs−1 was employed to assess the electrodeposition of the poly-NiTSPc film on the graphite SPE. Differential pulse voltammetry (DPV) was chosen for further analysis of BPA under the following optimized parameters: step potential 5 mV, pulse potential 5 mV, and pulse time 20 ms. All the electrochemical measurements were carried out using a droplet of the samples, with a volume of 70 μL placed on the top of the SPE. To avoid clogging the surface of the electrodes, the landfill leachate samples tested were filtered with Whatman paper before analysis. The procedure for the electrochemical determination of BPA in real samples using the standard addition method consisted of placing 20 mL of filtrated landfill leachate solution in the voltammetric cell and adding the required volume of standard BPA. DPV curves were recorded from 0.0 to 0.5 V at a scan rate of 50 mVs−1. All electrochemical measurements were made at room temperature.

2.5. T. harzianum Strain Information

T. harzianum is an ascomycete class of fungus widely used for pollutant removal [40]. The enzymatic activity of T. harzianum offers to this fungus the ability to break down the double C=C bonds of the aromatic compounds, which facilitates the biodegradation of PBA. Moreover, T. harzianum is a non-pathogenic fungus for humans and the environment. The strain of T. harzianum (Number 918) was supplied by IRHS-INRAE Angers, France and cultured as described in previous work [41].

2.6. Bioanode and Biocathode Elaboration

Carbon cloth (CC) (KIP-1300 type furnished by DACARB, Asnières-sur-Seine, France) was used as the electrode material (9 cm2) in both anode and cathode compartments. Before its use as a supporting layer for biofilm deposition, CC was cleaned using the protocol previously reported [36,39,42]. Briefly, CC was immersed in a fungal suspension containing 0.1 M acetate buffer (pH 4.8) and agitated for three days. After the three-day immersion of the CC into the fungal suspension, a mature biofilm was obtained on the carbon cloth and then used as the bioanode in the MFC. The experiments were conducted under sterile conditions to prevent external contamination.
The CC was used as a biocathode in the MFC without further modification. Thus, the cleaned CC was immersed into the cathodic compartment containing potassium ferricyanide (10 gL−1) in acetate buffer solution (0.1 M, pH = 4.8). Potassium ferricyanide was added in the cathodic compartment to improve the performance of MFC by enhancing O2 reduction.

2.7. Fungal Strain Preparation Protocol for SEM Observations

The CC in the presence of T. harzianum biofilm and the unmodified CC were pretreated before microscopic observations. The pretreatment aimed to favor the adherence of the fungus on the CC. The pretreatment consisted of an immersion of the CC in a mixture of glutaraldehyde (2.5%) and paraformaldehyde (2.5%) prepared in the cacodylate buffer for 24 h. The pretreated CCs were then washed three times in the cacodylate buffer solution and then one time in an osmium tetroxide solution for 1 h 45 min. After washing, CCs underwent a dehydration step in the ethanol at 50%, 70%, 95%, and 100% for 2 h and were lastly dried in a desiccator in the presence of hexamethyldisilazane for 24 h. The prepared CC samples were carefully placed on a steel disk and coated with a thin platinum layer to enhance conductivity. After preparation, the samples were transferred to the SEM chamber for microscopic analysis.

2.8. MFC Configuration

In this study, a two-compartment design with separated anode and cathode compartments was employed as a setup for the MFC. The two compartments had a working volume of 50 mL each and were divided by a custom-fabricated proton exchange membrane to facilitate proton transfer between the two compartments while maintaining physical separation. Before assembly, both compartments were sterilized in an autoclave and were handled afterward under sterile conditions to prevent contamination. The anodic compartment was filled with a landfill leachate solution containing BPA at 29 mgL−1, in which a CC covered by the biofilm of T. harzianum was placed. The cathodic compartment contained potassium ferricyanide (10 gL−1) in acetate buffer solution (0.1 M, pH = 4.8). As described in our previous work [41], the two compartments separated by a cation exchange membrane 189 (Amer-Sil S.A., Luxemburg, lot n° MEC/CEMs S80-33) were connected to the electrical circuit using platinum rods and alligator clips. The circuit included a multimeter for monitoring electromotive force (EMF) over time and a parallel-connected resistance decade box (10 MΩ to 1 kΩ) to select the optimal resistance.
The MFC operated at room temperature (22 ± 2 °C) under continuous magnetic stirring, while oxygen was supplied to the cathode compartment via an air pump equipped with a 0.2 µm filter. During the experiment, anolyte samples (70 µL) were collected every 30 min and analyzed using the developed poly-NiTSPc-activated SPE.
In this study, polarization measurements were conducted by adjusting the external resistance (R) from 10 MΩ to 1 kΩ while recording the corresponding EMF (E). The open-circuit potential was measured at R = 10 MΩ. To evaluate voltage, current, and power relationships, polarization curves were established. These curves also helped to determine the optimal external resistance for peak performance. Current intensity (I) was derived using Ohm’s law (Formula (2)), and power output was calculated using Formula (3):
E = RI,
E = RI2,
In the anodic compartment, the fungus T. harzianum degrades BPA, releasing electrons that travel through the external circuit to the cathode. Simultaneously, protons migrate across the proton exchange membrane from the anode to the cathode.
At the cathode, electrons combine with the diffused protons and oxygen (supplied by air) to form water. This electron transfer from the anode to cathode creates a current and measurable voltage, which enables electricity generation. The internal resistance of the MFC was measured using a multimeter and found to be 21,350 Ω.

2.9. Composition and Characteristics of Landfill Leachate Wastewater

The real samples used in this work were landfill leachate solutions collected in the municipal Leachate Treatment Plant of Pera Galini in Crete. The Leachate Treatment Plant of Pera Galini Sanitary Landfill is a tertiary treatment plant that receives the leachate produced by the Sanitary Landfill of Pera Galini. Table 1 shows the main physico-chemical properties of the landfill leachate samples tested. In addition to other compounds, the landfill leachate is made of dissolved organic matter, heavy metals, salts, and chlorinated aliphatic and phenol molecules that result from household waste biodegradation and rainwater percolation [35].
Landfill leachate contains dissolved organic matter comprising a complex mixture of different organic compounds. This includes volatile fatty acids with low molecular weights, along with humic and fulvic acids [43]. Heavy metals are present in landfill leachate but at low concentrations due to sorption and precipitation processes [44]. Leachate also consists of aromatic phenol molecules, the concentration of which constitutes the phenol index (PI).

3. Results

3.1. Phenolic Composition of Both Influent and Effluent of Landfill Leachates

The European regulation on water analysis evolves over time. In 2025, they have moved from global parameter determination like the phenol index (PI) to the determination of molecules. The PI is a key parameter that describes the concentration of a group of aromatic compounds commonly found in the wastewater of various industries. The PI of landfill leachate solutions located in Pera Galini in Crete was monitored each month, and the obtained results revealed that the most abundant molecule of the PI is the BPA molecule. Table 2 gives a list of molecules that constitute the PI in the waste leachate of the Pera Galini site and their concentrations.
From Table 2, BPA represents the major component of the PI in the landfill leachate solutions of Pera Galini in Crete. BPA concentrations were found to be 29,579 µgL−1 and 6 µgL−1 in the raw influent and effluent after RO, respectively. The obtained result was a good starting point, leading to the start of the electrochemical sensor development dedicated to BPA.

3.2. Preparation of the Electrode: Activation of SPE and Electrodeposition of poly-NiTSPc Film

SPEs were first activated in H2SO4 (0.5 M) and then modified by deposition of poly-NiTSPc film. Most of the time, one can observe, after the manufacturing of SPEs, the presence of residues, adhesives, or oils that might reduce the access to carbon sites by the analyte. To improve the electron transfer rate and the access to the carbon site of the working electrode surface, we have carried out the activation process of SPEs, as reported in the literature [45].
Figure 1 presents the poly-NiTSPc film deposition on the activated SPE obtained in 2 mM NiTSPc solution prepared in 0.1 M NaOH.
From Figure 1, the oxidation and reduction reaction observed at 0.3 V/Ag and 0.45 V/Ag, respectively, correspond to the transformation of (NiII/NiIII) [46,47,48]. The redox signals increase with an increase in the number of cycles, indicating the electrodeposition of poly-NiTSPc film on SPE. The principle of polyNiTSPc deposition is expressed by the generation of oxo bridges (O-Ni-O) on the SPE surface [49]. The effective presence of the NiTSPc film on the SPE surface is confirmed by a cyclic voltammogram recorded on SPE-A-polyNiTSPc in NaOH 0.1 M as shown in the insert of Figure 1. The redox signals obtained at 0.3 V/Ag and 0.55 V/Ag on this voltammogram prove the presence of nickel on the SPE surface and subsequently prove that the formation of the NiTSPc film on the SPE surface occurred effectively. By following the methodology previously described by Pontié et al. [48], the hatched part of the voltammogram was integrated, leading to the determination of the coverage surface of the electrode and then to deducing the thickness (e) of the poly-NiTSPc film deposited, which was calculated to be 486 nm.

3.3. Optimization of the Number of Cycles for the Electrodeposition of poly-NiTSPc on the Activated SPE

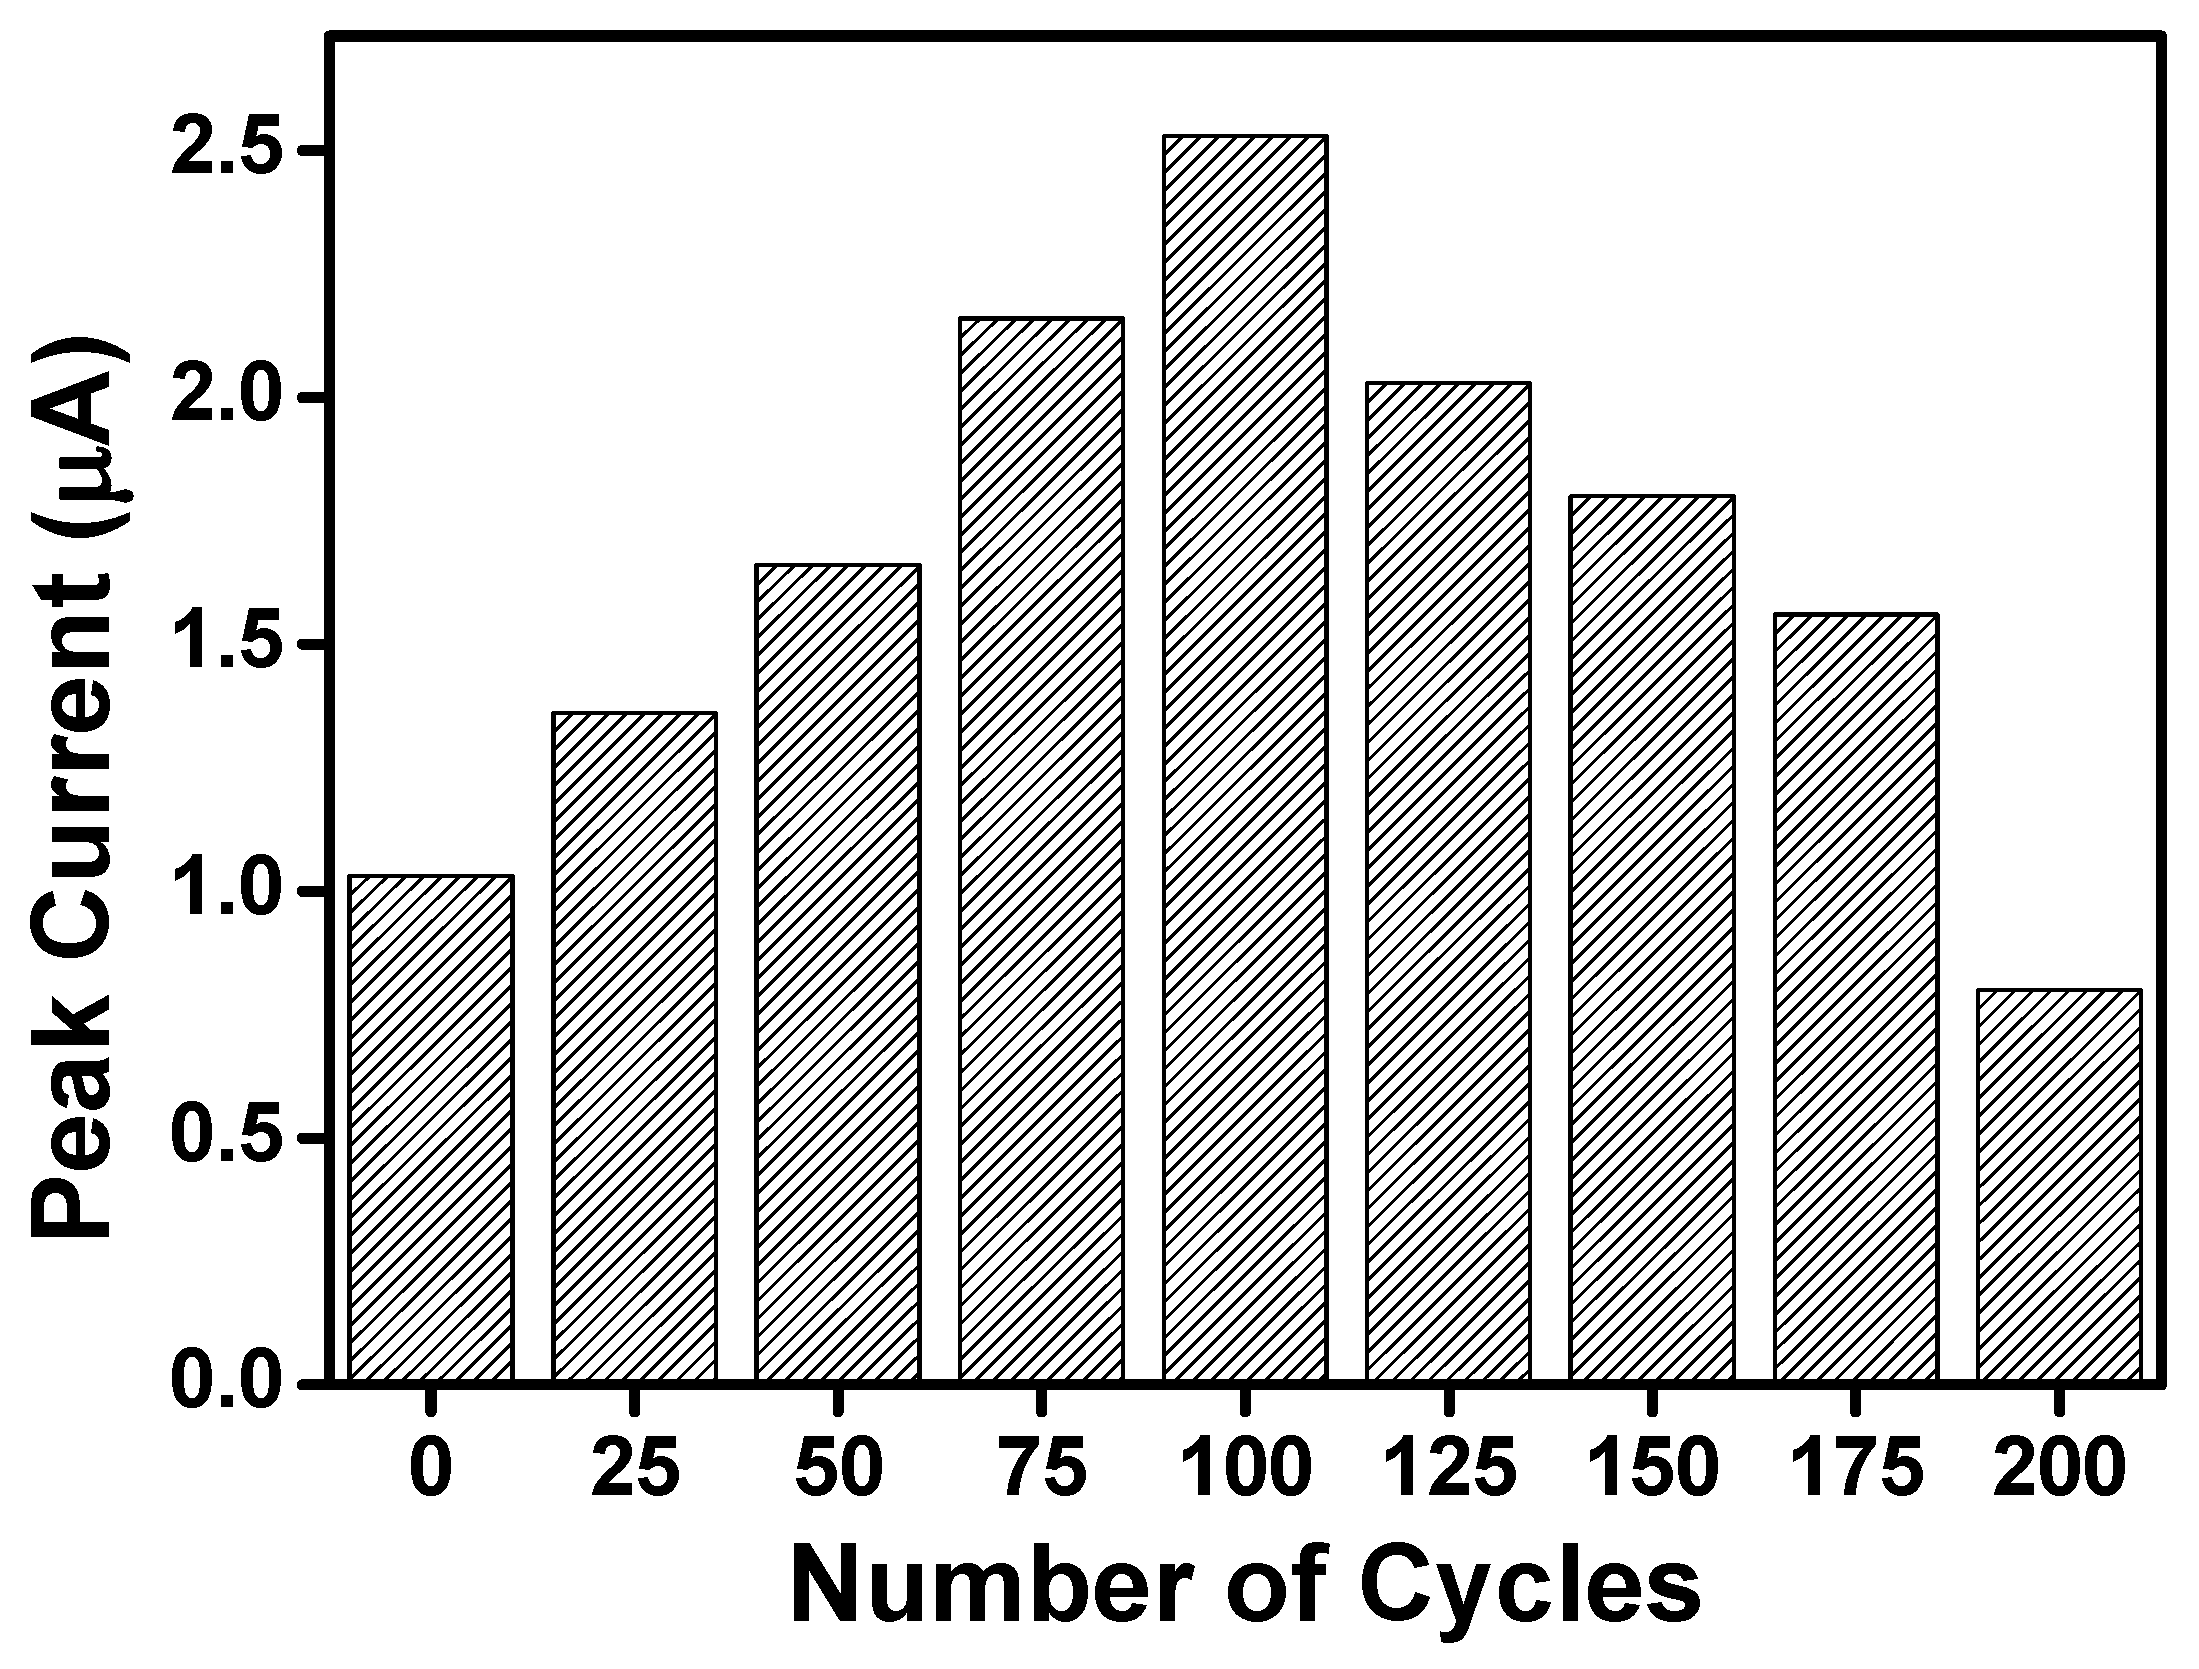
The number of poly-NiTSPc electrodeposition cycles was varied from 0 to 200 cycles. Figure 2 shows the DPV responses in peak intensity on BPA 10 mgL−1 at different electrodeposition cycles.
From Figure 2, it can be observed that the peak current of BPA increases with the number of electrodeposition cycles, reaching a maximum at 100 cycles, and then decreases continuously. At 100 cycles, the poly-NiTSPc film exhibits optimal electrocatalytic performance. This finding aligns with previous observations by Bako et al. [41]. Based on these results, 100 cycles were selected as the optimal electrodeposition parameter for the poly-NiTSPc film in subsequent experiments. The observed decrease in peak current beyond this point (Figure 2) can be attributed to excessive film thickness, which increases electron transfer resistance and hinders charge transport.

3.4. SEM, EDX, and AFM Characterizations of the SPEs

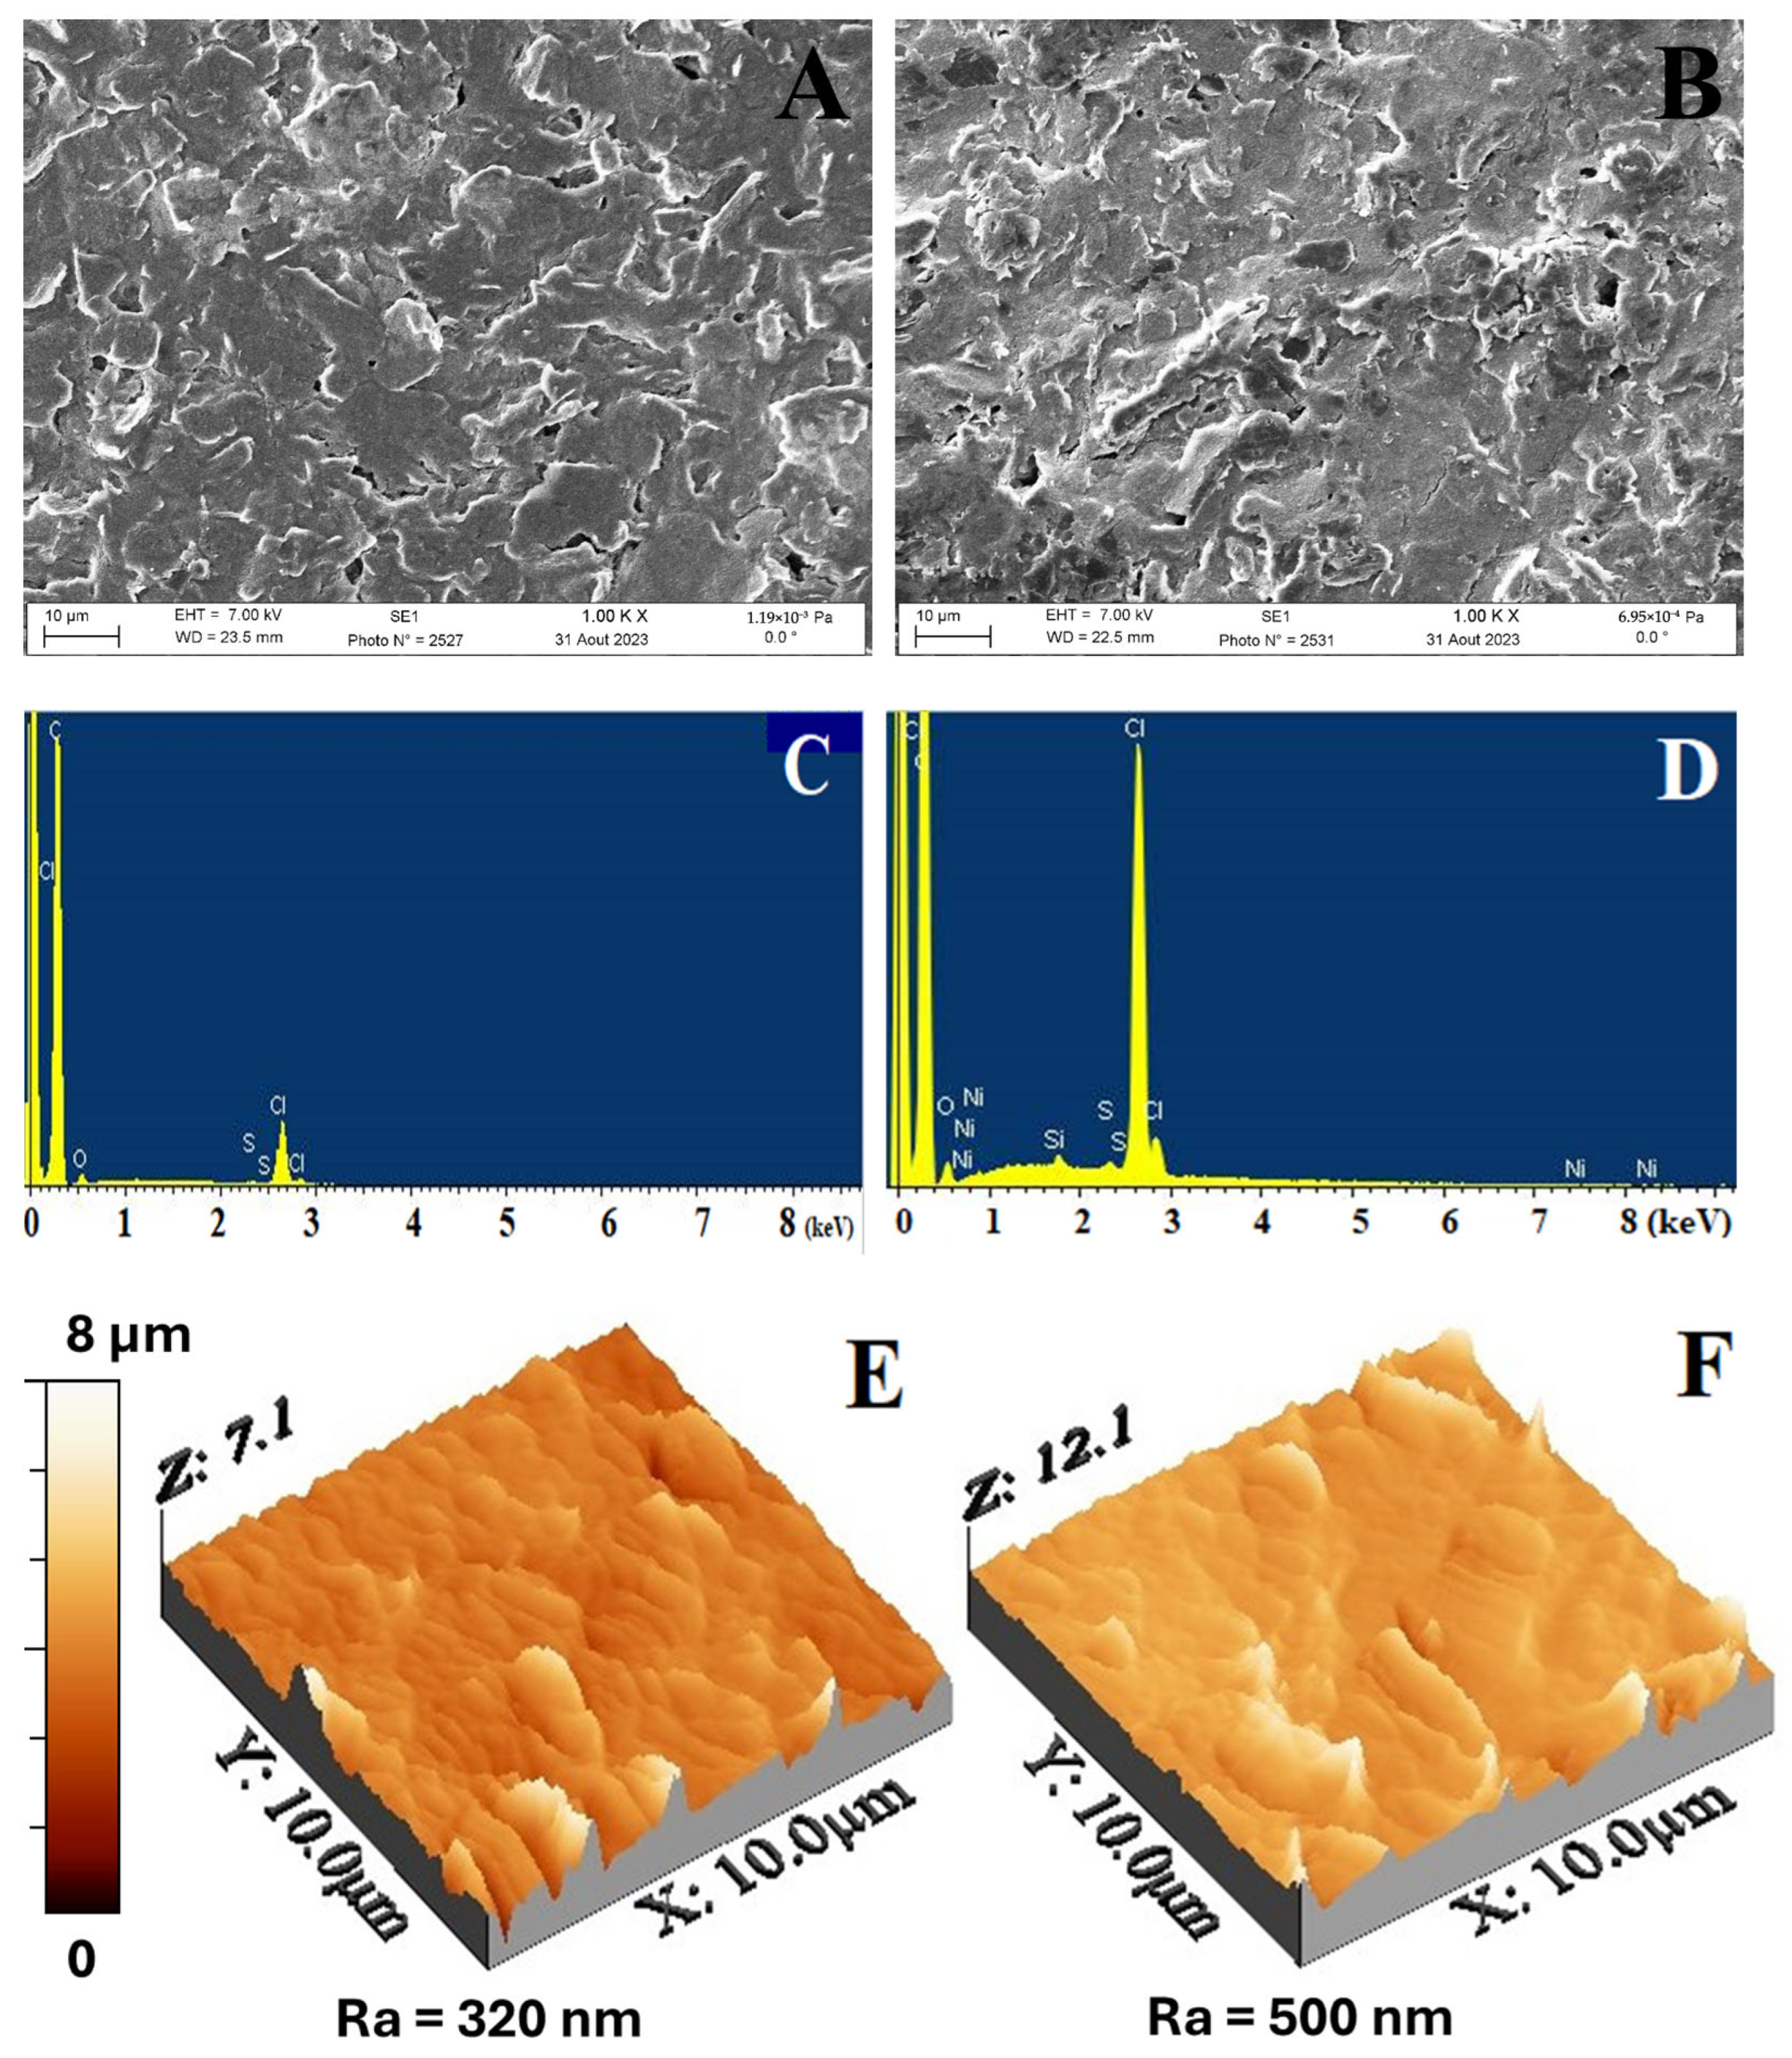
SEM images, EDX spectra, and AFM images of the unmodified SPE and the modified SPE-A-polyNiTSPc are shown in Figure 3.
One can note in Figure 3A,B that no significant difference was observed on the surfaces of unmodified SPE and SPE-A-polyNiTSPc. In Figure 3C,D, the presence of carbon and oxygen atoms is noted on both unmodified SPE and SPE-A-polyNiTSPc, indicating the basic structure of the SPE. The most important observation is the presence of atoms like sulfur and nickel on the SPE-A-polyNiTSPc spectrum due to the activation of the electrode and the electrodeposition of NiTSPc film using sulfuric acid and NiTSPc solutions, respectively. The presence of chlorine and sodium elements is also noted. These elements might come from the buffer solution used during the experiments. From AFM images (Figure 3E,F), SPE-A-polyNiTSPc shows a higher value of roughness (Ra = 500 nm) compared to the unmodified SPE (Ra = 320 nm). This is due to the activation process of SPE and the presence of poly-NiTSPc film on the SPE-A-polyNiTSPc surface. The obtained results in this section prove the effective activation and electrodeposition of NiTSPc film on the electrode that might improve the active surface area of the modified electrode.

3.5. Electrochemical Impedance Spectroscopy (EIS) and Real Surface Area Determination of the Elaborated SPEs

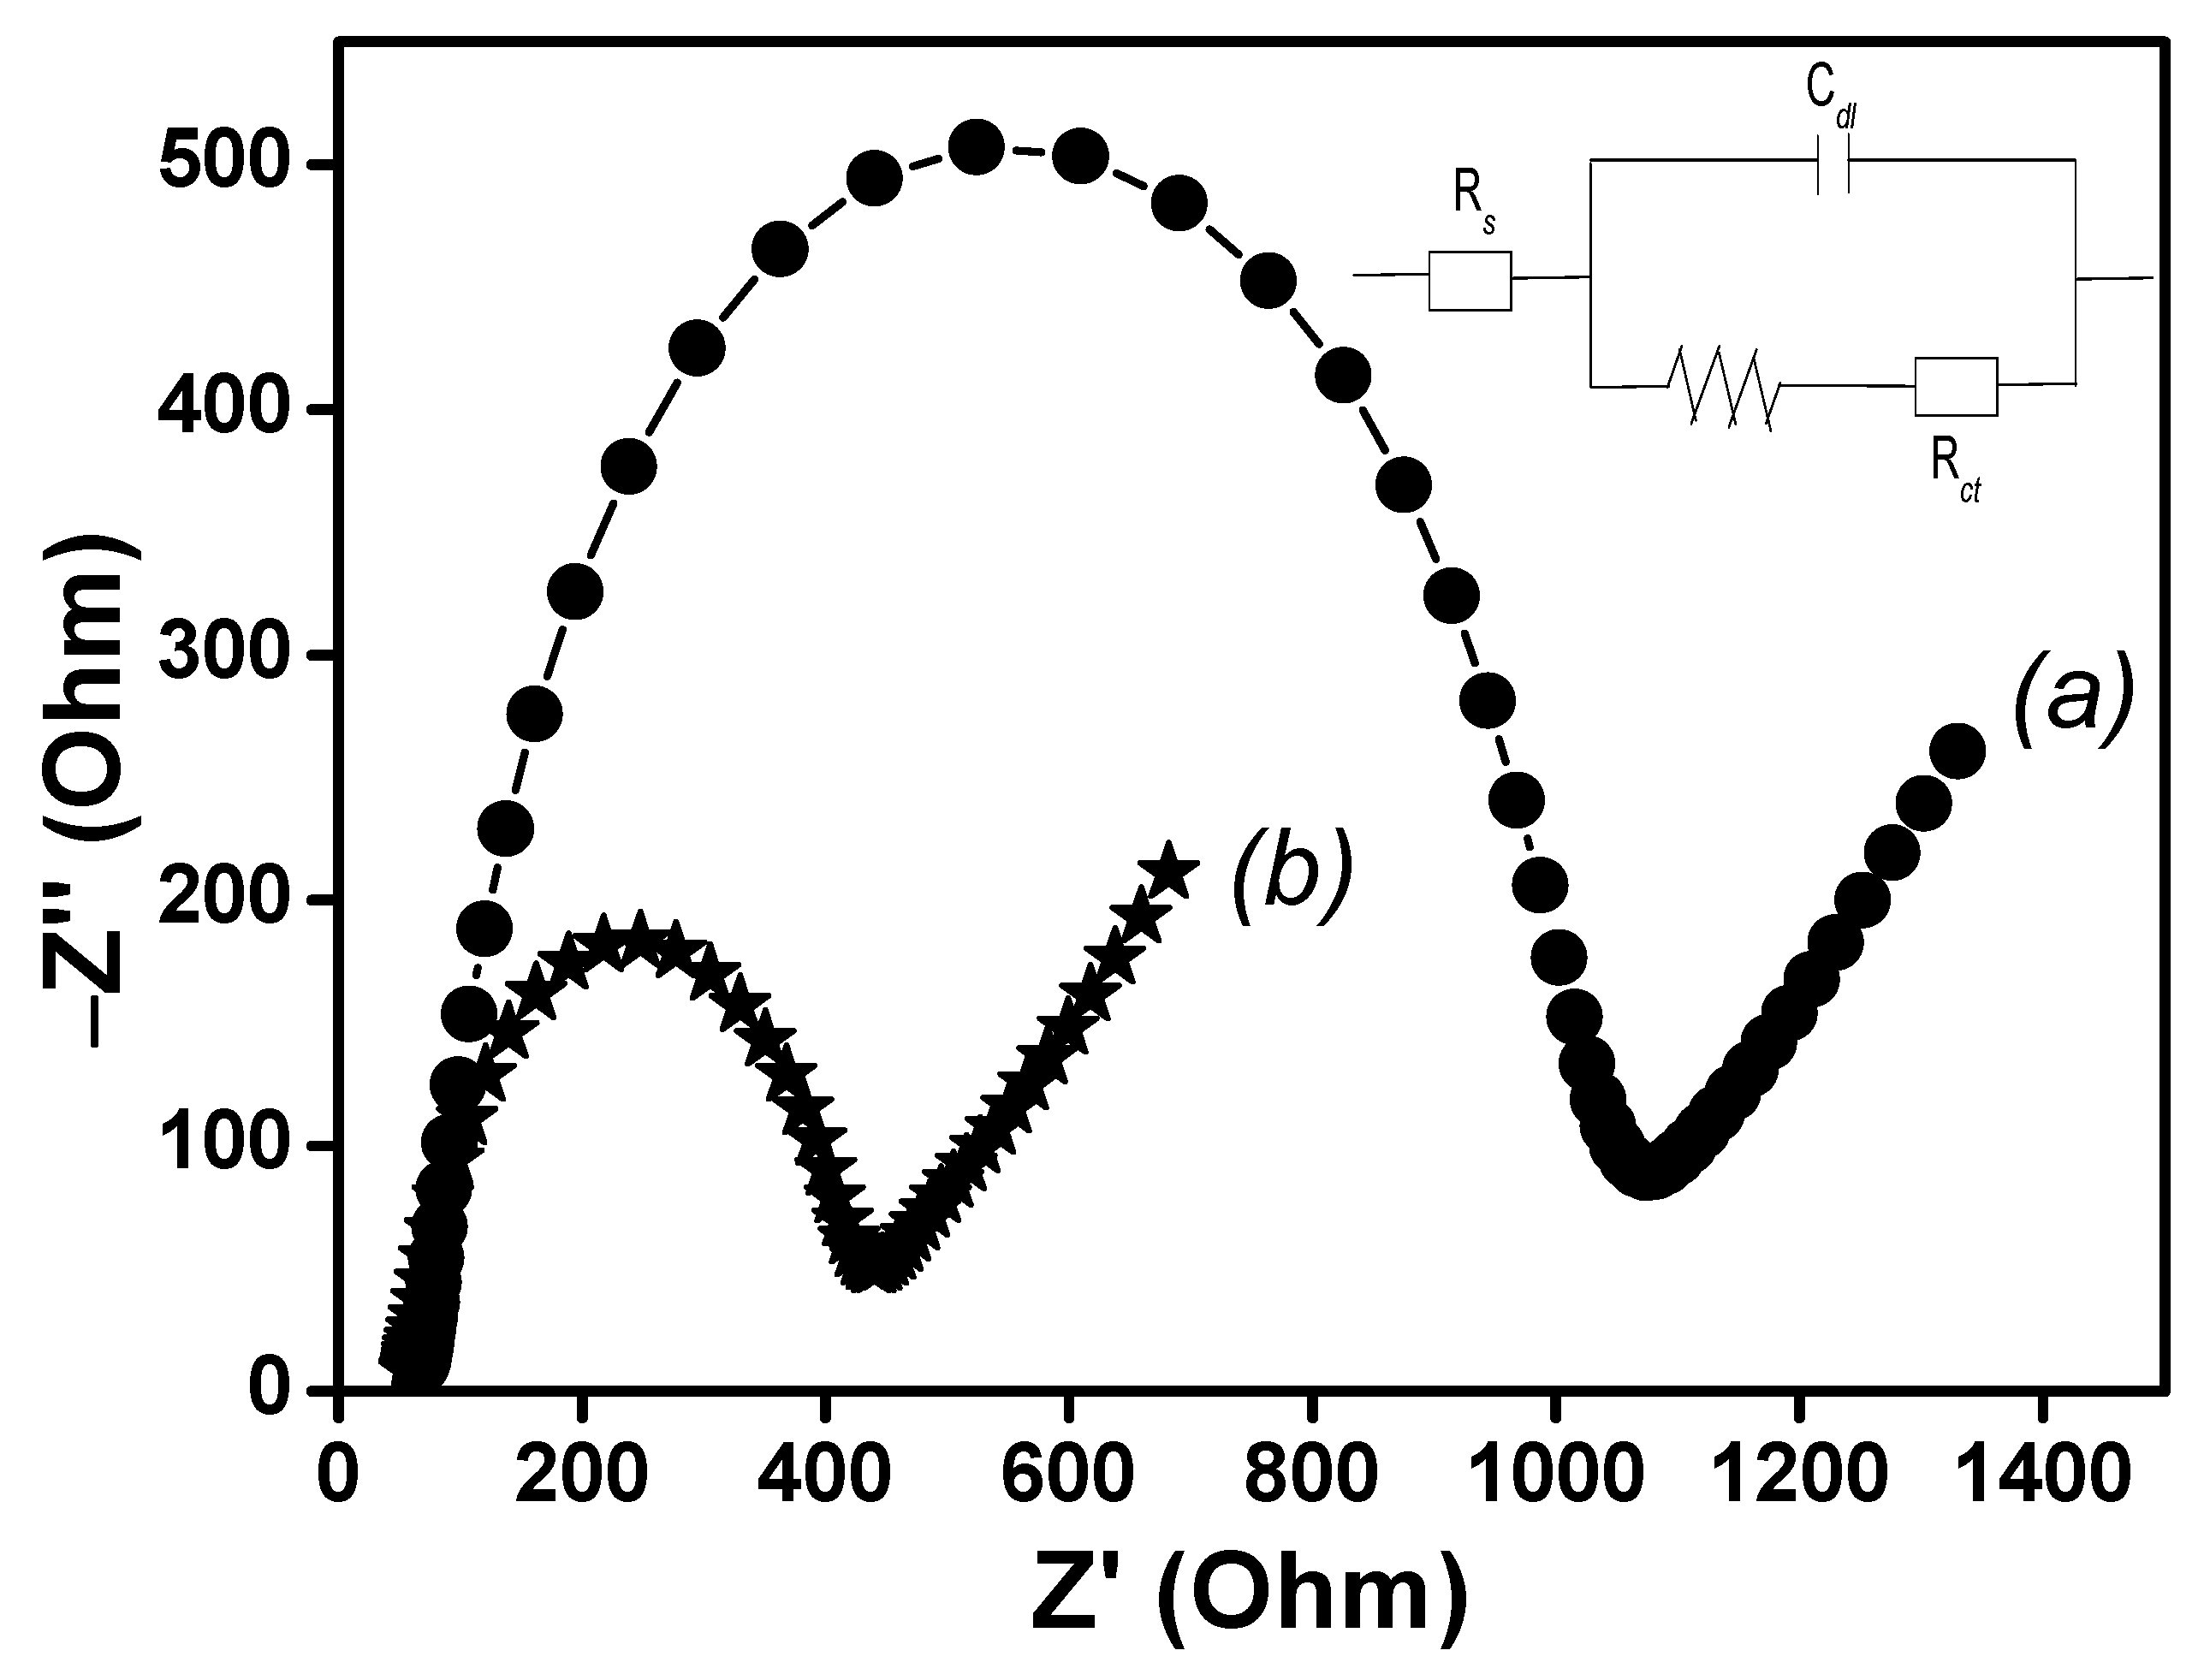
The electrochemical properties of both the unmodified and SPE-A-polyNiTSPc electrodes were investigated using electrochemical impedance spectroscopy (EIS) in the presence of 5 mM [Fe(CN)6]3−/4− in 0.1 M KCl. EIS is an accurate tool that allows us to study charge transfer rates on the electrochemical sensors. The obtained Nyquist diagrams are shown in Figure 4.
One can observe in Figure 4 two semi circles with different diameters, representing the charge transfer resistances at the electrode/electrolyte interface. The charge transfer resistances (Rct) were obtained to be 1050 Ω and 400 Ω for unmodified SPE and SPE-A-polyNiTSPc, respectively. Comparing the two Rct values, it is clear that the SPE-A-polyNiTSPc (Rct = 400 Ω) is more conductive than the unmodified SPE (Rct = 1050 Ω). The more the charge transfer resistance decreases (Rct), the faster the electron transfer rate for the [Fe(CN)6]3−/4− redox system [41,49]. These results confirm those obtained with both EDX and AFM characterizations, which show the chemical and morphological changes observed on SPE-A-polyNiTSPc in comparison to the unmodified SPE. Moreover, the CV recorded in 5 mM of [Fe(CN)6]3−/4− solution using the tested electrodes [41] shows a significant reduction in ΔEpeak (separation between anodic and cathodic peak) from 150 mV to 100 mV for unmodified SPE and SPE-A-polyNiTSPc, respectively, confirming the great role of poly-NiTSPc film on the electrocatalytic behavior of the modified sensor. The obtained results helped to calculate the real surface area of SPEs using the Randles–Sevcik formula:
Ip = (2.69 × 10⁵)n3/2AD1/2CV1/2
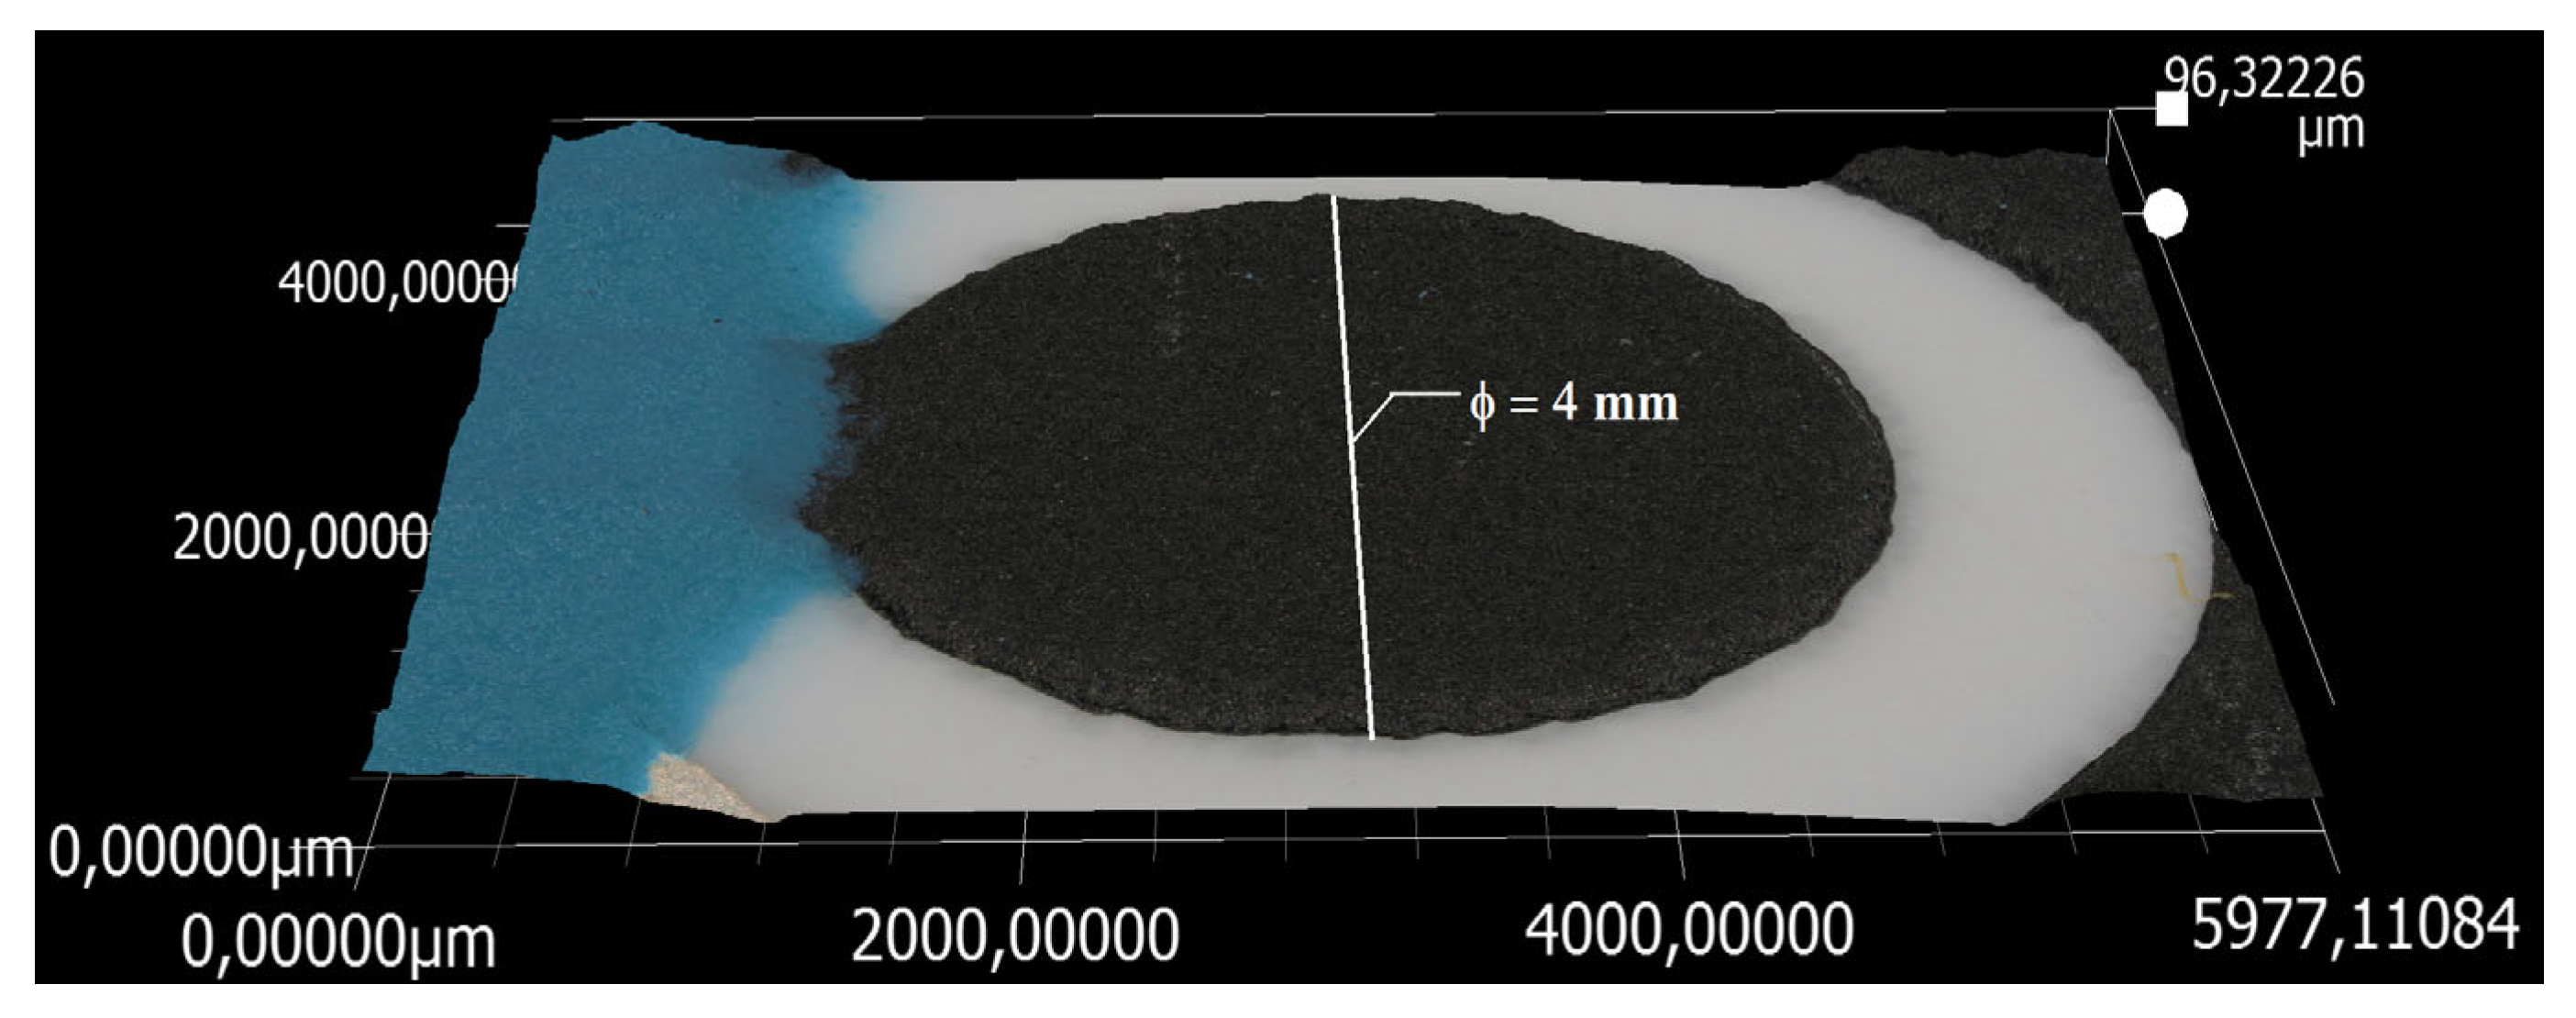
where n (=2) is the number of electrons exchanged, A (cm2) is the active area of the electrode, D (=0.62 × 10⁻⁵ cm2s−1) is the diffusion coefficient, C (=0.005 molL−1) is the concentration of [Fe(CN)6]3−/4−, and V (=100 mVs−1) is the scan rate [50]. The geometric area of the two tested electrodes was calculated to be 0.126 cm2 using the formula S = πr2 with a diameter of (Φ) = 4 mm, represented in Figure 5.
All the results obtained in this section are presented in Table 3.
We can observe in Table 3 that both electrodes have the same geometric surface, which was calculated to be 0.126 cm2. The real surface area of the SPE-A-polyNiTSPc (0.186 cm2) is greater than that of the unmodified SPE (0.128 cm2). This result can be explained by the activation process and the electrodeposition of polyNiTSPc film on the modified SPE-A-polyNiTSPc. The contact angle measurement shows a value of 111° and 60 ° for unmodified SPE and SPE-A-polyNiTSPc, respectively. This result indicates that the unmodified electrode has a hydrophobic character, while SPE-A-polyNiTSPc has a hydrophilic character due to the presence of polyNiTSPc film. These results clearly demonstrate that the combination of both activation and electrodeposition of poly-NiTSPc film increases the roughness of the electrode surface by decreasing the contact angles, leading to an increase in the sensitivity of the SPE-A-polyNiTSPc.

3.6. Electrochemical Behavior of BPA on Unmodified SPE and SPE-A-polyNiTSPc

The electrochemical behavior of 10 mgL−1 BPA on different tested electrodes was studied by linear sweep voltammetry in 0.1 M PBS at a pH of 7.4. Figure 6 presents the CV of BPA 10 mgL−1 in 0.1 M PBS (pH 7.4) on the unmodified SPE and SPE-A-polyNiTSPc.
From Figure 6, the voltammogram obtained on SPE-A-polyNiTSPc is more pronounced than that obtained on the unmodified SPE in terms of peak intensity and sharpness. The oxidation peaks observed at 0.34 and 0.30 V/Ag on SPE and SPE-A-polyNiTSPc, respectively, are associated with an irreversible process corresponding to the oxidation of BPA, as shown in Scheme 1.
The difference in oxidation peak potentials (ΔEp), estimated to be 0.04 V for both SPE and SPE-A-polyNiTSPc, indicates the electrocatalytic activity of poly-NiTSPc film towards the BPA molecule.

3.7. Calibration Curves and Detection Limits of BPA on the Elaborated SPEs in DPV

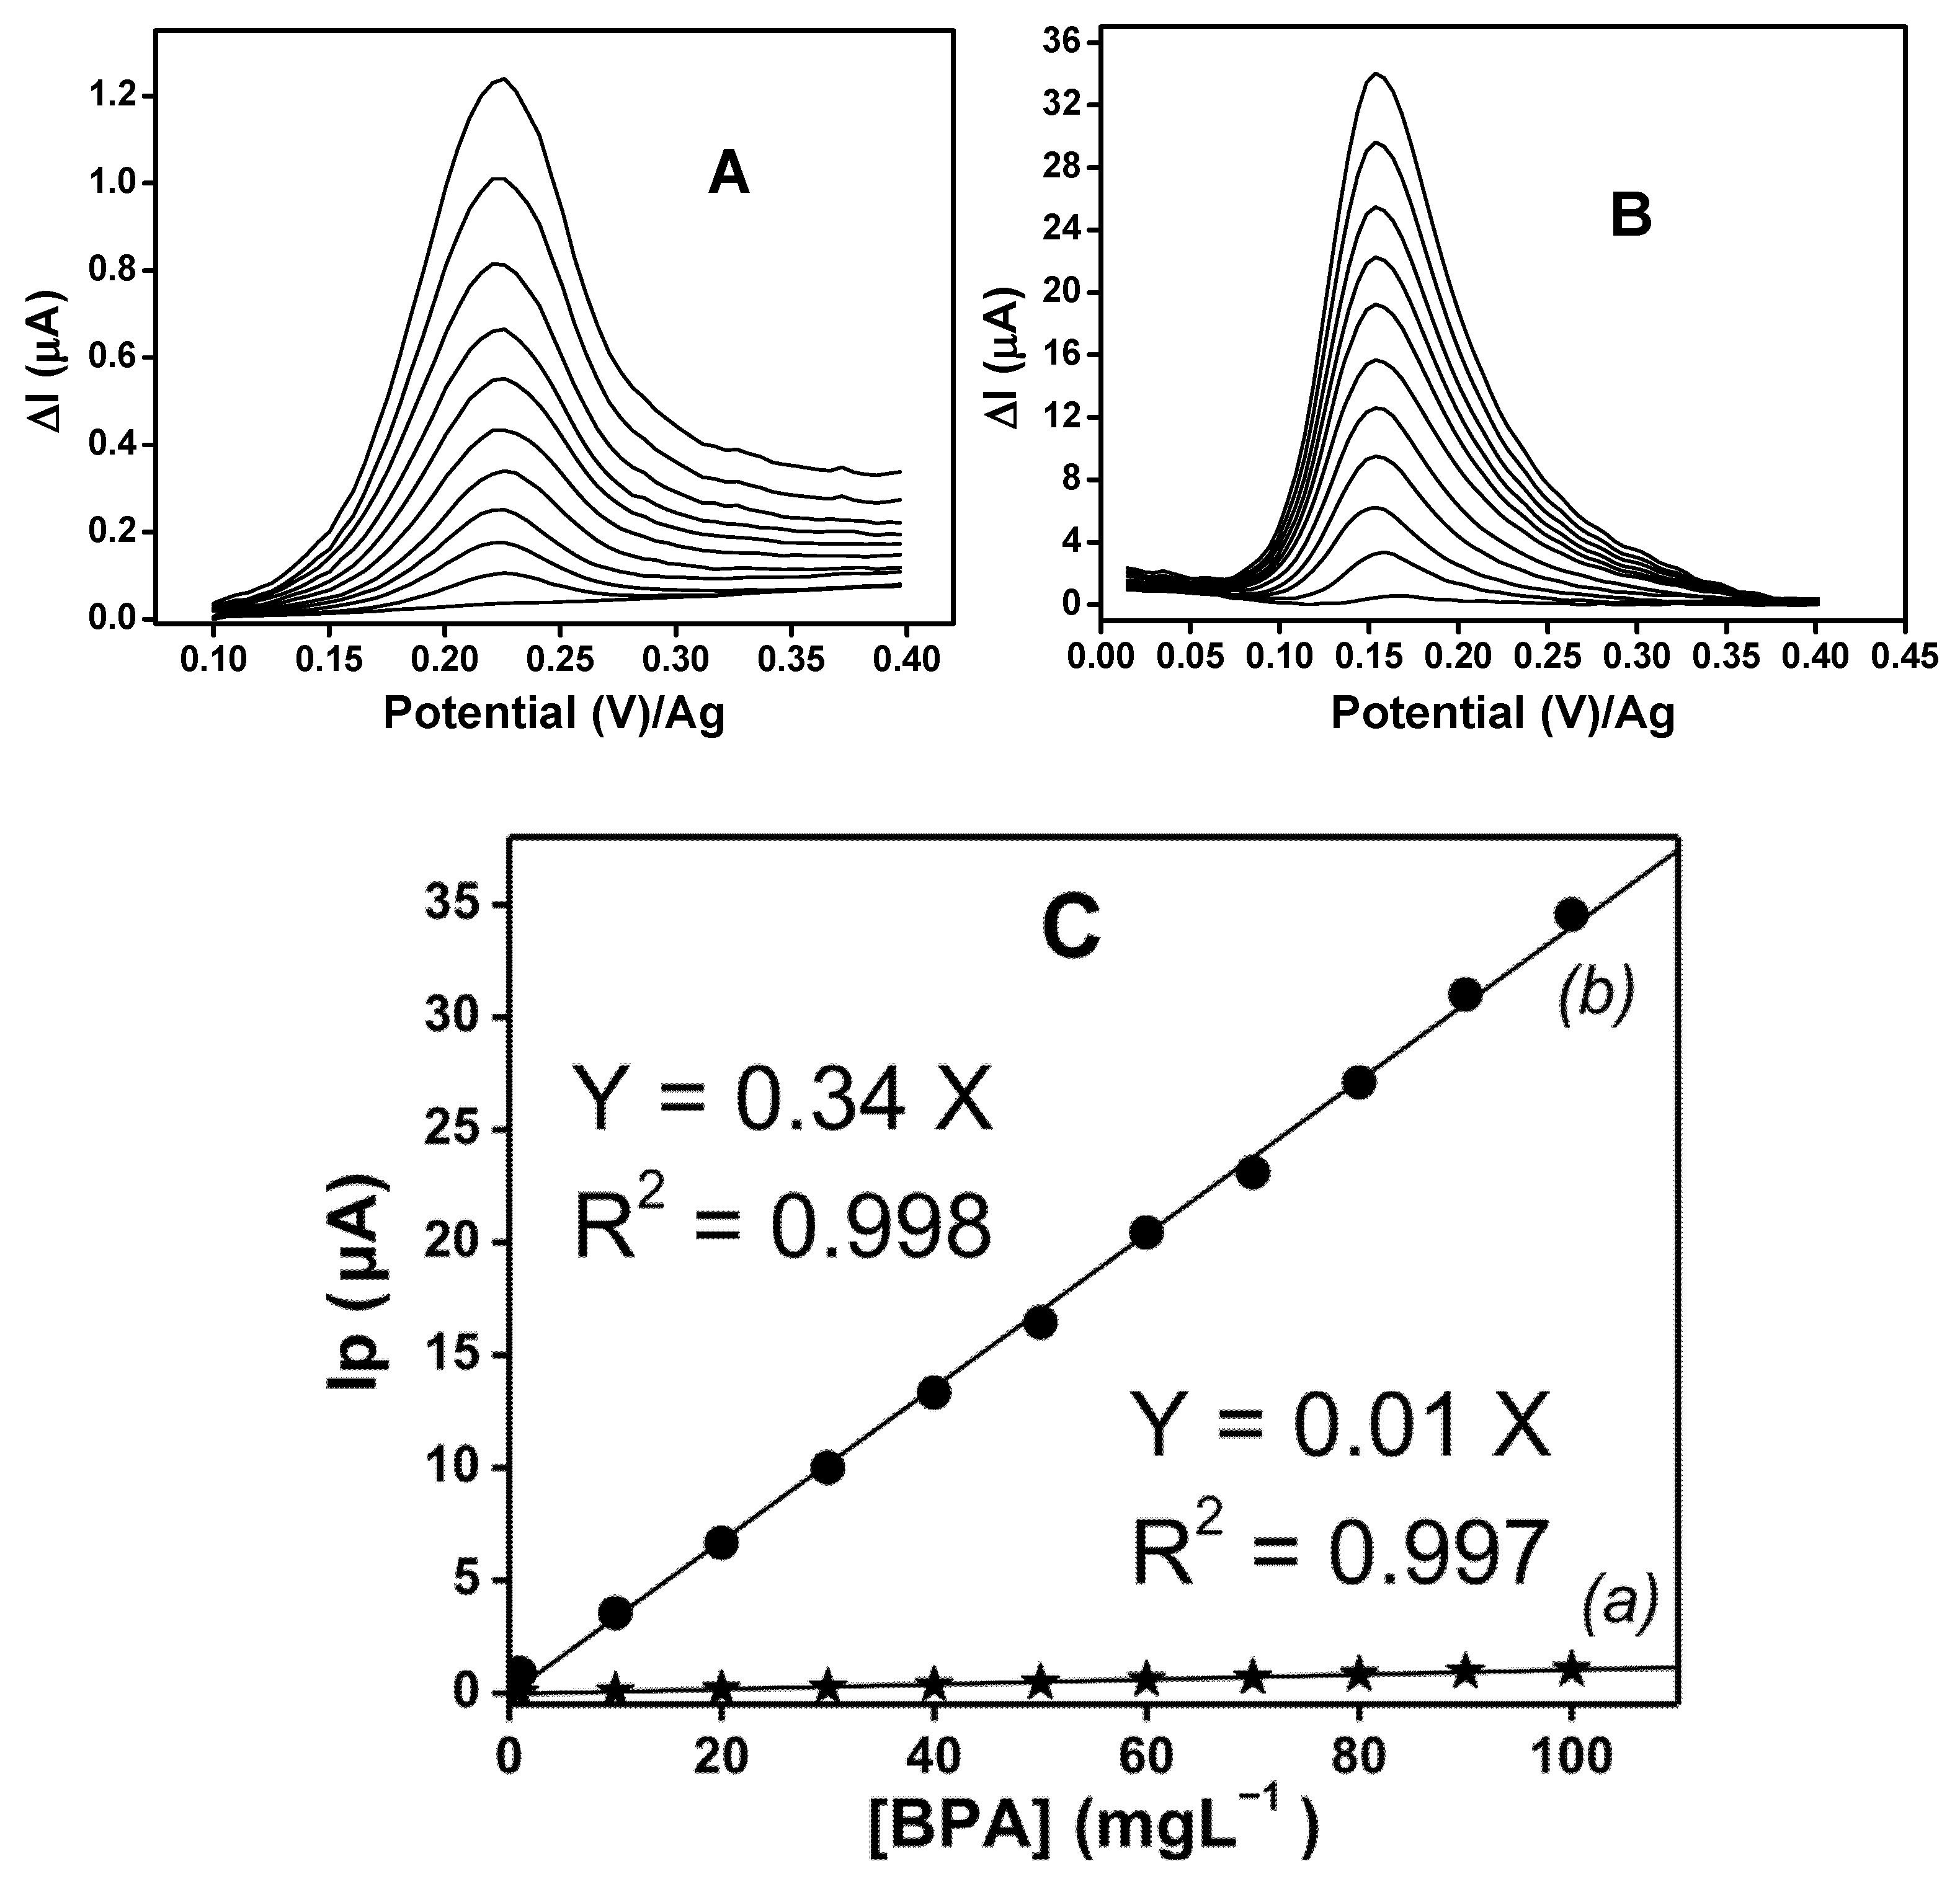
DPV was performed to investigate the effect of BPA concentration on the tested electrodes. For this purpose, BPA concentrations were consecutively increasing in the detection medium. Figure 7 shows that the intensity of the oxidation peak current increases linearly with the concentration of the BPA from 0 to 100 mgL−1, expressed by the regression equations Ip(a) (A) = 0.01[BPA] and Ip(b) (A) = 0.34[BPA] for unmodified SPE and SPE-A-polyNiTSPc, respectively. Correlation coefficients of 0.997 and 0.998 were obtained for two lines, indicating a strong linearity between the peak current and the concentration of BPA.
Based on a signal-to-noise ratio of 3, the detection limits of BPA, defined by the relation 3 Sb/m (where Sb represents the standard deviation on the y-axis and m represents the slope of the calibration line), were found to be 0.5 mgL−1 and 0.001 mgL−1 for unmodified SPE and SPE-A-polyNiTSPc, respectively.

3.8. Reproducibility, Stability, Interference Study, and Application of SPE-A-polyNiTSPc for BPA Determination in Leachate Sample and RO Permeate in Crete

The reproducibility and stability of the signal on the proposed SPE-A-polyNiTSPc were obtained over two weeks. The effect of some interfering species such as glucose, ascorbic acid, acetaminophen, 4-aminophenol, and hydroquinone was investigated in order to evaluate the selectivity of SPE-A-polyNiTSPc on the electrochemical determination of BPA. The obtained results showed that the variation in the oxidation BPA peak current in the presence and absence of the tested compounds did not reach up to 3%, indicating a negligible influencing effect of those compounds on the BPA signal.
The first applicability of the proposed sensor was its use for a quantitative determination of BPA in four leachate samples collected at the Pera Galini site in Crete. The analyzed samples were constituted of a raw leachate solution and a residual solution obtained after reverse osmosis treatment. Using the DPV technique, the standard addition method was carried out on all the analyzed samples, and Figure 8 shows the results obtained on the raw leachate solution.
Figure 8A corresponds to the DPV recorded on the raw leachate sample at different concentrations of BPA standard added, while Figure 8B represents the linear relationship obtained between the peak intensities and the BPA concentrations. The obtained regression equations are given in Table 4. The unknown concentrations of BPA in the analyzed samples were determined by projecting the line on the x-axis as seen in Figure 8B. The same samples were also analyzed by an accredited laboratory (LC/MS method) to validate the proposed electrochemical approach. All the obtained results of this section are summarized in Table 4.
From Table 4, BPA concentrations were determined in the raw leachate to be 29,579 µgL−1 and 29,700 µgL−1 using LC/MS and SPE-A-polyNiTSPc, respectively. For the effluent after RO, SPE-A-polyNiTSPc helped us to find a BPA concentration of 6.4 µgL−1, while the accredited lab provided a value of 6.0 µgL−1. The obtained values of BPA in both samples by the two different techniques were very close, indicating that both electrochemical and chromatographic methods are complementary for BPA analysis. The LC/MS technique (accredited lab) helped as a reference approach for the validation of our SPE-A-polyNiTSPc. The fact that the obtained concentration of BPA using SPE-A-polyNiTSPc is closer to those found by the accredited lab (LC/MS) indicates that the proposed SPE-A-polyNiTSPc is efficient and reliable for BPA determination in leachate samples and RO permeate.

3.9. Application of poly-NiTSPc/activated SPE for BPA Biodegradation Study in MFCs

3.9.1. IC50 of T. harzianum in Presence of BPA and Inhibition Tests

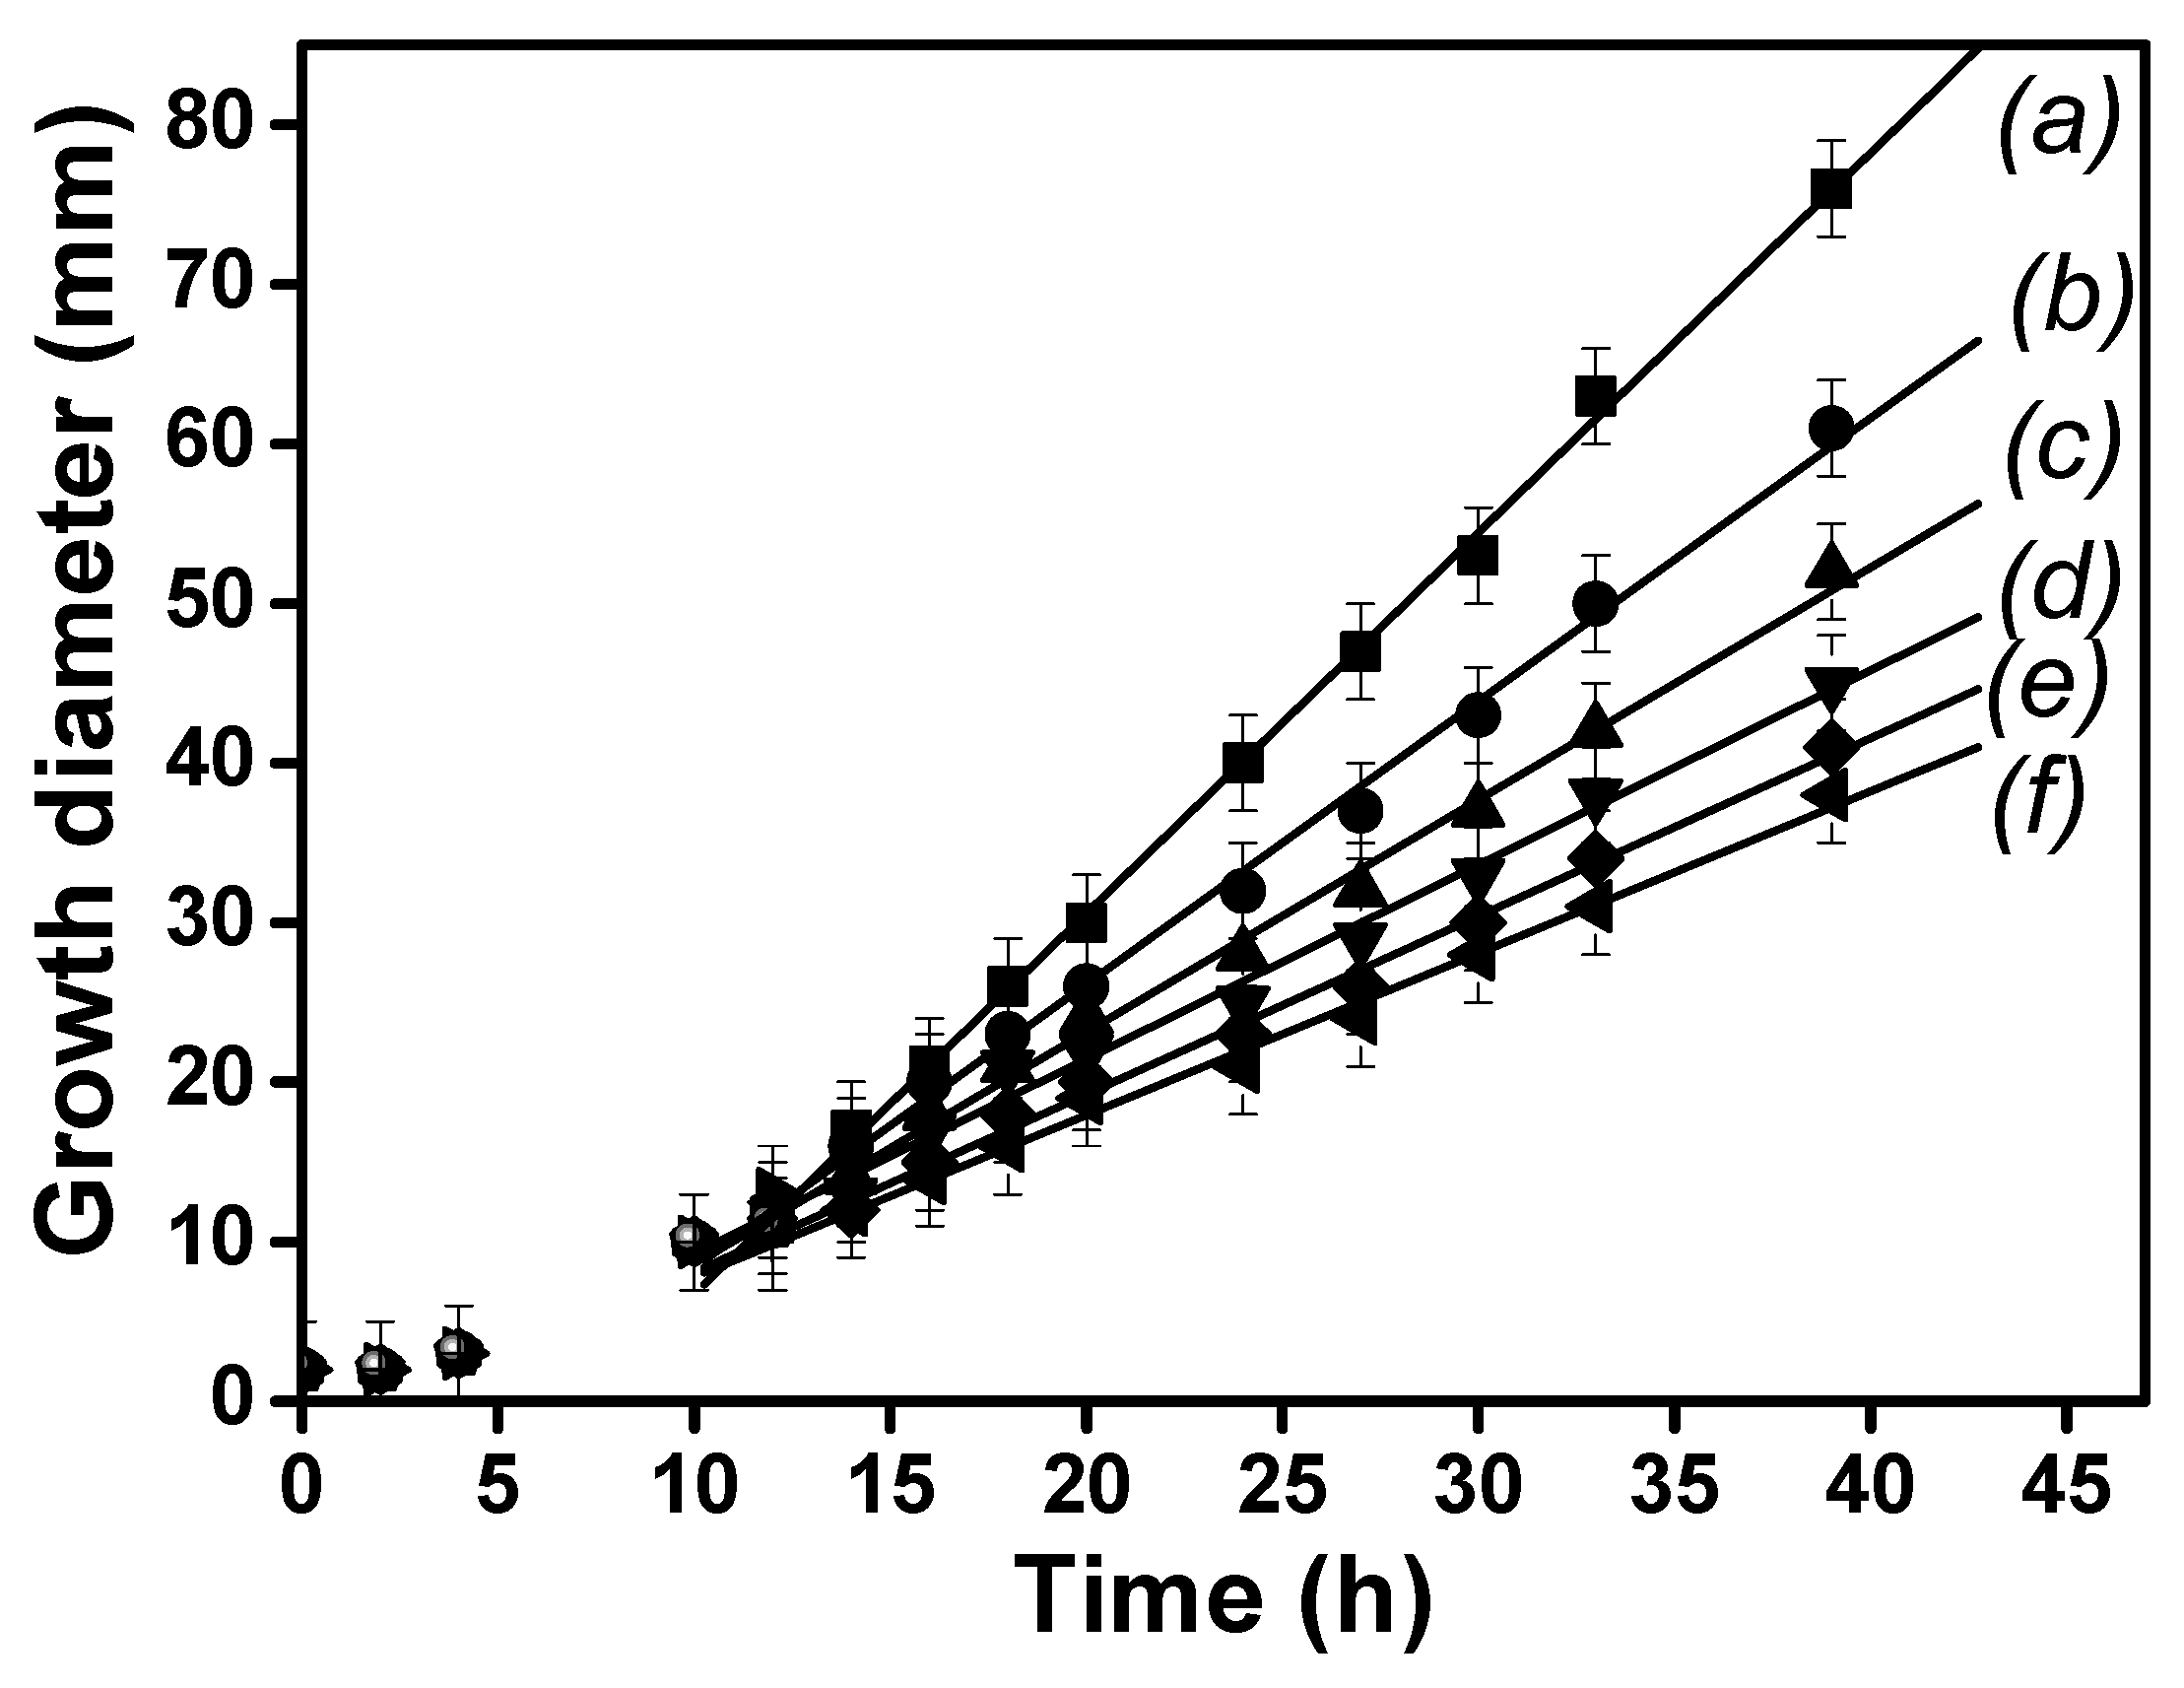
IC50 is the concentration of the pollutant necessary to inhibit 50% of the fungus growth. It is a key experimental parameter that needs to be known before choosing the appropriate concentration of BPA for MFC experiments. The objective of this section is to understand the inhibition effect of BPA concentration on T. harzianum growth, which was studied on PGA plates with BPA 29, 50, 100, 250, and 500 mgL−1. Figure 9 shows the growth of T. harzianum at different concentrations of BPA.
From Figure 9, one can observe two distinct phases: a latency (0–12 h) and an exponential phase (above 12 h). The latency phase indicates a slow growth of the fungus while the exponential phase expresses a rapid growth of the fungus. Linear relationships were obtained by plotting the calibration curves with corresponding data for each concentration of the exponential phase. The obtained regression equations were Ya = 2.321X; Yb = 1.751X; Yc = 1.429X; Yd = 1.215X; Ye = 1.081X; and Yf = 0.981X. The obtained slopes were used to calculate the inhibition percentage of T. harzianum fungus at different concentrations of BPA using Formula (4), and the summary of the obtained results is given in Table 5.
I n h i b i t i o n % = S l o p e c o n t r o l S l o p e   C i S l o p e c o n t r o l × 100
Table 5 presents the slope and inhibition percentage at different BPA concentrations.
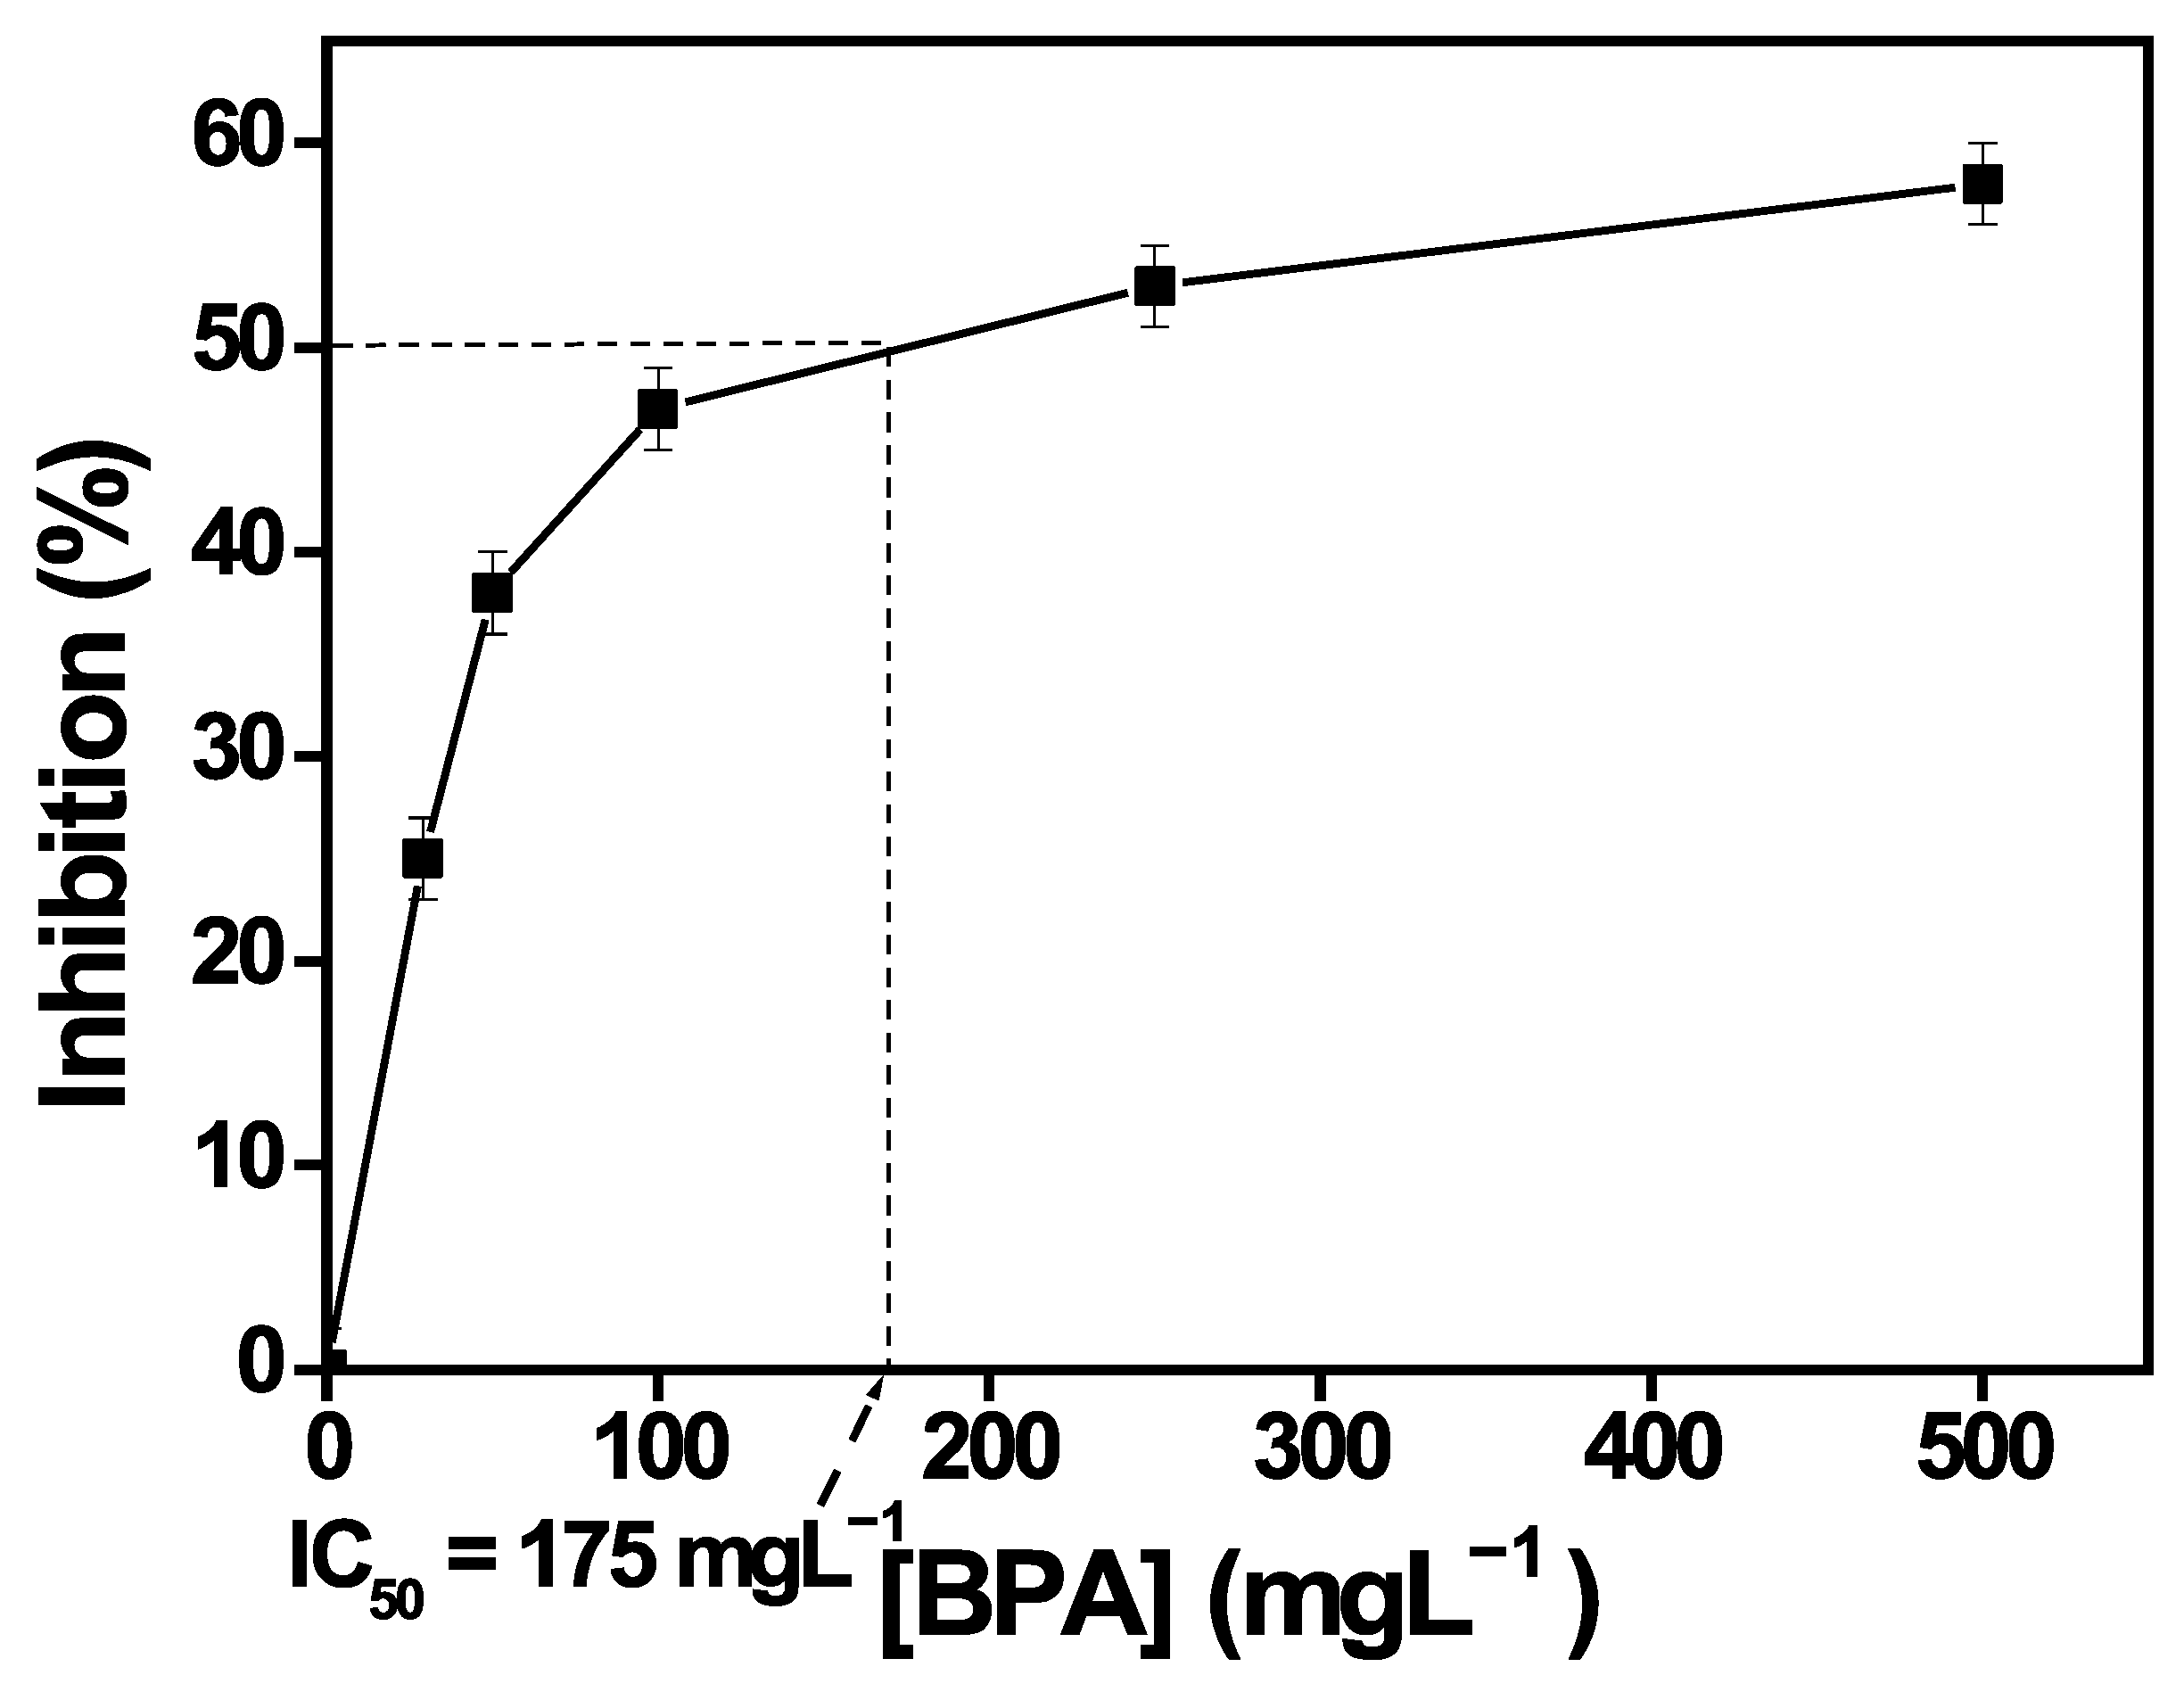
Figure 10 shows the percentage of inhibition versus BPA concentrations.
It can be seen in Figure 10 that the inhibition percentage of T. harzianum fungus increases with the increase in BPA concentration (29–500 mgL−1). IC50, which is the concentration of BPA necessary to inhibit 50% of the fungus growth, was graphically obtained by projecting the 50 coordinate on the curve, and the corresponding abscissa to the intercept point represents the IC50. For T. harzianum fungus, the IC50 was obtained to be 175 mgL−1. This study finds its application in the wastewater treatment of landfill leachates. Thus, the same experiments were carried out on PGA plates in the presence of standard BPA at 29 mgL−1 in PBS and the leachate solution.
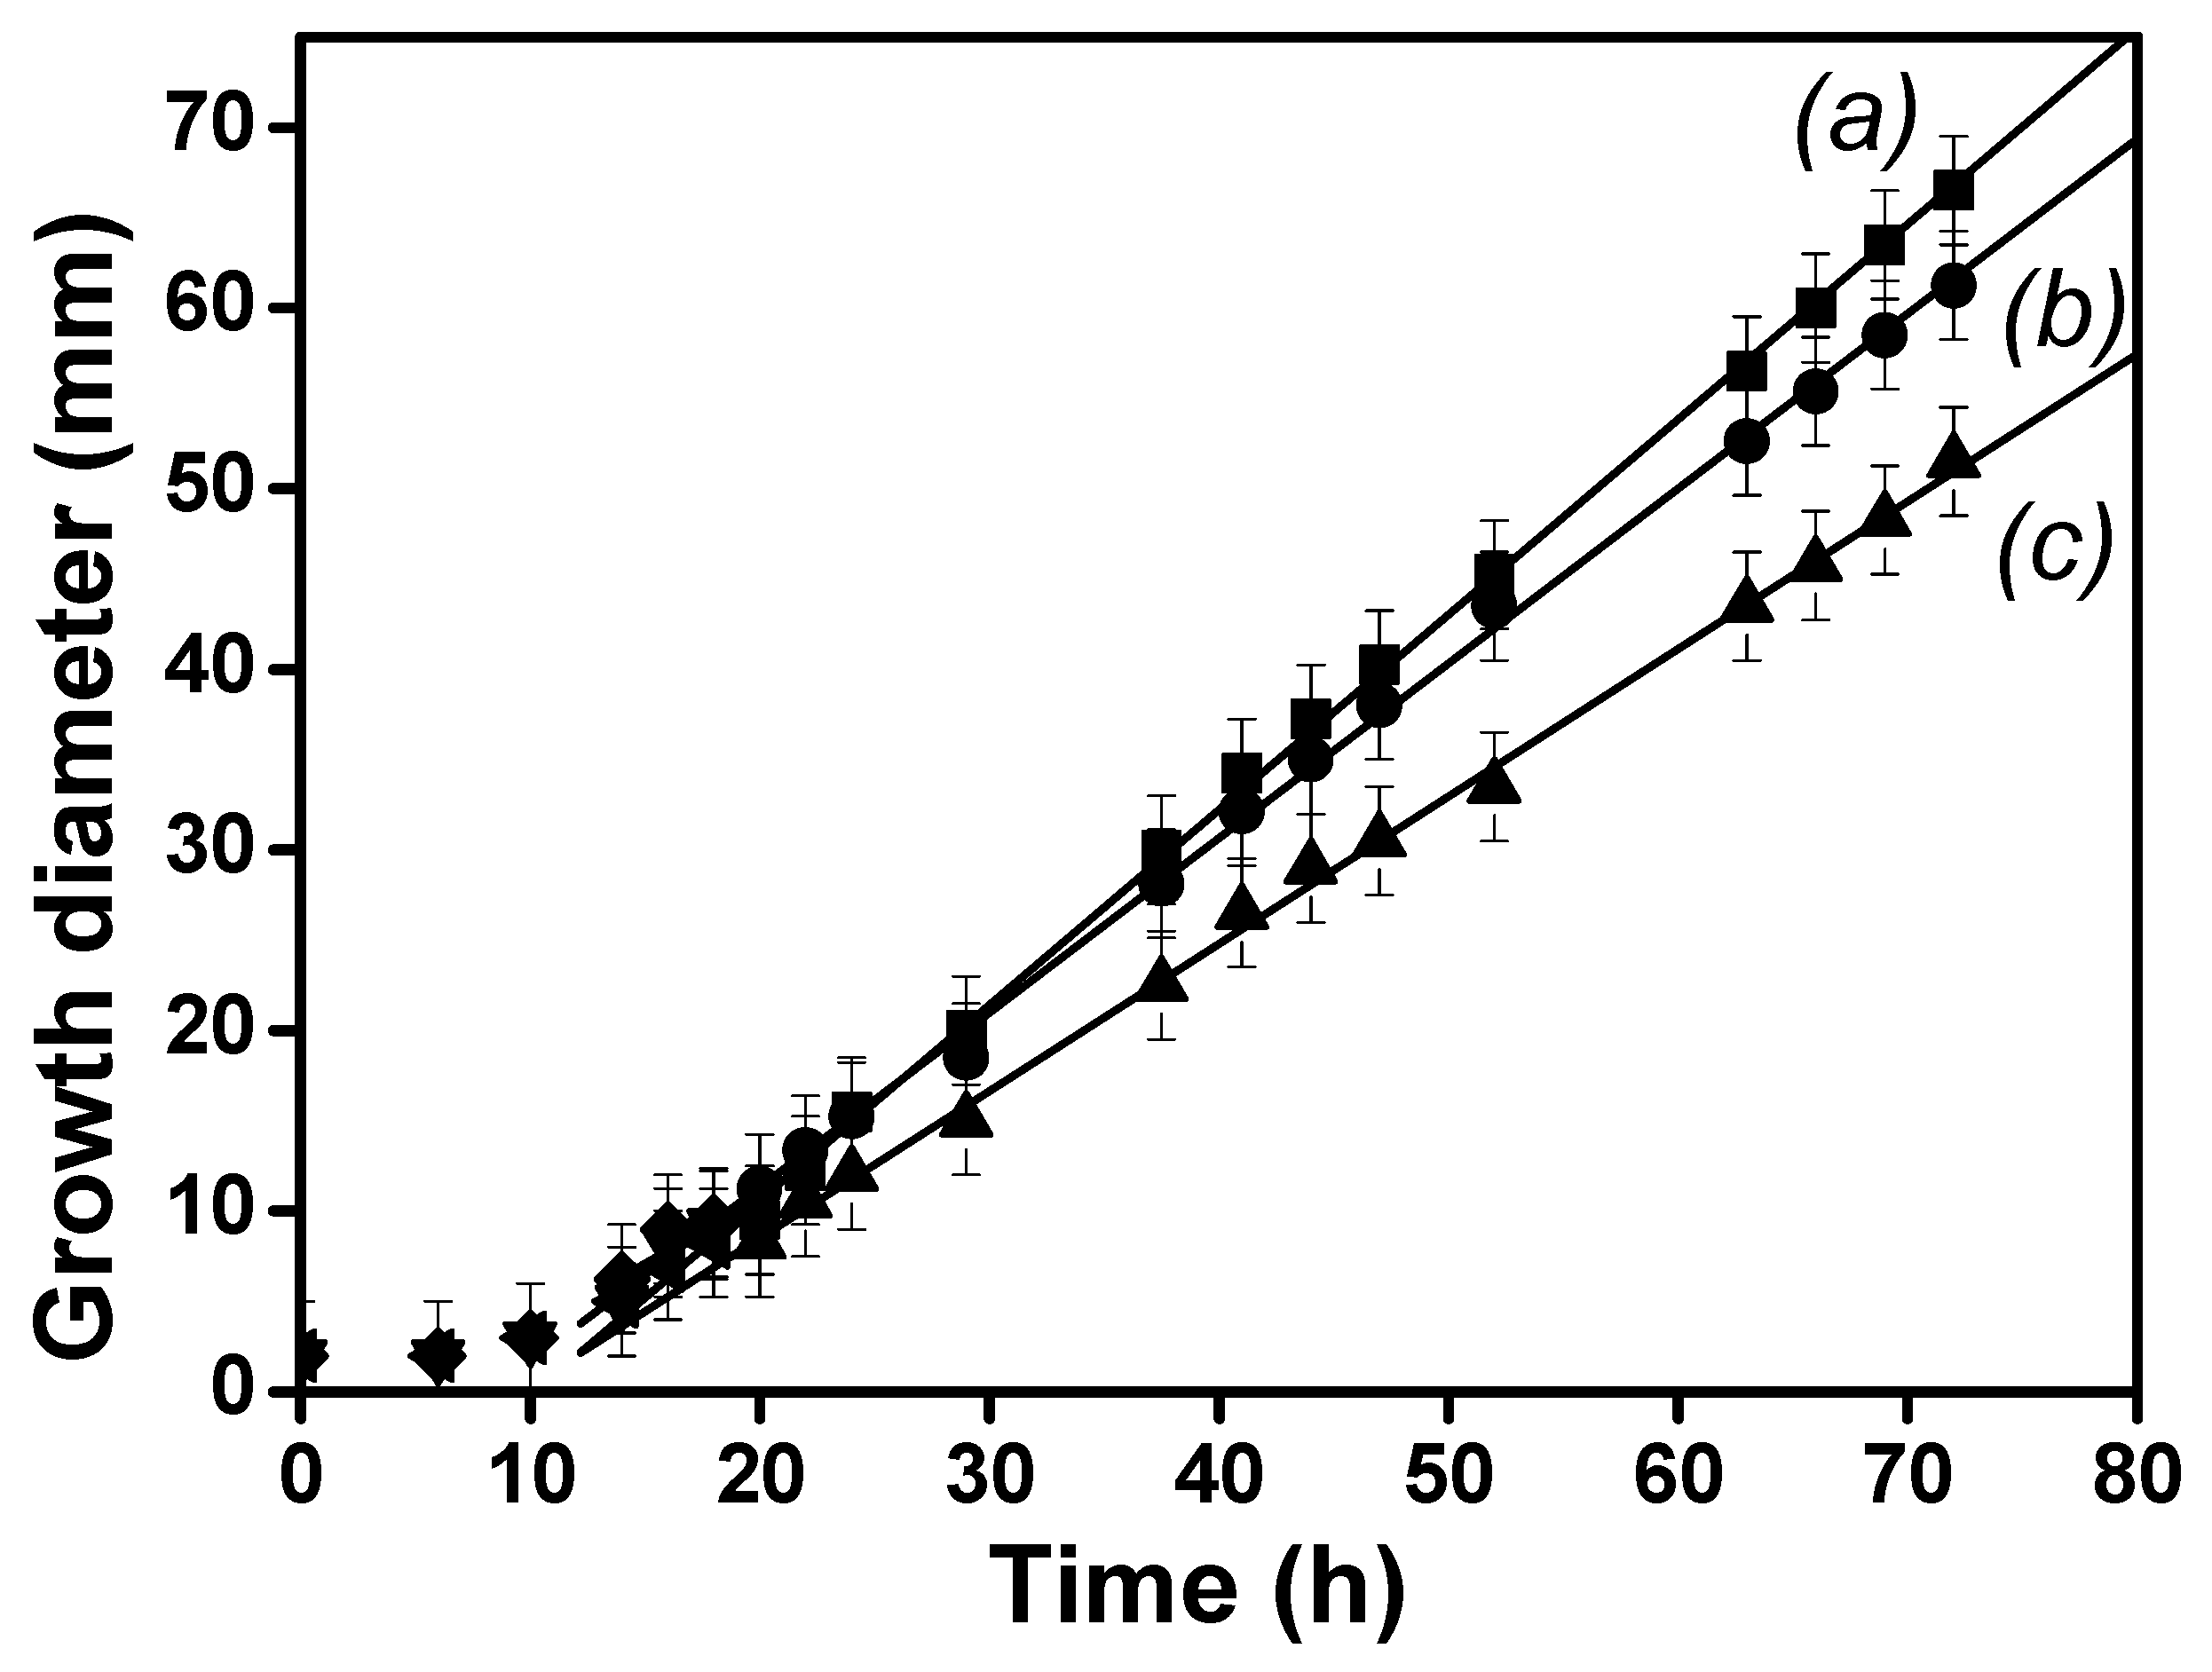
The inhibition effect of BPA on the T. harzianum growth was studied on PGA plates in the presence of BPA 29 mgL−1 in phosphate buffer (0.1 M, pH 7.4) and in leachate wastewater (0.25 M, pH 7.9) solution. Figure 11 shows the growth of T. harzianum in different matrices containing BPA 29 mgL−1.
From Figure 11, one can observe two distinct phases: a latency (0–20 h) and an exponential phase (above 20 h). Calibration curves were plotted with data from the exponential phase, and the obtained regression equations were Ya = 1.081X, Yb = 0.967X, and Yc = 0.815X for the control, PBS with BPA 29 mgL−1, and landfill leachate with 29 mgL−1, respectively. The inhibition percentage of T. harzianum fungus was calculated and the obtained results are summarized in Table 6.
From Table 6, the inhibition percentage of T. harzianum in the leachate solution is 2.5 times greater than that in the PBS at the same concentration of BPA. This may be explained by the fact that BPA is the sole pollutant in the PBS while, in the leachate solution, there are other organic micropollutants molecules and also heavy metals (Table 1 and Table 2) that are slowing down the growth of the fungus. The obtained results led us to use T. harzianum fungus for the biodegradation of BPA present in the leachate solution into the anodic compartment of an MFC.

3.9.2. Morphological Characterization of the Bioanode

The bioanode elaboration was carried out by immersing the carbon cloth into a fungal suspension for three days. Figure 12 presents SEM images of the carbon cloth before and after the colonization by T. harzianum fungus.
Figure 12A presents the raw carbon cloth at a magnification of ×200 µm, where one can observe bobbins of fibers that constitute the carbon cloth. Figure 12B, which is at a magnification of ×9 µm, shows a fiber of the carbon cloth totally colonized by the T. harzianum filaments. This might indicate the good fixation of T. harzianum fungus on the carbon cloth. Figure 12B,C clearly reveal the presence of filaments and spores that compose T. harzianum fungus. This might be a proof of the convincing pure biofilm formation of the fungus. The obtained SEM images provide valuable visual information on fungus morphology and mycelium, including filament thickness, which was evaluated to be 4 ± 1 µm, and the spore diameter was 2 ± 0.5 µm.

3.9.3. Polarization Curves and Setup of MFC Flowing Conditions

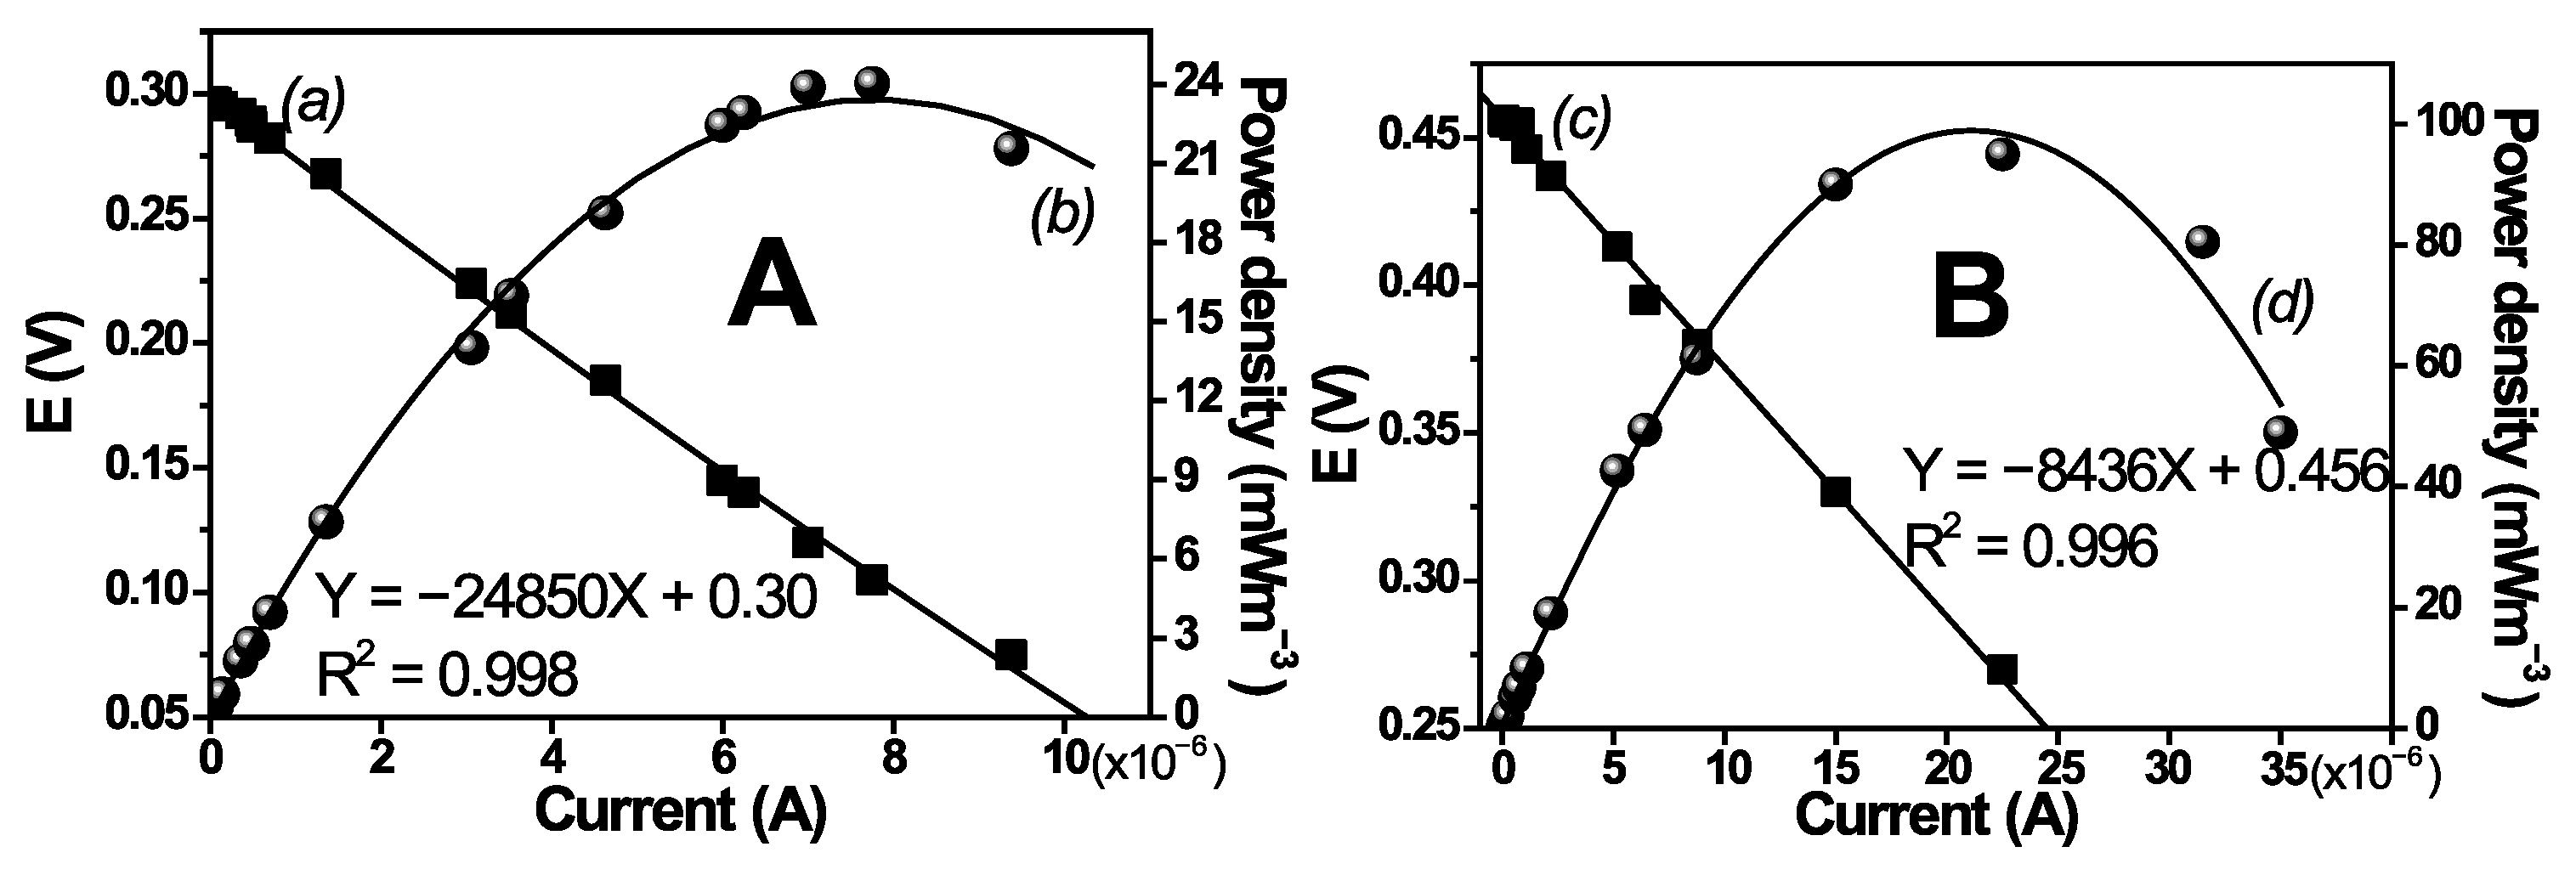
Figure 13 presents the polarization curves for BPA biodegradation in an MFC when the electrolyte is PBS (Figure 13A) versus the leachate solution as an electrolyte (Figure 13B), where a and b are the plots of FEM and power density versus current intensity, respectively.
From Figure 13, the open circuit potential (OCP), which is the value of EMF when the current intensity is 0, was found to be 300 mV and 465 mV for the MFC with PBS as the electrolyte (Figure 13A) and with leachate solution as the electrolyte (Figure 13B), respectively.
Table 7 gives a summary of results obtained in this section
As seen in Table 7, the slopes of E = f(I) at the beginning of the two experiments, which constitute the optimal resistances of the two MFCs, are 24,850 Ω and 8436 Ω for PBS and leachate solution as electrolytes, respectively. Both MFCs were then set up at each corresponding value of the optimal resistance for a better flow. The plot of P as a function of I shows a parabola according to Formula (3). The maximum powers delivered by the MFCs were observed at the maximum of parabolas to be 24 mWm−3 and 97 mWm−3 for electrolytic solutions of phosphate buffer and leachate, respectively. The maximum power density delivered by the MFC using leachate solution (97 mWm−3) is 4 times greater than that of the MFC using PBS (24 mWm−3). This result is because, in PBS, BPA is a solo carbon source, while, in leachate solution, there are other organic micropollutants as source of carbon, as previously presented in Table 1 and Table 2.

3.9.4. Biodegradation Study of BPA in the MFC1 and MFC2

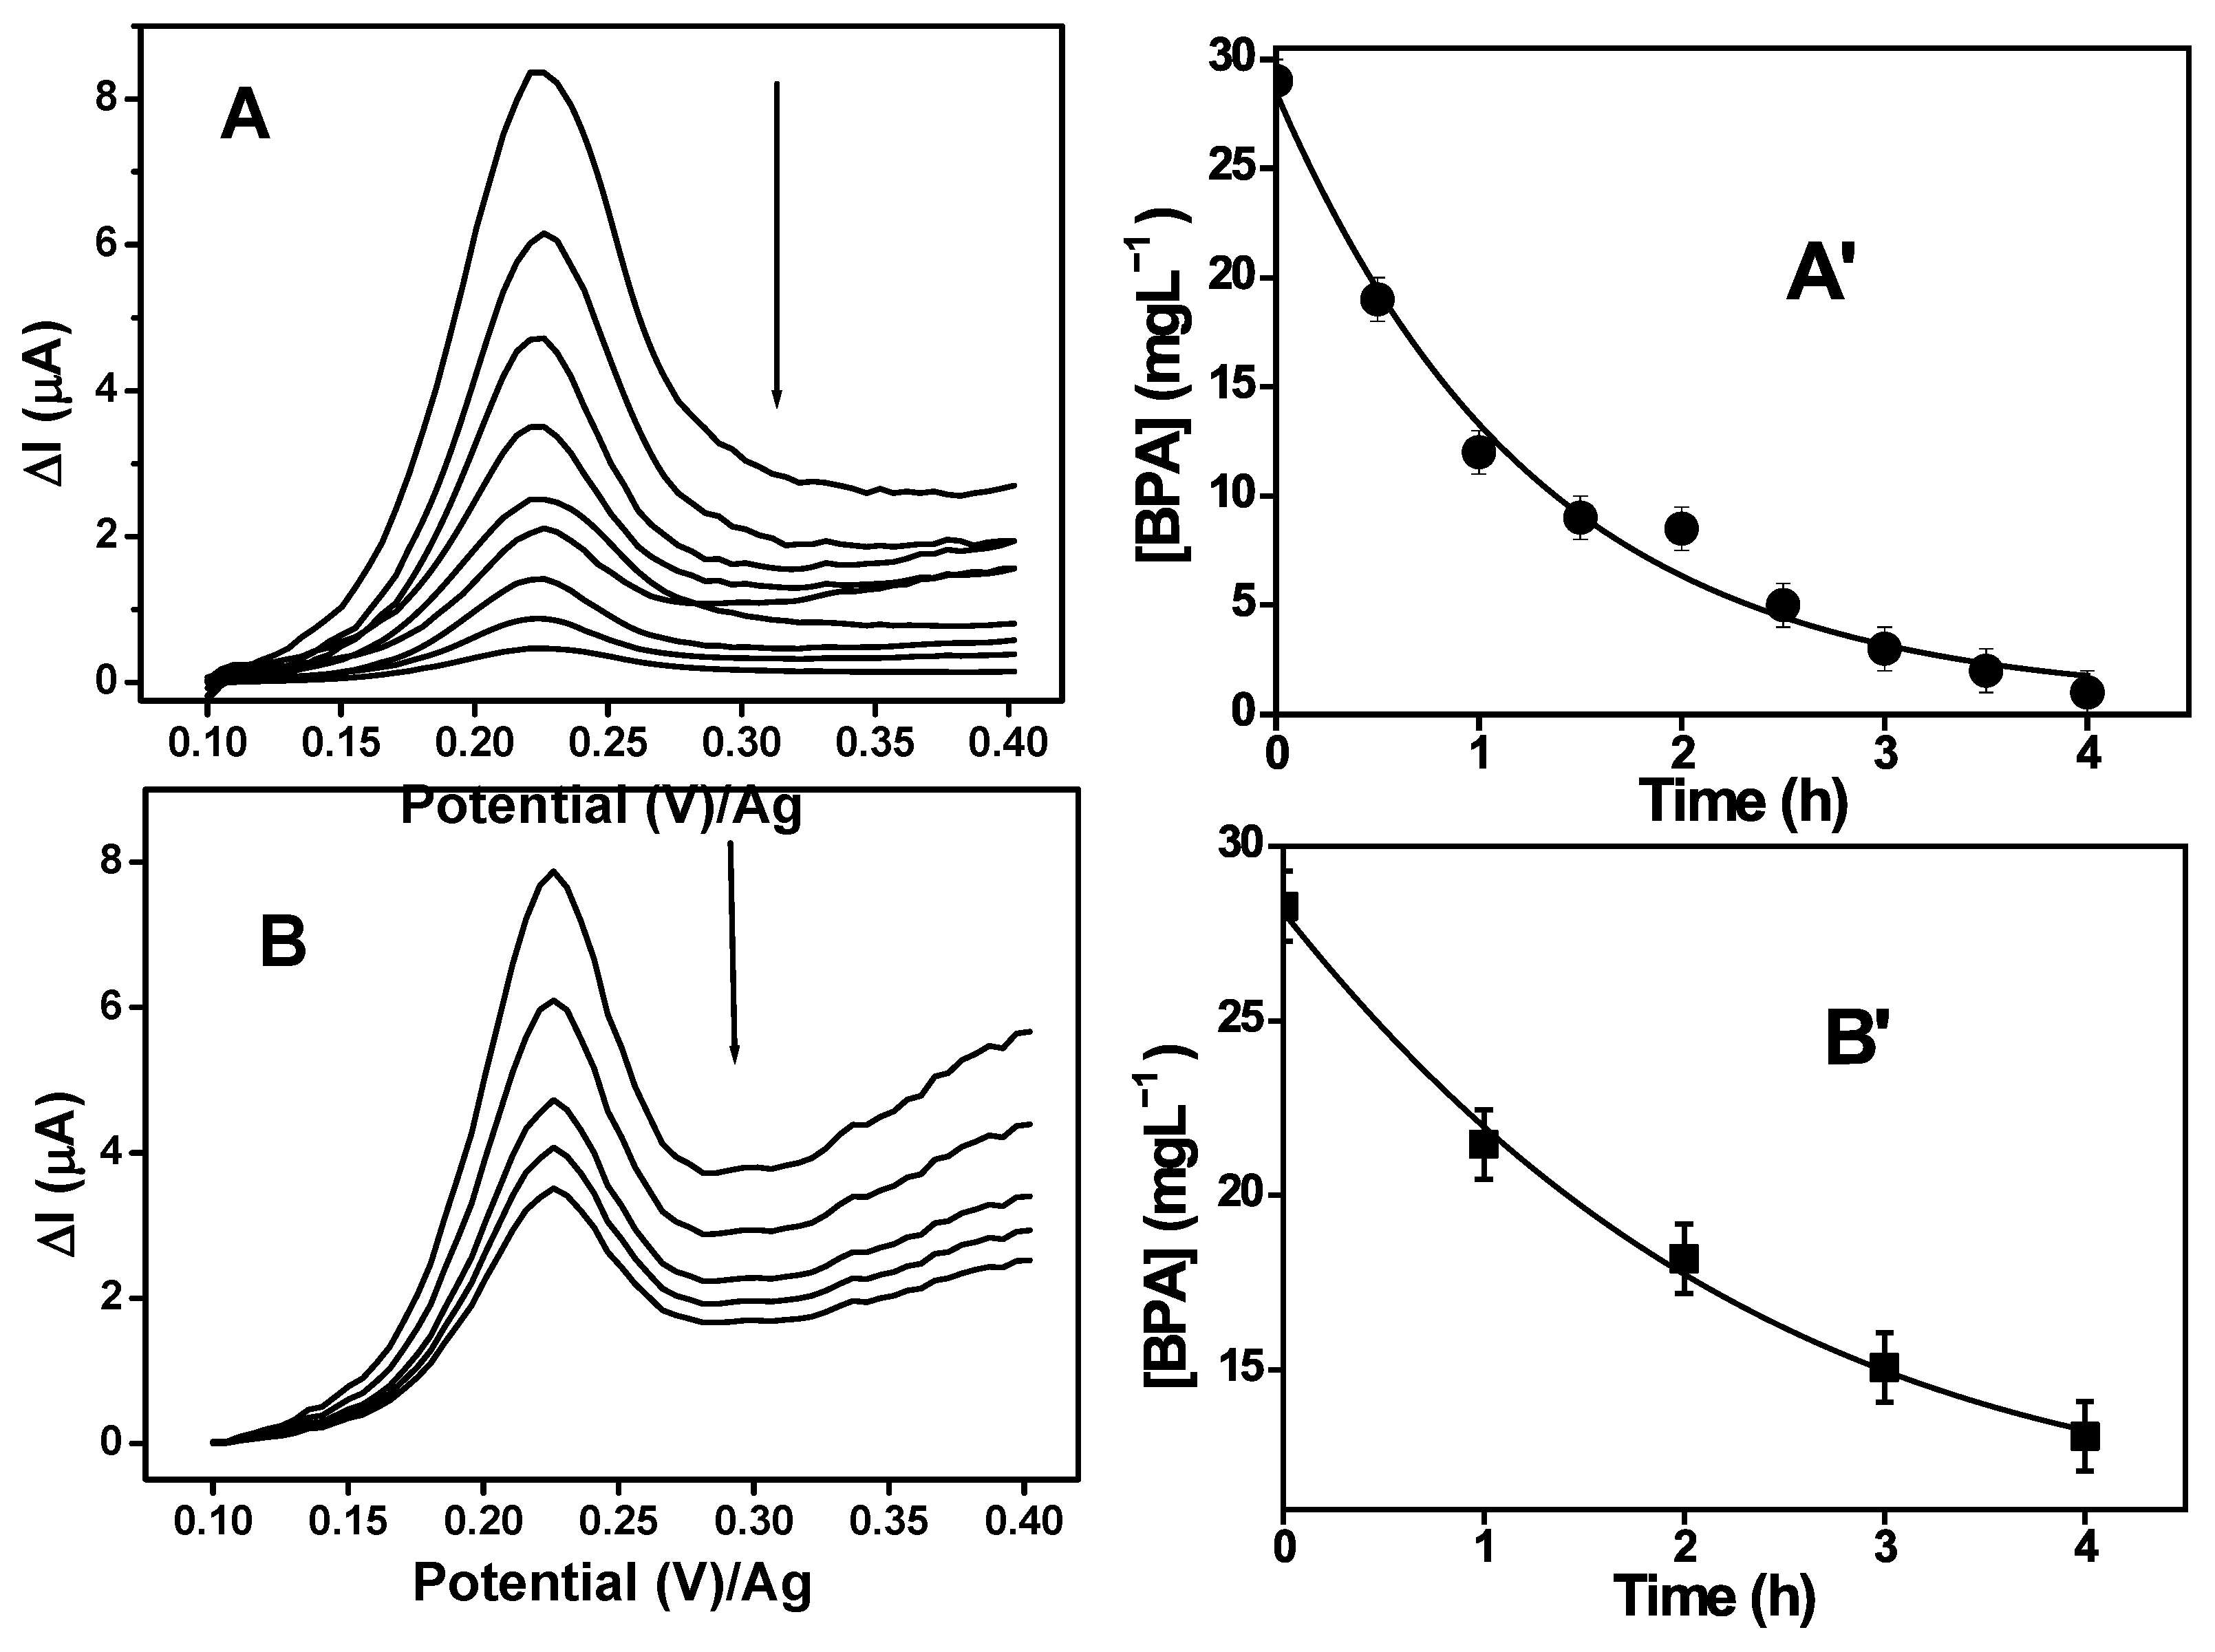
The biodegradation of BPA in the MFC by T. harzianum fungus was monitored using the proposed SPE-A-polyNiTSPc. Every 30 min, 60 µL of the analyte was taken with a micropipette and placed on the electrode and then analyzed using the DPV technique. Figure 14A,B show DPVs of the anolyte solution obtained every 30 min in MFCs using electrolytic solutions of phosphate buffer and leachate, respectively. Figure 14A,B’ give the corresponding evolution of BPA concentrations over time for MFCs using electrolytic solutions of phosphate buffer and leachate, respectively.
In Figure 14A,C, a gradual decrease in the peak intensity of BPA can be observed, indicating a decrease in BPA concentrations in the anodic compartment of two MFCs (Figure 14A′,B′). This indicates that BPA is getting degraded by the T. harzianum fungus, which is using BPA as a carbon source. Figure 14A′ shows an initial BPA concentration of 29 mgL−1 in the MFC using PBS as an electrolytic solution at day 0, which decreases over 4 days, reaching 1 mgL−1. Similar results are observed in Figure 14B′, where, for an initial BPA concentration of 29 mgL−1 in the MFC using leachate as electrolytic solution at day 0, BPA concentrations decrease over 8 days, reaching 9 mgL−1. The BPA biodegradation by T. harzianum is probably controlled by the action of the laccase enzyme, which is known to mineralize organic compounds [39,40]. T. harzianum fungus is known as a filamentous fungus, having the capability to cleave aromatic rings by generating a large number of hydrophobic polymers. With the hypothesis of total mineralization, reactions at the electrodes were the following:
  • Oxidation–reduction reaction of BPA in the MFC:
C15H16O2 + 18O2 ↔ 8H2O + 15CO2
  • Half-reaction of the potassium ferricyanide reduction at the cathode:
Fe (CN)63− + e ↔ Fe (CN)64−
  • Half-reaction of the reduction of oxygen at the cathode (with the hypothesis that dioxygen also plays a role in the regeneration of the ferrocyanide into potassium ferricyanide):
O2 + 4H+ + 4e ↔ 2H2O
Yi et al. [51] studied the degradation of BPA by different bacteria and fungi under various environmental conditions, and the obtained results showed that many released intermediates, such as 4-hydroxyacetophenone, 4-hydroxybenzoic acid, 4-hydroxybenzylmethanol, and phenol, were more toxic than the mother molecule. However, the use of fungi is a good alternative for BPA degradation. Fungi produce nonspecific oxidative enzymes, such as laccase, lignin peroxidase, and manganese peroxidase, which have an essential role in the degradation process [52]. Many authors have proposed the microbial degradation pathways of BPA [51,52,53]. Laccase is a key enzyme of fungi, with the activity leading to mineralization. In fact, the laccase catalyzes the oxidation of substrates and reduces them to water via single-electron radicals in the presence of O2. Table 8 reports different works on BPA degradation by fungi using laccase as the dominant enzyme.
The nonlinear relationship between the BPA concentration versus time shown in Figure 14A′,B′ suggests that the degradation of BPA in the MFC does not obey zero-order kinetics. This leads us to model the degradation kinetic by plotting ln(C/C0) versus time for the two MFCs presented in Figure 15A,B.
These plots display linear variations in ln(C/C0) over time (t), indicating that the BPA degradation in the two MFCs follows a first-order kinetic, with kinetic constants of 0.795 h−1 and 0.143 h−1 for MFCs using PBS (Figure 15A) and leachate (Figure 15B), respectively. The results are summarized in Table 9.
The half-lives, which represent times at which the initial concentration decreases by 50%, were calculated using the relation t1/2 = ln2/k (where k is the kinetic constant) to be 0.9 h and 3.8 h for MFCs using PBS (Figure 15A) and leachate solution (Figure 15B), respectively. From Table 8, we can see that the biodegradation of BPA is more important in PBS (k = 0.795 h−1) than in leachate solution (k = 0.183 h−1). This justifies the higher value of k and the shorter half-life time of degradation obtained in the MFC using PBS as a supporting electrolyte in comparison to leachate solution. This result might also justify the obtained inhibition percentages of T. harzianum fungus (Table 6), which were 10% and 25% for both PBS and leachate solution, respectively. Moreover, to ensure that BPA concentrations are reduced to environmentally safe levels before discharge, the theoretical treatment times required to decrease the concentration of BPA from 29 mgL−1 to 0.3 mgL−1 were calculated using first-order kinetics (Table 8). The results show that MFC 1 requires approximately 6 h while MFC 2 needs more time, with about 25 h, to achieve this remediation. These findings highlight the significant impact of matrix composition on removal efficiency, as demonstrated by the much faster BPA degradation rate in MFC 1 (with BPA in PBS) compared to MFC 2 (with BPA in leachate).

4. Conclusions and Perspectives

In the present study, we proposed an efficient approach for the determination of BPA in landfill leachates using an ultrasensitive voltammetric sensor of type SPE-A-polyNiTSPc. The developed SPE-A-polyNiTSPc exhibited good stability and sensitive responses towards BPA determination in leachate solutions, with results very close to those obtained by the LC/MS method (performed in an accredited lab). The applicability demonstration of SPE-A-polyNiTSPc has been in use for studying the BPA bioremediation in an applicable, sustainable, and energy-efficient leachate wastewater treatment system, utilizing T. harzianum fungus as the degrading agent. The obtained results showed BPA IC50 for T. harzianum fungus at 175 mgL−1 and an inhibition percentage of T harzianum in the leachate solution 2.5 times greater than that in PBS at an initial BPA concentration of 29 mgL−1. The BPA biodegradation process in both PBS and leachate solution obeyed first-order kinetics and was more important in PBS (k = 0.795 h−1) than in the leachate solution (k = 0.143 h−1). The elaborated MFC exhibited good performances, expressed by the rapid growth of T. harzianum fungus in the presence of standard BPA and leachate solutions, with power densities of 24 mWm−3 and 97 mWm−3, respectively. This study also suggests a prospect of bioremediation of organic compounds in leachate wastewater to produce green bioenergy. The polarization curves of the obtained MFCs demonstrate the effective generation of energy and the need for further studies to examine the scale-up of our system. This will be concrete if we master the protocol of changing the membrane. It would also be interesting to investigate the possibility of using a combination of bacteria and fungus as degrading agents. Additionally, the development of the fungal-based fuel cell for BPA degradation contributes to the efforts aiming at merging sustainable bioremediation with renewable energy production. Future research should focus on exploring different fungal strains and designing advanced electrodes to improve electron transfer efficiency and long-term stability.

Author Contributions

Experiments, S.M.F. and M.P.; methodology, J.-P.T.S. and A.A.Y.; review and editing, H.H.B.T., M.D. and V.U.; writing—original draft preparation, S.M.F.; writing—review and editing, all the authors. All authors have read and agreed to the published version of the manuscript.

Funding

This research was funded by the European Union (Horizon Europe Programme Grant Agreement N° 101112824), 2022.

Institutional Review Board Statement

Not applicable.

Informed Consent Statement

Not applicable.

Data Availability Statement

The original data used in this study can be obtained from the submitting author if requested.

Acknowledgments

The authors would like to express their gratitude to iMERMAID (Innovative solutions for Mediterranean Ecosystem Remediation via Monitoring and decontamination from chemical pollutants) project (Horizon Europe Programme Grant Agreement N° 101112824), funded by the European Union, for its financial support. Many thanks to Romain MALLET, Microscopy centre (SCIAM) of the University of Angers (France) for his valuable collaboration on SEM images. We thank Kalliopi Borboudaki from the United Association for the Solid Waste Management (ESDAK) in Crete for providing us with leachate samples. Many thanks to Anđela Marković and Nenad Gligorić for the enriching discussions.

Conflicts of Interest

The authors declare no conflict of interest.

Abbreviations

The following abbreviations are used in this manuscript:
AFMAtomic Force Microscopy
BODBiochemical Oxygen Demand
BPABisphenol A
CCCarbon Cloth
CEMCation Exchange Membrane
CODChemical Oxygen Demand
DPVDifferential Pulse Voltammetry
EDXEnergy Dispersive X-Ray
EISElectrochemical Impedance Spectroscopy
ELISAEnzyme-Linked Immunosorbent Assay
EMFElectromotive Force
LC/MS Liquid Chromatography/Mass Spectrometry
LSVLinear Sweep Voltammetry Method
MFCMicrobial Fuel Cell
PBSPhosphate Buffer Solution
PIPhenol Index
NiTSPcNickel(II) Tetrasulfonated Phthalocyanine
ROReverse Osmosis
SEMScanning Electron Microscopy
SPEScreen-Printed Electrode
TDSTotal Dissolved Solids
TNTotal Nitrogen
TOCTotal Organic Carbon
TPTotal Phosphorus
TSTotal Solids
TSSTotal Suspended Solids

References

  1. Howdeshell, K.L.; Hotchkiss, A.K.; Thayer, K.A.; Vandenbergh, J.G.; Vomsaal, F.S. Exposure to bisphenol A advances puberty. Nature 1999, 401, 763–764. [Google Scholar] [CrossRef]
  2. Huang, H.; Li, Y.X.; Liu, J.T.; Tong, J.; Su, X.G. Detection of bisphenol A in food packaging based on fluorescent conjugated polymer PPESO3 and enzyme system. Food Chem. 2015, 185, 233–238. [Google Scholar] [CrossRef]
  3. Liguori, F.; Moreno-Marrodan, C.; Barbaro, P. Biomass-derived chemical substitutes for bisphenol A: Recent advancements in catalytic synthesis. Chem. Soc. Rev. 2020, 49, 6329–6363. [Google Scholar] [CrossRef]
  4. Seewoo, B.J.; Wong, E.V.S.; Mulders, Y.R.; Gozt, A.; Elagali, A.; Symeonides, C.; Dunlop, S.A. A systematic evidence map protocol for mapping global exposure to bisphenols and their alternatives and social and environmental justice implications. Environ. Inter. 2024, 194, 109091. [Google Scholar] [CrossRef] [PubMed]
  5. Rochester, J.R.; Bolden, A.L. Bisphenol S and F: A systematic review and comparison of the hormonal activity of bisphenol A substitutes. Environ. Health Perspect. 2015, 123, 643–650. [Google Scholar] [CrossRef]
  6. Park, J.; Morley, T.S.; Kim, M.; Clegg, D.J.; Scherer, P.E. Obesity and cancer-mechanisms underlying tumour progression and recurrence. Nat. Rev. Endocrinol. 2014, 10, 455–465. [Google Scholar] [CrossRef] [PubMed]
  7. Burgos-Aceves, A.M.; Abo-Al-Ela, H.G.; Faggio, C. Physiological and metabolic approach of plastic additive effects: Immune cells responses. J. Hazard. Mater. 2021, 404, 124114. [Google Scholar] [CrossRef]
  8. Soto, M.A.; Sonnenschein, C. Environmental causes of cancer: Endocrine disruptors as carcinogens. Nat. Rev. Endocrinol. 2010, 6, 363–370. [Google Scholar] [CrossRef]
  9. Walker, D.M.; Gore, A.C. Transgenerational neuroendocrine disruption of reproduction. Nat. Rev. Endocrinol. 2011, 7, 197–207. [Google Scholar] [CrossRef] [PubMed]
  10. Liu, X.; Shi, H.; Xie, B.; Dionysiou, D.D.; Zhao, Y.P. Microplastics as Both a Sink and a Source of Bisphenol A in the Marine Environment. Environ. Sci. Technol. 2019, 53, 10188–10196. [Google Scholar] [CrossRef]
  11. Lin, Y.; Zeng, X.G.; Wu, D.S.; Wang, X. Study on bisphenol A induced primary cultured mesencephalic neuronal cell injury by oxidative stress. J. Hyg. Res. 2006, 35, 419–422. [Google Scholar]
  12. Adeel, M.; Song, X.; Wang, Y.; Francis, D.; Yang, Y. Environmental impact of estrogens on human, animal and plant life: A critical review. Environ. Int. 2017, 99, 107–119. [Google Scholar] [CrossRef]
  13. Petrovic, M.; Mihajlovic, I.; Tubic, A.; Novakovic, M. Microplastics in municipal solid waste landfills Maja. Curr. Opin. Environ. Sci. Health 2023, 31, 100428. [Google Scholar] [CrossRef]
  14. Urase, T.; Miyashita, K. Factors affecting the concentration of bisphenol A in leachates from solid waste disposal sites and its fate in treatment processes. J. Mater. Cycles Waste Manag. 2003, 5, 77–82. [Google Scholar] [CrossRef]
  15. Yamamoto, T.; Yasuhara, A.; Shiraishi, H.; Nakasugi, O. Bisphenol A in hazardous waste landfill leachates. Chemosphere 2001, 42, 415–418. [Google Scholar] [CrossRef] [PubMed]
  16. Narevski, A.C.; Novaković, M.I.; Petrović, M.Z.; Mihajlović, I.J.; Maoduš, B.N.; Vujić, G.V. Occurrence of bisphenol A and microplastics in landfill leachate: Lessons from Southeast Europe. Environ. Sci. Pollut. Res. Int. 2021, 28, 42196–42203. [Google Scholar] [CrossRef] [PubMed]
  17. No 10/2011 of 14; European Commission, Commission Regulation (EU) on Plastic Materials and Articles Intended to Come into Contact with Food. Office for Official Publications of the European Union: Luxembourg, Luxembourg, 2011.
  18. Ren, L.; Fang, J.Z.; Liu, G.H.; Zhang, J.Q.; Zhu, Z.; Liu, H.G.; Lin, K.; Zhang, H.M.; Lu, S.Y. Simultaneous determination of urinary parabens, bisphenol A, triclosan, and 8-hydroxy-2′-deoxyguanosine by liquid chromatography coupled with electrospray ionization tandem mass spectrometry. Anal. Bioanal. Chem. 2016, 408, 2621–2629. [Google Scholar] [CrossRef] [PubMed]
  19. Zhang, R.; Zhao, L.N.; Liu, R.T. Deciphering the toxicity of bisphenol a to Candida rugosa lipase through spectrophotometric methods. J. Photochem. Photobiol. B 2016, 163, 40–46. [Google Scholar] [CrossRef]
  20. Hou, C.J.; Zhao, L.X.; Geng, F.L.; Wang, D.; Guo, L.H. Donor/acceptor nanoparticle pair-based singlet oxygen channeling homogenous chemiluminescence immunoassay for quantitative determination of bisphenol A. Anal. Bioanal. Chem. 2016, 408, 1–10. [Google Scholar] [CrossRef]
  21. Stanic, B.; Nenadov, D.S.; Fa, S.; Pogrmic-Majkic, K.; Andric, N. Integration of data from the cell-based ERK1/2 ELISA and the Comparative Toxicogenomics Database deciphers the potential mode of action of bisphenol A and benzo [a] pyrene in lung neoplasm. Chemosphere 2021, 285, 285131527. [Google Scholar] [CrossRef] [PubMed]
  22. Vaghela, C.; Kulkarni, M.; Karve, M.; Zinjarde, S. Selective electrochemical sensing of bisphenol derivatives using novel bioelectrode of agarose-guar gum-graphene oxide immobilized with tyrosinase. J. Environ. Chem. Eng. 2022, 10, 107360. [Google Scholar] [CrossRef]
  23. Ma, J.P.; Yuan, J.H.; Xu, Y.Y.; Jiang, Y.; Bai, W.S.; Zheng, J.B. Ultrasensitive electrochemical determination of bisphenol A in food samples based on a strategy for activity enhancement of enzyme: Layer-by-layer self-assembly of tyrosinase between two-dimensional porphyrin metal-organic framework nanofilms. Chem. Eng. J. 2022, 446, 137001. [Google Scholar] [CrossRef]
  24. Baghayeri, M.; Amiri, A.; Fayazi, M.; Nodehi, M.; Esmaeelnia, A. Electrochemical detection of bisphenol A on a MWCNTs/CuFe2O4 nanocomposite modified glassy carbon electrode. Mater. Chem. Phys. 2021, 261, 124247. [Google Scholar] [CrossRef]
  25. Huang, J.; Zhang, T.T.; Dong, G.T.; Zhu, S.S.; Yan, F.; Liu, J.Y. Direct and Sensitive Electrochemical Detection of Bisphenol A in Complex Environmental Samples Using a Simple and Convenient Nanochannel Modified Electrode. Front. Chem. 2022, 10, 900282. [Google Scholar] [CrossRef]
  26. Hayashi, Y.; Matsuda, R.; Haishima, Y.; Yagami, T.; Nakamura, A. Validation of HPLC and GC-MS systems for bisphenol-A leached from hemodialyzers on the basis of FUMI theory. J. Pharm. Biomed. Anal. 2002, 28, 421–429. [Google Scholar] [CrossRef]
  27. Crapnell, R.D.; Banks, C.E. Electroanalytical Overview: Screen-Printed Electrochemical Sensing Platforms. ChemElectroChem 2024, 11, e202400370. [Google Scholar] [CrossRef]
  28. Alam, A.U.; Deen, M.J. Bisphenol A electrochemical sensor using graphene oxide and β-cyclodextrin-functionalized multi-walled carbon nanotubes. Anal. Chem. 2020, 92, 5532–5539. [Google Scholar] [CrossRef]
  29. Pundir, C.S.; Kumar, P.; Jaiwal, R. Biosensing methods for determination of creatinine: A review. Biosens. Bioelectron. 2019, 126, 707–724. [Google Scholar] [CrossRef] [PubMed]
  30. Luis-Sunga, M.; Carinelli, S.; García, G.; González-Mora, J.L.; Salazar-Carballo, P.A. Electrochemical Detection of Bisphenol A Based on Gold Nanoparticles/Multi-Walled Carbon Nanotubes: Applications on Glassy Carbon and Screen-Printed Electrodes. Sensors 2024, 24, 2570. [Google Scholar] [CrossRef] [PubMed]
  31. Yang, Y.; Liu, Z.; Demeestere, K.; Hulle, S.V. Ozonation in view of micropollutant removal from biologically treated landfill leachate: Removal efficiency, OH exposure, and surrogate-based monitoring. Chem. Eng. J. 2021, 410, 128413. [Google Scholar] [CrossRef]
  32. Gorito, A.M.; Lado Ribeiro, A.R.; Pereira, M.F.R.; Almeida, C.R.M.; Silva, M.A.T. Advanced oxidation technologies and constructed wetlands in aquaculture farms: What do we know so far about micropollutant removal. Environ. Res. 2022, 204, 111955. [Google Scholar] [CrossRef] [PubMed]
  33. Tahraoui, H.; Belhadj, A.E.; Moula, N.; Bouranene, S.; Amrane, A. Optimisation and Prediction of the Coagulant Dose for the Elimination of Organic Micropollutants Based on Turbidity. Kem. Ind. 2021, 70, 675–691. [Google Scholar] [CrossRef]
  34. Giwa, A.; Hasan, S.W. Numerical modeling of an electrically enhanced membrane bioreactor (MBER) treating medium-strength wastewater. J. Environ. Manag. 2015, 164, 1–9. [Google Scholar] [CrossRef]
  35. Kumar, V.; Sharma, N.; Umesh, M.; Chakraborty, P.; Kaur, K.; Duhan, L.; Sarojini, S.; Thazeem, B.; Pasrija, R.; Vangnai, A.S.; et al. Micropollutants characteristics, fate, and sustainable removal technologies for landfill leachate: A technical perspective. J. Water Proc. Eng. 2023, 53, 103649. [Google Scholar] [CrossRef]
  36. Shabani, M.; Pontié, M.; Younesi, H.; Nacef, M.; Rahimpour, A.; Rahimnejad, M.; Medjda, R.; Khelladi, R.M.B. Biodegradation of acetaminophen and its main by-product 4-aminophenol by Trichoderma harzianum versus mixed bioflm of Trichoderma harzianum/Pseudomonas fuorescens in a fungal microbial fuel cell. J. Appl. Electrochem. 2021, 51, 581–596. [Google Scholar] [CrossRef]
  37. Kyrila, G.; Katsoulas, A.; Schoretsaniti, V.; Rigopoulos, A.; Rizou, E.; Doulgeridou, S.; Sarli, V.; Samanidou, V.; Touraki, M. Bisphenol A removal and degradation pathways in microorganisms with probiotic properties. J. Hazard. Mater. 2021, 413, 125363. [Google Scholar] [CrossRef]
  38. Gorin, M.; Shabani, M.; Votat, S.; Lebrun, L.; Mbokou, S.F.; Pontie, M. Application of fungal-based microbial fuel cells for biodegradation of pharmaceuticals: Comparative study of individual vs. mixed Contaminant Solutions. Chemosphere 2024, 363, 142849. [Google Scholar] [CrossRef]
  39. Segundo, R.F.; Rocío, P.C.; Luis, C.C.; Angelats Silva, L.M. Potential Use of the Fungus Trichoderma sp. as a Plastic-Reducing Agent and Electricity Generator in Microbial Fuel Cells. Processes 2024, 12, 2904. [Google Scholar] [CrossRef]
  40. Bint-e-Zahira, S.; Khalid, A.N.; Yousaf, N.; Iqbal, M.; Anwar, T.; Qureshi, H.; Salmen, S.H.; Ansari, M.J. Exploring Trichoderma Species in Industrial Wastewater: Morphological and Molecular Insights from Isolates. Life 2024, 14, 750. [Google Scholar] [CrossRef]
  41. Silga, J.P.T.; Foukmeniok, S.M.; Bako, Y.F.R.; Ramdane, A.C.; Nazerifar, M.; Younesi, H.; Tapsoba, I.; Maxime, P. Ultrasensitive screen-printed-electrodes for p-aminophenol analysis and applications in bioremediation and photodegradation processes. J. Electrochem. Soc. 2025, 172, 027501. [Google Scholar] [CrossRef]
  42. Votat, S.; Pontié, M.; Jaspard, E.; Lebrun, L. Crystal Violet (CV) Biodegradation Study in a Dual Chamber Fungal Microbial Fuel Cell with Trichoderma harzianum. Energies 2024, 17, 247. [Google Scholar] [CrossRef]
  43. Abiriga, D.; Jenkins, A.; Vestgarden, L.S.; Klempe, H. A nature-based solution to a landfill-leachate contamination of a confined aquifer. Sci. Rep. 2021, 11, 1–12. [Google Scholar] [CrossRef]
  44. Abdel-Shafy, H.I.; Ibrahim, A.M.; Al-Sulaiman, A.M.; Okasha, R.A. Landfill leachate: Sources, nature, organic composition, and treatment: An environmental overview. Ain Shams Eng. J. 2024, 15, 102293. [Google Scholar] [CrossRef]
  45. Raymundo-Pereira, P.A.; Gomes, N.O.; Machado, S.A.S.; Oliveira, N.O., Jr. Simultaneous, ultrasensitive detection of hydroquinone, paracetamol and estradiol for quality control of tap water with a simple electrochemical method. J. Electroanal. Chem. 2019, 848, 113319. [Google Scholar] [CrossRef]
  46. Mbokou Foukmeniok, S.; Bako, F.R.Y.; Ilboudo, O.; Karanga, Y.; Njanja, E.; Pontie, M.; Tapsoba, I.; Kenfack, I.T.; Djouaka, R. Sensitive Carbon Fiber Microelectrode for the Quantification of Diuron in Quality Control of a Commercialized Formulation. Int. J. Anal. Chem. 2022, 2022, 9994639. [Google Scholar] [CrossRef]
  47. Bako, Y.F.R.; Mbokou Foukmeniok, S.; Kaboré, B.; Tapsoba, I.; Pontié, M. Indirect Electroanalysis of 3-Methyl-4-Nitrophenol in Water Using Carbon Fiber Microelectrode Modified with Nickel Tetrasulfonated Phthalocyanine Complex. Mater. Sci. Appl. 2024, 15, 25–35. [Google Scholar] [CrossRef]
  48. Pontié, M.; Sikpo, L.; Thouand, G.; Lahan, R.; Tapsoba, I.; Mallet, R.; Feng, T. Direct Electroanalysis of p-Nitrophenol (PNP) in Estuarine and Surface Waters by a High Sensitive Type C/p-NiTSPc CoatingCarbon Fiber Microelectrode (CFME). Electroanalysis 2011, 23, 433–441. [Google Scholar] [CrossRef]
  49. Bako, Y.F.R.; Silga, J.P.T.; Mbokou Foukmeniok, S.; Pontié, M.; Tapsoba, I. Molecular imprinted polymer modified carbon ultramicroelectrode for a selective detection of 3-methyl-4-nitrophenol and its bioremediation in a fungal microbial fuel cell. J. Appl. Electrochem. 2024, 54, 1253–1265. [Google Scholar] [CrossRef]
  50. Deffo, G.; Temgoua, R.T.C.; Mbokou Foukmeniok, S.; Njanja, E.; Tonlé, I.K.; Ngameni, E. A sensitive voltammetric analysis and detection of Alizarin Red S onto a glassy carbon electrode modified by an organosmectite. Sens. Int. 2021, 2, 100126. [Google Scholar] [CrossRef]
  51. Yi, G.R.; Wu, X.; Tang, K.H.D.; Li, R.H. Microbial degradation of bisphenol A-A mini-review. Curr. Opin. Environ. Sci. Health 2025, 43, 100595. [Google Scholar] [CrossRef]
  52. Liu, J.; Sun, K.; Zhu, R.; Wang, X.; Waigi, M.G.; Li, S.Y. Biotransformation of bisphenol A in vivo and in vitro by laccase-producing Trametes hirsuta La-7: Kinetics, products, and mechanisms. Environ Pollut. 2023, 321, 121155. [Google Scholar] [CrossRef] [PubMed]
  53. Chaturvedi, M.; Kaur, N.; Rahman, P.K.S.M.; Sharma, S. Solubilization and enhanced degradation of benzene phenolic derivatives-bisphenol A/Triclosan using a biosurfactant producing white rot fungus Hypocrea lixii S5 with plant growth promoting traits. Front. Microbiol. 2024, 15, 1433745. [Google Scholar] [CrossRef] [PubMed]
  54. Jasinska, A.; Sobon, A.; Rózalska, S.; Srednicka, P. Bisphenol A removal by the fungus Myrothecium roridumIM 6482—Analysis of the cellular and subcellular level. Int. J. Mol. Sci. 2021, 22, 10676. [Google Scholar] [CrossRef]
  55. Ademakinwa, A.N. A heat-resistant intracellular laccase immobilized via cross-linked enzyme aggregate preparation: Characterization, application in bisphenol A removal and phytotoxicity evaluation. J. Hazard. Mater. 2021, 419, 126480. [Google Scholar] [CrossRef] [PubMed]
  56. Li, S.Y.; Liu, Q.Z.; Liu, J.; Sun, K.; Yang, W.; Si, Y.B.; Li, Y.C.; Gao, Y.Z. Inhibition mechanisms of Fe2+/Fe3+ and Mn2+ on fungal laccase enabled bisphenol a polyreaction. Chemosphere 2022, 307, 135685. [Google Scholar] [CrossRef]
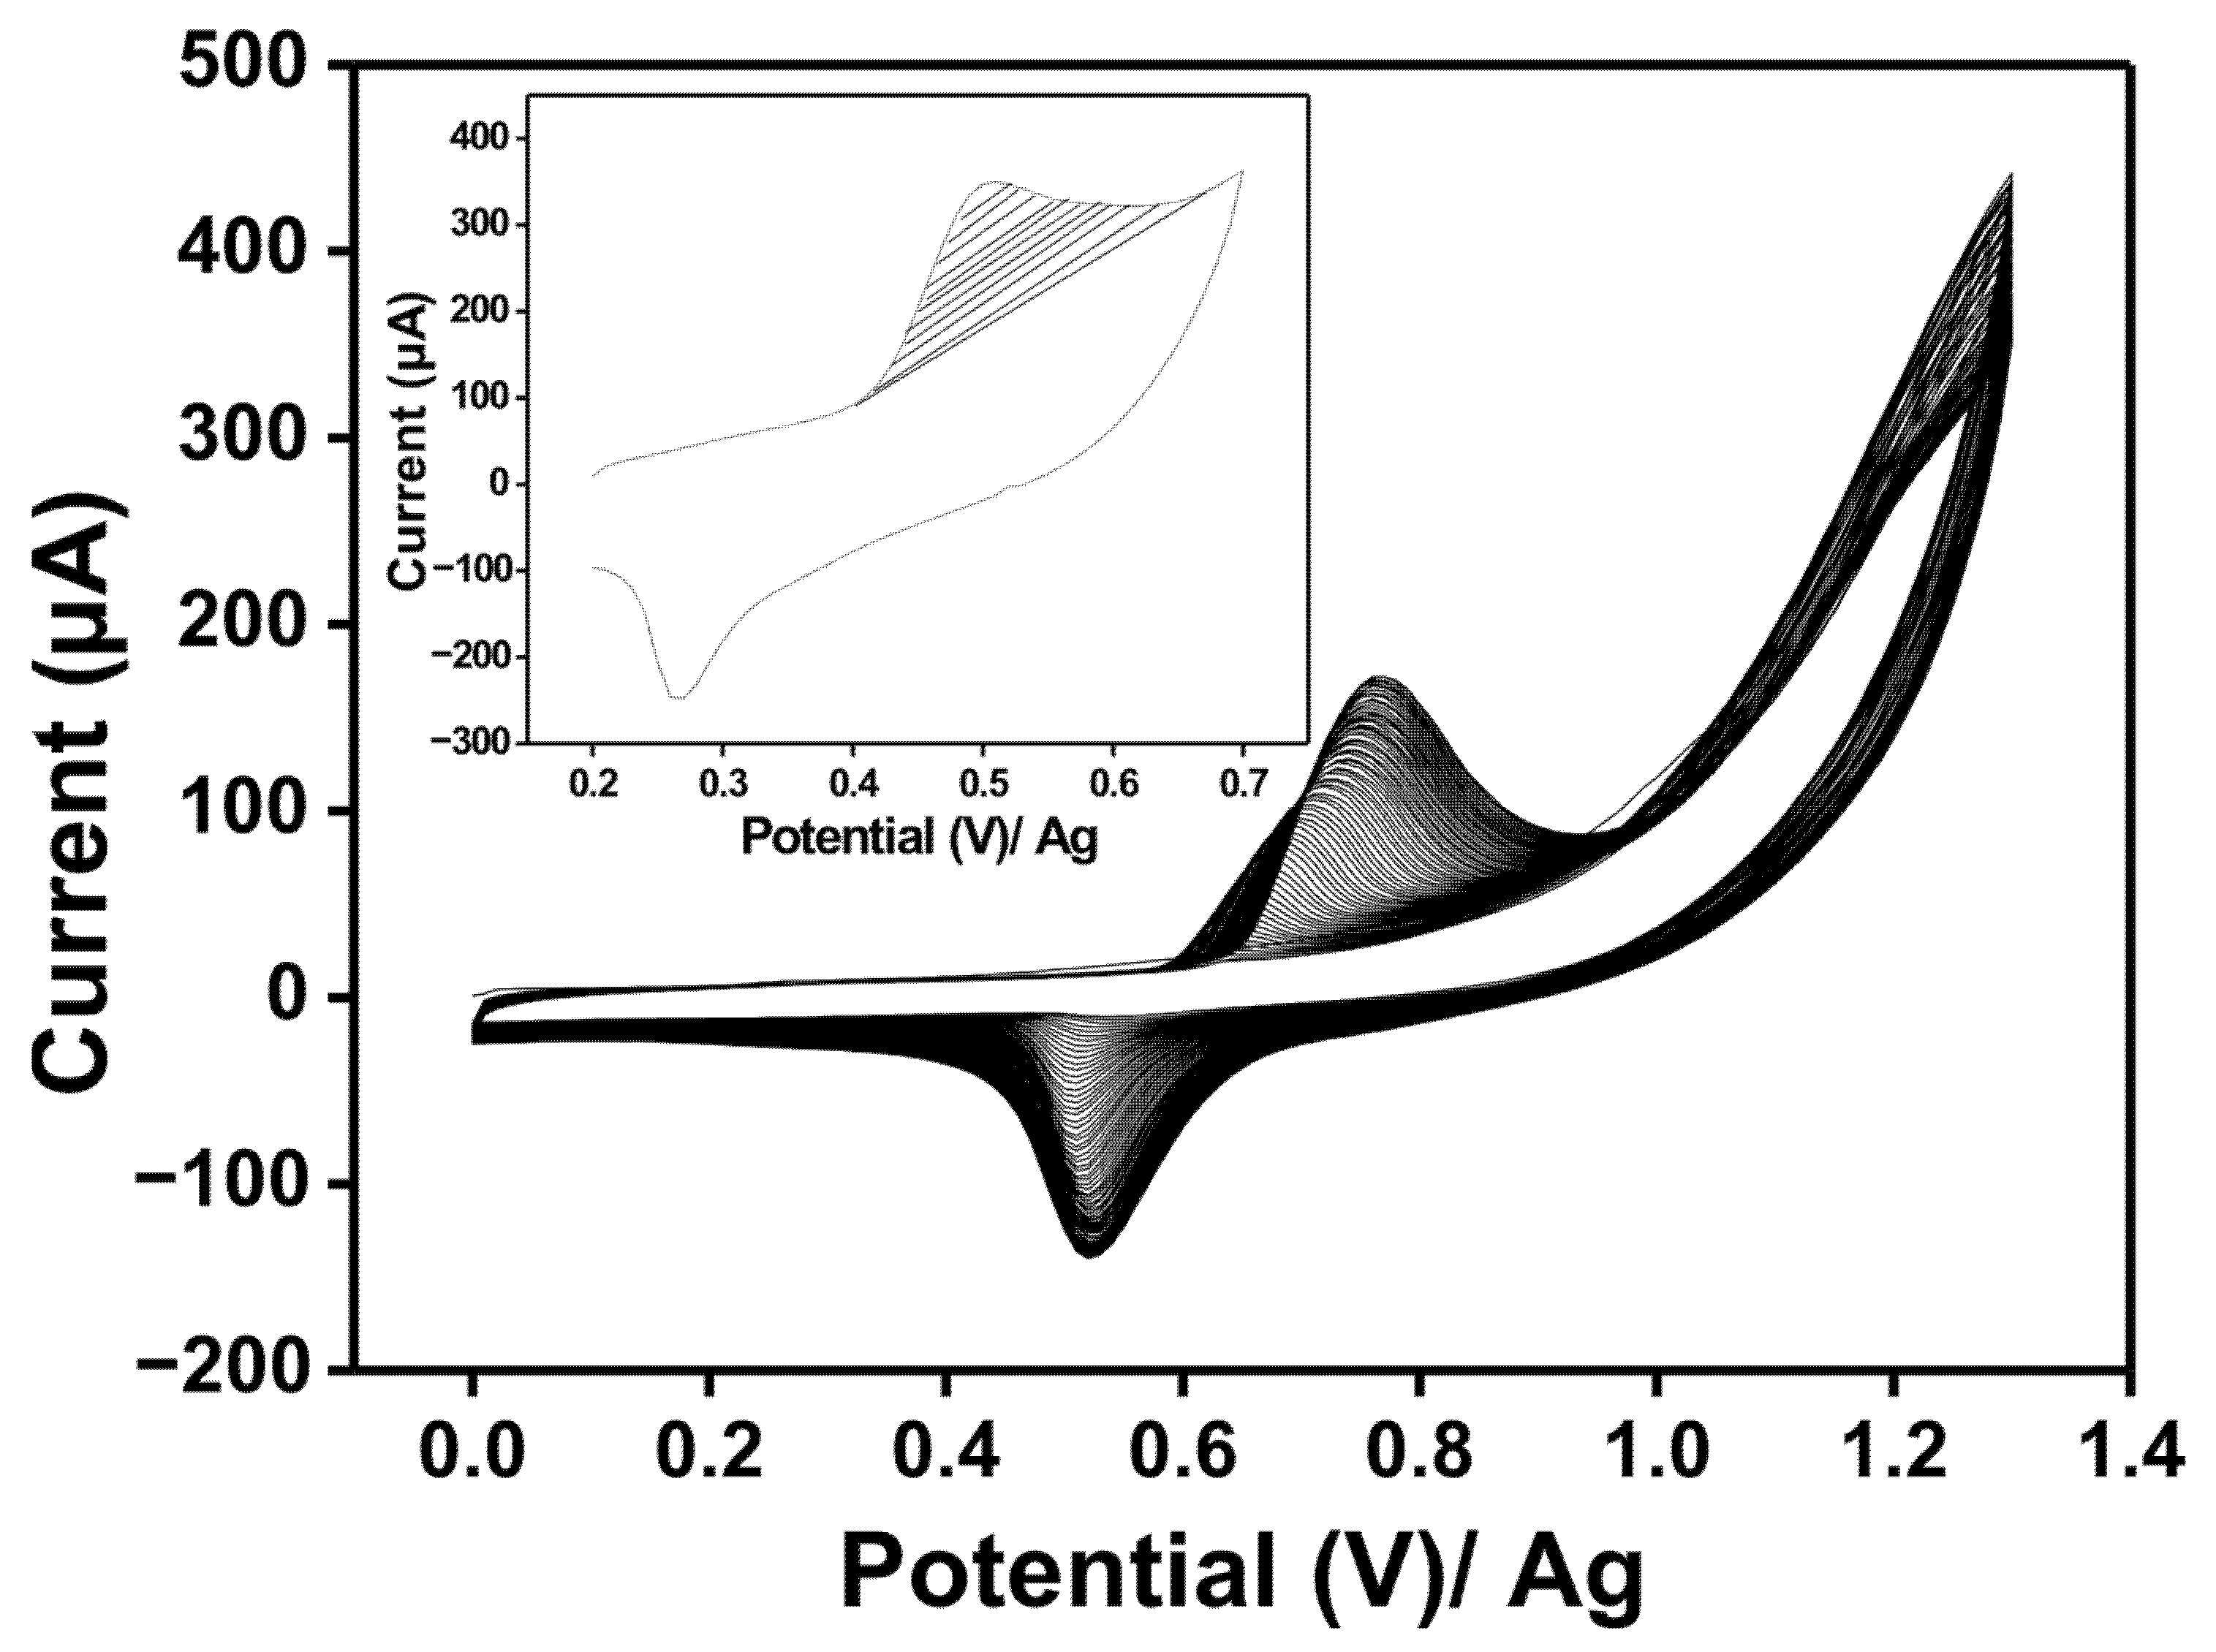
Figure 1. Cyclic voltammograms (100 cycles) of the activated SPE obtained in 2 mM NiTSPc prepared in 0.1 M NaOH. Scan rate: 100 mVs−1. Insert shows proof of the electrodeposition of poly-NiTSPc film.
Chemosensors 13 00317 g001
Figure 2. Histogram giving the peak intensities obtained in presence of BPA 10 mgL−1 on SPE-A-polyNiTSPc at different cycles of NiTSPc electrodeposition.
Chemosensors 13 00317 g002
Figure 3. Images of (A)—unmodified SPE, (B)—SPE-A-polyNiTSPc; EDX spectra of (C)—unmodified SPE, (D)—SPE-A-polyNiTSPc; AFM images of (E)—unmodified SPE, (F)—SPE-A-polyNiTSPc.
Chemosensors 13 00317 g003
Figure 4. Nyquist plots of (a) unmodified SPE and (b) SPE-A-polyNiTSPc in 5 mM [Fe(CN)6]3−/4− (1:1) solution. Inset shows the corresponding Randles equivalent circuit.
Chemosensors 13 00317 g004
Figure 5. Three-dimensional image of the numerical microscopy view of the total surface area of the SPEs used in the present work.
Chemosensors 13 00317 g005
Figure 6. LSV of BPA 10 mgL−1 in 0.1 M PBS (pH 7.4) on (a) unmodified SPE and (b) SPE-A-polyNiTSPc at a scan rate of 100 mVs−1.
Chemosensors 13 00317 g006
Scheme 1. Oxidation mechanism of BPA illustrated in Figure 6.
Chemosensors 13 00317 sch001
Figure 7. DPV on (A)—unmodified SPE, (B)—SPE-A-polyNiTSPc in 0.1 M PBS (pH 7.4) at different concentrations of BPA: 1, 10, 20, 30, 40, 50, 60, 70, 80, 90, and 100 mgL−1. (C)—shows the corresponding calibration curves: (a) unmodified SPE and (b) poly-NiTSPc-activated SPE.
Chemosensors 13 00317 g007
Figure 8. Application of the standard addition method for BPA determination in leachate samples using SPE-A-polyNiTSPc. (A)—DPV curves of the raw sample: 1st curve = [unknown BPA], 2nd curve = [known BPA standard added]. (B) shows the corresponding calibration curve.
Chemosensors 13 00317 g008
Figure 9. Curves of T. harzianum growth in PBS at different concentration of BPA over time. (a) [BPA] = 0 mgL−1 (control); (b) [BPA] = 29 mgL−1; (c) [BPA] = 50 mgL−1; (d) [BPA] = 100 mgL−1; (e) [BPA] = 250 mgL−1; (f) 500 mgL−1.
Chemosensors 13 00317 g009
Figure 10. Inhibition rate of T. harzianum fungus at different BPA concentrations.
Chemosensors 13 00317 g010
Figure 11. Curve of T. harzianum growth on different matrices over time. (a)—0.1 M PBS (pH 7.4) without [BPA] = 0 mgL−1 (control); (b)—0.1 M PBS (pH 7.4) with [BPA] = 29 mgL−1; (c)—landfill leachate containing [BPA] = 29 mgL−1.
Chemosensors 13 00317 g011
Figure 12. SEM images of (A) unmodified carbon cloth, (B,C) carbon cloth covered by Trichoderma harzianum mycelium.
Chemosensors 13 00317 g012
Figure 13. Polarization curves for (A)—BPA solution in PBS (MFC1), (B)—BPA in landfill leachate (MFC2).
Chemosensors 13 00317 g013
Figure 14. DPVs of the residual solution over time in MFCs with electrolytic solutions of (A)—PBS, (B)—leachate. Evolution of BPA concentration over time in MFCs with the electrolytic solution of (A′)—PBS, (B′)—leachate.
Chemosensors 13 00317 g014
Figure 15. Plot of ln C/C0 as a function of incubation time in MFCs using the electrolytic solution of (A)—PBS and (B)—leachate.
Chemosensors 13 00317 g015
Table 1. Characteristics and physico-chemical composition of municipal landfill leachate of Pera Galini in Crete (November 2023) and the effluent after RO treatment.
ParametersUnitsRaw LeachateEffluent After RO
BODmgL−12900<4
CODmgL−114,1407
TSmgL−123,45024
TSSmgL−124<2
TDSmgL−123,40020
TNmgL−1440034
Organic NmgL−1550<0.5
NH4-NmgL−1384027.5
TOCmgL−155501.7
TPmgL−139<0.05
P-PO4mgL−135<0.05
pH 85.8
ConductivityµScm−134,100263
Temperature°C19.819.9
OdorTON>10050
TurbidityNTU2101.9
ClmgL−14750<5
SO4mgL−1480<5
Phenol Index (PI)mgL−171<0.10
AsmgL−10.49<0.003
CdmgL−10.0014<0.0005
CumgL−10.24<0.005
NimgL−10.92<0.002
ZnmgL−10.68<0.01
Table 2. Phenolic compounds and their concentrations in the influent (leachate solution) and effluent after reverse osmosis (RO).
Analytical TechniquesMoleculesConcentration in Landfill Leachate Solution (µgL−1)% in Landfill Leachate SolutionConcentration in the Effluent (After RO) (µgL−1)
LC-MS
(Accredited Lab
/INOVALYS)
Bisphenol A29,579.0097.756.00
4-tert-butylphenol582.001.920.27
4-n-nonylphenols<0.10-<0.10
4-nonylphenols42.00<0.01<0.10
Nonylphenols42.00<0.01<0.10
4-nonylphenol monoethoxylate6.00<0.01<0.10
4-nonylphenol diethoxylate0.88<0.01<0.10
Octylphenols<0.10-<0.10
4-(para)-tert-octylphenol4.40<0.01<0.05
4-n-ctylphenols<0.25-<0.05
4-(para)-tert-octylphenol monoethoxylate1.70<0.01<0.10
Table 3. Geometric surface area, real surface area, resistance of charge transfer, and roughness of the unmodified SPE and SPE-A-polyNiTSPc electrodes.
ElectrodesUnmodified SPESPE-A-polyNiTSPc
Parameters
Geometric surface area (cm2)0.126 ± 0.0100.126 ± 0.010
Real surface area (cm2)0.128 ± 0.0050.186 ± 0.005
Resistance of charge transfer (Ω)1050 ± 5400 ± 5
Roughness (nm)320 ± 0.05500 ± 0.05
Contact angles (°)111 ± 160 ± 1
Table 4. BPA concentrations in landfill leachate samples from the Pera Galini station in Crete (November 2023).
SamplePI[BPA] (µgL−1)
Using LC/MS
Accredited Lab
[BPA] (µgL−1)
Using ECS
Regression Equation/
ECS Method
Correlation Coefficient (R2)
Raw influent7129,57929,700Y = 0.33X + 9.700.995
Effluent after RO<0.16.06.4Y = 4.40X + 0.300.995
Table 5. Slope and inhibition percentage of the graph of growth diameter versus time.
BPA Concentration
(mgL−1)
0
(Control)
2950100250500
Slope (mmh−1)2.3211.7511.4291.2151.0810.981
Inhibition (%)02538475358
Table 6. Slope and inhibition percentage of T harzianum by BPA on PGA petri plates.
Culture Media[BPA] (mgL−1)Slope (mmh−1)Inhibition (%)
PGA alone0 (control)1.0810
PGA + BPA290.96710
PGA + landfill leachate290.81525
Table 7. Operational parameters for BPA biodegradation in the MFC.
MFC TypeOpen Circuit
Potential (mV)
Optimal
Resistance (Ω)
Optimal Power Density
(mWm−3)
MFC145624,85024
MFC2300843697
Table 8. BPA degradation by different fungal strains.
Fungal StrainsOxygen ConditionTemperature (°C)pHt1/2 (h)References
Trametes hirsutaAerobic304.81.44[52]
Hypocrea lixiiAerobic305.0-[53]
Myrothecium roridumAerobic287.0-[54]
Aureobasidium pullulansAerobic304.50.08[55]
Trametes versicolorAerobic253.81.14[56]
T harzianumAerobic258.03.80This work
T harzianumAerobic257.20.90This work
Table 9. Comparison of the kinetics of BPA bioremediation and half-lives in PBS and leachate solution ([BPA] = 29 mgL−1) at 25 °C.
MFC TypeRegression EquationR2k (h−1)t1/2 (h)t [BPA] = 0.3 mgL−1 (h)
MFC 1ln C/C0 = −0.795t + 6.7280.9740.7950.95750
MFC 2ln C/C0 = −0.183t − 0.0260.9920.1833.825,121
Disclaimer/Publisher’s Note: The statements, opinions and data contained in all publications are solely those of the individual author(s) and contributor(s) and not of MDPI and/or the editor(s). MDPI and/or the editor(s) disclaim responsibility for any injury to people or property resulting from any ideas, methods, instructions or products referred to in the content.