Article

Elemental Feature Extraction from Historical Pigments Through X-Ray Fluorescence Spectroscopy and Unsupervised Machine Learning

1
Department of Physics, Sapienza University of Rome La Sapienza di Roma, 00185 Rome, Italy
2
CREF—Enrico Fermni Historical Museum and Study and Research Centre, Via Panisperna, 00184 Rome, Italy
*
Author to whom correspondence should be addressed.
Chemosensors 2025, 13(8), 314; https://doi.org/10.3390/chemosensors13080314
Submission received: 7 July 2025 / Revised: 11 August 2025 / Accepted: 18 August 2025 / Published: 19 August 2025
(This article belongs to the Special Issue Chemometrics Tools Used in Chemical Detection and Analysis)

Abstract

The analysis of historical pigments contributes significantly to understanding the materials and techniques used in artworks and in preserving cultural heritage. This work introduces a novel methodology for classifying historical pigments combining X-ray fluorescence (XRF) spectroscopy with machine learning techniques. We applied this approach to a representative heterogeneous dataset of historical pigments from the open-access spectral library INFRA-ART, as well as commercial oil colors and pigments with different particle sizes. A comparative analysis through principal component analysis (PCA) and hierarchical cluster analysis (HCA) demonstrates the advantages of the full-spectrum method over conventional peak-based strategies, offering improved classification performances and robustness. Employing the entire spectrum, it is possible to access additional key features for pigment discrimination that are discarded during the computation of the traditional methods and it is possible to have an efficient feature extraction even in more complex samples. This approach offers significant advantages by allowing the simultaneous processing of extensive datasets, which is useful for interpreting real-world scenarios in cultural heritage that are characterized by high heterogeneity.

1. Introduction

Spectroscopic techniques are successfully employed to study the complex structure of paintings, frescos, wall paintings, and art prints [1,2,3,4].
In this context, X-ray fluorescence spectroscopy (XRF) stands out as its elemental sensitivity gives insights on the composition of inorganic pigments and discriminates between them based on the elemental content in a non-destructive and non-invasive way [5,6,7,8,9,10,11]. In a real case, the measurements can be influenced by several variables, such as the particle size of the powders [12,13,14], manufacturing production, environmental context [15,16], and the presence of mixtures of pigments that can make the resultant spectra ambiguous [17]. Moreover, pigments in paintings are combined with a binding medium. This will change the density of the powder in the investigated area, affecting the fluorescence counts as the organic binder absorbs most of the emitted fluorescence of the pigment and additional lines can emerge in the spectrum due to additives or fillers added during the painting manufacturing [18,19]. All these effects increase the complexity of the XRF spectra and the variables to consider in their interpretation, making the elemental analysis of pigments a challenging task.
Machine learning algorithms are currently applied in pigment identification aiding the interpretation of spectroscopic data [20]. Pre-processing procedures on raw spectroscopic data typically involve peak alignments, background removal, and energy band selection, ensuring a high-quality spectrum, in terms of signal-to-noise ratio and overlapping band deconvolution [21]. After these procedures the net peak area of each detected element is computed, and two different treatments can be applied. Net areas are normalized with respect to the rhodium scattered lines to account for geometry and matrix effects affecting the line intensity [22,23]. This is a fast way to obtain raw estimates of elemental concentrations, and sample correlation and grouping if coupled with statistical algorithms [22,24,25,26,27,28]. Alternatively mathematical algorithms such as the Fundamental Parameters method (FP) can be used. These algorithms rely on theoretical formulas for the elemental concentration, giving more precise estimates than the first method. However, they require a high level of sample preparation and elemental standards for calibration, have a higher computational cost as the complexity of the system increases, and require a priori knowledge of the sample composition [29,30].
Alternatively, the entire spectrum can be employed as an input for the statistical analysis [31,32,33,34]. In this case, however, it could be difficult to obtain the same information as the previous methods due to spectral overlap and background contribution. Additionally, for heterogeneous datasets, the different nature, being organic or inorganic, and composition of the samples greatly influence the detected intensities, giving a huge difference in counts that could cover up the benchmarks of the dataset and information given by trace elements [32]. Nevertheless, the presence of the background can provide information about the organic content of the sample, and the presence of the subsequent emission lines helps discriminate between elements with overlapping lines. Either way, the data matrices obtained are fed to different algorithms such as PCA and hierarchical cluster analysis (HCA) to identify similarities between spectra [25,27,32]. To date no standard methodology exists, especially in heterogeneous contexts, like painted objects, as each sample is characterized by entirely different matrix effects.
Here, a novel methodology for classifying historical pigments based purely on their elemental composition by integrating full-spectra X-ray fluorescence (XRF) spectroscopy with machine learning techniques is presented, aiming to extract elemental fingerprints and identify patterns in a heterogeneous dataset. This allows for a fast and accurate elemental feature extraction with minimal data pre-processing, preserving the maximum information from the spectra.

2. Materials and Methods

2.1. Pigment Dataset

The INFRA-ART database is an open-access spectral library of artistic painting materials [35]. It includes spectra of historical interest samples, such as organic and inorganic pigments, binding media, and oil paints. Each sample in the database is identified by a code based on their manufacturer followed by the catalog number from the supplier. Additional metadata regarding provenance, whether it is natural or artificial, and chemical composition, is provided, alongside the experimental conditions and instrumental set-up. A total of 71 XRF spectra of powder pigments were selected from this database. The samples were chosen as representative of pigments employed from the 15th to 19th century in Europe [36,37,38] focusing on oil paintings. The dataset has been divided into two sets. A first set of 50 spectra of powder pigments were used for the training of the PCA. It includes 23 earths with different provenances, 6 organic pigments with vegetal and animal origin and 21 inorganic pigments. A total of 13 pigment classes are represented in this set: Ca-, Fe-, Cu-, As-, Pb-, Hg-, Zn-, Cd-, Se-, Ti-, Co-, and Cr-based pigments, and a class of samples composed of elements with Z < 11, which are invisible to the XRF and their spectra are characterized only by the rhodium tube spectrum and instrumental lines. Examples of spectra belonging to the featureless, Cu, Pb, Ca, and Fe classes are shown in Figure 1a. Each of these spectra are labeled by a number reported in Table S1. The second set includes the remaining 21 spectra (Table S2). It contains spectra of oil paints manufactured by Maimeri, and of some of the pigments present in the training set with different granulometry or purity levels. Examples of the spectral differences of these samples from the raw powders can be seen in Figure 1b, where the spectra of Verona green and Cadmium yellow pigments and their oil counterparts are compared, and Figure 1c where differences in intensity between very pure Lapis Lazuli (sample from Chile, point 12), medium quality Lapis Lazuli (sample from Afghanistan, point 12–MQ), and Lapis Lazuli with a very fine grain size (less than 20 μm, point 12–VF) are shown. This second set of spectra is employed to check the quality of the model.

2.2. XRF Measurements

XRF spectra are acquired with a Bruker Tracer III-SD Handheld XRF spectrometer with a Rhodium target X-ray tube operating at 40 kV and 10.6 μA. The typical resolution of the silicon drift detector integrated in the spectrometer is 145 eV at 100,000 cps and it allows the detection of elements with atomic number Z > 11. The X-ray beam size is 3 mm x 4 mm. The acquisition time of each measurement is t = 300 s to ensure that a quantitative analysis for each sample is possible. For powder samples ~ 5 g of pigments were used and the grain size varies from 0 to 120 μm up to 175 μm for the coarser ones. The oil samples were measured after 12 months of drying time [35].

2.3. Methodology

Extraction of the benchmarks in the dataset is achieved from the loading plots by feeding PCA with the entire XRF spectra without any energy selection or semiquantitative procedure, by choosing a normalization that makes data comparable based purely on their spectral shape. A successive HCA is carried out to better visualize the data separation in the PCs space and to highlight clusters of groups of pigments with similar matrices. The analysis is divided into training and a validation step. The training procedure is carried out with two methods sharing the pre-processing stage that involves peak alignment and normalization processes. In the first method, the net peak areas of the main elemental lines are determined, resulting in a specific matrix that is subsequently analyzed using PCA and HCA. In the method proposed here, the entire spectra are considered as input. The results from both approaches are compared to identify the most accurate clustering based on the extraction of elemental features. Eventually, the best PCA representation is tested on a dataset composed of pigments in oil medium, different grain sizes, and purity levels, and the clustering performance of the trained model on these new samples is evaluated.

2.3.1. Data Pre-Processing

Each spectrum was collected in the energy range 0–41 keV for a total of 2048 channels. Due to different calibrations, a unique energetic range from 0.6 to 40.0 keV is chosen and a re-binning is applied to all spectra to obtain 2022 common channels. The nature of the sample greatly influences the fluorescence counts, leading to a difference of order up to 1000 from an inorganic and an organic sample where the environmental and instrumental background is dominant. By working directly on the raw spectra or on the intensities normalized with respect to rhodium Compton peak, the variance of the dataset is dominated by this huge difference in counts, and samples tend to group based on their intensity counts without differentiating the elemental content, giving a poor description of the dataset (Figures S1 and S2). As the focus is on the elemental composition of the sample, a normalization that makes spectra comparable is needed. In this sense, spectra are scaled with respect to their maximum intensity. This normalization preserves spectral shape and relative peak intensities while eliminating intra-sample variations within the same elemental class. In this way spectra can be compared and they can be easily clustered together based on composition similarities without introducing a bias. Two data matrices are achieved from the normalized training set: a 50 × 22 matrix containing the normalized net peak areas of the detected elements and a 50 × 2022 matrix using the entire normalized spectra without further data pre-processing. For the validation dataset a matrix 21 × 2022 is produced.

2.3.2. Multivariate Statistical Analysis

Multivariate statistical analysis is performed by implementing a principal components analysis (PCA) and a hierarchical cluster analysis (HCA), two unsupervised machine learning algorithms.
PCA is an unsupervised reduction dimensionality algorithm that transforms correlated variables into a smaller set of uncorrelated principal components (PCs) that encoded the larger variance within the dataset. This enhances data visualization, and it favors clustering of spectra with similar elemental features. Given the heterogeneity of the training dataset, a large number of principal components are considered for feature extraction. The first data matrix required a 7-dimensional PCs space, explaining 87% of the total variance, while for the second matrix a 10-dimensional space had to be considered describing the 96% of the total variance. As a tool to visualize sample clustering in these PC spaces, a HCA is applied. The best results of the HCA are achieved when a ward linkage as a similarity measure equipped with a Euclidean metric is employed. The Adjusted Rand Index (ARI)—a metric for evaluating the similarity between two clustering—is used to evaluate the HCA results and scores of 0.81 and 0.92, for the first and second data matrix, respectively, are obtained for a 10 cluster prediction. After the training, the validation set is evaluated in this new space and the HCA is applied on all the 71 samples.
The statistical analysis is carried out using the software environment Colab notebook 6.5.1 (Jupyter Notebook service). The following Python packages were employed for the study: Numpy and Scipy for pre-processing, Scikit-Learn for the statistical analysis, and Matplotlib for the plots.

3. Results and Discussion

The training phase is performed on two different datasets, as described below, to identify the best-performing representation, which is then applied to the validation set.

3.1. Machine Learning Applied to the Semiquantitative Dataset

Machine learning was applied to a 50 × 22 matrix representing the net peak areas of the detected elements, normalized to the area of the major element in the sample. The procedure identified a total of 21 elements, with their principal emission lines specified as follows: Si, S, Cl, K, Ca, Ti, Cr, Mn, Fe, Co, Cu, Zn, As, Se, Sr, Zr, Cd, Sn, Sb, Hg, and Pb. The matrix is achieved using the net peak areas of the Lα line for Hg and Pb, and the Kα line for the other elements. Additionally, for Pb and As, the Lβ and Kβ lines are included to resolve ambiguities caused by the overlap of their principal emission lines, specifically at 10.54 keV for As-Kα and 10.55 keV for Pb-Lα. To mitigate the large variance in intensity of the dataset, the spectra are normalized. This approach minimizes the classification error caused by intensity variations and makes the results more comparable to those of the subsequent step.
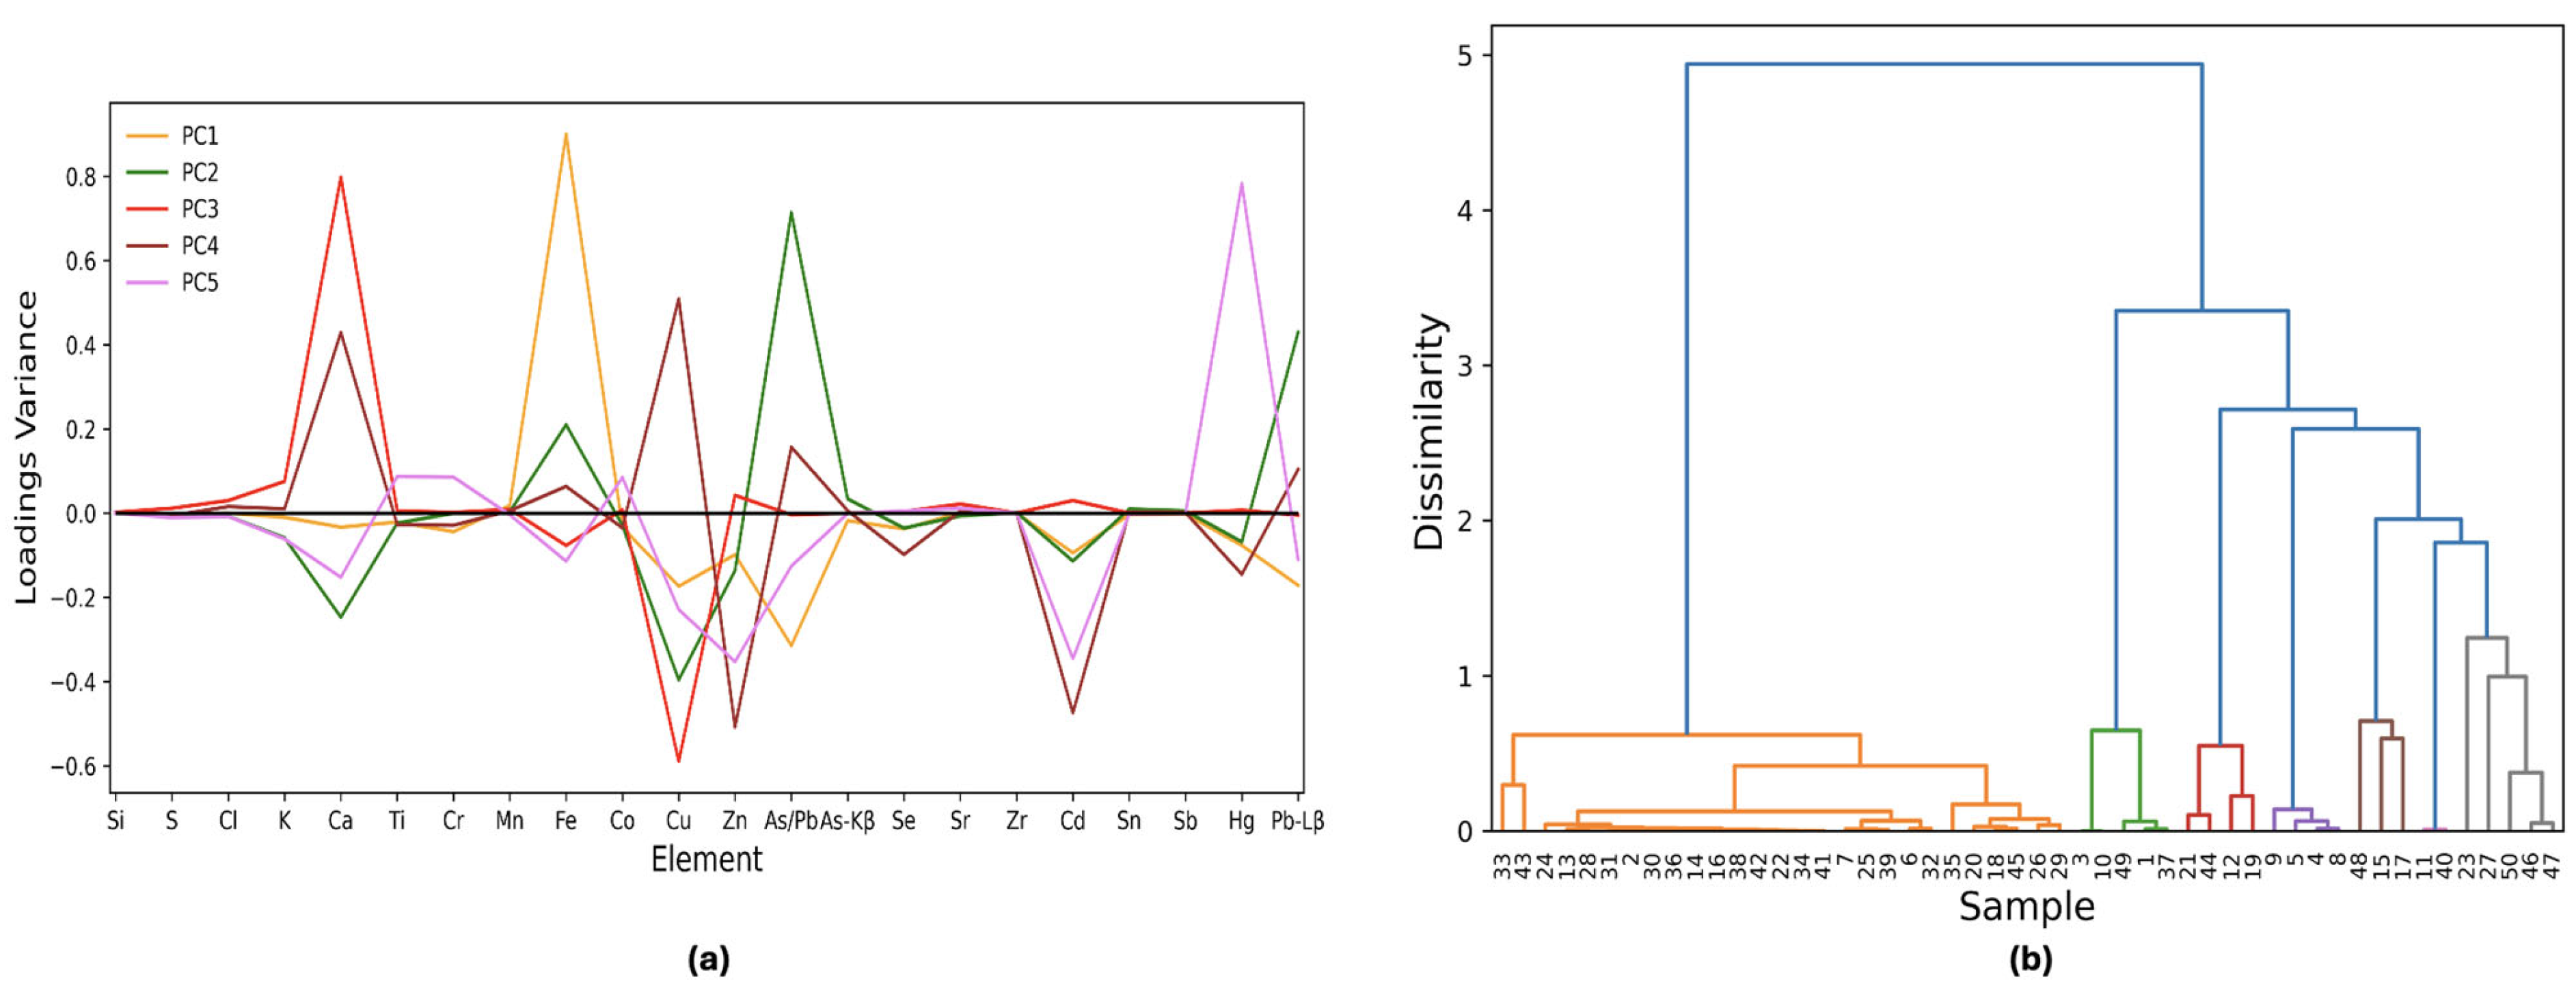
Seven principal components (PC1 37%, PC2 16%, PC3 11%, PC4 10%, PC5 6%, PC6 4%, and PC7 3%) are able to extract the major elemental features of the dataset. The first five PCs describe clusters with more than one sample, while the remaining occur only once within the given dataset. As shown in Figure 2a, PC1 defines pigments with a high Fe content (a total of 27 samples—orange line) while PC2 is principally described by the Pb emission lines (green line). PC3 (red line) discriminates between Ca and Cu while PC4 (brown line) negatively weights Cd and Zn. The last category with more than one sample is Hg and it is highlighted by PC5 (pink line). The last two principal components are linear combinations of Ti, Cr, K, Co, and Se, and are omitted for clarity.
HCA results are shown in Figure 2b. The first principal component distinguishes the high Fe content samples (orange clusters) from another heterogeneous cluster. The latter is further divided based on the main element weighted by each principal component from two to seven: initially, the Pb and As macro group is split into two clusters based on the Pb-Lβ line value, positively weighted in the PC2 loadings (green line in Figure 2a). Then, the Ca-based samples (dominant in PC3 loading, represented by the red line in Figure 2a) are separated from the Cu-based pigments. The two cadmium yellow samples (points 15 and 17) produce a sub-cluster as they share a similar matrix. The remaining cluster is composed of zinc white, with its benchmark being Zn. Finally, the two cinnabars are detached from a macro group containing markers with low statistics, weighted by PC6 and PC7. This group includes points 23, 27, 50, 46, and 47, which are the only representatives of Ti, Cr, K, Co, and Se benchmarks.

3.2. Machine Learning Approach Applied to the Raw Dataset

Machine learning was applied to a 50 × 2022 matrix, derived from the data scaled according to their maximum intensity, using the entire spectra. PCA and HCA are performed on both datasets.
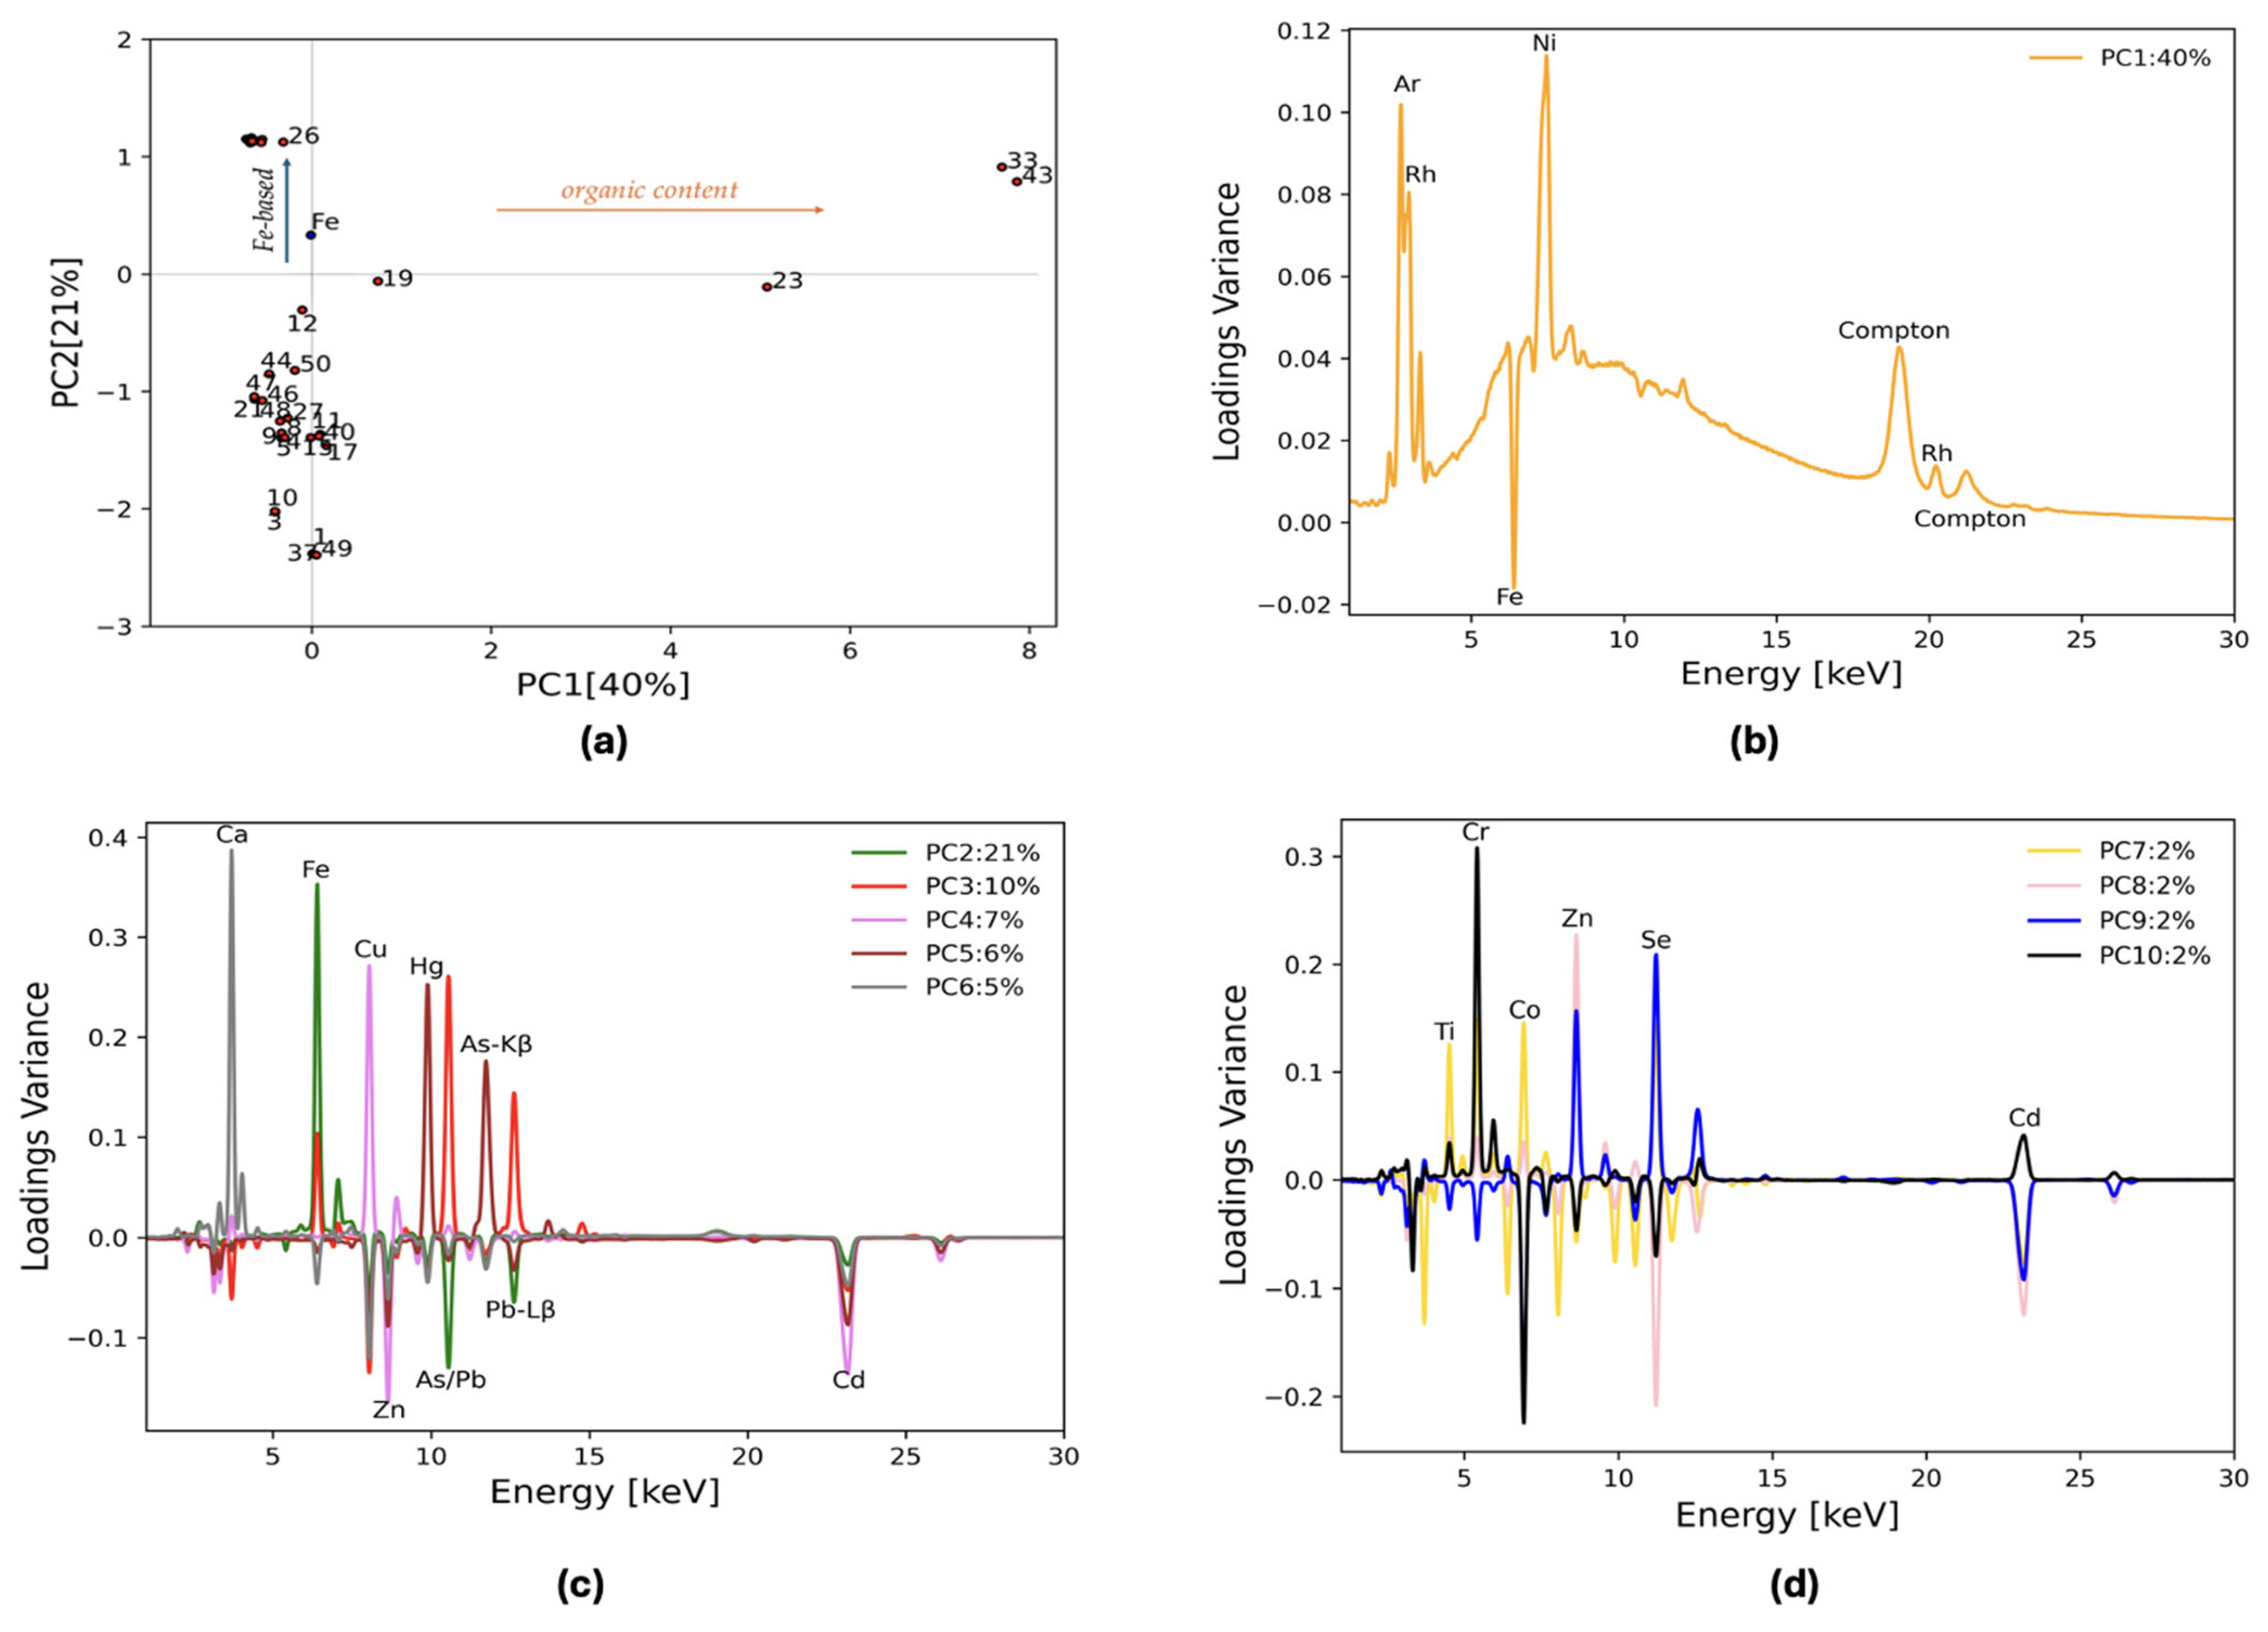
All the channels are considered and included in the PCA algorithm. A total of 10 principal components fully describe the dataset, and these will be discussed in detail in the following section. Figure 3 displays the PC1–PC2 biplot and PCA loading plots. The biplot (Figure 3a) shows three main groups: in the upper left quadrant, pigments with a high Fe content are highlighted by the PC2 positive value (blue arrow in Figure 3a describes the increase in Fe content in this PC space), four points are at PC1 positive values, and the others have negative PC2 values and a negligible PC1. PC1 describes 40% of the total variance and it can be attributed to the overall shape of the background and the emission lines present in all spectra, which are due to environmental and instrumental contributions from Ni-Kα, Ar-Kα, Rh- Kα, and Compton (Figure 3b). PC1 clusters two spectra with positive x values and high background (points 33 and 43) together with the cochineal (23) and madder lake (19) pigments, whose major lines are K-Kα and Ca-Kα but still have a significant contribution from Ni, Ar, and bremsstrahlung. Indeed, the PC1 loading plot is shaped like the typical bremsstrahlung radiation continuum and has contributions from Ni-Kα and Rh elastic and inelastic lines (Figure 3b). PC2 separates Fe-based pigments. The slightly different variance of indigo (26) from the Fe-earth cluster is due to a great contribution from lighter elements ( C 16 H 16 N 2 O 2 ) and the background is not negligible anymore. In this case, the content of Fe can be attributed to contamination from environmental factors or manufacturing processes.
PC2–PC6 loading plots are shown in Figure 3c. In the figure, seven clusters can be identified: PC3 discriminates between As and Pb pigments with the Lβ line of Pb and it identifies a sub-cluster for lead tin yellow, Naples yellow, and chrome yellow, which reports higher values for this PC compared with realgar and orpiment. PC4 describes the samples characterized by the presence of Cu, while PC5 is a discriminator for the Hg and As content. Zn and Cd are weighted negatively in all these PCs (see Figure 3c) and they are eventually differentiated in PC8 (orange line in Figure 3d). PC4 and PC5 are mainly characterized by a combination of Cu, Hg, Zn, and Cd. In the resulting score plot, a cluster of three points—48, 15, 17—lying in the direction described by Zn and Cd can be found. Of these three points, two are related to cadmium yellow in different shades (very light and medium). These pigments are associated with the presence of both Zn and Cd and the relative intensity of the respective Kα lines gives rise to the color difference. Point 48, zinc white, cannot be directly included in a possible Zn group but it could also be assigned to a Cd cluster. However, as previously pointed out, PC8 separates a Zn sub-cluster that aggregates points n. 48 and 15. Finally, PC6 identifies the Ca-based pigment cluster. PC7–PC10 are a combination of Ti, Co, Cr, and Se.
The hierarchical cluster analysis divides the samples based on the elements extracted from the loading plots. The results of the HCA are displayed in Figure 4. Different colors highlight clusters based on separate benchmarks: orange for background-dominant spectra, green for Fe, red for As/Pb, violet for Cu, brown for Hg, pink for Ca, gray for Cd and Zn, and yellow for the others. The grouping in the HCA follows the order of the PCs. The first clustering is the same division found in Figure 3, where the points are grouped according to the background content with PC1. The right group is then divided according to the subsequent PCs: first the Fe clusters by the effect of PC2, then the As and Pb group detaches itself from the rest, and so on until the Ca cluster is isolated. Eventually, the presence of four samples not assigned to any particular category arises: smalt, chrome oxide green, cadmium red, and titanium white, whose main elements are, respectively, Co, Cr, Se, and Ti. These elements enter the principal components analysis at lower variances by including PC7 to 10 (Figure 3c). By considering them, the benchmarks of these points can be extracted, and the dataset can be fully described.
This approach identifies one additional feature compared to the initial step. The three featureless samples identified here are dispersed throughout the dendrogram in Figure 2b. There, black lamps and alizarin are grouped within the Fe cluster. However, due to their relatively low counts, they are separated from the rest of the group as they are not normalized with respect to the Fe-Kα line (Figure 2b). In fact, the most prominent line in their raw spectra is the Ni-Kα line, which is excluded since it is an instrumental artifact. As for cochineal, its strongest peak is the K-Kα line, and it is clustered separately (point 23). Discrimination based on background content is not observed in this case. This is because such differentiation is not possible due to how the data matrix is constructed in the first step. Specifically, all background information is removed during pre-processing, treating both organic and inorganic matter the same. This could pose an issue for this kind of analysis, as true markers might be hidden within the background intensity, which is absent in the matrix used in the previous step. As a result, efficient differentiation between these two categories does not emerge. Furthermore, for the same reason, the separation of indigo and madder lake from their respective clusters, as seen in Figure 3a, is not observed, and their most intense line can no longer be interpreted as a contaminant.
The sub-clustering shown in Figure 4 is more reliable than that in Figure 2b. In Figure 4, it is evident that when the entire spectrum is used in the PCA, zinc white (point 48) is clustered with point 15, whereas in Figure 2b, it is isolated from the other two. This difference in clustering arises because, in the first approach (Figure 3), only the main lines of the detected elements are considered. In contrast, in the approach used in Sec. 3.2, the entire spectrum is taken into account. In this case, the Cd-L lines (Cd-Lα at 3.13 keV, Lβ at 3.32 keV, and Lγ at 3.72 keV) are also weighted. A significant difference in the intensity of lines within the energy range of 3–4 keV is observed between samples 15 and 17. This discrepancy is crucial for identifying Zn as a reference for sample 15 and for clustering it with zinc white. The intensity of these lines is closely related to the Cd content, which allows for a more accurate grouping of the samples based on their elemental composition. In both cases a further division in the Fe-based sample cluster due to the calcium content and in the Ca-based samples due to Fe content is evident.
In this space, ten pigment classes can be identified: a featureless group; pigments based on Fe, As, Pb, Cu, Hg, Cd, Zn, Ca, and Se; and a heterogeneous class composed of Ti-, Co-, and Cr-based pigments. Thus, depending on the similarity within these samples, the elemental benchmarks of an unknown spectra can be identified. In the next section new samples are injected to evaluate the clustering performance of this representation.

3.3. Validation Matrix

Powders with different purity and particle size that are dispersed in an oil binder are used as a validation test. These are then combined with the training samples to observe their spatial distribution within the 10-dimensional principal component (PC) space.
PC1–PC2 and PC2–PC6 biplots with the inclusion of these additional samples are shown in Figure 5. These two biplots offer enhanced visualization of the featureless, Fe, and Ca groups.
In Figure 5a, the three organic oil pigments (points 51, 52 and 43-O), having a high PC1 value, are located in the region with the featureless samples as expected. Also, the Verona green oil sample (6-O) takes a high PC2 value and falls along the line where Fe is the benchmark, even though it is detached from the cluster having a larger amount of background signal and thus a positive PC1 value. The other Fe-based oil pigments are located in the middle of the Fe cluster as their Fe-Kα line is less attenuated. In Figure 5b, the PC2-PC6 biplot highlights the Ca and Fe content of the samples. All the Lapis Lazuli-injected samples (12-VF, 12-F, 12-B, and 12-MQ) have similar PC values to the Ca-based training samples except for point 12-MQ, which has a strong contamination from iron, as highlighted by its positive PC2 value (Figure 1c). Although the smaller ratio between Fe and Ca peaks in the 12-MQ sample, it falls along the Ca cluster line. This biplot also confirms the association of samples 6-O and 7-O with the Fe cluster, but it also discriminates them from the rest of the group based on their higher Ca content. As the PC6 value decreases, two more clusters based on the Ca content can be identified for the Fe-based materials: one for Fe-based samples with a PC6 < −0.05 and the other for samples with a PC6 < 0.5. Oil paintings can be seen as a mixture of a pigment and oil whose benchmark is, in this case, Ca, due to impurities. The PC value of samples 6-O, 7-O, and 43-O, for example, falls close to the bisector of the Fe-Ca subspace (Figure 5b) due to the simultaneous presence of these elements. If mixtures of two or more pigments are included in the test set, their value will fall along or close to the bisector of the space generated by the loadings described by their principal elements. In this way they can be easily differentiated from pure pigments. This is true if the concentration of each pigment is high enough to have their major peak intensities be comparable. Otherwise, the most abundant pigment will be treated as if it has impurities coming from other pigment in the mixture, as for example in the case of calcite in earth pigments, as discussed previously. To assess the quality of these observations and to see the clustering of the other injected points an HCA was employed on all the samples in the 10-dimensional PC space (Figure 6). The colors in the dendrogram reflect the 10 clusters found in the previous analysis.
In the dendrogram it can be seen that every injected point belongs to the cluster expected by the observation of the raw spectra. Also, the three sub-clusters of Fe due to the Ca content, as discussed earlier, is evident here. The Fe-based oil sub-cluster supports the idea that mixtures can indeed be meaningfully represented in this PCA space. Additionally, a clear division in the featureless group is observed. This is because of the different nature of the samples: the cluster on the left side (points 43-O, 33, and 43) are all synthetic pigments, thus the impurity concentrations are negligible. The right cluster instead includes natural pigments in which the counts of the trace elements (K for point 23, Fe for 52 and 51) are comparable with the background. With this normalization the effect of the pigment dispersion in oil is mitigated and it only affects the ratio of trace over major elementals, leaving intact the information on the elemental markers. Applying the methodology to more complex samples, such as those combining pigment and binder, reveals that the proposed approach accurately identifies the elemental structure within heterogeneous pigment datasets. An added value is the scalability of the method to further training datasets, alongside the ability to increase the complexity of mock-up samples through ad hoc preparations.

4. Conclusions

This study demonstrates that the integration of unsupervised machine learning techniques with full spectra X-ray fluorescence (XRF) can significantly enhance the elemental studies of historical pigments in paintings. A comparative statistical analysis of the two pre-processing procedures showed the advantages of using the full-spectral data over conventional elemental pre-treatment. The study demonstrates the advantages of the method for the extraction of elemental benchmarks on a highly heterogeneous dataset. The whole-spectrum analysis yielded a complete representation of the dataset, enabling also the recognition of samples containing organic compounds that have low fluorescence line intensities and consequently a low signal-to-noise ratio. These results underscore the importance of preserving complete spectral information, as spectral pre-treatment may overlook key data that could be crucial for identifying historical pigments in heterogeneous datasets as real cases. Applying the PC transformation on oil and samples with different granulometry and purity not employed in the training phase, the method can successfully recognize the benchmarks of this more complex dataset. This demonstrates the potential of this approach for rapid identification of unknown samples, even in complex scenarios involving additives such as binders. This study highlights the value of integrating advanced data processing techniques with spectral analysis to enhance our understanding of historical artworks and their material composition. By basing the training phase on a few simple samples, such as pure pigments, this methodology has demonstrated its potential. Future work will address more complex scenarios, including pigment mixtures and layered structures, to show that rapid and accurate identification of elemental benchmarks remains achievable despite increased data complexity. This approach offers significant advantages in its capacity to simultaneously process extensive datasets, which are particularly useful for interpreting real-world scenarios characterized by high heterogeneity.

Supplementary Materials

The following supporting information can be downloaded at: https://www.mdpi.com/article/10.3390/chemosensors13080314/s1, Table S1: List of the training set samples; ID in the INFRA-ART database [1] and the labels in the PCA and HCA plots. The chemical information available from the pigment producer and in the database are reported in the last column. The INFRA-ART ID for pure pigments is labelled by the letter P followed by a letter that encoded the supplier’s name (K-Kremer, M-Maimeri, SE-Sennelier, SC-Schmincke) followed by the respective catalogue number; Table S2: List of the test set samples, ID in the INFRA-ART database [1] and the labels in the PCA and HCA plots. The chemical information available from the pigment producer and in the database are reported in the last column. All the oil samples are supplied by Maimeri; Figure S1: HCA results on the raw spectra without normalization; Figure S2: HCA results on the net areas normalized with respect the rhodium Compton peak.

Author Contributions

Conceptualization, C.S. and G.F.; formal analysis, I.O.; methodology, C.S. and G.F.; project administrator, G.F.; software, I.O.; supervision, G.F.; writing—original draft: I.O.; writing—review and editing, C.S. and G.F. All authors have read and agreed to the published version of the manuscript.

Funding

This research was funded by CREF—Enrico Fermni Historical Museum and Study and Research Centre in the framework of Physics for Cultural Heritage Laboratory.

Data Availability Statement

This study was carried out using publicly available data from INFRA-ART—Spectral Library at https://infraart.inoe.ro/ (accessed on 19 June 2025).

Conflicts of Interest

The authors declare no conflicts of interest.

References

  1. Coccato, A.; Caggiani, M.C. An overview of Principal Components Analysis approaches in Raman studies of cultural heritage materials. J. Raman Spectrosc. 2024, 55, 125. [Google Scholar] [CrossRef]
  2. Alfeld, M.; Viguerie, L.D. Recent developments in spectroscopic imaging techniques for historical paintings—A review. Spectrochim. Acta Part B At. Spectrosc. 2017, 136, 81–105. [Google Scholar] [CrossRef]
  3. Harth, A. X-ray fluorescence (XRF) on painted heritage objects: A review using topic modeling. Herit. Sci. 2024, 12, 17. [Google Scholar] [CrossRef]
  4. Liu, M.; Wang, Z.; Liu, X. Spectroscopic Techniques for Identifying Pigments in Polychrome Cultural Relics. Coatings. 2025, 15, 20. [Google Scholar] [CrossRef]
  5. Moretti, P.; Zumbühl, S.; Caruso, O.; Gammaldi, N.; Iazurlo, P.; Piqué, F. The Characterization of the Materials Used by Gino Severini in his 20th C Wall Paintings at Semsales in Switzerland. Appl. Sci. 2021, 11, 9161. [Google Scholar] [CrossRef]
  6. Zuena, M.; Pensabene Buemi, L.; Nodari, L.; Subelytė, G.; Stringari, L.; Campanella, B.; Lorenzetti, G.; Palleschi, V.; Tomasin, P.; Legnaioli, S. Portrait of an artist at work: Exploring Max Ernst’s surrealist techniques. Herit. Sci. 2022, 10, 139. [Google Scholar] [CrossRef]
  7. Molari, R.; Appoloni, C.R. Pigment analysis in four paintings by Vincent van Gogh by portable X-ray fluorescence (pXRF). Radiat. Phys. Chem. 2021, 181, 109336. [Google Scholar] [CrossRef]
  8. Zhang, L.; Song, Z.; Zuo, S.; Hou, F.; Chen, S. Precise in-situ detection of inorganic pigments in ancient architectural color paintings by HH-XRF. Herit. Sci. 2023, 11, 230. [Google Scholar] [CrossRef]
  9. Klisińska-Kopacz, A.; Frączek, P.; Obarzanowski, M.; Czop, J. Non-Invasive Study of Pigment Palette Used by Olga Boznańska Investigated with Analytical Imaging, XRF, and FTIR Spectroscopy. Heritage 2023, 6, 1429–1443. [Google Scholar] [CrossRef]
  10. Pimenta, A.; Felix, V.; Oliveira, M.; Andrade, M.; Oliveira, M.; Freitas, R. Investigating Brazilian Paintings from the 19th Century by MA-XRF. Quantum Beam Sci. 2023, 7, 9. [Google Scholar] [CrossRef]
  11. Nardes, R.C.; Popelka-Filcoff, R.; Robertson, J.D.; Glascock, M.; Descantes, C. Analysis of the pigments in two modern Egyptian papyri using XRF technique. Braz. J. Radiat. Sci. 2021, 9, 1–16. [Google Scholar] [CrossRef]
  12. Mzyk, Z.; Baranowska, I.; Mzyk, J. Research on grain size effect in XRF analysis of pelletized samples. X-Ray Spectrom. 2002, 31, 39–46. [Google Scholar] [CrossRef]
  13. Nuchdang, S.; Niyomsat, T.; Pitiphatharabun, S.; Sukhummek, B.; Leelanupat, O.; Rattanaphra, D. Effect of grain size and moisture content on major and minor elements concentrations using portable X-ray fluorescence. J. Phys. Conf. Ser. 2018, 1144, 012060. [Google Scholar] [CrossRef]
  14. Shaltout, A.A.; Welz, B.; Ibrahim, M.A. Influence of the grain size on the quality of standardless WDXRF analysis of river Nile sediments. Microchem. J. 2011, 99, 356–363. [Google Scholar] [CrossRef]
  15. Erlandson, J.M.; Robertson, J.D.; Descantes, C. Geochemical Analysis of Eight Red Ochres from Western North America. Am. Antiq. 1999, 64, 517–526. [Google Scholar] [CrossRef]
  16. Popelka-Filcoff, R.S.; Robertson, J.D.; Glascock, M.D.; Descantes, C. Trace element characterization of ochre from geological sources. J. Radioanal. Nucl. Chem. 2007, 272, 17–27. [Google Scholar] [CrossRef]
  17. Fontana, D.; Alberghina, M.F.; Barracoa, R.; Basilec, S.; Tranchina, L.; Brai, M.; Gueli, A.; Troja, S.O. Historical pigments characterisation by quantitative X-ray fluorescence. J. Cult. Herit. 2014, 15, 266–274. [Google Scholar] [CrossRef]
  18. Izzo, F.C.; Berg, K.J.V.B.; Keulen, H.V.; Ferriani, B.; Zendri, E. Modern Oil Paints—Formulations, Organic Additives and Degradation: Some Case Studies. Issues Contemp. Oil Paint. 2014, 75–104. [Google Scholar] [CrossRef]
  19. Izzo, F.C.; Balliana, E.; Pinton, F.; Zendri, E. A preliminary study of the composition of commercial oil, acrylic and vinyl paints and their behaviour after accelerated ageing conditions. Conserv. Sci. Cult. Herit. 2014, 14, 353–369. [Google Scholar]
  20. Towarek, A.; Halicz, L.; Matwin, S.; Wagner, B. Machine learning in analytical chemistry for cultural heritage: A comprehensive review. J. Cult. Herit. 2024, 70, 64–70. [Google Scholar] [CrossRef]
  21. Andric, V.; Kvascev, G.; Cvetanovic, M.; Cvetanovic, M.; Stojanovic, S.; Bacanin, N.; Gajic-Kvascev, M. Deep learning assisted XRF spectra classification. Sci. Rep. 2024, 14, 3666. [Google Scholar] [CrossRef] [PubMed]
  22. Arjonilla, P.; Domínguez-Vidal, A.; Domene, R.R.; Gómez, E.C.; Torre-López, M.J.D.L.; Ayora-Cañada, M.J. Characterization of Wall Paintings of the Harem Court in the Alhambra Monumental Ensemble: Advantages and Limitations of In Situ Analysis. Molecules 2022, 27, 1490. [Google Scholar] [CrossRef] [PubMed]
  23. Uzunoğlu, Z.; Yılmaz, D.; Şahin, Y. Quantitative x-ray spectrometric analysis with peak to Compton ratios. Radiat. Phys. Chem. 2015, 112, 189–194. [Google Scholar] [CrossRef]
  24. Festa, G.; Scatigno, C.; Armetta, F.; Saladino, M.L.; Ciaramitaro, V.; Nardo, V.M.; Ponterio, R.C. Chemometric Tools to Point Out Benchmarks and Chromophores in Pigments through Spectroscopic Data Analyses. Molecules 2022, 27, 163. [Google Scholar] [CrossRef]
  25. Renda, V.; Nardo, V.M.; Anastasio, G.; Caponetti, E.; Vasi, C.S.; Saladino, M.L.; Armetta, F.; Trusso, S.; Ponterio, R.C. A multivariate statistical approach of X-ray fluorescence characterization of a large collection of reverse glass paintings. Spectrochim. Acta Part B At. Spectrosc. 2019, 159, 105655. [Google Scholar] [CrossRef]
  26. García-Florentino, C.; Maguregui, M.; Morillas, H.; Marcaida, I.; Madariaga, J.M. A fast in situ non-invasive approach to classify mortars from a construction of high historical value. Microchem. J. 2017, 133, 104–113. [Google Scholar] [CrossRef]
  27. Cortea, I.M.; Ghervase, L.; Rădvan, R.; Serițan, G. Assessment of Easily Accessible Spectroscopic Techniques Coupled with Multivariate Analysis for the Qualitative Characterization and Differentiation of Earth Pigments of Various Provenance. Minerals 2022, 12, 755. [Google Scholar] [CrossRef]
  28. Amadori, M.L.; Poldi, G.; Germinario, G.; Arduini, J.; Mengacci, V. Spectroscopic and Imaging Analyses on Easel Paintings by Giovanni Santi. Appl. Sci. 2023, 13, 3581. [Google Scholar] [CrossRef]
  29. Sherman, J. The theoretical derivation of fluorescent X-ray intensities from mixtures. Spectrochim. Acta. 1955, 7, 283–306. [Google Scholar] [CrossRef]
  30. Rousseau, R.M. Corrections for matrix effects in X-ray fluorescence analysis—A tutorial. Spectrochim. Acta Part B At. Spectrosc. 2006, 61, 759–777. [Google Scholar] [CrossRef]
  31. Scatigno, C.; Teodonio, L.; Rocco, E.D.; Festa, G. Spectroscopic Benchmarks by Machine Learning as Discriminant Analysis for Unconventional Italian Pictorialism Photography. Polymers 2024, 16, 1850. [Google Scholar] [CrossRef]
  32. Armetta, F.; Saladino, M.L.; Martinelli, M.C.; Vilardo, R.; Anastasio, G.; Trusso, S.; Nardo, V.M.; Giuffrida, D.; Ponterio, R.C. Improved chemometric approach for XRF data treatment: Application to the reverse glass paintings from the Lipari collection. RSC Adv. 2023, 13, 4495–4503. [Google Scholar] [CrossRef]
  33. Sciutto, G.; Oliveri, P.; Prati, S.; Quaranta, M.; Bersani, S.; Mazzeo, R. An advanced multivariate approach for processing X-ray fluorescence spectral and hyperspectral data from non-invasive in situ analyses on painted surfaces. Anal. Chim. Acta. 2012, 752, 30–38. [Google Scholar] [CrossRef]
  34. Capobianco, G.; Pelosi, C.; Agresti, G.; Bonifazi, G.; Santamaria, U.; Serrant, S. X-ray fluorescence investigation on yellow pigments based on lead, tin and antimony through the comparison between laboratory and portable instruments. J. Cult. Herit. 2018, 29, 19–29. [Google Scholar] [CrossRef]
  35. Cortea, I.M.; Chiroşca, A.; Angheluţă, L.M.; Seriţan, G. INFRA-ART: An Open Access Spectral Library of Art-related Materials as a Digital Support Tool for Cultural Heritage Science. J. Comput. Cult. Herit. 2023, 40, 11. Available online: https://infraart.inoe.ro/ (accessed on 19 June 2025). [CrossRef]
  36. Habashi, F. Pigments through the Ages. Interceram-Int. Ceram. Rev. 2016, 65, 4–5. [Google Scholar] [CrossRef]
  37. Švarcová, S.; Hradil, D.; Hradilová, J.; Čermáková, Z. Pigments—Copper-based greens and blues. Archaeol Anthr. Sci. 2021, 13, 190. [Google Scholar] [CrossRef]
  38. Barnett, J.R.; Miller, S.; Pearce, E. Colour and art: A brief history of pigments. Opt. Laser Technol. 2006, 38, 445–453. [Google Scholar] [CrossRef]
Figure 1. Examples of XRF spectra from the training and validation datasets: (a) Raw spectra of powder pigments, representative of 6 elemental classes. From top to bottom: Verdigris—Cu, Naples yellow—Pb, Bianco Sangiovanni—Ca, Red ochre from Andalusia—Fe, Alizarin—featureless class. (b) Comparison of Verona green earth and cadmium yellow pigment powder (black and green lines, respectively) and the same pigments in a mixture of poppy seed and safflower oil (red and blue lines, respectively). Here the effect of the dispersion in the medium is shown as the intensity of the main line is highly reduced. Also, in the cadmium yellow sample, the contamination from the Zn present in the oil binder is shown [18]. (c) Effect of purity and granulometry on the XRF spectra of Lapis Lazuli. The very fine sample (black line) has the highest Ca-Kα counts and a lower level of contamination from Fe while the medium quality sample (green line) shows the highest content of Fe. Every point of this set is labeled with the number of the respective powder pigments with an ID based on their characteristics: O for oil pigments; MQ for medium quality powders; and VF, F, and B for very fine, fine, and large pieces of pigments as reported in Table S2.
Chemosensors 13 00314 g001
Figure 2. PCA and HCA on the net peak area matrix: (a) Loading plot for PC1 to PC5 for the PCA on the 50 × 22 data matrix. PC6 and PC7 are not shown for clarity. (b) Hierarchical clustering analysis on the normalized data lines matrix. Different colors are used to highlight the groups identified in the seven PCs space: orange for Fe, green for As/Pb, red for Ca, violet for Cu, brown for Zn and Cd, pink for Hg, and gray for the other groups. The color code follows the scheme in Figure 1a, except for the Cu cluster, which is discriminated by PC3 along with Ca. In this case, PC3 is highlighted in red.
Chemosensors 13 00314 g002
Figure 3. Loading plots matrix 50 × 2022. (a) Biplot of PC1 vs. PC2. It shows the blue point corresponding to the loading values for Fe, while the red points represent the samples. For clarity, only the Fe loading point is included, providing significant information in this space. Aside from point 26, points in the first quadrant are not labeled for clarity (points 2, 6, 7, 13, 14, 16, 20, 22, 24, 25, 28, 29, 30, 31, 32, 34, 35, 36, 38, 39, 41, 42, and 45) (b) PC1 loading plot as a function of the energy. The instrumental and environmental contributions are highlighted alongside with the Fe-Kα line. (c) Loading plots from PC2 to PC6. For the heavier elements, the Lα lines for Pb and Hg are shown as the main peaks, while Kα lines are used for the other elements (Ca, Ti, Cr, Fe, Co, Cu, Zn, As, Se, and Cd). Because of the overlap between Pb-Lα (10.55 keV) and As-Kα (10.54 keV), the respective β1 lines are also displayed. In the PC5 loadings, the As-Kβ peak shows an asymmetric shape, which is due to the contribution from Hg-Lβ. (d) Loading plots for PC7 to PC10. The labels for the lines shown in the previous plot have been omitted for clarity, except for Zn and Cd. These elements’ lines are emphasized here to highlight the ability of these PCs to discriminate between Zn and Cd.
Chemosensors 13 00314 g003
Figure 4. Hierarchical clustering analysis on the normalized data for the subspace generated by the first 10 PCs. Each color identifies clusters based on the features extracted from the loadings: orange—background-dominant samples; green—Fe-based pigments; red—As/Pb; violet—Cu; brown—Hg; pink—Cd and Zn; gray—Ca; yellow—the others. The color code reflects the choice of Figure 3b and Figure 4. The Cd and Zn clusters are highlighted in pink as they are discriminated against by PC8. PC7, PC9, and PC10 describe the yellow cluster.
Chemosensors 13 00314 g004
Figure 5. (a) Biplot of PC1 vs PC2 for all samples. For clarity only the labels of the training points 1, 3, 10, 12, 19, 23, 33, 37, 43, and 49 are shown (the omitted points are labeled in Figure 3a). (b) Biplot of PC2 vs PC6 for all the samples. For clarity training points of the Fe cluster with PC6 < −0.05 are not labeled (points 2, 7, 13, 14, 16, 22, 24, 25, 28, 30, 31, 34, 36, 38, 39, 41, and 42). Points 46 and 47 are hidden by points 47-O and 46-O. The color code is the same for both plots: blue points correspond to the loading values for Fe and Ca, while green and red points represent validation and training samples, respectively.
Chemosensors 13 00314 g005
Figure 6. Hierarchical cluster analysis on all the 71 samples after evaluating the validation set in the 10-dimensional principal components representation. From left to right, the clusters highlighted are as follows: the featureless group, Fe-, As- and Pb-, Ca-, Cu-, Cd-, Hg-, Zn-, Se-based materials, and the heterogeneous group of Co-, Ti-, and Cr-based pigments.
Chemosensors 13 00314 g006
Disclaimer/Publisher’s Note: The statements, opinions and data contained in all publications are solely those of the individual author(s) and contributor(s) and not of MDPI and/or the editor(s). MDPI and/or the editor(s) disclaim responsibility for any injury to people or property resulting from any ideas, methods, instructions or products referred to in the content.