Electrochemical Sensing of Dopamine Neurotransmitter by Deep Eutectic Solvent–Carbon Black–Crosslinked Chitosan Films: Charge Transfer Kinetic Studies and Biological Sample Analysis

 , and
, and 
Abstract
1. Introduction
2. Experimental Procedure
2.1. Reagents, Materials and Solutions
2.2. Preparation of Deep Eutectic Solvents
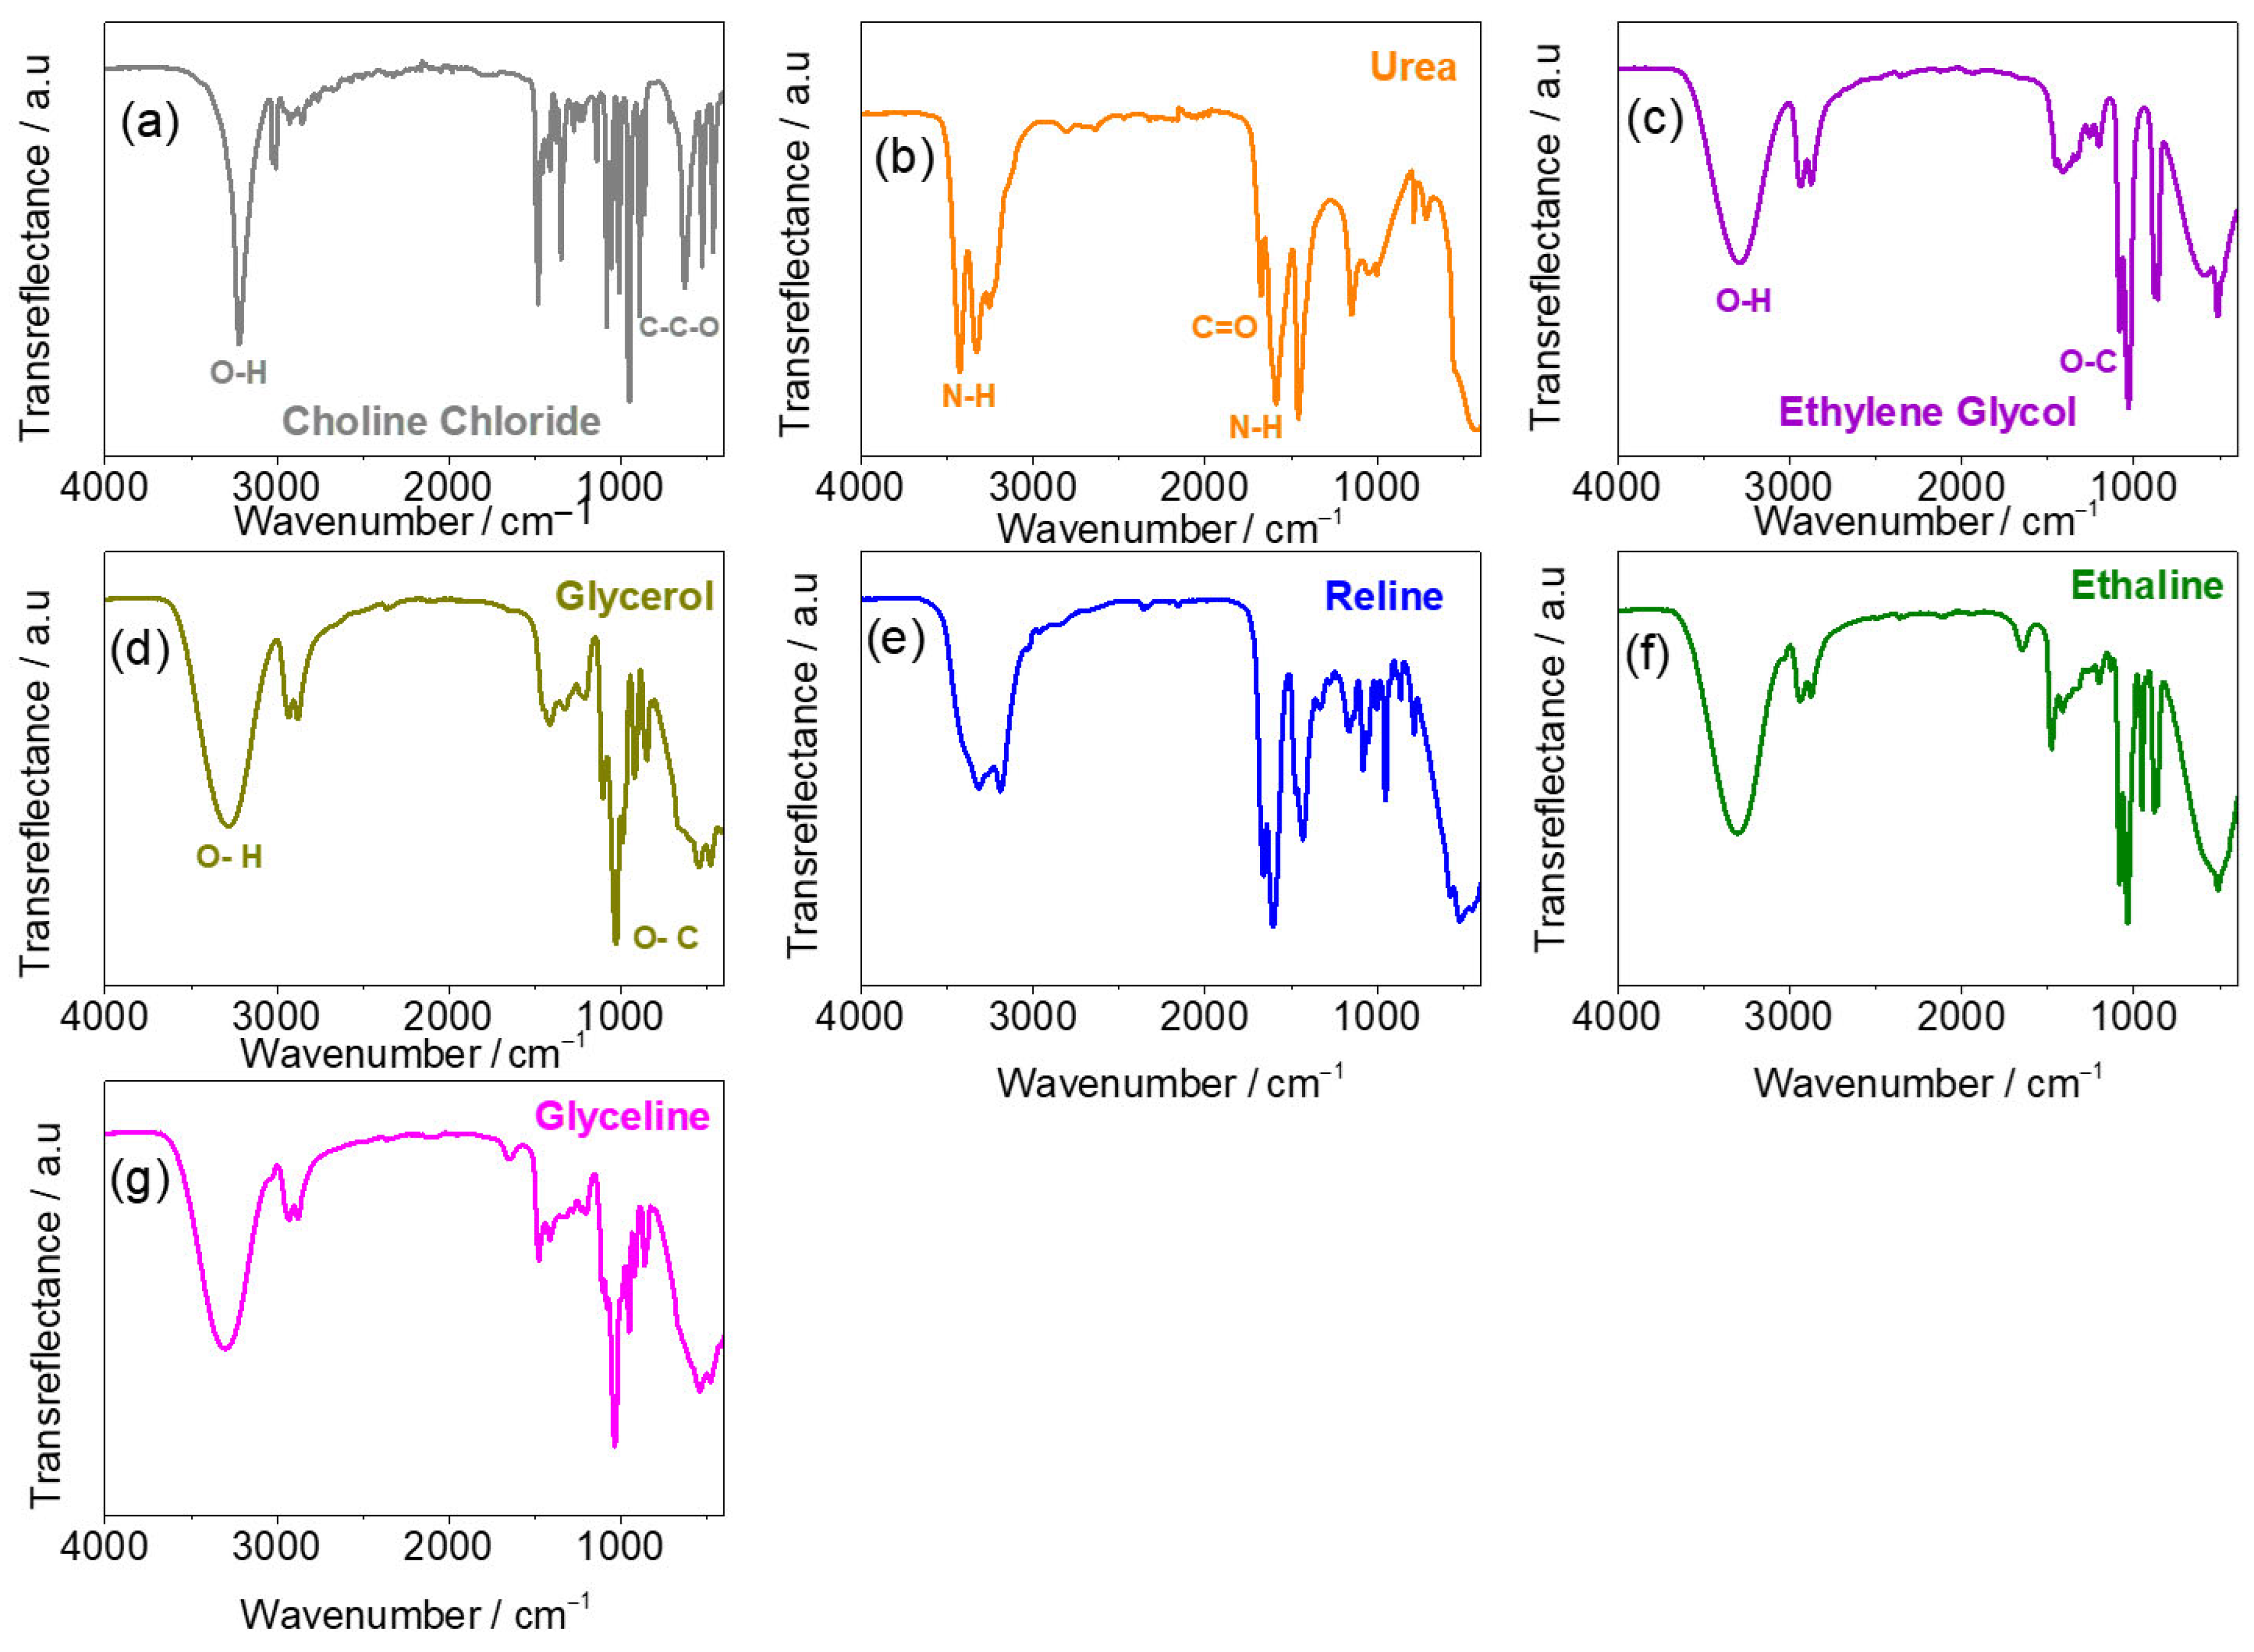
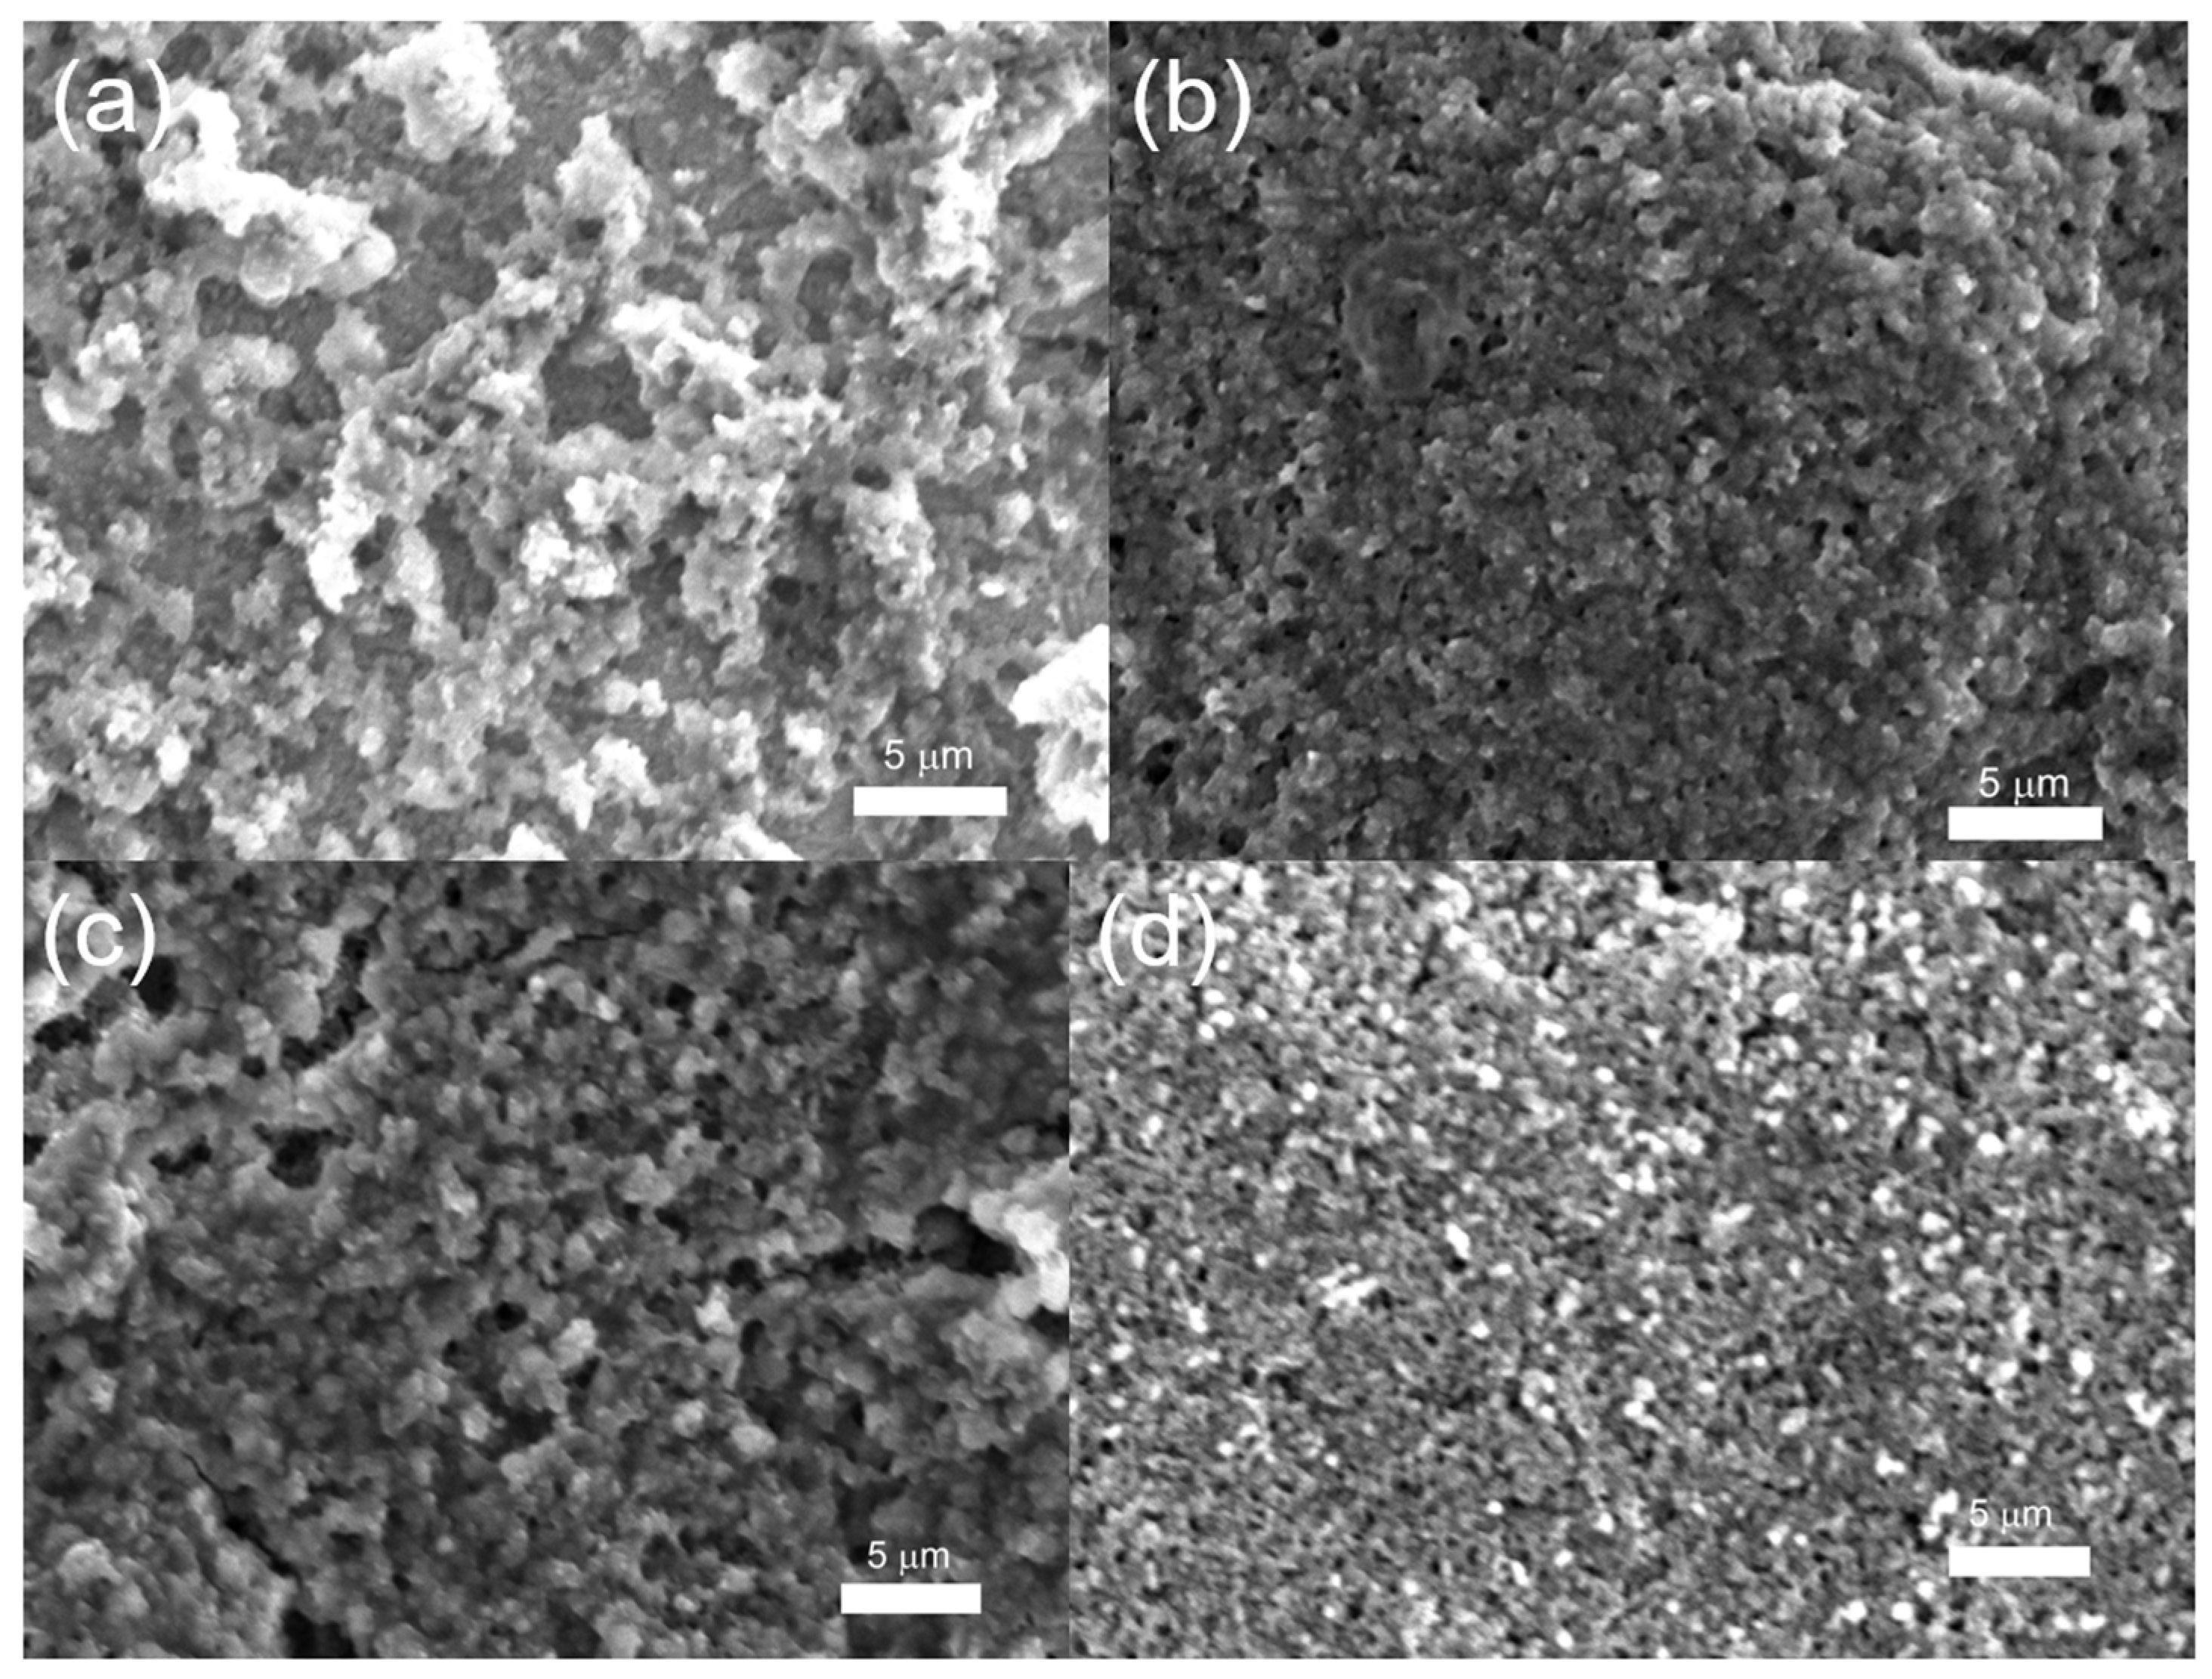
2.3. Characterization of DESs and Films
2.4. Preparation of Modified Electrodes Based on DES–CB Films
2.5. Electrochemical Assays
2.6. Analysis of Synthetic Urine Samples
3. Results and Discussion
3.1. Characterization of DESs and DES-CB Films
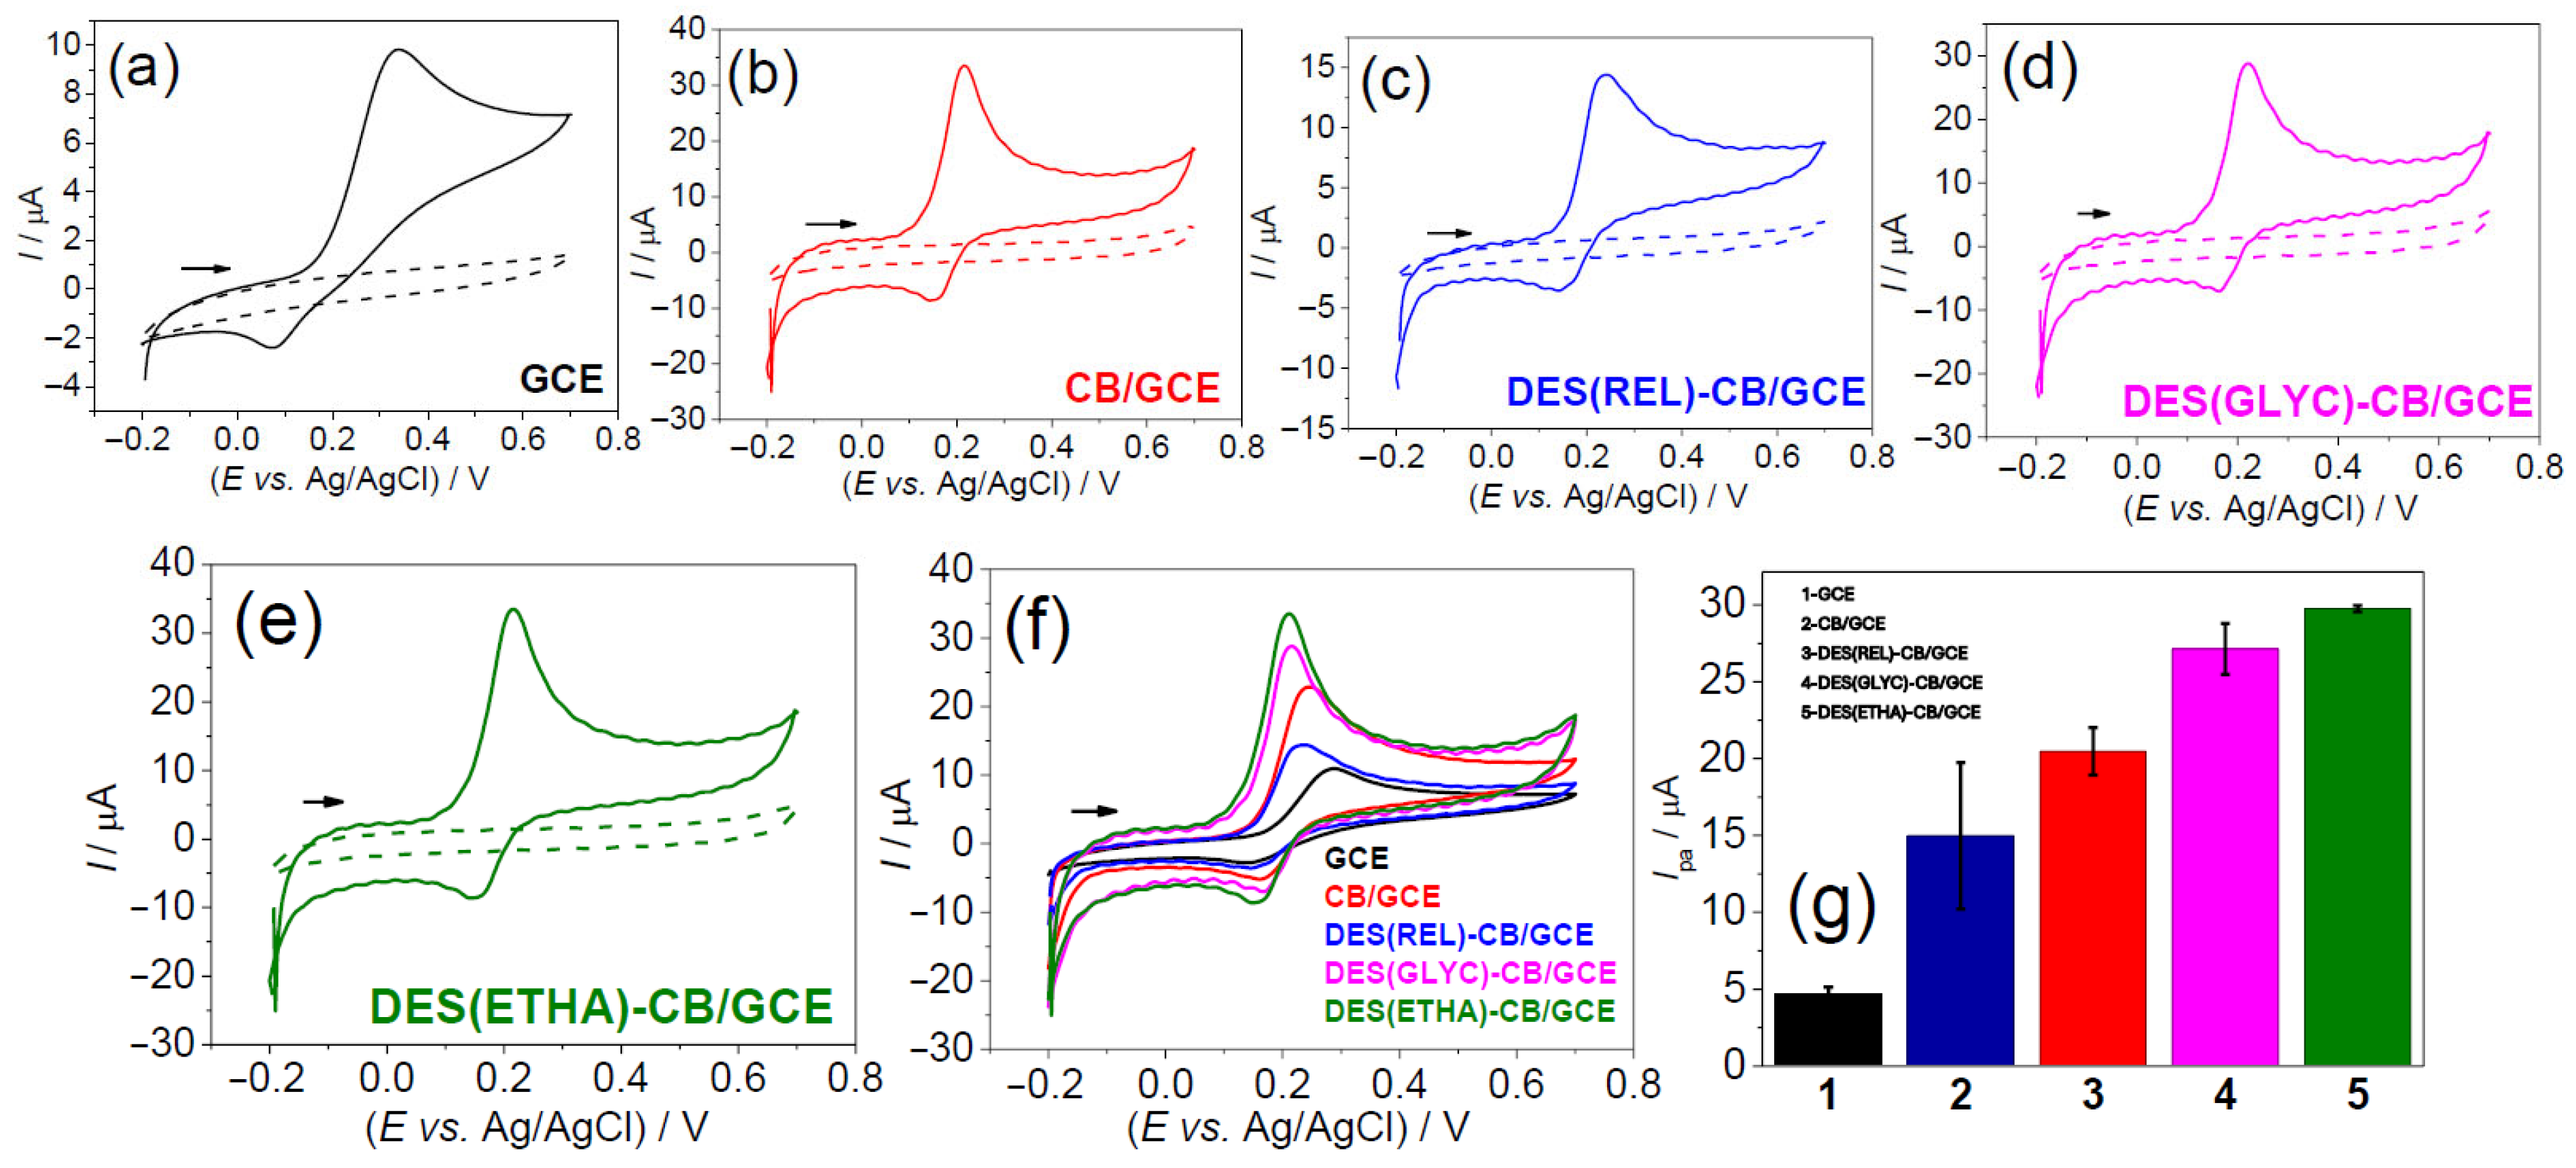
3.2. Electrochemical Response of Dopamine on DES-CB/GCE
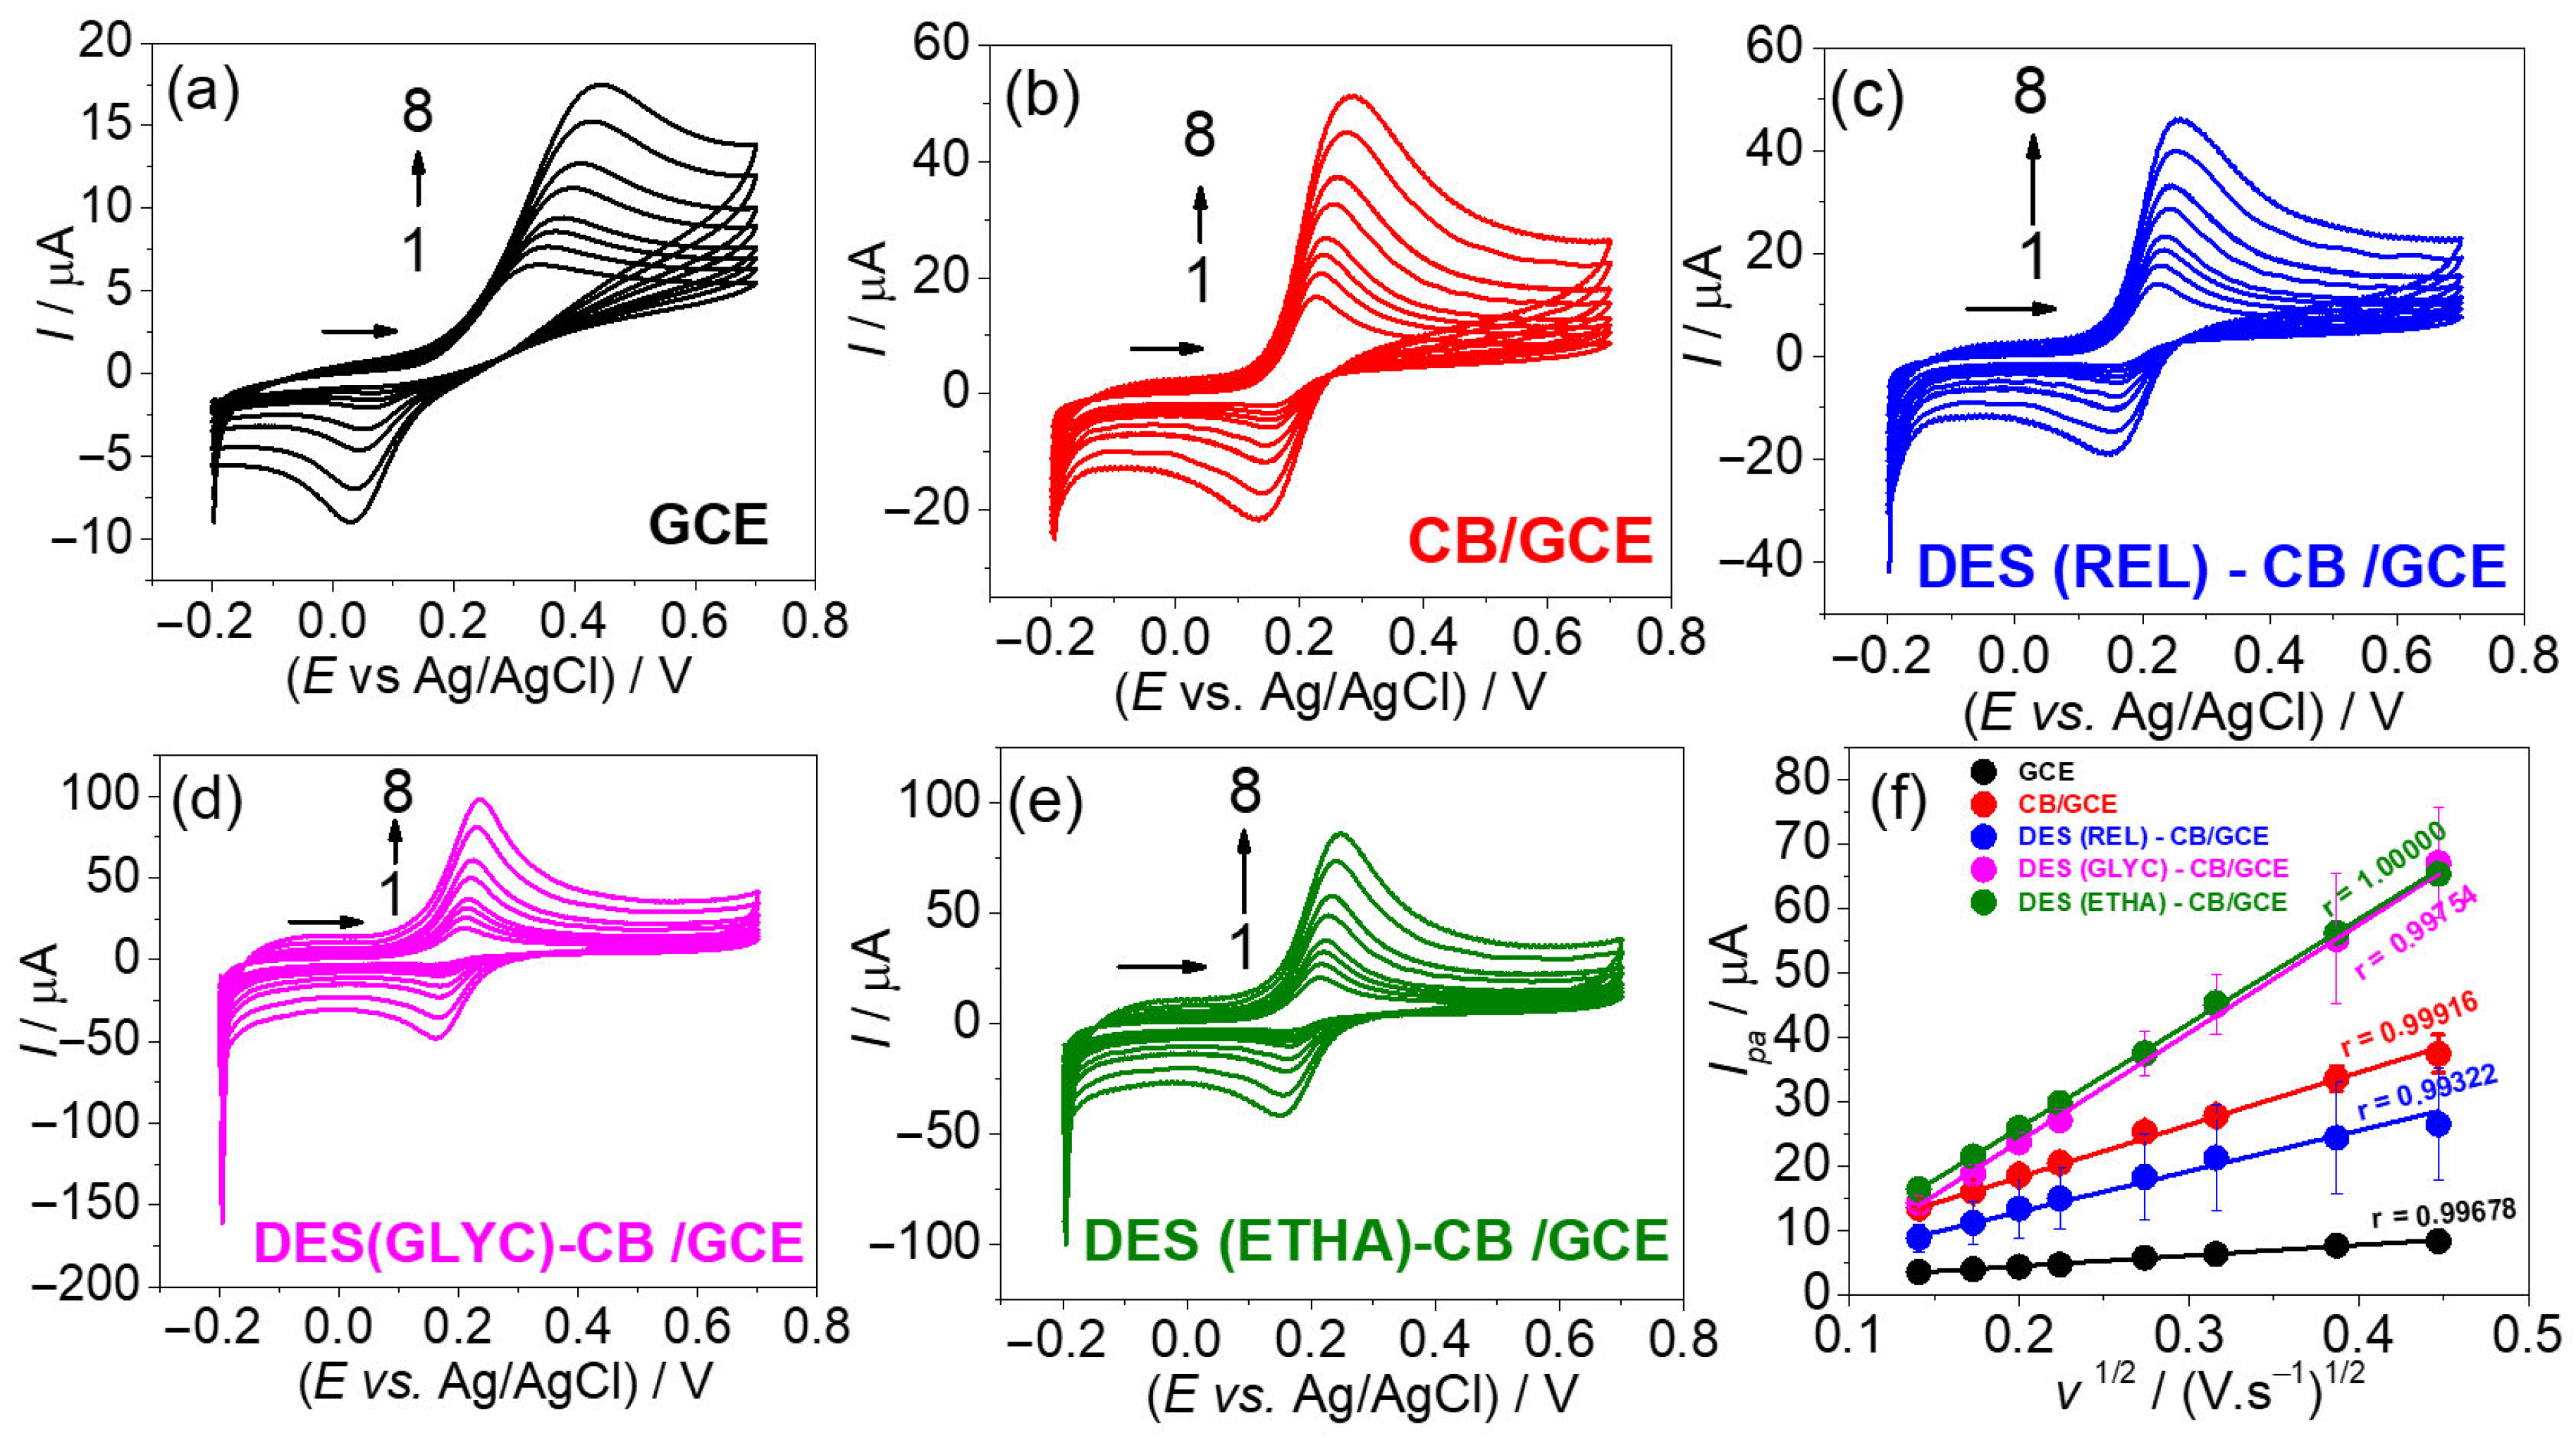
3.2.1. Effects of Scan Rates: Determination of Heterogeneous Electron Transfer Rate Constant (k0)
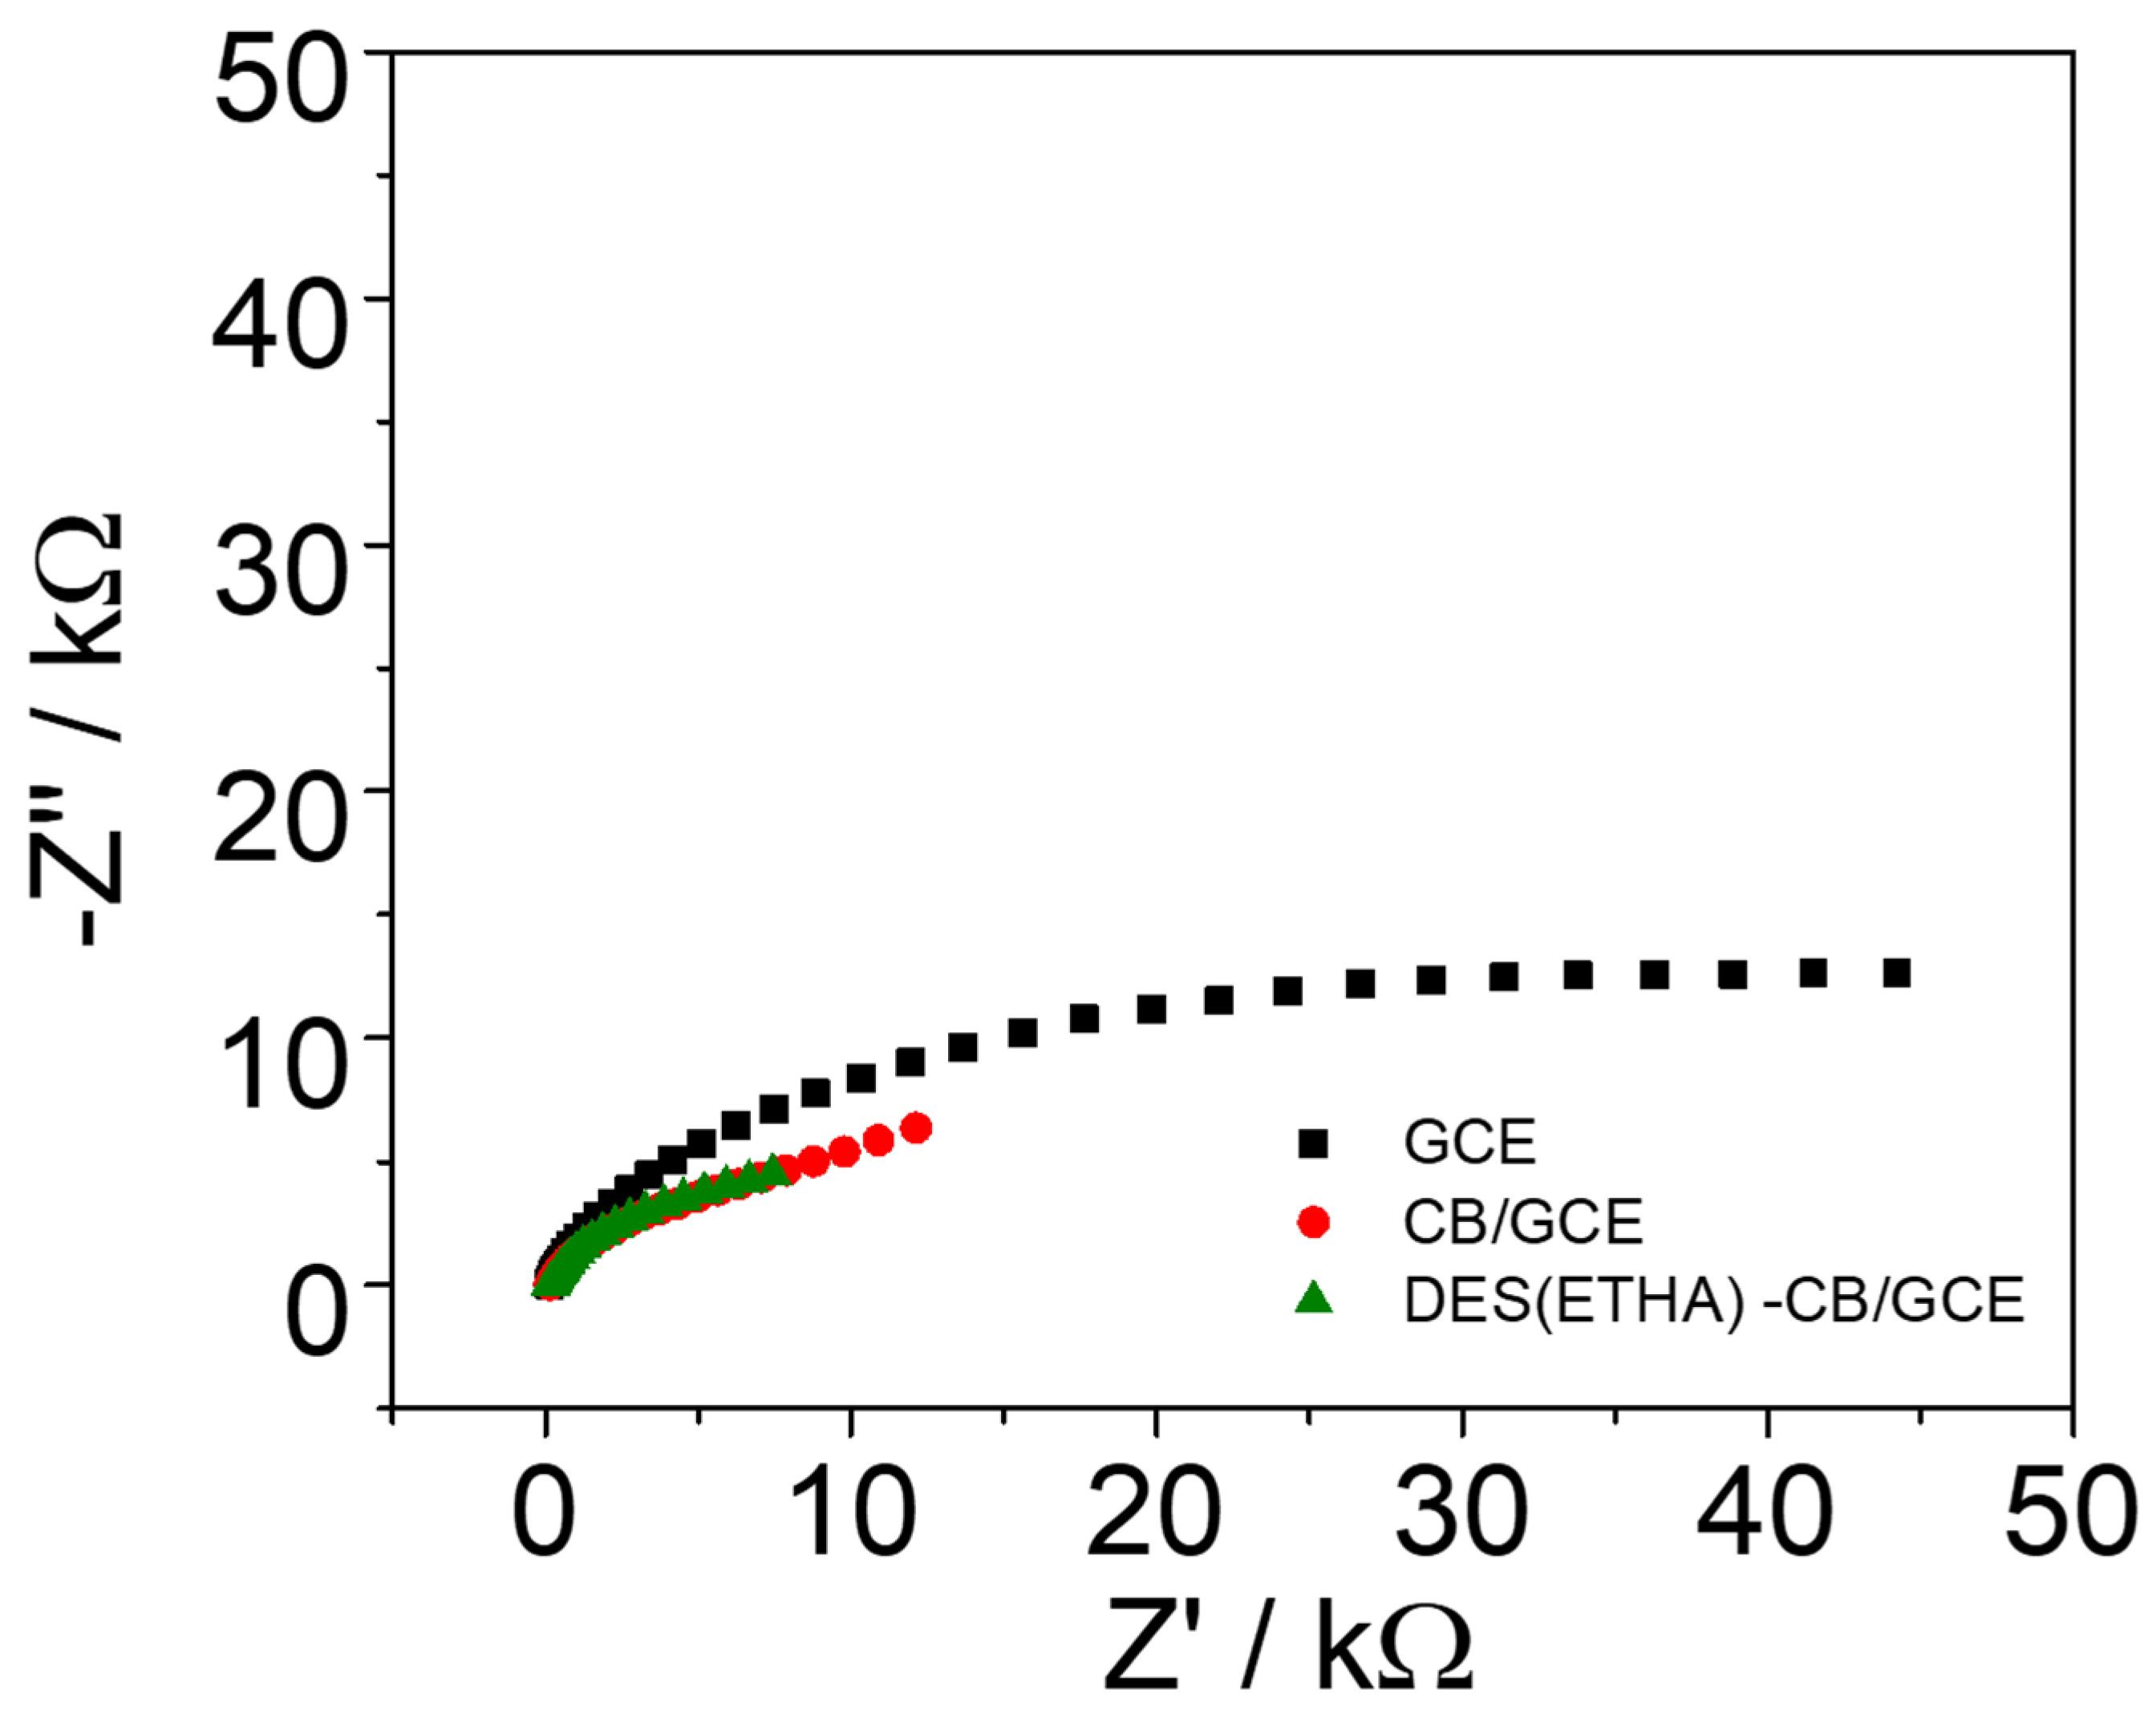
3.2.2. EIS Study
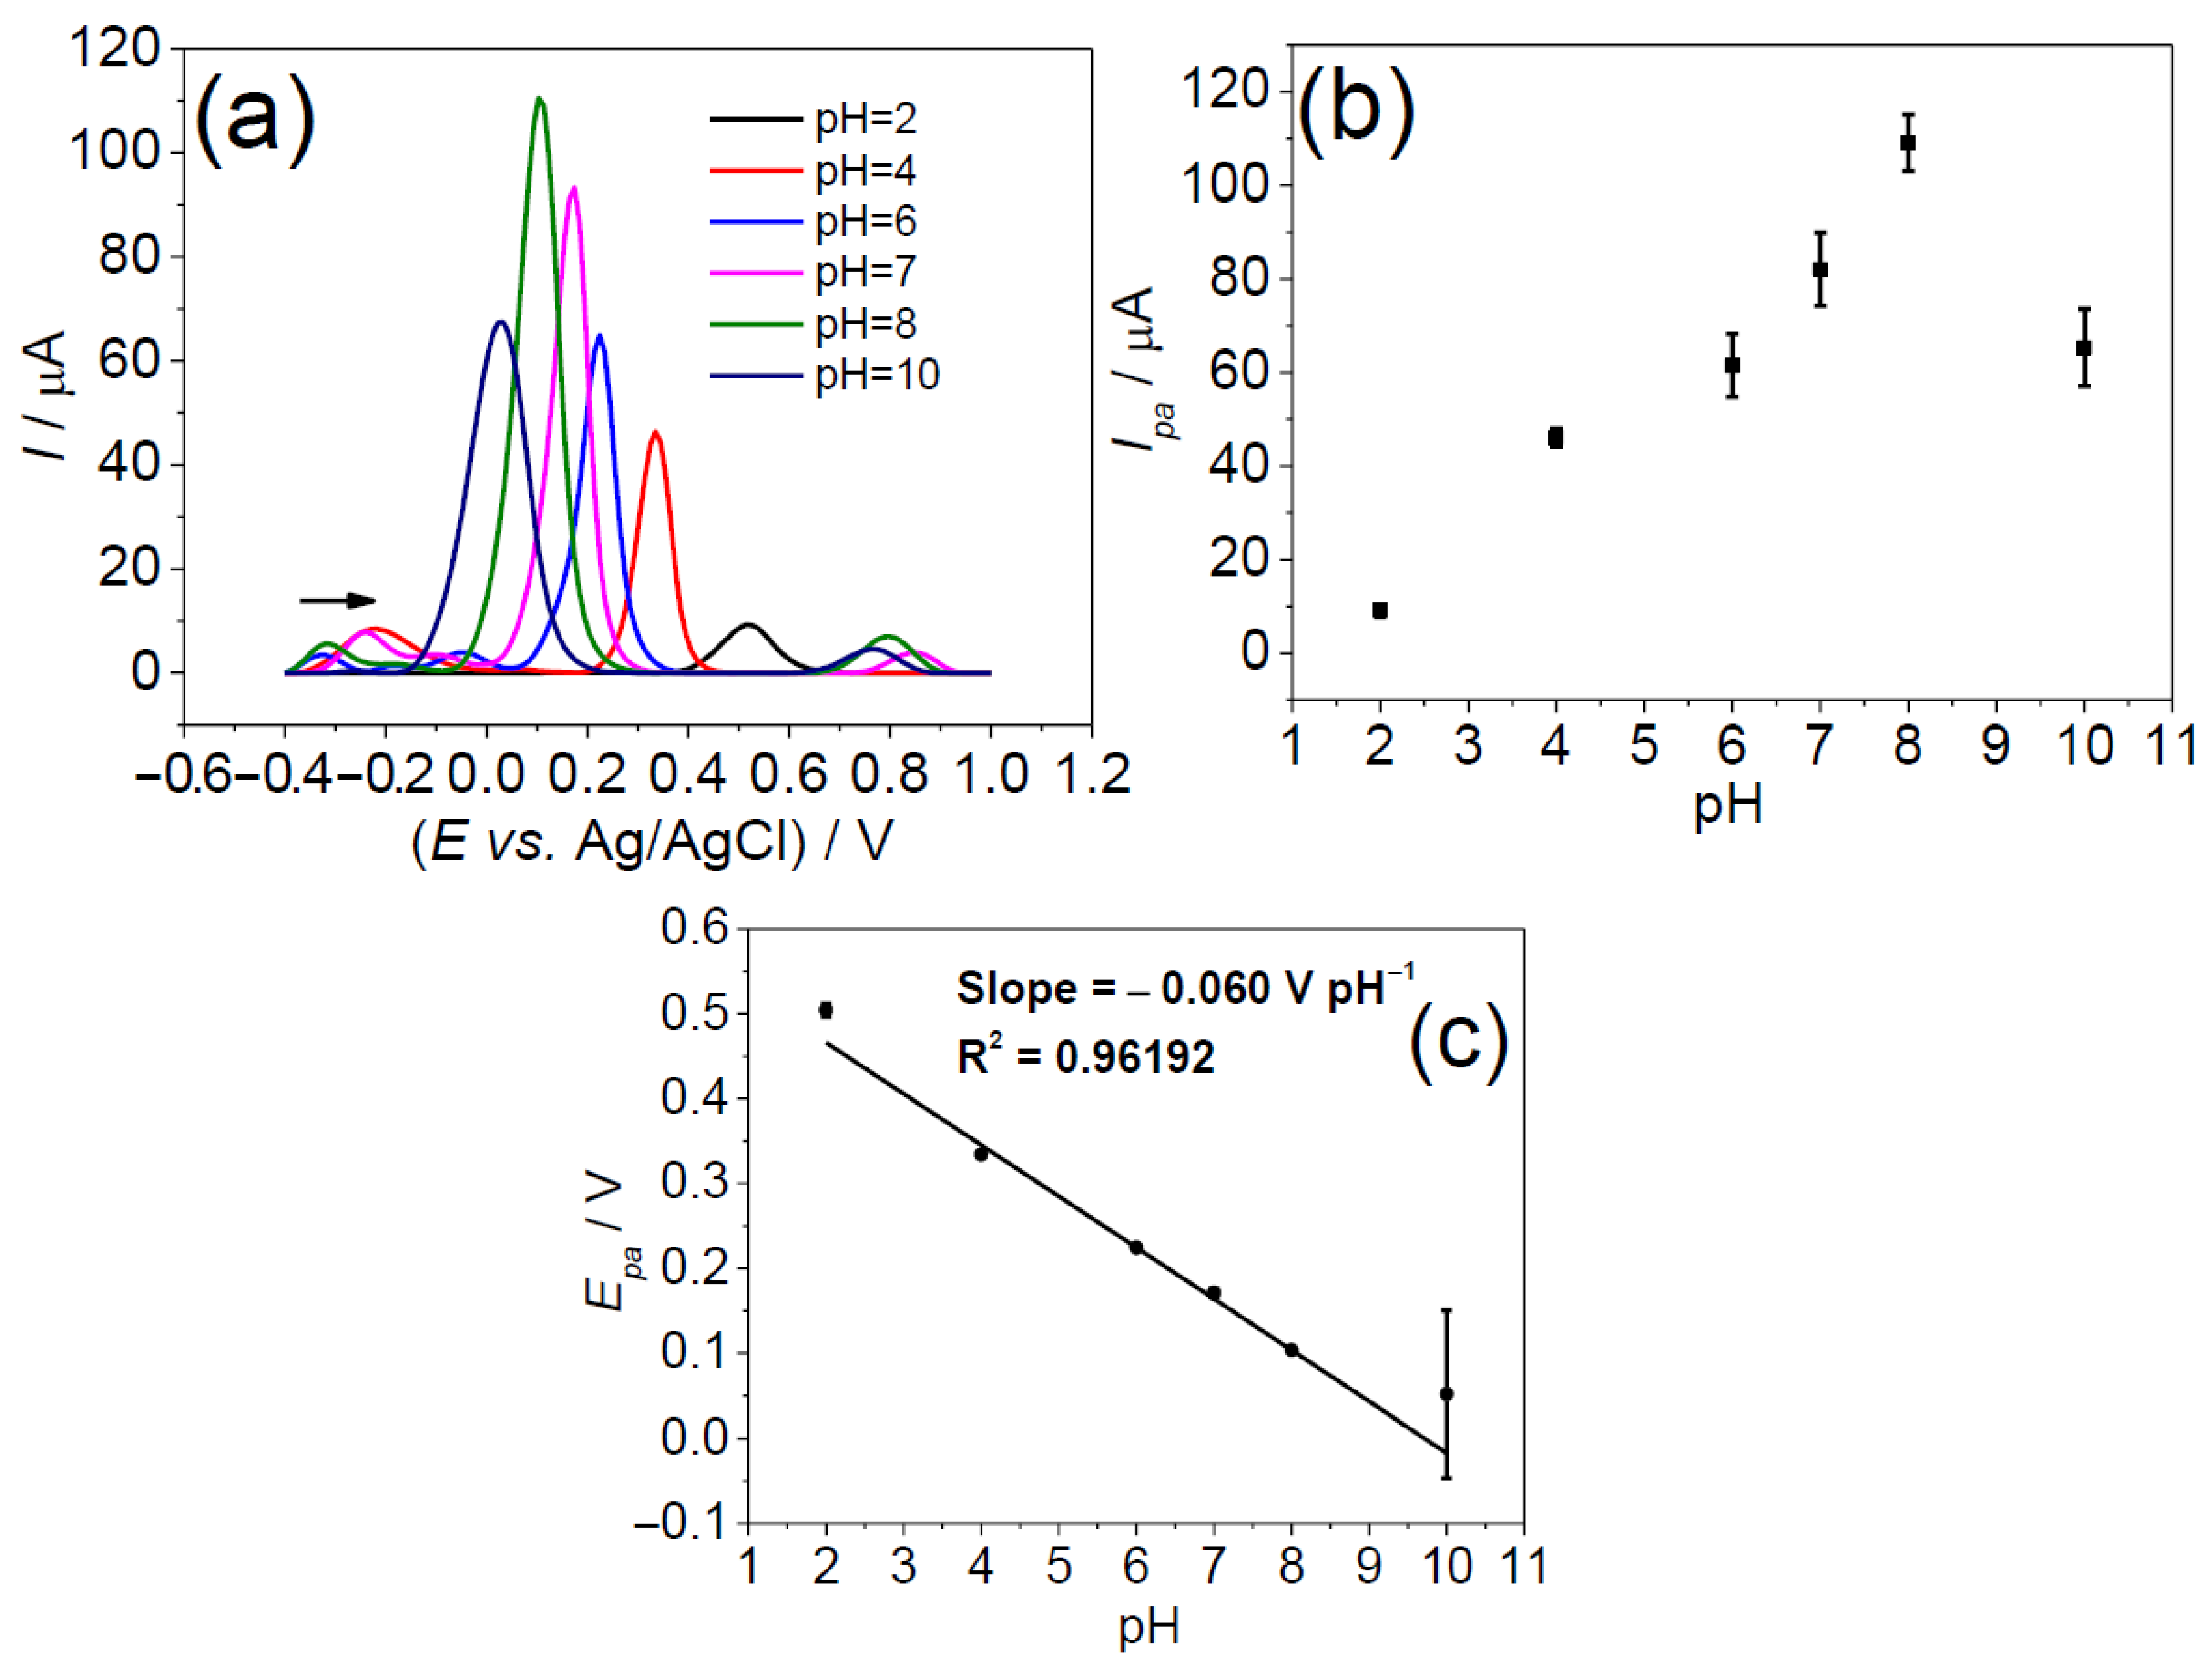
3.2.3. Effect of pH
3.3. Optimization of DPV Parameters
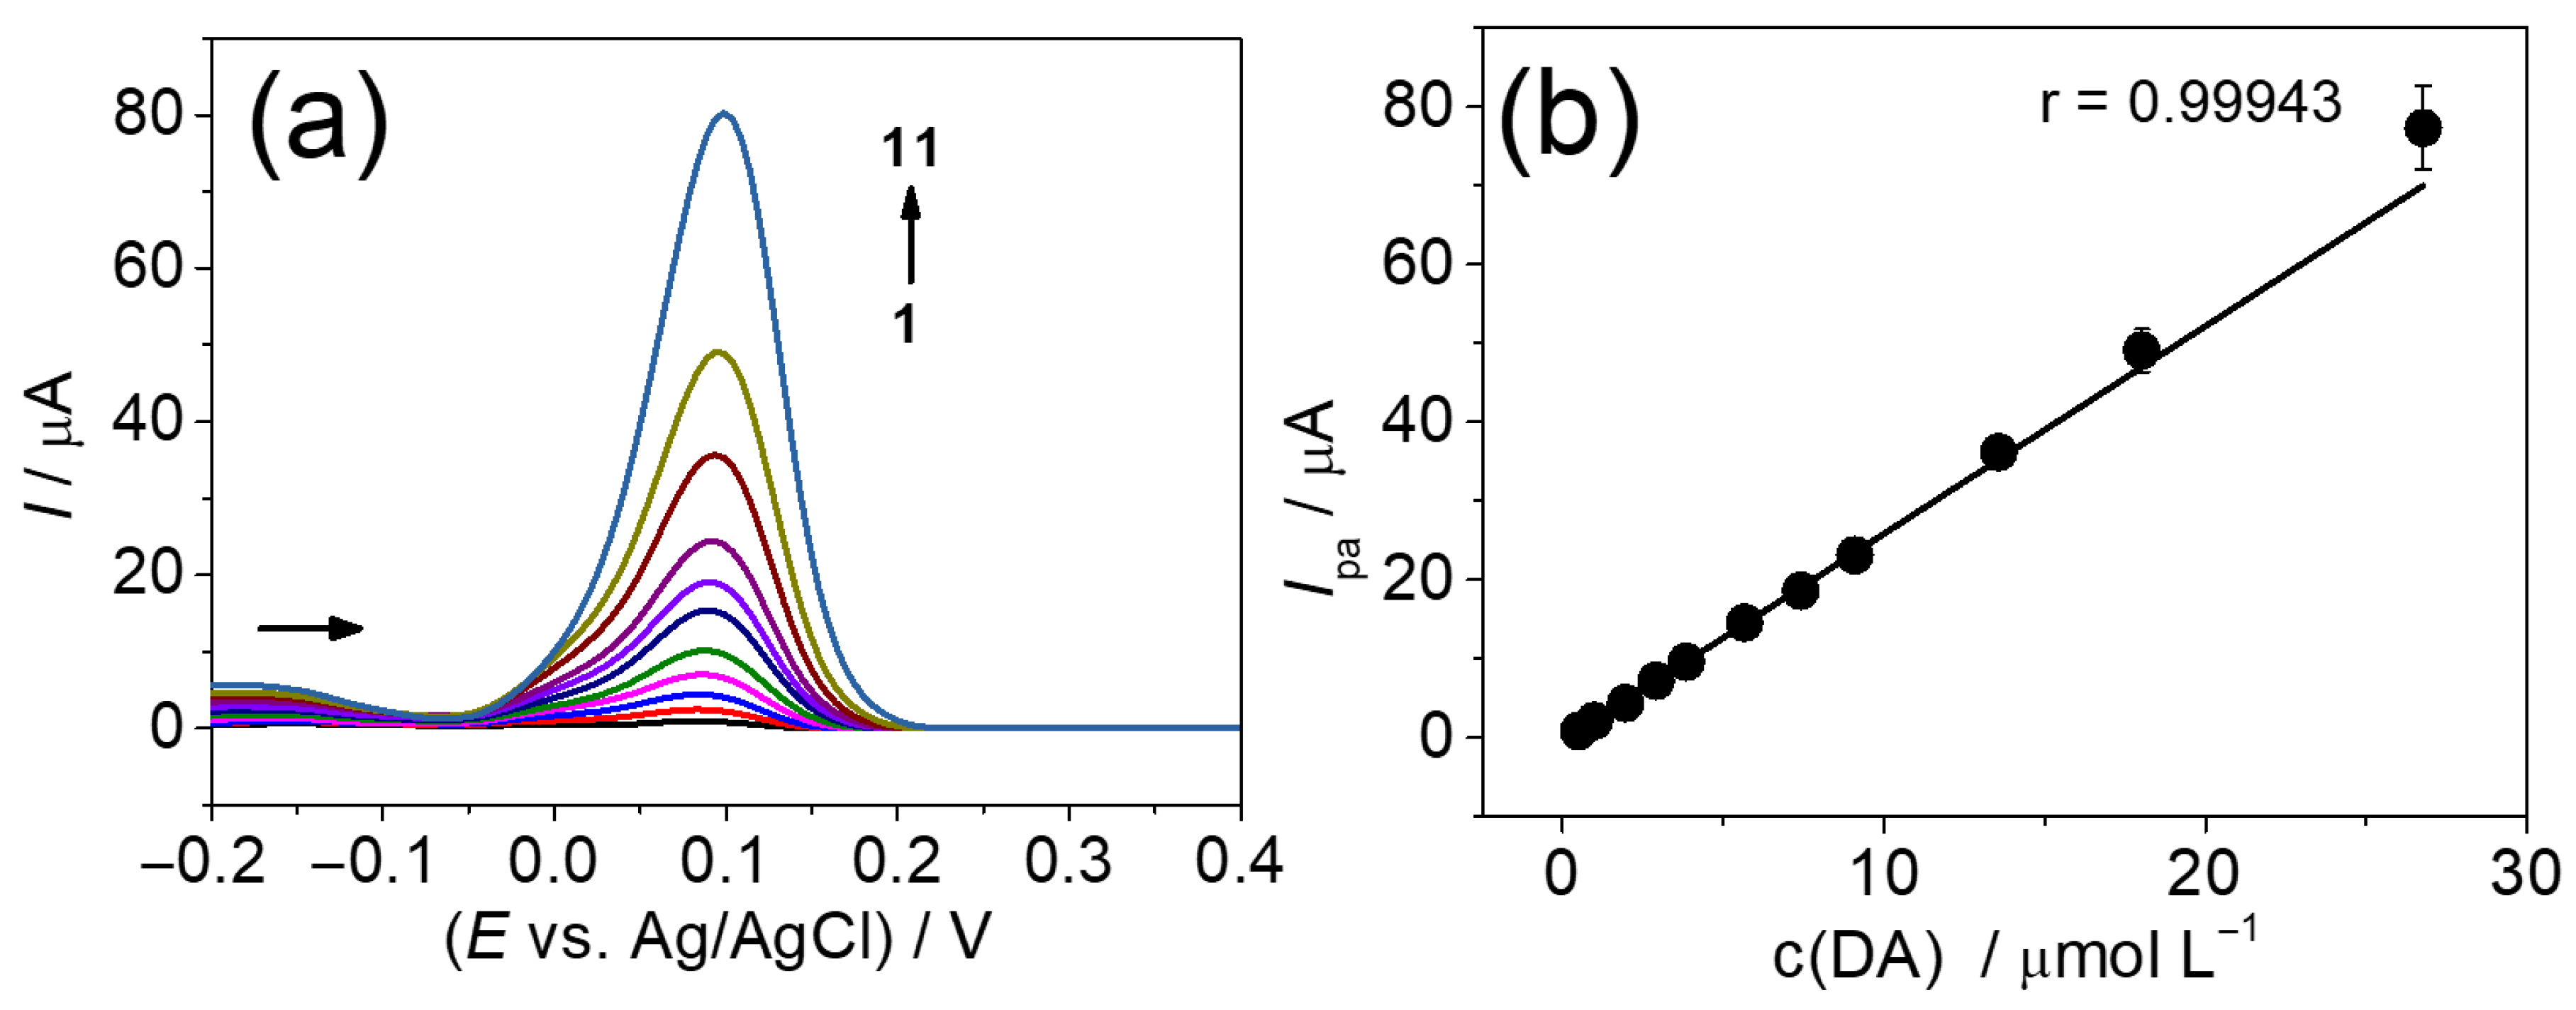
3.4. Analytical Determination of Dopamine
3.4.1. Repeatability Tests and Interference Study
3.4.2. Recovery Assays
4. Conclusions
Supplementary Materials
Author Contributions
Funding
Institutional Review Board Statement
Informed Consent Statement
Data Availability Statement
Conflicts of Interest
References
- Zhang, M.; Wang, Y.; Jiang, J.; Jiang, Y.; Song, D. The Role of Catecholamines in the Pathogenesis of Diseases and the Modified Electrodes for Electrochemical Detection of Catecholamines: A Review. Crit. Rev. Anal. Chem. 2024, 10, 1–22. [Google Scholar] [CrossRef]
- Srinivas, S.; Senthil Kumar, A. Surface-Activated Pencil Graph. Electrode for Dopamine Sensor Applications: A Critical Review. Biosensors 2023, 13, 353. [Google Scholar] [CrossRef]
- Hussain, T.; Lokhandwala, M.F. Renal Dopamine Receptor Function in Hypertension. Hypertension 1998, 32, 187–197. [Google Scholar] [CrossRef] [PubMed]
- Cramb, K.M.; Beccano-Kelly, D.; Cragg, S.J.; Wade-Martins, R. Impaired dopamine release in Parkinson’s disease. Brain 2023, 146, 3117–3132. [Google Scholar] [CrossRef]
- Pan, X.; Kaminga, A.C.; Wen, S.W.; Wu, X.; Acheampong, K.; Liu, A. Dopamine and Dopamine Receptors in Alzheimer’s Disease: A Systematic Review and Network Meta-Analysis. Front. Aging Neurosci. 2019, 11, 175. [Google Scholar] [CrossRef]
- Dailly, E.; Chenu, F.; Renard, C.E.; Bourin, M. Dopamine, depression and antidepressants. Fundam. Clin. Pharmacol. 2004, 18, 601–607. [Google Scholar] [CrossRef] [PubMed]
- Park, C.; Rhyu, H.; Jo, S.; Kang, M.H.; Kang, Y.C.; Song, W.; Myung, S. Electrochemical sensor based on laser-induced graphene and CeO2 for sensitive and selective dopamine detection. J. Electroanal. Chem. 2025, 977, 118865. [Google Scholar] [CrossRef]
- Kumar, S.; Sharma, R.; Singh, D.; Awasthi, A.; Kumar, V.; Singh, K. Tungsten sulphide decorated carbon nanotube based electroanalytical sensing of neurotransmitter dopamine. Electrochim. Acta 2024, 475, 143584. [Google Scholar] [CrossRef]
- Ren, S.; Feng, R.; Guo, T.; Cao, L.; Lv, R.; Liu, X.; Zheng, Z. Electroanalytical sensor based on CuInSe2/carbon sphere towards the non-invasive determination of dopamine. Electroanalysis 2023, 35, e202300203. [Google Scholar] [CrossRef]
- Sliesarenko, V.; Bren, U.; Lobnik, A. Fluorescence based dopamine detection. Sens. Actuators Rep. 2024, 7, 100199. [Google Scholar] [CrossRef]
- Wang, C.; Shi, H.; Yang, M.; Yan, Y.; Liu, E.; Ji, Z.; Fan, J. A novel nitrogen-doped carbon quantum dots as effective fluorescent probes for detecting dopamine. J. Photochem. Photobiol. A Chem. 2020, 391, 112374. [Google Scholar] [CrossRef]
- Pérez-Fernández, V.; Harman, D.G.; Morley, J.W.; Cameron, M.A. Optimized Method to Quantify Dopamine Turnover in the Mammalian Retina. Anal. Chem. 2017, 89, 12276–12283. [Google Scholar] [CrossRef]
- Yoon, H.J.; Kim, J.H.; Oh, M.S.; Hong, S.P.; Kwon, H.J. Simultaneous Quantification of Biogenic Amines and their Metabolites in Mice Tissue by Combining Ultraviolet and Integrated Pulsed Amperometric Detectors. J. Chromatogr. Sci. 2025, 63, bmaf004. [Google Scholar] [CrossRef]
- Lin, Z.; Abbott, J.; Karuso, P.; Wong, D.K. Advances in electroanalytical sensing of volatile organic compounds towards field-deployable detection. TrAC Trends Anal. Chem. 2025, 183, 118101. [Google Scholar] [CrossRef]
- Fredj, Z.; Singh, B.; Bahri, M.; Qin, P.; Sawan, M. Enzymatic Electrochemical Biosensors for Neurotransmitters Detection: Recent Achievements and Trends. Chemosensors 2023, 11, 388. [Google Scholar] [CrossRef]
- Karim, A.; Yasser, M.; Ahmad, A.; Natsir, H.; Wahab, A.W.; Fauziah, S.; Taba, P.; Pratama, I.; Rajab, A.; Abubakar, A.N.F.; et al. A review: Progress and trend advantage of dopamine electrochemical sensor. J. Electroanal. Chem. 2024, 959, 118157. [Google Scholar] [CrossRef]
- Wei, M.; Yuan, Y.; Chen, D.S.; Tong, W.; Lu, W.; Pan, L. A systematic review on electrochemical sensors for the detection of acetaminophen. Anal. Methods 2024, 16, 6134–6155. [Google Scholar] [CrossRef]
- Moutcine, A.; Laghlimi, C.; Ziat, Y.; El Bahraoui, S.; Belkhanchi, H.; Jouaiti, A. Advanced design of chemically modified electrodes for the electrochemical analysis of uric acid and xanthine. J. Pharm. Biomed. Anal. 2025, 253, 116536. [Google Scholar] [CrossRef]
- Vicentini, F.C.; Silva, T.A.; Fatibello-Filho, O. Carbon black electrodes applied in electroanalysis. Curr. Opin. Electrochem. 2024, 43, 101415. [Google Scholar] [CrossRef]
- Chauhan, R.; Fogel, R.; Purcarea, C.; Necula-Petrareanu, G.; Fanjul-Bolado, P.; Ibañez, D.; Vasilescu, A.; Banciu, R.M.; Limson, J. Electrochemical characterization of carbon black in different redox probes and their application in electrochemical sensing. Carbon Trends 2024, 17, 100408. [Google Scholar] [CrossRef]
- Heredia, V.; Vegas, J.; Espinoza, L.; Flores, E.; Navarro, F.; Lizama, D.; Aguirre, M.; Márquez, P.; Pizarro, J. Carbon black as a modifier for a cheap carbon paper disposable electrode for the determination of zaleplon in synthetic saliva. J. Appl. Electrochem. 2024, 55, 1371–1380. [Google Scholar] [CrossRef]
- Piñón-Balderrama, C.I.; Hernández-Escobar, C.A.; Reyes-López, S.Y.; Conejo-Dávila, A.S.; Estrada-Monje, A.; Zaragoza-Contreras, E.A. Non-Enzymatic Electrochemical Sensing of Glucose with a Carbon Black/Polyaniline/Silver Nanoparticle Composite. Chemosensors 2024, 12, 26. [Google Scholar] [CrossRef]
- Silva, I.C.; Rocha, R.G.; Oliveira, T.C.; Marra, M.C.; Arantes, L.C.; Dos Santos, W.T.; Muñoz, R.A.; Richter, E.M. Low-cost and portable 3D-printed sensor for the determination of secnidazole in pharmaceutical and seized drug samples. Anal. Methods 2025, 17, 2038–2045. [Google Scholar] [CrossRef]
- Meireles, L.M.; Silva, R.M.; da Silva, R.C.; Okumura, L.L.; Moreira, R.P.L.; Silva, T.A. Low-cost electrochemical sensor for ciprofloxacin antibiotic based on green-synthesized silver nanoparticles and carbon black. J. Solid State Electrochem. 2024, 1–12. [Google Scholar] [CrossRef]
- Maciel, J.V.; da Silveira, G.D.; Durigon, A.M.M.; Fatibello-Filho, O.; Dias, D. Use of carbon black based electrode as sensor for solid-state electrochemical studies and voltammetric determination of solid residues of lead. Talanta 2022, 236, 122881. [Google Scholar] [CrossRef]
- Pasricha, S.; Srivastava, A.; Yadav, S.; Sunny, A.; Tuwani, N.; Rangarajan, T.M.; Mittal, K. Greener media for nano catalysts in Suzuki Miyaura reaction. Coord. Chem. Rev. 2025, 528, 216431. [Google Scholar] [CrossRef]
- Lee, S.Y.; Coutinho, J.A.; Weingarten, M. Sustainable recovery of microbial-derived natural pigments using deep eutectic solvents: Advances, potential, and challenges. Sep. Purif. Technol. 2025, 361, 131413. [Google Scholar] [CrossRef]
- Mahto, B.; Ali, H.; Barhoi, A.; Hussain, S. Morphology engineering of inorganic nanocrystals with deep eutectic solvents (DESs): Current developments and future prospects. Coord. Chem. Rev. 2025, 527, 216406. [Google Scholar] [CrossRef]
- de Lima Augusto, K.K.; Gomes-Junior, P.C.; Longatto, G.P.; Piccin, E.; Cavalheiro, É.T.G.; Bernalte, E.; Banks, C.E.; Fatibello-Filho, O. Electrochemical sensor based on carbon nanohorns and hydrophobic deep eutectic solvent for the determination of serotonin in biological samples. Electrochim. Acta 2025, 520, 145836. [Google Scholar] [CrossRef]
- da Silva, W.; Queiroz, A.C.; Brett, C.M. Poly(methylene green)–Ethaline deep eutectic solvent/Fe2O3 nanoparticle modified electrode electrochemical sensor for the antibiotic dapsone. Sens. Actuators B Chem. 2020, 325, 128747. [Google Scholar] [CrossRef]
- Santana, A.P.; Mora-Vargas, J.A.; Guimaraes, T.G.; Amaral, C.D.; Oliveira, A.; Gonzalez, M.H. Sustainable synthesis of natural deep eutectic solvents (NADES) by different methods. J. Mol. Liq. 2019, 293, 111452. [Google Scholar] [CrossRef]
- Gomes, N.O.; Calegaro, M.L.; Mattoso, L.H.C.; Oliveira, O.N., Jr.; Machado, S.A.; Raymundo-Pereira, P.A. Carbon Spherical Shells Functionalized with Nitrogen as Sustainable Electrochemical Materials for Rapid Detection of Diclofenac in Saliva, Urine, Water, and Tablets. ACS. Appl. Nano Mater. 2024, 7, 27520–27530. [Google Scholar] [CrossRef]
- de Lima Augusto, K.K.; Piton, G.R.; Gomes-Júnior, P.C.; Longatto, G.P.; de Moraes, F.C.; Fatibello-Filho, O. Enhancing the electrochemical sensitivity of hydroquinone using a hydrophobic deep eutectic solvent-based carbon paste electrode. Anal. Methods 2022, 14, 2003–2013. [Google Scholar] [CrossRef] [PubMed]
- Laube, N.; Mohr, B.; Hesse, A. Laser-probe-based investigation of the evolution of particle size distributions of calcium oxalate particles formed in artificial urines. J. Cryst. Growth 2001, 233, 367–374. [Google Scholar] [CrossRef]
- Delgado-Mellado, N.; Larriba, M.; Navarro, P.; Rigual, V.; Ayuso, M.; García, J.; Rodríguez, F. Thermal stability of choline chloride deep eutectic solvents by TGA/FTIR-ATR analysis. J. Mol. Liq. 2018, 260, 37–43. [Google Scholar] [CrossRef]
- Silva, T.A.; Wong, A.; Fatibello-Filho, O. Electrochemical sensor based on ionic liquid and carbon black for voltammetric determination of Allura red colorant at nanomolar levels in soft drink powders. Talanta 2020, 209, 120588. [Google Scholar] [CrossRef]
- García-Miranda Ferrari, A.; Foster, C.W.; Kelly, P.J.; Brownson, D.A.; Banks, C.E. Determination of the Electrochemical Area of Screen-Printed Electrochemical Sensing Platforms. Biosensors 2018, 8, 53. [Google Scholar] [CrossRef]
- Nicholson, R.S.; Shain, I. Theory of Stationary Electrode Polarography Single Scan and Cyclic Methods Applied to Reversible, Irreversible, and Kinetic Systems. Anal. Chem. 1964, 36, 706–723. [Google Scholar] [CrossRef]
- Lavagnini, I.; Antiochia, R.; Magno, F. An extended method for the practical evaluation of the standard rate constant from cyclic voltammetric data. Electroanalysis 2004, 16, 505–506. [Google Scholar] [CrossRef]
- Postolović, K.S.; Radovanović, M.B.; Stanić, Z.D. Simultaneous determination of serotonin, dopamine, and ascorbic acid at a glassy carbon electrode modified with chitosan-alginate hydrogel and reduced graphene oxide. J. Electroanal. Chem. 2025, 980, 118992. [Google Scholar] [CrossRef]
- Silva, R.M.; Sperandio, G.H.; da Silva, A.D.; Okumura, L.L.; da Silva, R.C.; Moreira, R.P.L.; Silva, T.A. Electrochemically reduced graphene oxide films from Zn-C battery waste for the electrochemical determination of paracetamol and hydroquinone. Microchim. Acta 2023, 190, 273. [Google Scholar] [CrossRef]
- Ribeiro, I.S.; de Araujo Andrade, T.; Silva, T.A.; da Silva, M.J.; de Jesus, J.R. Electrochemical sensor based on coordination compound [Co(BDC)]n allows detection of catecholamine neurotransmitter associated with neurological disorder from biological samples. Microchem. J. 2024, 206, 111571. [Google Scholar] [CrossRef]
- Vicentini, F.C.; Ravanini, A.E.; Figueiredo-Filho, L.C.; Iniesta, J.; Banks, C.E.; Fatibello-Filho, O. Imparting improvements in electrochemical sensors: Evaluation of different carbon blacks that give rise to significant improvement in the performance of electroanalytical sensing platforms. Electrochim. Acta 2015, 157, 125–133. [Google Scholar] [CrossRef]
- Wang, C.; Li, C.; Wang, F.; Wang, C. Covalent modification of glassy carbon electrode with L-cysteine for the determination of acetaminophen. Microchim. Acta 2006, 155, 365–371. [Google Scholar] [CrossRef]
- Wang, X.; Ma, Y.; Zhou, Z.; Zhang, Z.; Zhang, J.; Fan, L.; Lu, X. Ultrarapid synthesis of dumbbell-shaped carbon black-doped Ce (III, IV)-MOF composites for fabrication of simultaneous electrochemical sensor of dopamine and acetaminophen. Microchem. J. 2023, 195, 109430. [Google Scholar] [CrossRef]
- Rangaswamy, R.; Manohara, S.R.; Supritha, K.M.; Kumar, N.A. Fabrication of nickel aluminate based electrochemical sensor for dopamine detection. Hybrid Adv. 2024, 6, 100221. [Google Scholar] [CrossRef]
- Baluchová, S.; Brycht, M.; Taylor, A.; Mortet, V.; Krůšek, J.; Dittert, I.; Sedláková, S.; Klimša, L.; Kopeček, J.; Schwarzová-Pecková, K. Enhancing electroanalytical performance of porous boron-doped diamond electrodes by increasing thickness for dopamine detection. Anal. Chim. Acta 2021, 1182, 338949. [Google Scholar] [CrossRef]
- Lu, K.C.; Choi, W.H.; Lee, H.L. Cu-MOF based electrochemical sensor for highly selective and simultaneous detection of dopamine, acetaminophen and ractopamine. Microchem. J. 2025, 208, 112367. [Google Scholar] [CrossRef]
- Ingrosso, C.; Corricelli, M.; Testolin, A.; Pifferi, V.; Bettazzi, F.; Bianco, G.V.; Depalo, N.; Fanizza, E.; Striccoli, M.; Palchetti, I.; et al. Au nanoparticle decorated reduced graphene oxide and its electroanalytical characterization for label free dopamine detection. Mater. Adv. 2024, 5, 549–560. [Google Scholar] [CrossRef]
- Wahyuni, W.T.; Ta’alia, S.A.H.; Akbar, A.Y.; Elvira, B.R.; Rahmawati, I.; Wahyuono, R.A.; Putra, B.R. Electrochemical sensors based on the composite of reduced graphene oxide and a multiwalled carbon nanotube-modified glassy carbon electrode for simultaneous detection of hydroquinone, dopamine, and uric acid. RSC Adv. 2024, 14, 27999–28016. [Google Scholar] [CrossRef]
- Zhou, X.; Kuang, Y.; Li, J.; Hu, S.; Cheng, C.; Wang, J.; Su, Z. Melamine-Based Nanocomposites for Selective Dopamine and Uric Acid Sensing. ACS Appl. Polym. Mater. 2023, 5, 5609–5619. [Google Scholar] [CrossRef]
- Patrice, F.T.; Zhao, L.J.; Fodjo, E.K.; Li, D.W.; Qiu, K.; Long, Y.T. Highly Sensitive and Selective Electrochemical Detection of Dopamine using Hybrid Bilayer Membranes. ChemElectroChem 2019, 6, 634–637. [Google Scholar] [CrossRef]


| Electrode | ΔEp (mV) * | k0 (cm s−1) ** |
|---|---|---|
| GCE | 269 | 2.0 × 10⁻⁴ |
| CB/GCE | 78.05 | 2.4 × 10⁻³ |
| DES (REL)-CB/GCE | 91 | 2.3 × 10⁻³ |
| DES (GLYC)-CB/GCE | 50.9 | 8.8 × 10⁻³ |
| DES (ETHA)-CB/GCE | 54 | 9.1 × 10⁻³ |
| Electrode | Technique | Linear Range (µmol L−1) | LOD (µmol L−1) | Reference |
|---|---|---|---|---|
| CB/Ce (MV)-MOF/GCE a | DPV b | 0.3–252 | 0.0955 | [45] |
| NiAl2O4/GCE c | DPV | 10–140 | 1.78 | [46] |
| As–deposited porous H-BDD (B/C 4000 ppm) d | SWV e | 0.7–30 | 0.2 | [47] |
| Cu-BTC/MWCNTs-COOH/SPE f | DPV | 0.1–20 | 0.05 | [48] |
| PA–RGO/AuNPs/SPCE g | DPV | 0.013–0.130 | 0.0025 | [49] |
| WS2/MW-CNT h | DPV | 1–22 | 0.55 | [8] |
| [Co(BDC)]n/CPE i | SWV | 2.88–50.6 | 0.1 | [42] |
| RGO/MWCNT/GCE j | DPV | 4–100 | 0.5 | [50] |
| PMEL-CDS/MWCNTs-COOH/GCE k | DPV | 0.1–10 | 0.023 | [51] |
| DES(ETHA)-CB-/GCE | DPV | 0.498–26.8 | 0.0807 | This work |
| Concomitant Substance | Error * (%) |
|---|---|
| Ascorbic acid | +37.31 |
| Adrenaline | +11.74 |
| Uric acid | +22.97 |
| Na+ and K+ ions | +2.00 |
| Urea | +9.20 |
| Concentration (µmol L−1) | Recovery * | |
|---|---|---|
| Added | Found | |
| 4.3 | (4.8 ± 0.5) | 110.7 |
| 8.7 | (9.8 ± 2) | 112.6 |
| 19.8 | (19.4 ± 4) | 98.2 |
Disclaimer/Publisher’s Note: The statements, opinions and data contained in all publications are solely those of the individual author(s) and contributor(s) and not of MDPI and/or the editor(s). MDPI and/or the editor(s) disclaim responsibility for any injury to people or property resulting from any ideas, methods, instructions or products referred to in the content. |
© 2025 by the authors. Licensee MDPI, Basel, Switzerland. This article is an open access article distributed under the terms and conditions of the Creative Commons Attribution (CC BY) license (https://creativecommons.org/licenses/by/4.0/).
Share and Cite
Lopes, A.G.R.; Silva, R.M.; Fatibello-Filho, O.; Silva, T.A. Electrochemical Sensing of Dopamine Neurotransmitter by Deep Eutectic Solvent–Carbon Black–Crosslinked Chitosan Films: Charge Transfer Kinetic Studies and Biological Sample Analysis. Chemosensors 2025, 13, 254. https://doi.org/10.3390/chemosensors13070254
Lopes AGR, Silva RM, Fatibello-Filho O, Silva TA. Electrochemical Sensing of Dopamine Neurotransmitter by Deep Eutectic Solvent–Carbon Black–Crosslinked Chitosan Films: Charge Transfer Kinetic Studies and Biological Sample Analysis. Chemosensors. 2025; 13(7):254. https://doi.org/10.3390/chemosensors13070254
Chicago/Turabian StyleLopes, Alencastro Gabriel Ribeiro, Rafael Matias Silva, Orlando Fatibello-Filho, and Tiago Almeida Silva. 2025. "Electrochemical Sensing of Dopamine Neurotransmitter by Deep Eutectic Solvent–Carbon Black–Crosslinked Chitosan Films: Charge Transfer Kinetic Studies and Biological Sample Analysis" Chemosensors 13, no. 7: 254. https://doi.org/10.3390/chemosensors13070254
APA StyleLopes, A. G. R., Silva, R. M., Fatibello-Filho, O., & Silva, T. A. (2025). Electrochemical Sensing of Dopamine Neurotransmitter by Deep Eutectic Solvent–Carbon Black–Crosslinked Chitosan Films: Charge Transfer Kinetic Studies and Biological Sample Analysis. Chemosensors, 13(7), 254. https://doi.org/10.3390/chemosensors13070254