Abstract
Herein, a facile strategy was proposed to enhance the gas sensing performance of SnO2 for H2 by regulating its crystalline phase composition. Sn-based metal–organic framework (Sn-MOF) precursors with different morphologies were synthesized by introducing the surfactant cetyltrimethylammonium bromide (CTAB). Upon calcination, these precursors yielded either mixed-phase (orthorhombic and tetragonal, SnO2-C) or single-phase (pure tetragonal, SnO2-NC) SnO2 nanoparticles. Structural characterization and gas sensing tests revealed that SnO2-C exhibited a high response of 7.73 to 100 ppm H2 at 280 °C, more than twice that of SnO2-NC (3.75). Moreover, SnO2-C demonstrated a faster response/recovery time (10/56 s), high selectivity, a ppb-level detection limit (~79 ppb), and excellent long-term stability. Notably, although the addition of CTAB reduced the specific surface area of SnO2, the resulting lower surface area minimized oxygen exposure during calcination, facilitating the formation of a mixed-phase heterostructure. In addition, the calcination atmosphere of SnO2-C (flowing air or Ar) was adjusted to further investigate the role of the crystal phase in gas sensing performance. The results clearly demonstrated that mixed-phase SnO2 exhibited superior sensing performance, achieving a higher sensitivity and a faster response to H2. These findings underscored the critical role of crystal phase engineering in the design of high-performance gas sensing materials.
1. Introduction
H2 is widely applied in various industrial sectors, including chemical manufacturing, energy production, and metallurgy [1,2,3,4,5]. With the rapid advancement of H2 energy technologies and the global pursuit of carbon neutrality, the production, storage, and utilization of H2 are expected to grow substantially in the coming years. However, H2 presents notable safety concerns owing to its broad flammability range in air (4% to 75%) and its exceptionally low ignition threshold, requiring only as little as 0.02 mJ to ignite [6]. Its small molecular size makes it highly prone to leakage, while its colorless and odorless nature also makes the detection particularly challenging. Therefore, the development of highly sensitive and fast-response detection technologies is essential for early H2 leak warning, ensuring personnel safety, and enabling the safe deployment of H2-based energy systems.
Resistive sensors utilizing semiconductor metal oxides (SMOs) have become highly attractive for detecting hazardous gases, primarily because of their exceptional sensitivity, swift response time, cost-effectiveness, and miniaturized design [7,8,9]. Among them, SnO2, as a n-type SMO, has received extensive research interest due to its excellent chemical stability, environmental friendliness, and outstanding gas sensing performance [10]. Extensive use has been made of it for the sensing of reducing gases, with H2 being a primary target. Kadir et al. [11] developed a H2 sensor based on well-aligned electropunk SnO2 nanofibers, which were calcined at 500 °C for 4 h. The sensor exhibited a maximum response of 2.5 to 1.0% H2 at 150 °C. Similarly, Lu et al. [12] reported that Pd-doped SnO2 nanowires achieved a high response of 8.5 to 40 ppm H2 at 150 °C, along with significant response and recovery time of 6 s and 3 s, respectively. Despite these significant advancements, the practical application of SnO2-based H2 sensing materials remains limited by several inherent challenges, including the high cost of noble metal doping, poor selectivity, sluggish response/recovery kinetics, and issues with long-term stability. These limitations collectively hinder their large-scale commercialization and deployment in real-world scenarios.
It is well established that the sensing capability of SnO2 is significantly influenced by its crystal structure, morphology, particle size, and surface defect states [13]. In particular, the crystal phase of SnO2 plays a crucial role in determining its electronic properties, surface reactivity, and adsorption–desorption behavior, all of which are fundamental to sensing performance [14]. Recent studies have demonstrated that mixed-phase SnO2 structures outperform their single-phase counterparts in gas sensing applications [15]. This enhanced performance is primarily attributed to their superior charge transport capabilities, improved catalytic activity, and stronger interactions with target gas molecules. Therefore, precise control over the crystal phase composition of SnO2 has emerged as a promising strategy to substantially enhance sensing performance. Metal–organic frameworks (MOFs), known for their well-defined porous architectures, tunable chemical compositions, and controllable morphologies, have become ideal precursors for synthesizing functional metal oxide nanomaterials via thermal decomposition or calcination [16,17,18]. MOF-derived metal oxides often retain tailored structural features, offering unique opportunities to fine-tune their physicochemical properties, thereby significantly boosting gas sensing performance [19]. However, accurately regulating the morphology of MOF precursors to effectively influence the crystal phase evolution of MOF-derived SnO2 remains a considerable challenge.
Surfactants have proven to be highly effective tools in the synthesis of nanomaterials, enabling precise control over crystal nucleation, growth dynamics, and particle morphology [20]. These amphiphilic molecules can selectively adsorb onto specific crystal facets, thereby influencing anisotropic growth and enabling the formation of well-defined nanostructures. Among them, cetyltrimethylammonium bromide (CTAB), a widely used cationic surfactant, has demonstrated remarkable potential in regulating nanostructure formation due to its strong surface-active properties [21]. CTAB facilitated the formation of uniform nanoparticles with diverse morphologies, which can significantly enhance both catalytic and gas sensing performances. In addition, previous studies have suggested that the formation of different SnO2 crystal phases was closely related to the extent of oxygen exposure during synthesis [15]. Therefore, adjusting the calcination atmosphere presents a viable strategy for controlling the crystalline structure of SnO2, offering an additional pathway for phase engineering and performance optimization.
This study systematically investigated the influence of CTAB introduction on the morphology of Sn-MOF precursors, the resulting crystal phase formation (tetragonal or mixed phase) of SnO2 nanoparticles, and their corresponding H2 sensing behavior. Distinct from conventional MOS, this work employed an MOF-derived approach to achieve synergistic control over both morphology and the crystalline phase, establishing an efficient and highly controllable route for the fabrication of sensing materials. By adjusting the calcination atmosphere, single-phase tetragonal SnO2 was synthesized to further elucidate the critical role of phase composition in gas-sensing performance. In addition, the synergistic interaction between the tetragonal and orthorhombic phases was found to induce the formation of an n–n type homojunction, which significantly enhanced the electronic response and dynamic characteristics. A comparison between single-phase and mixed-phase structures revealed a strong correlation between phase modulation and sensing performance. These findings ultimately contribute to the rational design and development of advanced gas sensors tailored for practical industrial and environmental applications.
2. Experimental Section
2.1. Synthesis and Preparation
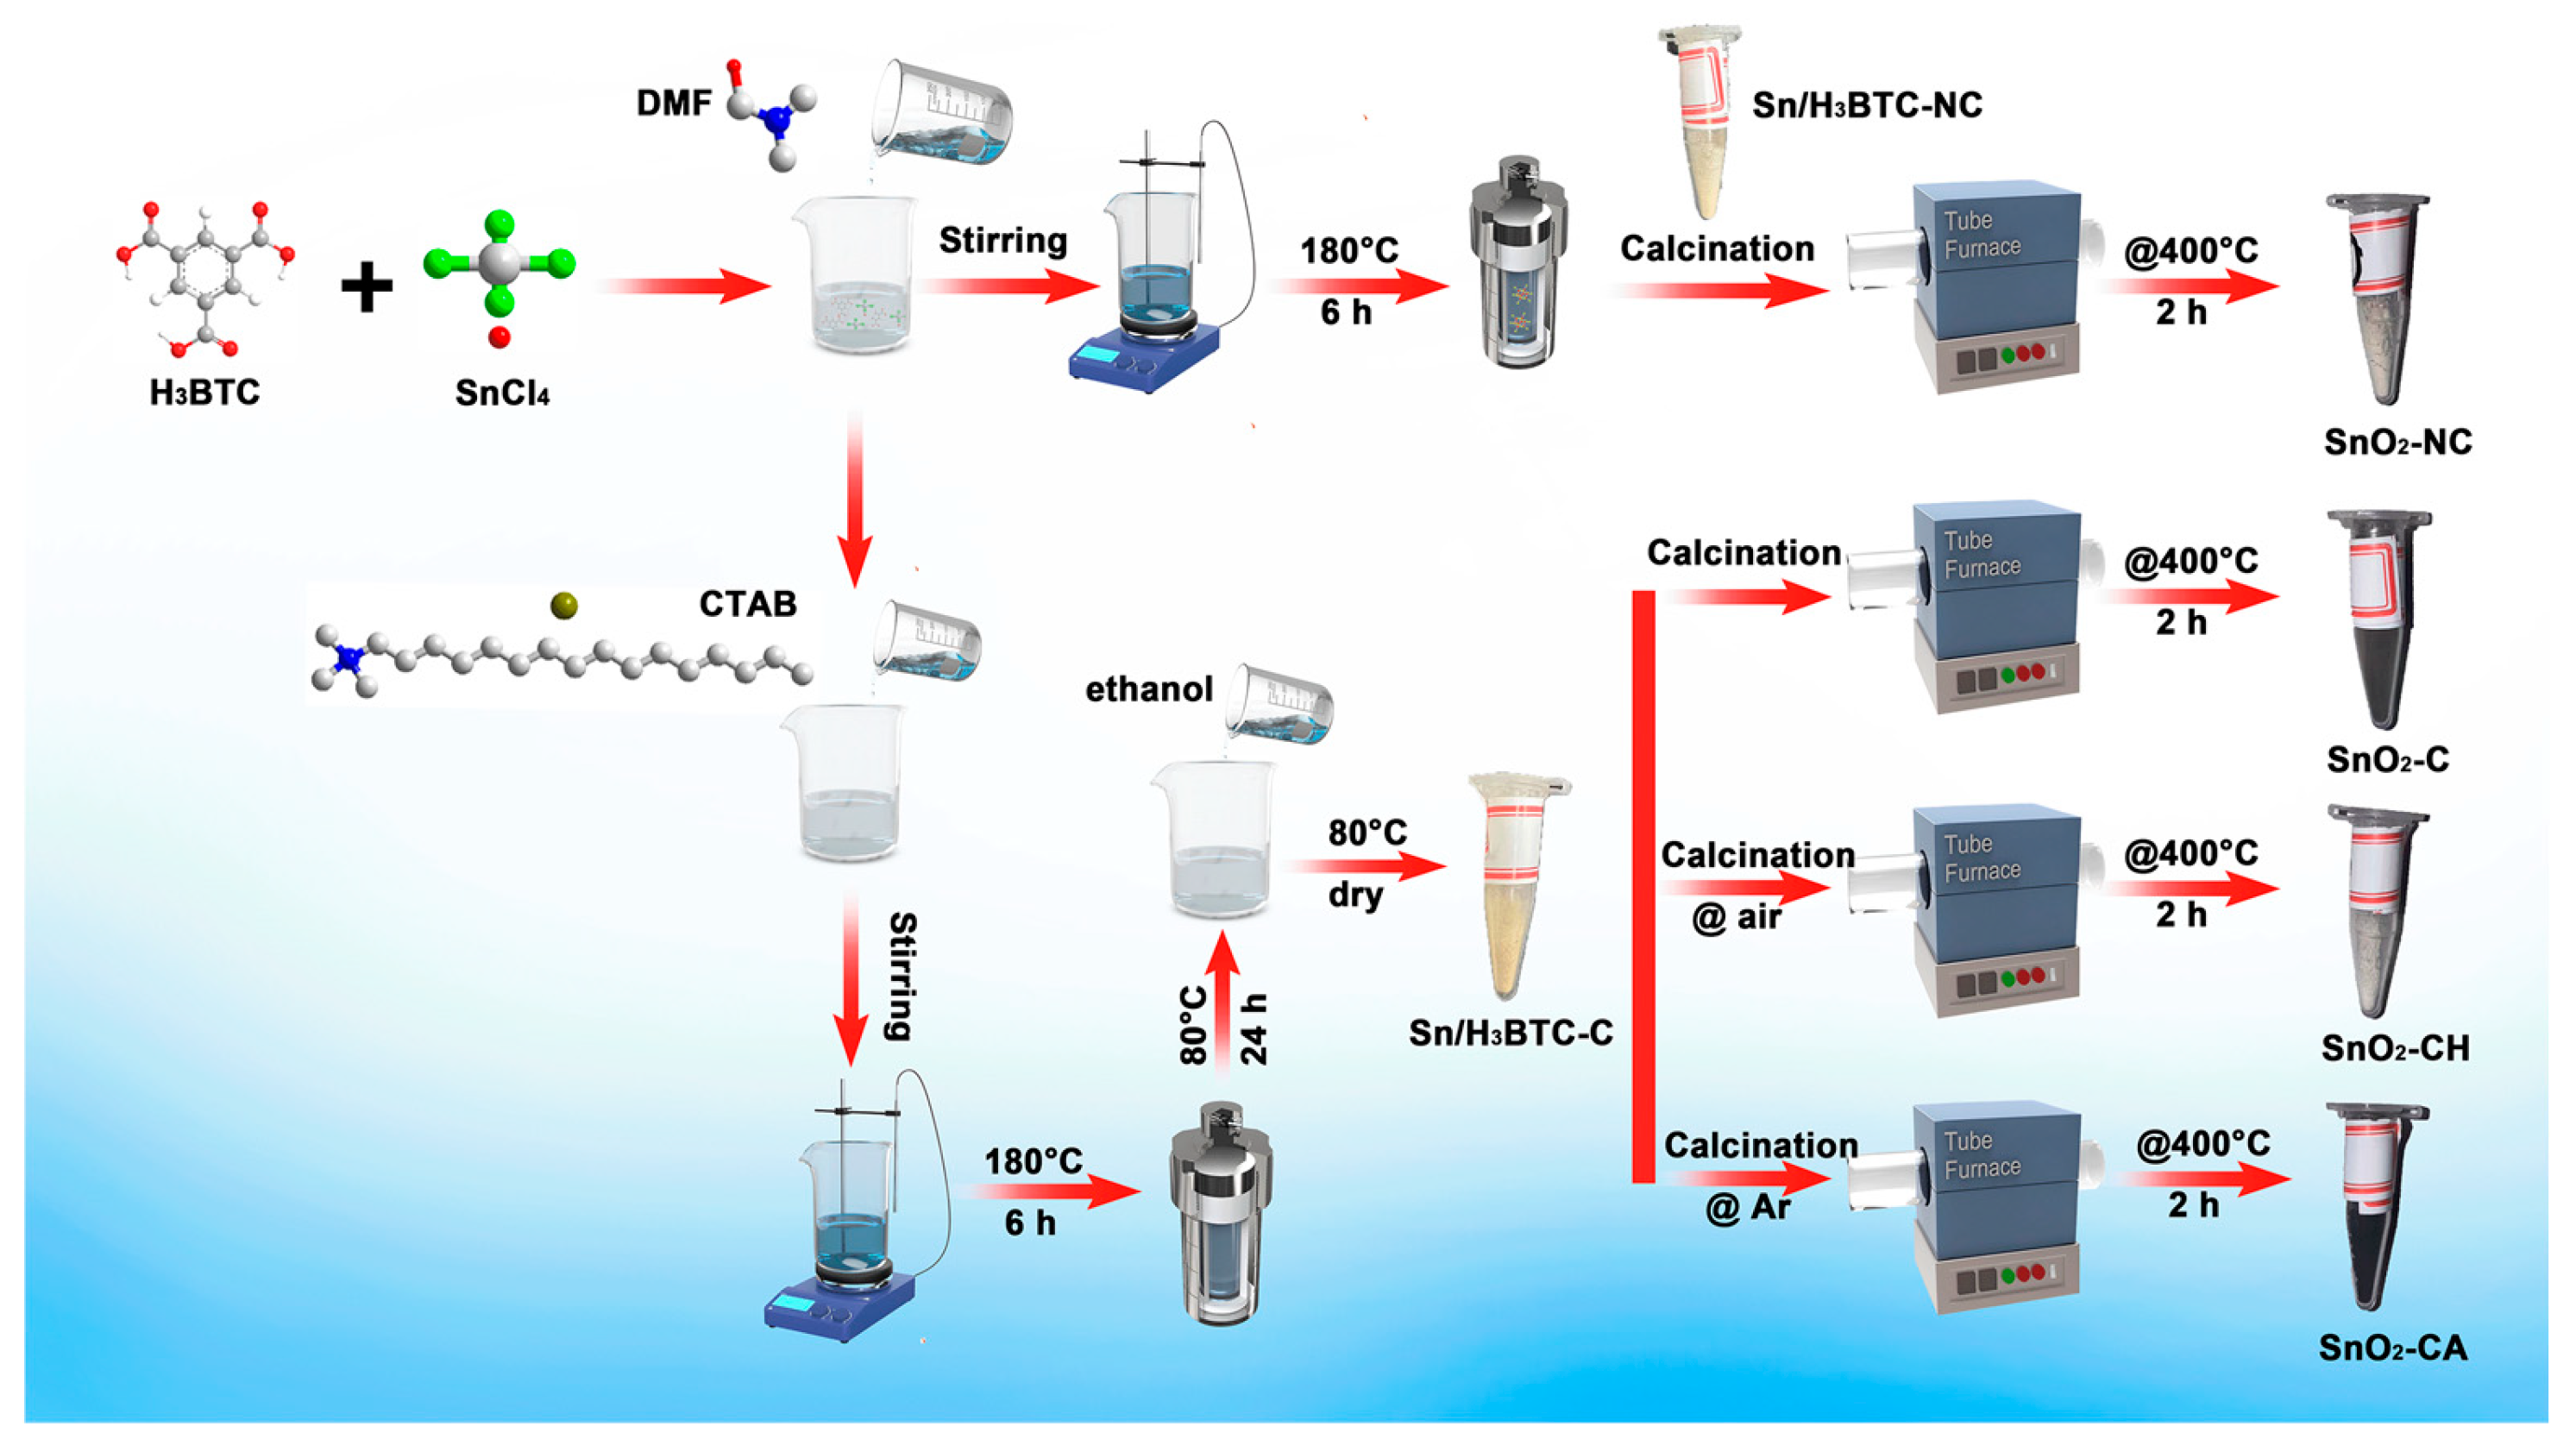
Figure 1 shows the synthesis process of all samples. And comprehensive synthesis details are provided in Supporting Information (SI). The precursors without and with CTAB were calcined at 400 °C for 2 h in air using a narrow tube furnace, and the resulting samples were designated as SnO2-NC and SnO2-C, respectively. Additionally, Sn/H3BTC-C was calcined at 400 °C for 2 h under flowing air or Ar atmospheres to obtain SnO2-CH and SnO2-CA, respectively.
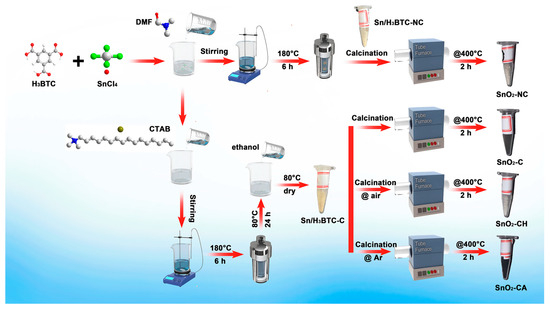
Figure 1.
Synthesis routes of all samples.
2.2. Characterization
The morphologies of the samples were investigated by scanning electron microscope (SEM, ZEISS Sigma 300, Oberkochen, BW, Germany). The crystalline structures of the obtained samples were characterized by X-ray diffraction (XRD) using a Rigaku SmartLab SE diffractometer (Tokyo, Japan) with Cu Kα radiation (λ = 1.5418 Å). The specific surface area and pore diameter distribution were conducted using Brunauer–Emmett–Teller (BET) and Barrett–Joyner–Halenda (BJH) based on the N2 adsorption–desorption examination method (Micromeritics ASAP 2460 analyzer, Norcross, GA, USA). X-ray photoelectron spectroscopy (XPS) analysis was performed with a Thermo Scientific K-Alpha spectrometer (Waltham, MA, USA) instrument with monochromatic Al Kα (1486.6 eV) radiation. The detailed methodologies and evaluation procedures are described in SI.
2.3. Gas Sensing Properties
Figures S1 and S2 illustrate the schematic diagrams of the gas-sensing element and the gas sensing test apparatus, respectively, while the detailed procedures for sensor fabrication and measurement protocols can be found in Supporting Information (SI). The sensor response is calculated using the ratio Ra/Rg, where Ra denotes the resistance in dry air and Rg represents the resistance when exposed to the target gas. The response time (τres) and recovery time (τrec) are defined as the time intervals required to achieve 90% of the total resistance change during gas adsorption and desorption, respectively [22,23]. In addition, to ensure the repeatability and reliability of the experimental data, each set of measurements was performed three times to eliminate random errors.
3. Result and Discussion
3.1. Materials Characterization
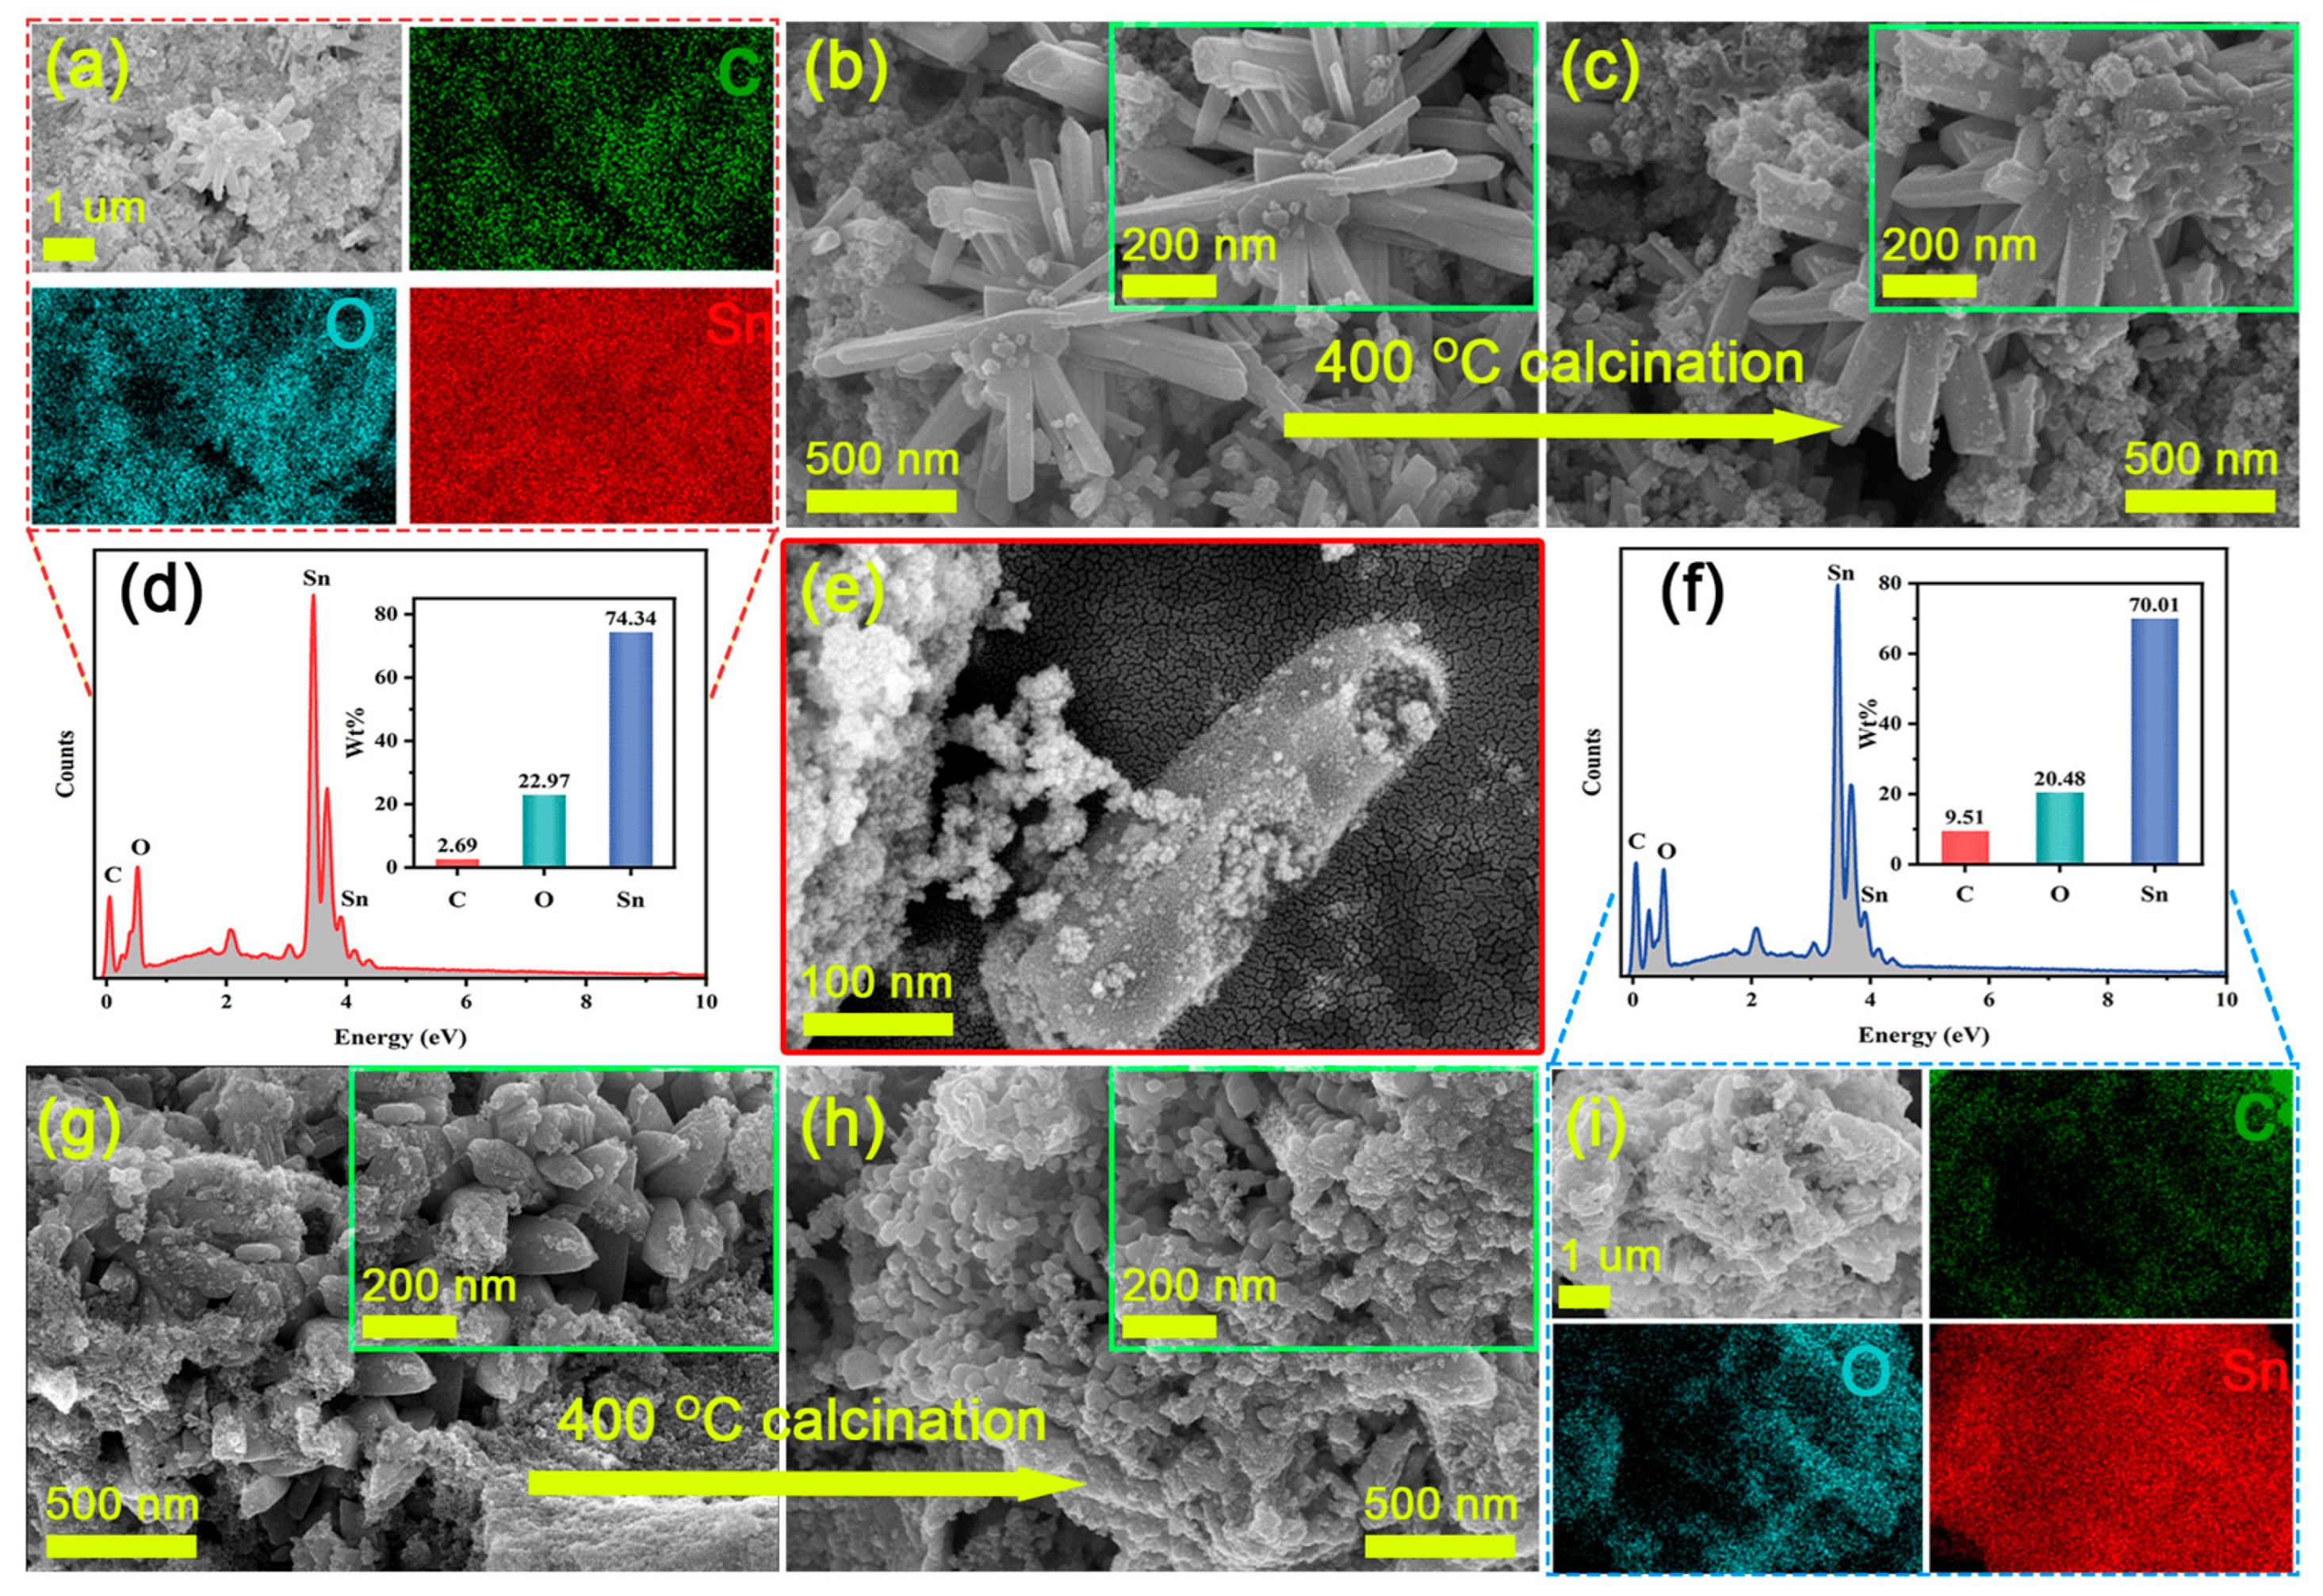
As shown in Figure 2, SEM images, EDX spectra, and element distribution maps of both the MOFs precursors, as well as SnO2-NC and SnO2-C, are presented. Figure 2b,c reveals that the SnO2/H3BTC precursor exhibited a hexagonal prism-like morphology, with an average length of approximately 994.2 nm and an average diameter of about 122.8 nm (Figure S3a,b). After calcination, the hexagonal prisms began to collapse from the inside, and their surfaces became noticeably rougher. Additionally, as shown in Figure 2e, the fractured surfaces of some SnO2-NC particles clearly displayed hollow interior structures. Such a morphology was primarily attributed to the intrinsic self-organization of metal ions and organic ligands in the MOF, combined with the evolution of gaseous species during the thermal calcination process [24]. In contrast, as shown in Figure 2g,h, the presence of CTAB inhibited the formation of hexagonal prisms in the Sn/H3BTC system, resulting in a morphology composed mainly of nanoparticles with an average diameter of 280.5 nm (Figure S3c) [25]. After calcination, these nanoparticles tend to aggregate and adhere to one another, with their size further reduced to approximately 165.9 nm (Figure S3d). Furthermore, elemental mapping and composition analysis of the calcined samples revealed that SnO2-C contained more residual carbon compared to the hollow tetragonal SnO2-NC (Figure 2a,d,f,i). This may be attributed to the difference in specific surface area resulting from their unique structural features, as well as the incomplete contact with oxygen during the calcination process of SnO2-C.
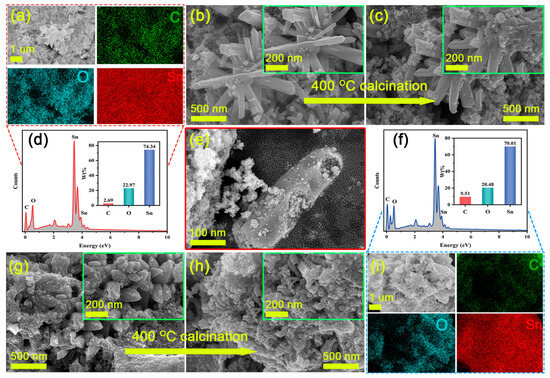
Figure 2.
SEM images of as-prepared samples: (a,c,e) SnO2-NC (b) Sn/H3BTC-NC, (g) Sn/H3BTC-C, and (h) SnO2-C. EDS element mapping (a,i) and the EDS spectrum (d,f) of SnO2-NC and SnO2-C.
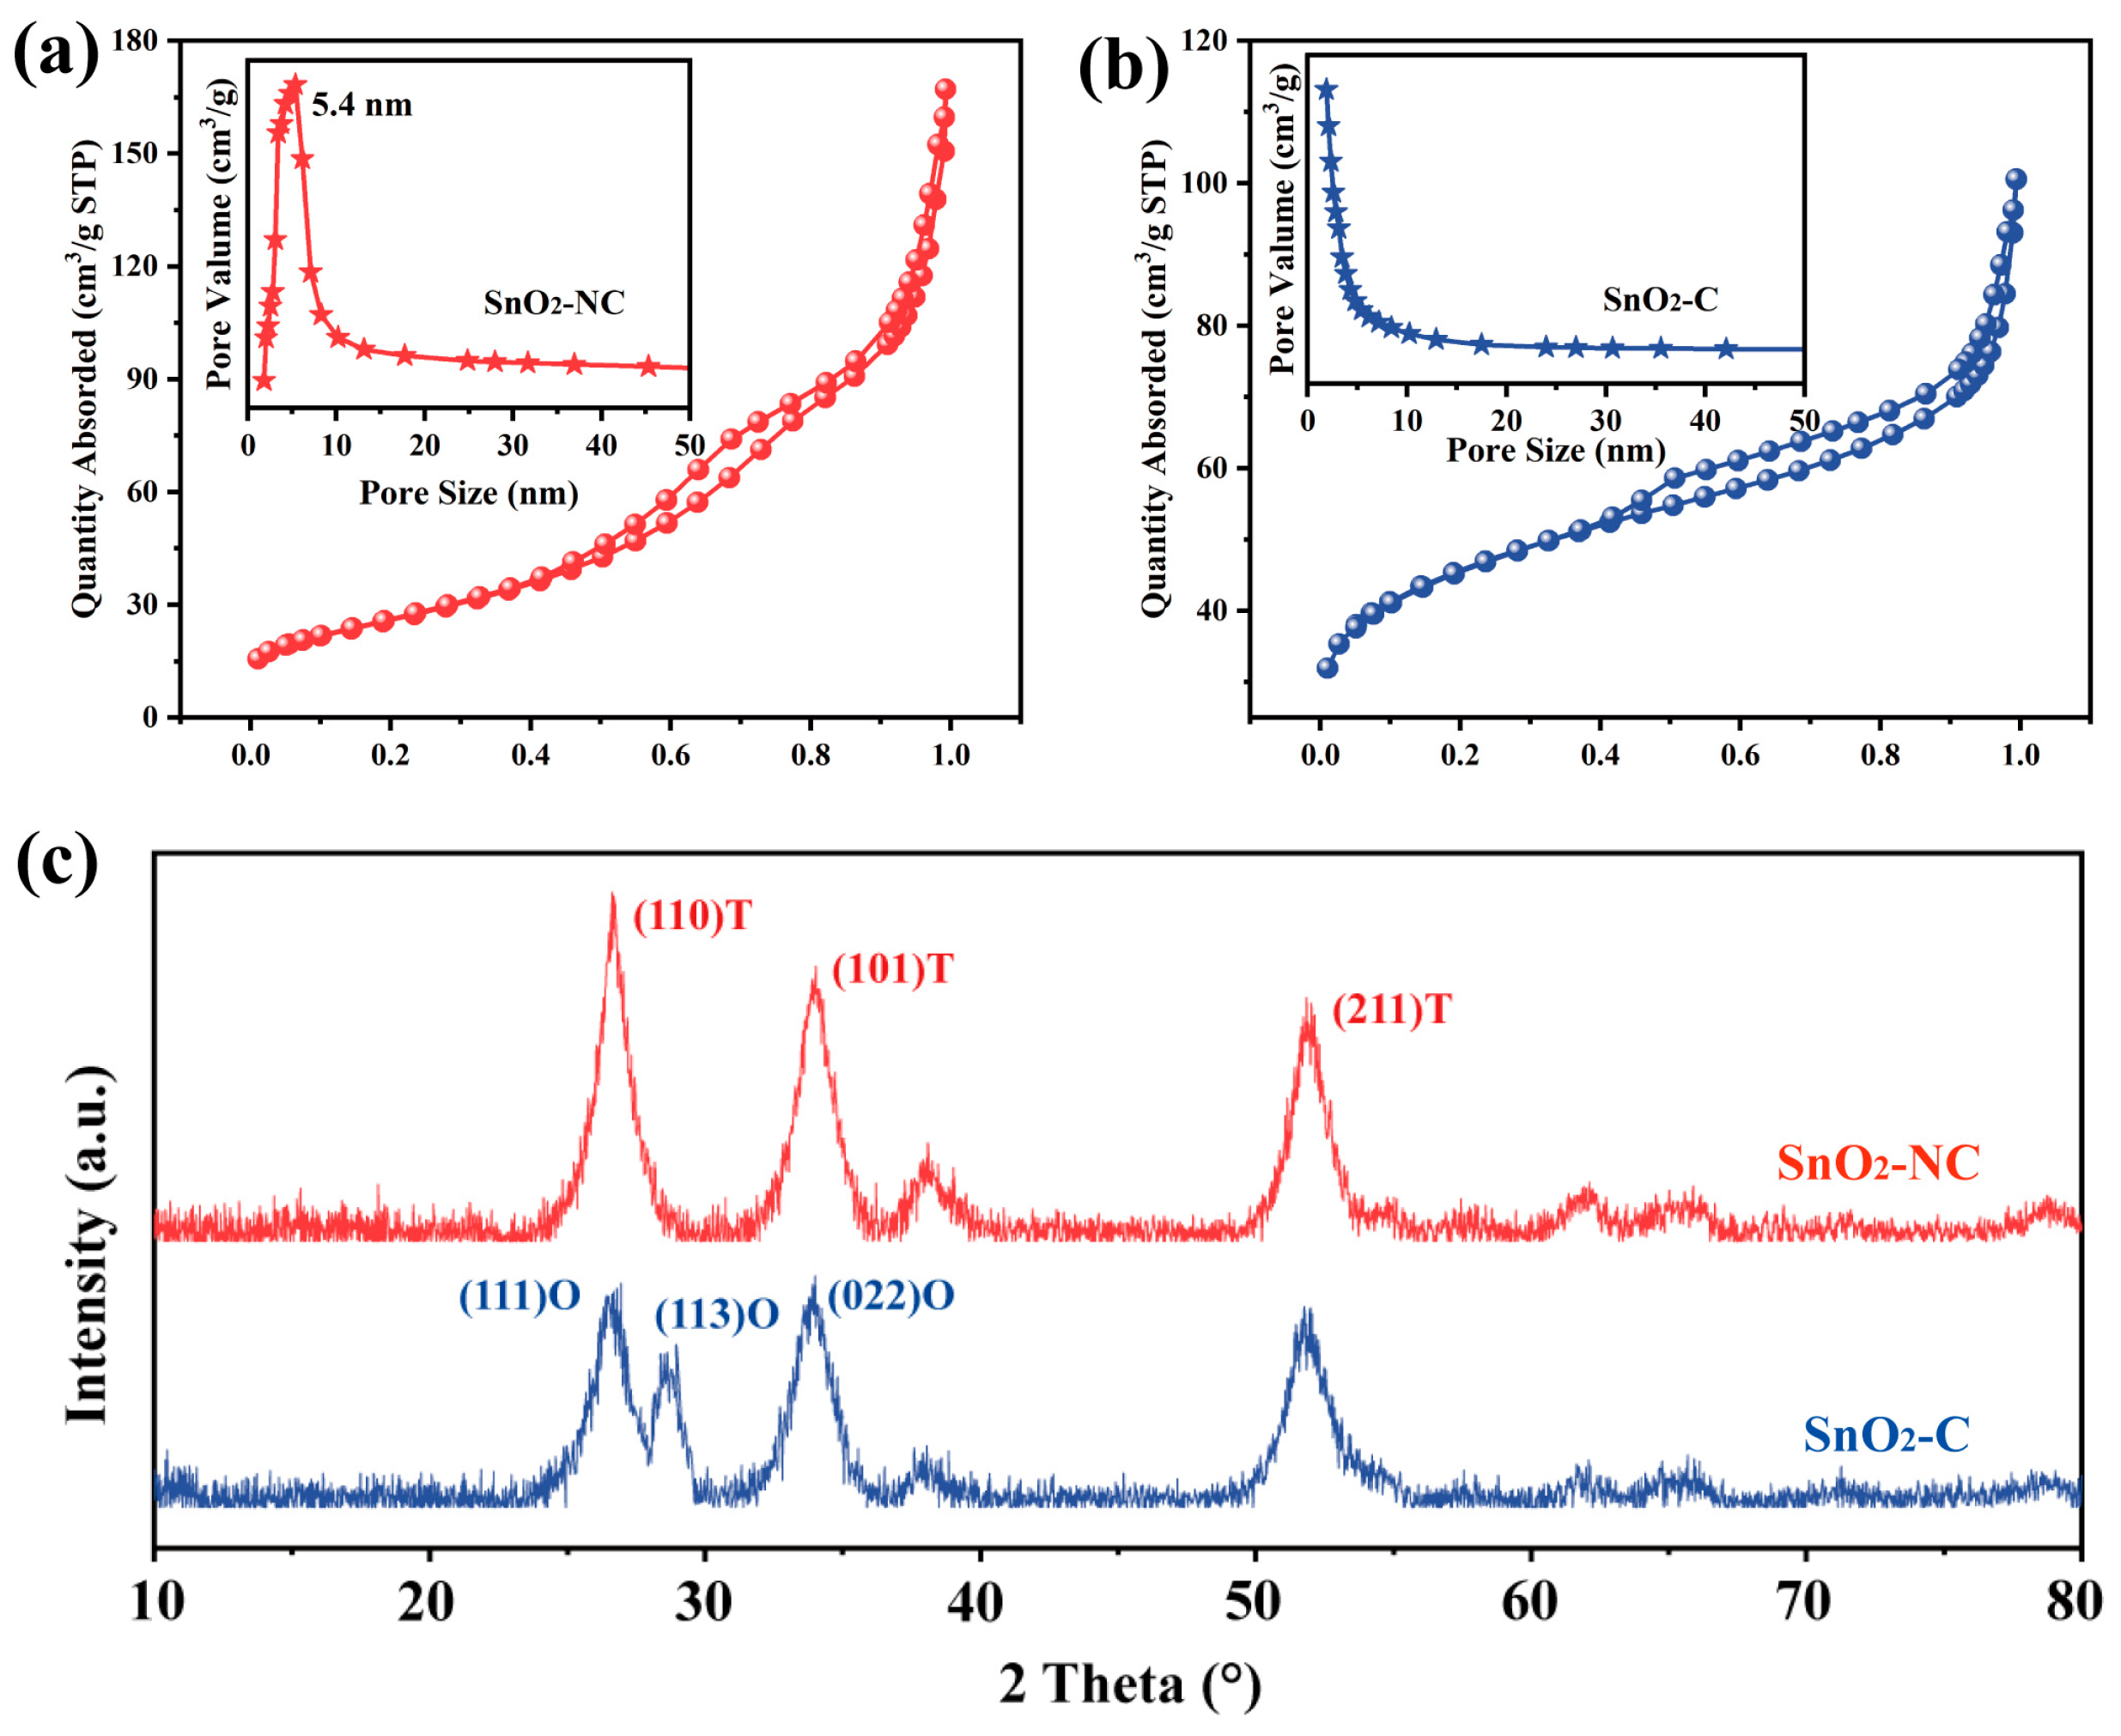
To verify the above hypothesis, N2 adsorption measurements were carried out. As shown in Figure 3, both SnO2-NC and SnO2-C exhibited type IV isotherms with the indicative microporosity. For SnO2-NC (Figure 3a), a distinct hysteresis loop appeared at p/po = 0.4–1.0, characteristic of capillary condensation within mesopores [26]. The SnO2-NC sample showed a BET surface area of 165.12 m2g−1, a pore volume of 0.26 cm3g−1, and an average pore diameter of 9.69 nm. The pore size distribution (inset) revealed a sharp peak at 5.4 nm, indicating the presence of uniform mesopores formed by the thermal decomposition of the MOF-derived framework, which facilitated efficient gas diffusion and access to active sites. In contrast, SnO2-C (Figure 3b) showed a narrower hysteresis loop and lower adsorption capacity. It exhibited a BET surface area of 95.8 m2g−1, a pore volume of 0.11 cm3g−1, and an average pore diameter of 6.88 nm. The broader distribution centered at smaller pore sizes suggested a more disordered porous structure, likely resulting from nanoparticle aggregation. These results confirmed that the introduction of CTAB significantly influenced the calcined structure, suppressing pore formation and reducing surface area, which may hinder reactant accessibility and thereby limit the sensing or catalytic performance. Nevertheless, the subsequent sensing results demonstrated that surface area alone was not the decisive factor for gas sensing performance. This further underscored the potential of crystal phase engineering as an effective strategy for constructing high-performance gas sensing materials.
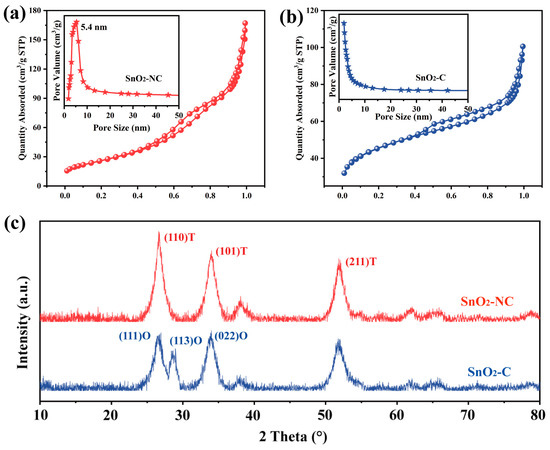
Figure 3.
N2 adsorption-desorption isotherms (a,b) and XRD patterns (c) for SnO2-NC and SnO2-C.
As shown in Figure 3c, the XRD analysis revealed that the SnO2-NC sample exhibited characteristic peaks consistent with the T-SnO2 phase (JCPDS 99-0024), while the SnO2-C sample displayed diffraction signals corresponding to both T-SnO2 and O-SnO2 phases (JCPDS 78-1063). Quantitative analysis using the K-value method estimated the content of O-SnO2 and T-SnO2 in the mixed-phase sample to be approximately 56% and 44%, respectively. These results confirmed the successful synthesis of both single-phase (T-SnO2) and mixed-phase (T-SnO2 and O-SnO2) SnO2. In addition, compared to SnO2-C, SnO2-NC exhibited sharper and more intense diffraction peaks, indicating a higher degree of crystallinity, which was consistent with the observations from SEM analysis. The O-SnO2 phase has long been considered an intermediate during the phase transformation from SnO2 to T-SnO2 [27]. In this study, the successful stabilization of the O-SnO2 phase was likely attributed to oxygen-deficient conditions during calcination. As a result, the presence of SnO in the mixed-phase product cannot be ruled out. To ensure the accuracy of our conclusions and eliminate possible interference from SnO, XPS analysis was conducted, considering that Sn2+ exhibited a lower binding energy than Sn4+ [28,29].
3.2. XPS
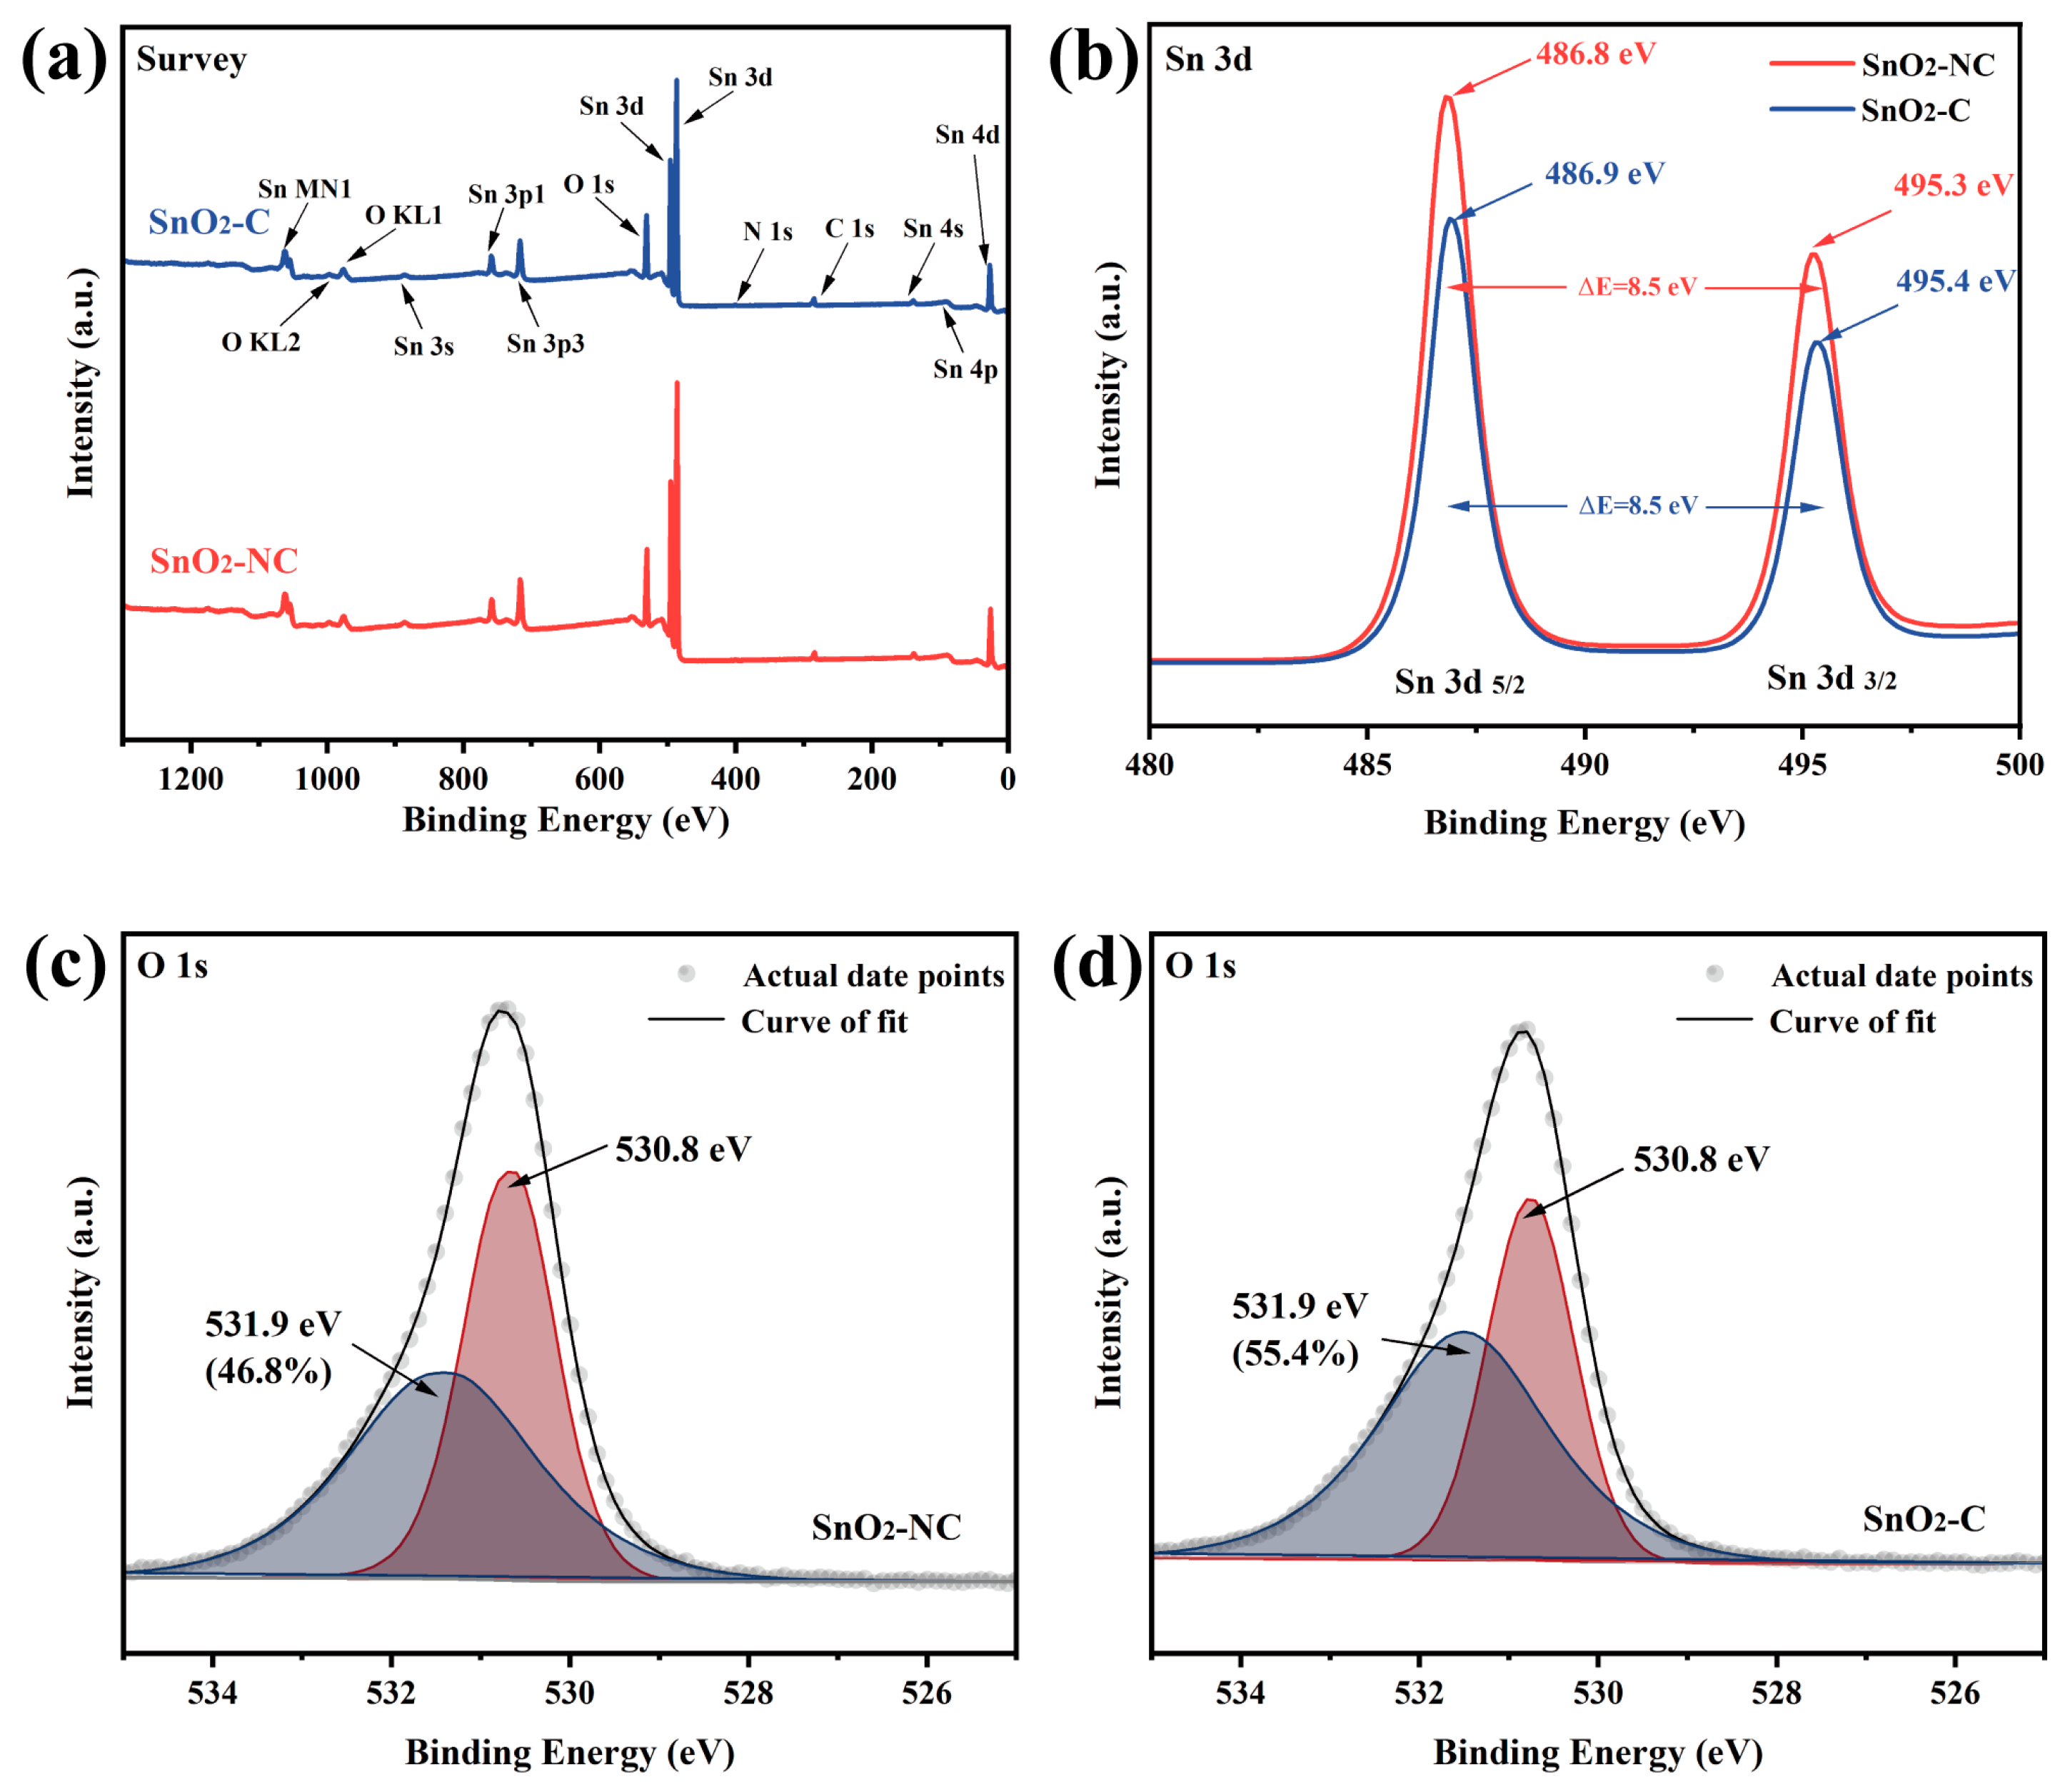
The XPS survey spectra of SnO2-C and SnO2-NC samples (Figure 4a) showed the presence of Sn, O, and C elements in both materials. The Sn 3d peaks located at approximately 487 eV and 496 eV correspond to the existence of Sn4+, while the O 1s peak around 531 eV was attributed to lattice oxygen or surface hydroxyl groups. The C 1s peak and the weak N 1s signal might originate from background or incomplete decomposition of the organic framework during calcination. In addition to the main peaks, the samples also exhibited other characteristic Sn and O signals, such as Sn 3s, 3p, 4s, 4p, and the Sn MN1 (Auger peak), further confirming the typical electronic structure of SnO2. The detailed Sn 3d spectra (Figure 4b) indicates that the Sn 3d5/2 peaks occurred at 486.8 eV and 486.9 eV for SnO2-NC and SnO2-C, respectively, while the Sn 3d3/2 peaks were positioned at 495.3 eV and 495.4 eV. These values were in excellent agreement with previously reported binding energies for Sn4+ in SnO5/2 [30]. Notably, the absence of any shift toward lower binding energies excluded the presence of Sn2+ species, which would be expected if SnO were present, as Sn2+ exhibited a lower binding energy than Sn4+. Taken together with the structural analysis, these results support the hypothesis that oxygen-deficient SnO2 (O-SnO2) was formed in SnO2-C.
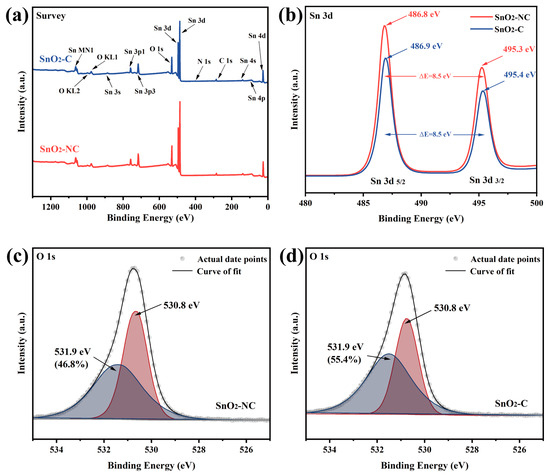
Figure 4.
(a) XPS survey scan, (b) Sn 3d spectra, (c,d) O 1s spectra of SnO2-NC and SnO2-C.
The detailed O 1s spectra for SnO2-NC and SnO2-C are shown in Figure 4c,d, respectively. The binding energy near 530.8 eV corresponded to lattice oxygen coordinated with Sn4+ ions, while the feature near 531.9 eV signified the presence of surface-adsorbed active oxygen species, such as O− or O2− [31]. The sensing efficiency of SnO2 was known to be intimately linked to its surface adsorption of oxygen species and its capability to mediate redox reactions with analyte gases [32]. Surface-active oxygen was widely recognized as an indicator of surface reactivity and played a critical role in sensing behavior. Quantitative analysis revealed that the proportion of surface-active oxygen was 48.6% for SnO2-NC and increased to 55.4% for SnO2-C. The enhanced capacity of mixed-phase SnO2 to adsorb ionized oxygen species may originate from a synergistic effect between O-SnO2 and T-SnO2 domains, forming an efficient heterojunction interface that promotes oxygen activation [33].
3.3. Gas-Sensing Performance
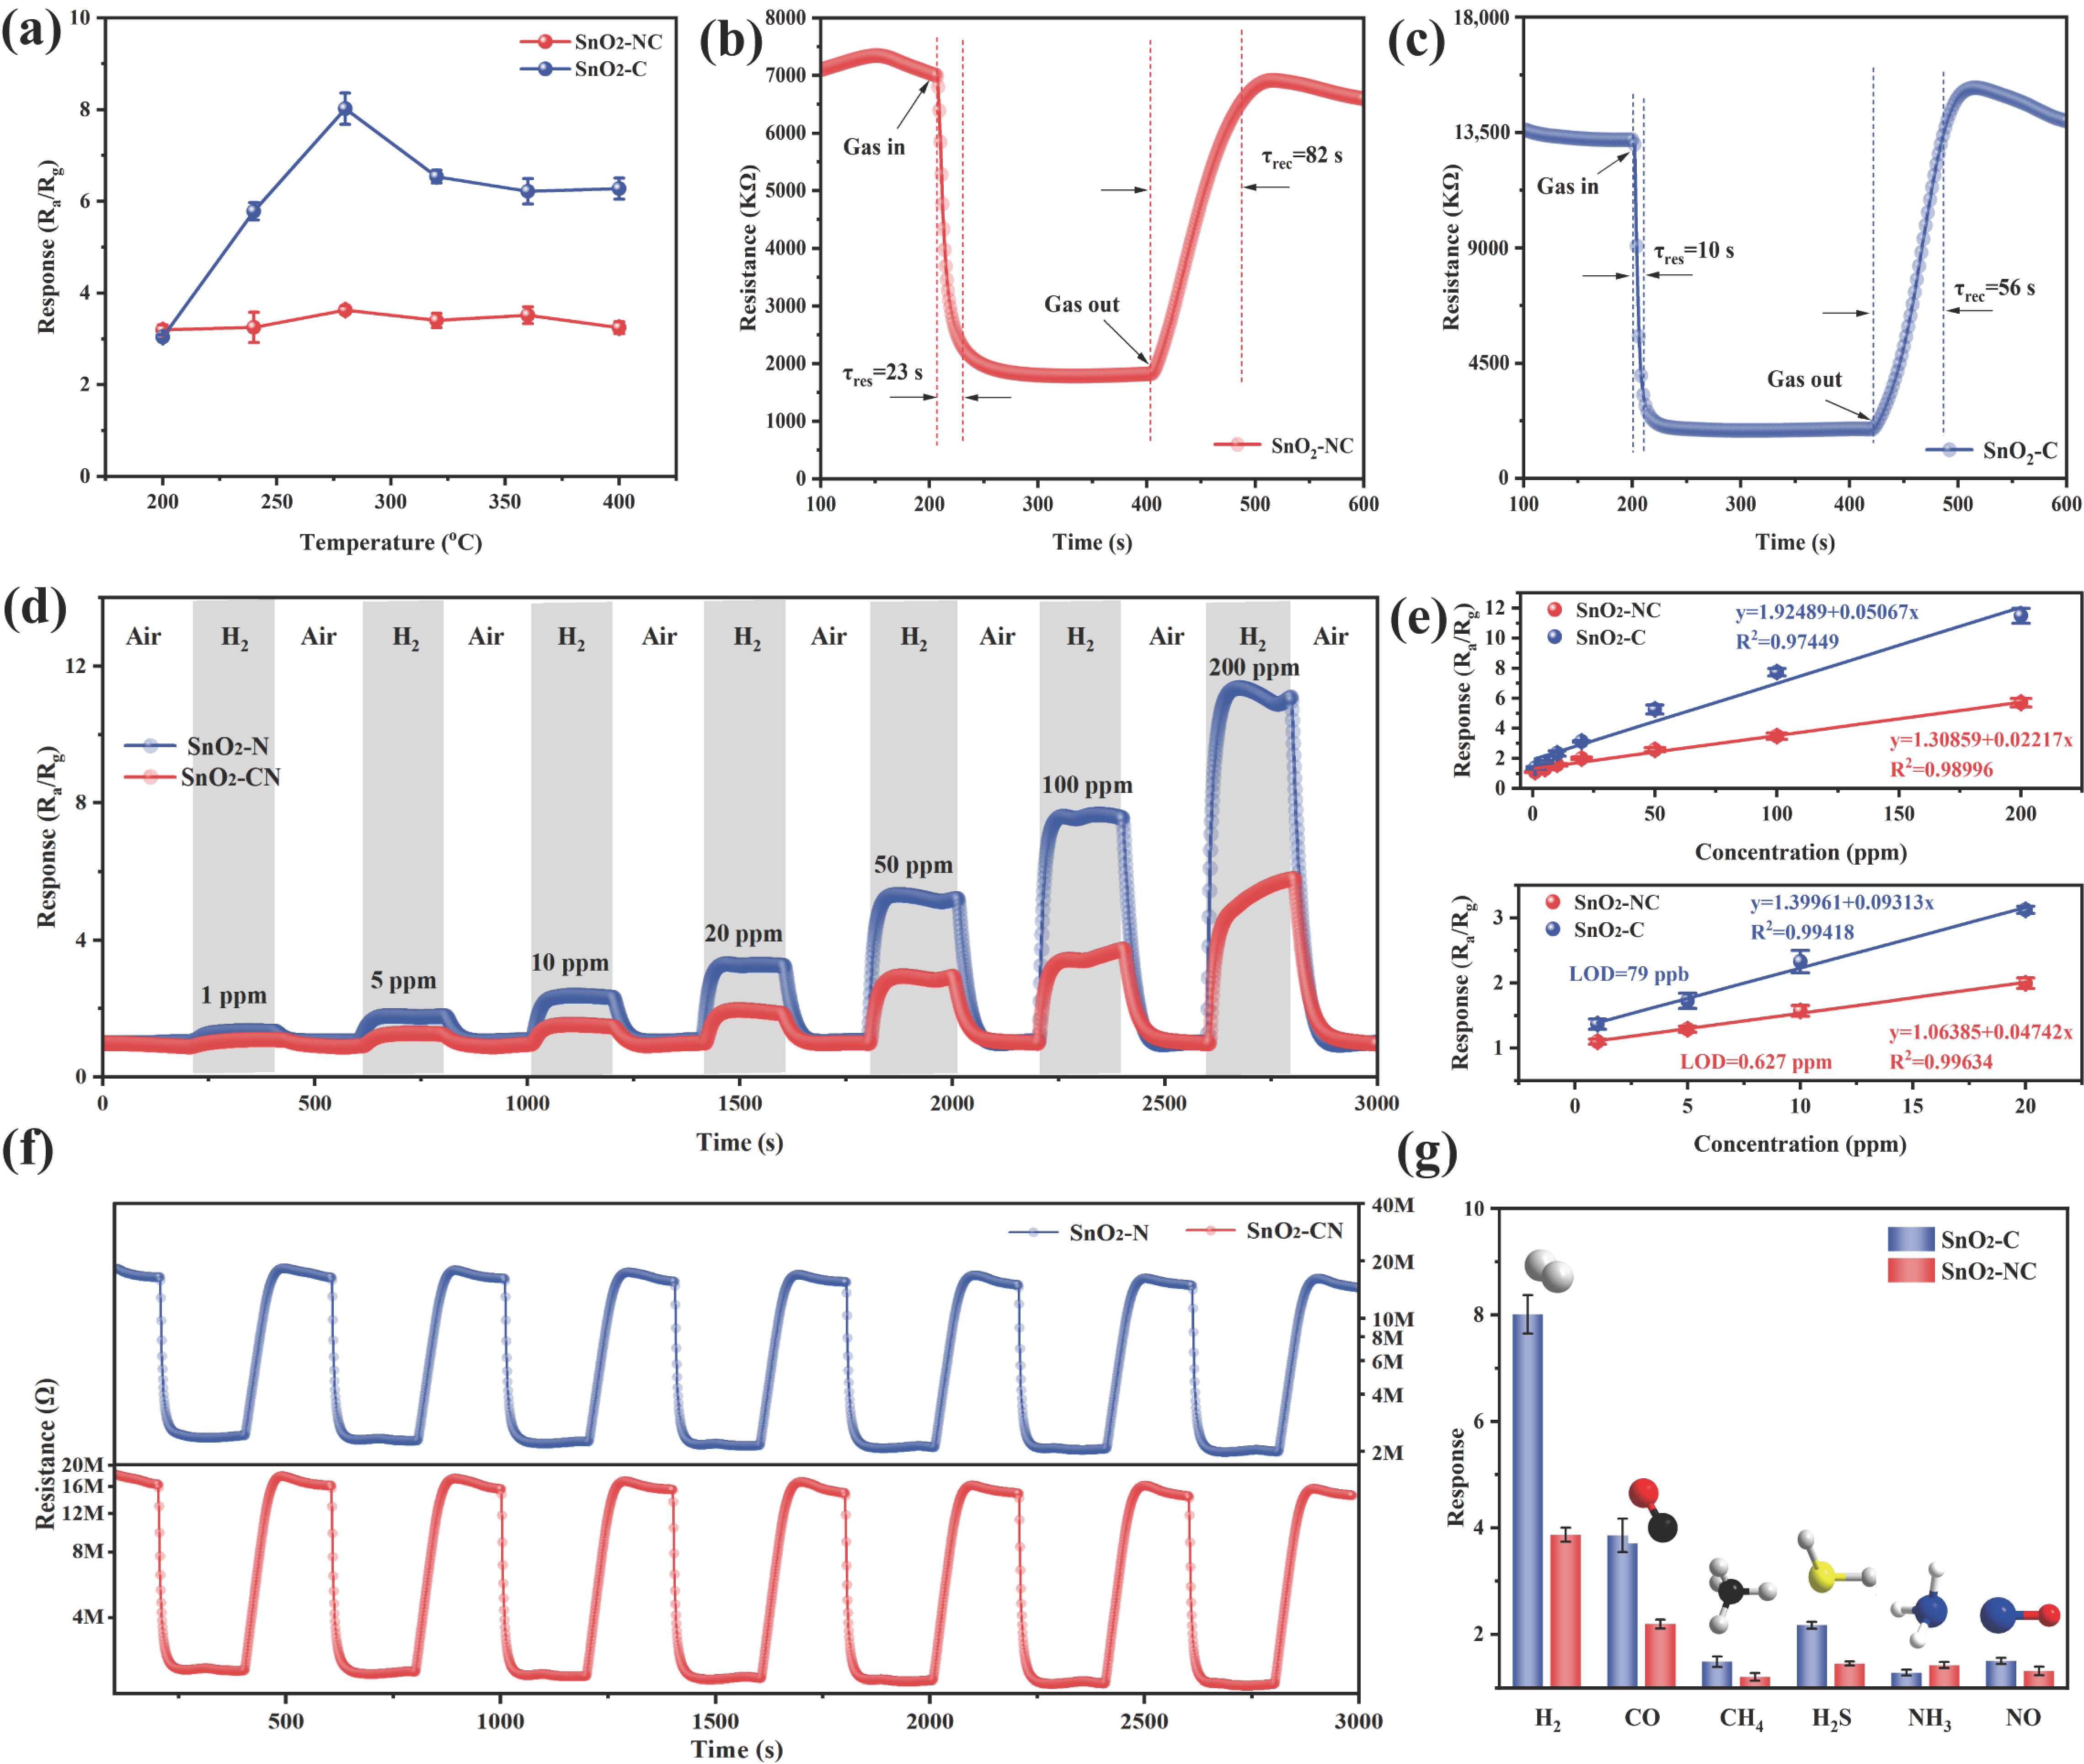
To examine the impact of SnO2 crystalline phases on H2 sensing characteristics, the H2 response of the prepared SnO2-based sensors was comprehensively assessed and is shown in Figure 5. It is well known that operating temperature played a critical role in determining sensing performance [7]. At low temperatures, the reaction between the target gas and adsorbed oxygen species was kinetically limited due to insufficient activation energy. In contrast, at elevated temperatures, the desorption of both adsorbed oxygen, and the target gas was enhanced, potentially reducing the sensor sensitivity. Therefore, the H2 sensing responses (100 ppm) were recorded over a temperature range from 200 °C to 400 °C to determine the optimal operating condition. As shown in Figure 5a, the response exhibited a typical volcano-shaped trend, reaching a maximum at 280 °C. Based on this, 280 °C was selected as the working temperature for subsequent sensing measurements. Across the entire temperature range, SnO2-C consistently exhibited a higher response toward H2 compared to SnO2-NC. Notably, at 280 °C, the response of SnO2-C to 100 ppm H2 reached 7.73, which was more than twice that of SnO2-NC (3.75).
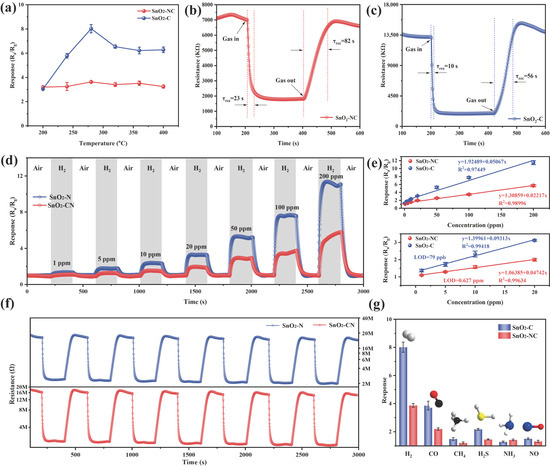
Figure 5.
(a) Gas sensing performance of SnO2-NC and SnO2-C toward 100 ppm H2 under different operating temperatures; real-time resistance variations (b,c), reproducibility of sensor responses (d) and cyclic response and recovery behavior (f) of SnO2-NC and SnO2-C upon exposure to 100 ppm H2 at 280 °C; (e) relationship between sensor response and varying H2 concentration; (g) selectivity profiles of SnO2-NC and SnO2-C sensors to 100 ppm of different target gases at 280 °C.
The dynamic response–recovery characteristics of SnO2-NC and SnO2-C toward 100 ppm H2 at 280 °C were evaluated, as shown in Figure 5b,c. SnO2-NC exhibited a response and recovery time of 23 s and 82 s, respectively, while SnO2-C showed significantly shorter time of 10 s (response) and 56 s (recovery), indicating faster gas adsorption and desorption dynamics. In addition, at 280 °C, SnO2-C exhibited a higher baseline resistance (13.5 MΩ) compared to SnO2-NC (7 MΩ). This elevated resistance in air suggested a greater density of chemisorbed oxygen species (O− and O2−) and the formation of a wider electron depletion layer at the surface. Upon exposure to the reducing gas (H2), this led to more pronounced modulation of conductivity, thereby enhancing the sensing performance [34].
Figure 5d displays the dynamic response–recovery curves of SnO2-NC and SnO2-C sensors exposed to varying concentrations of H2 at 280 °C (1–200 ppm). Clearly, the sensing responses increased progressively as the H2 concentration rose from 1 ppm to 200 ppm. Moreover, the sensing performance was closely correlated with the crystal phase of SnO2. Specifically, the mixed-phase SnO2-C exhibited a significantly higher response toward H2 compared to the single-phase SnO2-NC, highlighting the critical role of phase composition in enhancing gas sensitivity. In addition, Figure 5e further depicts how the sensing responses of SnO2-NC and SnO2-C sensors vary as a function of gas concentration. Both sensors exhibited excellent linearity in the high-concentration range. However, as the H2 concentration decreased, noticeable discrepancies emerged between the fitted curves and the experimental data. To address this issue, a separate fitting was performed in the low-concentration range (1–20 ppm) to more accurately determine the LOD, and the resulting fit in this region showed higher reliability. Based on the signal-to-noise ratio criterion (S/N = 3), where the standard deviation of the response was calculated using 100 data points under a stable baseline at 0 ppm H2, the theoretical LOD for SnO2-NC was estimated to be 0.627 ppm, while that of SnO2-C reached as low as 79 ppb. This highlights the superior sensitivity and strong potential of SnO2-C for quantitative H2 detection in practical applications [35].
The repeatability of SnO2-C and SnO2-NC material was evaluated to further assess their sensing reliability. As shown in Figure 5f, both sensing materials were exposed to 100 ppm H2 over seven consecutive cycles, and the response profiles remained highly consistent. After each H2 exposure and subsequent recovery in air, the sensors returned to their baseline states, indicating excellent repeatability and good signal stability. In addition to repeatability, selectivity is a key performance indicator for gas sensors. CO, CH4, and NH3 are commonly used as carrier or background gases in hydrogen pipelines and fuel processing systems, where they may compete with H2 for adsorption on the sensor surface, thereby introducing potential interference. In addition, gases such as H2S and NO are frequently present in industrial environments, such as petrochemical facilities, chemical plants, or the metallurgical industry, where trace hydrogen detection is often required under the mixed-gas conditions. Figure 5g displays the selectivity profiles of SnO2-NC and SnO2-C when exposed to 100 ppm concentrations of different gases, including H2, CO, CH4, H2S, NO, and NH3. In both cases, the response to H2 was markedly higher than that to the interfering gases, confirming their outstanding selectivity toward H2. The long-term stability of the SnO2-C sensor was further examined by monitoring its response to 100 ppm H2 over 30 days (Figure S4). The sensor retained over 85% of its initial response, demonstrating excellent durability and operational stability for the extended use. In addition, to investigate the effect of humidity on gas-sensing performance, the response of SnO2-C to 100 ppm H2 was tested under different relative humidity levels (0–80%) at 280 °C (Figure S5). As the relative humidity increased from 0% to 80%, the response to hydrogen gradually decreased, which could be attributed to the formation of inactive hydroxyl groups resulting from the interaction between water molecules and surface-active oxygen species [36]. Table 1 summarizes the H2 sensing performance of various sensors. The comparison indicated that the SnO2-C sensor developed in this study maintained a high response and short response/recovery time at a relatively low operating temperature, demonstrating excellent gas sensing performance and great potential for the practical applications.

Table 1.
Comparison of the operating temperature, response, response/recovery time, and LOD of H2 sensors reported in the literature and this work.
3.4. Phase-Dependent Gas Sensing Behavior of SnO2
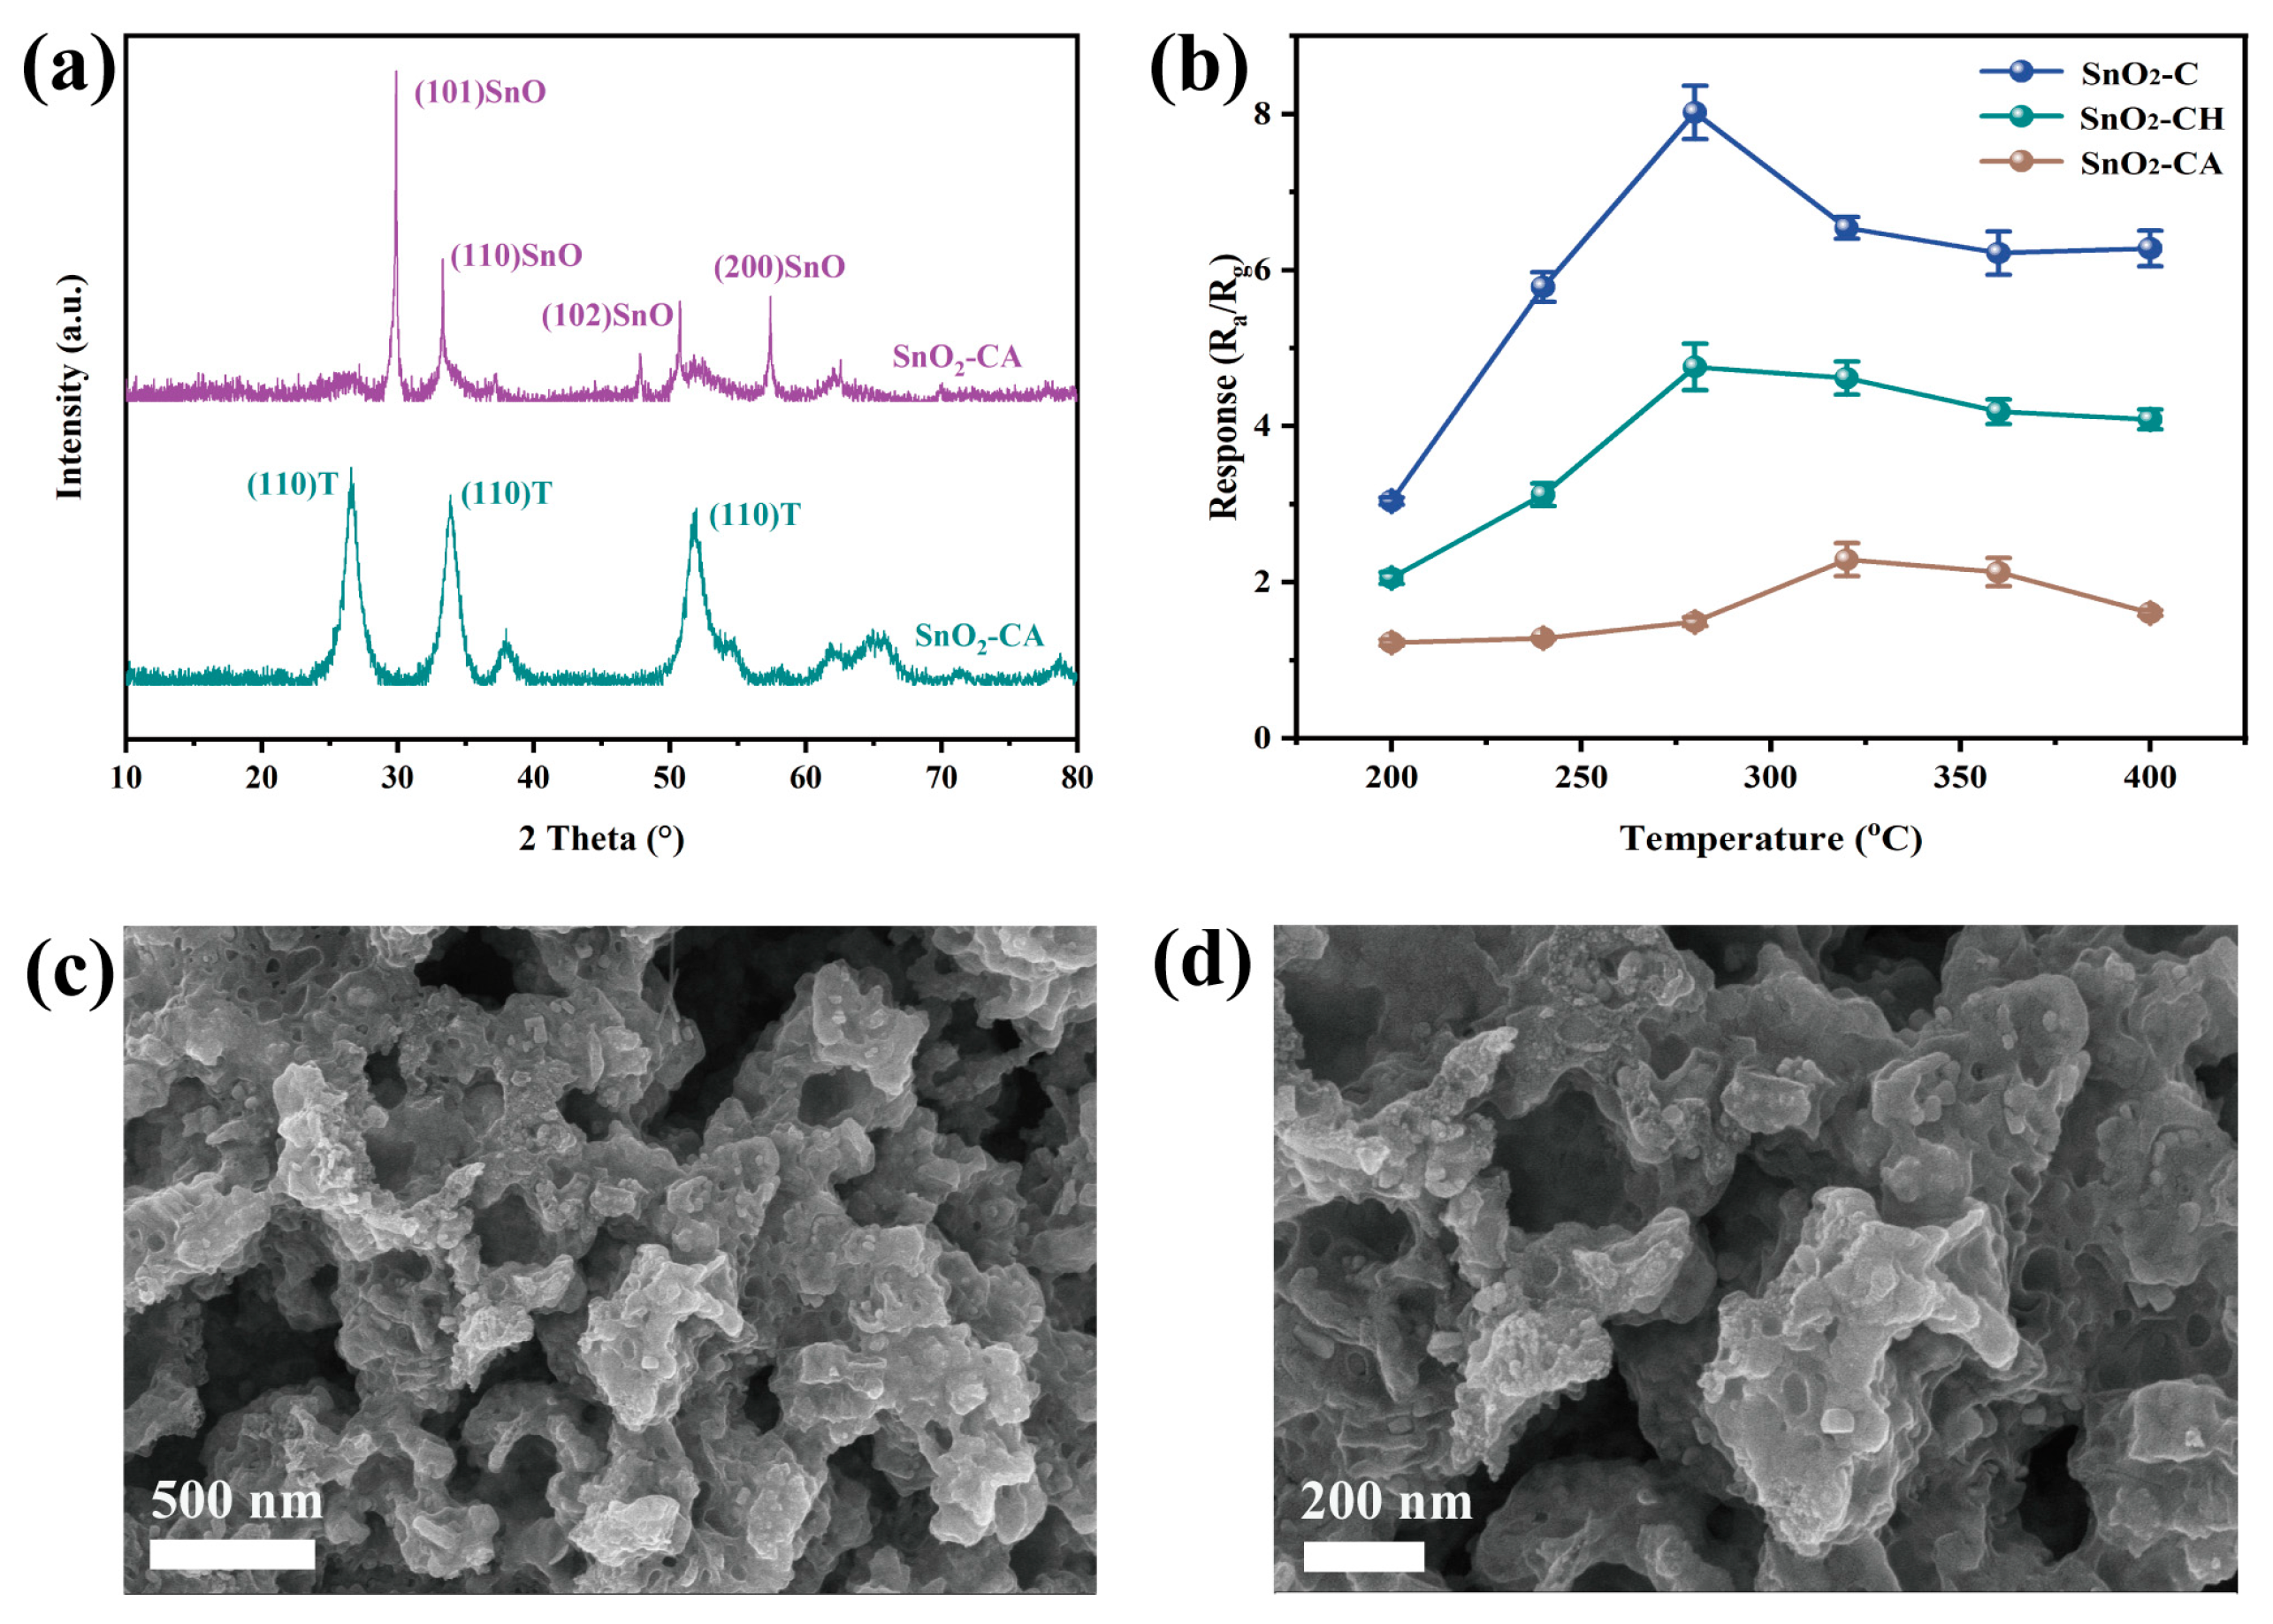
To further investigate the effect of crystal phase on the gas-sensing performance of SnO2, the MOF-derived precursor SnO2/H3BTC-C was calcined under two different atmospheres of flowing air and Ar. This approach was employed to minimize the influence of morphology on gas sensing performance. As shown in Figure 6a, the XRD patterns of SnO2-CH and SnO2-CA revealed distinct phase compositions. As expected, SnO2-CH, calcined under the oxygen-rich condition, exhibited diffraction peaks corresponding exclusively to T-SnO2, without evidence of the O-SnO2. In contrast, SnO2-CA, which was calcined under oxygen-deficient Ar atmosphere, displayed characteristic peaks of SnO, indicating the presence of reduced tin species. These results support the conclusion that the formation of the O-SnO2 phase occurs preferentially under the oxygen-deficient condition and confirm that calcination atmosphere played a critical role in determining the final crystal phase of the material.
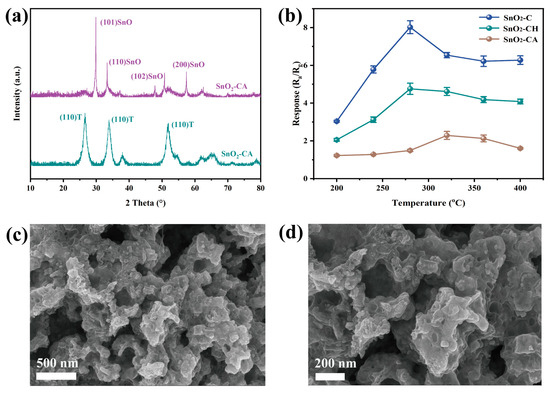
Figure 6.
(a) XRD patterns and (b) responses toward 100 ppm H2 at various operating temperatures of SnO2-CH and SnO2-CA, (c,d) SEM images of SnO2-CA.
Furthermore, gas sensing devices were fabricated under the same conditions as previously described, and their responses to 100 ppm H2 were evaluated at various temperatures. The results are shown in Figure 6b. The mixed-phase SnO2-C still exhibited the highest response to H2, while SnO2-CH showed a comparable response to that of the single-phase SnO2-NC, albeit slightly higher. This slight enhancement was likely due to the higher phase purity of SnO2-CH, which might still contain trace amounts of O-SnO2. Surprisingly, SnO2-CA demonstrated the lowest sensing ability, indicating that SnO is not sufficiently sensitive to H2, consistent with previous reports [45]. In addition, the poor performance may also be attributed to the substantial carbon residues generated during calcination in an oxygen-deficient atmosphere, which likely led to significant pore blockage and hindered the diffusion of hydrogen molecules (as evidenced in Figure 6c,d and Figure S6).
3.5. Gas Sensing Mechanism
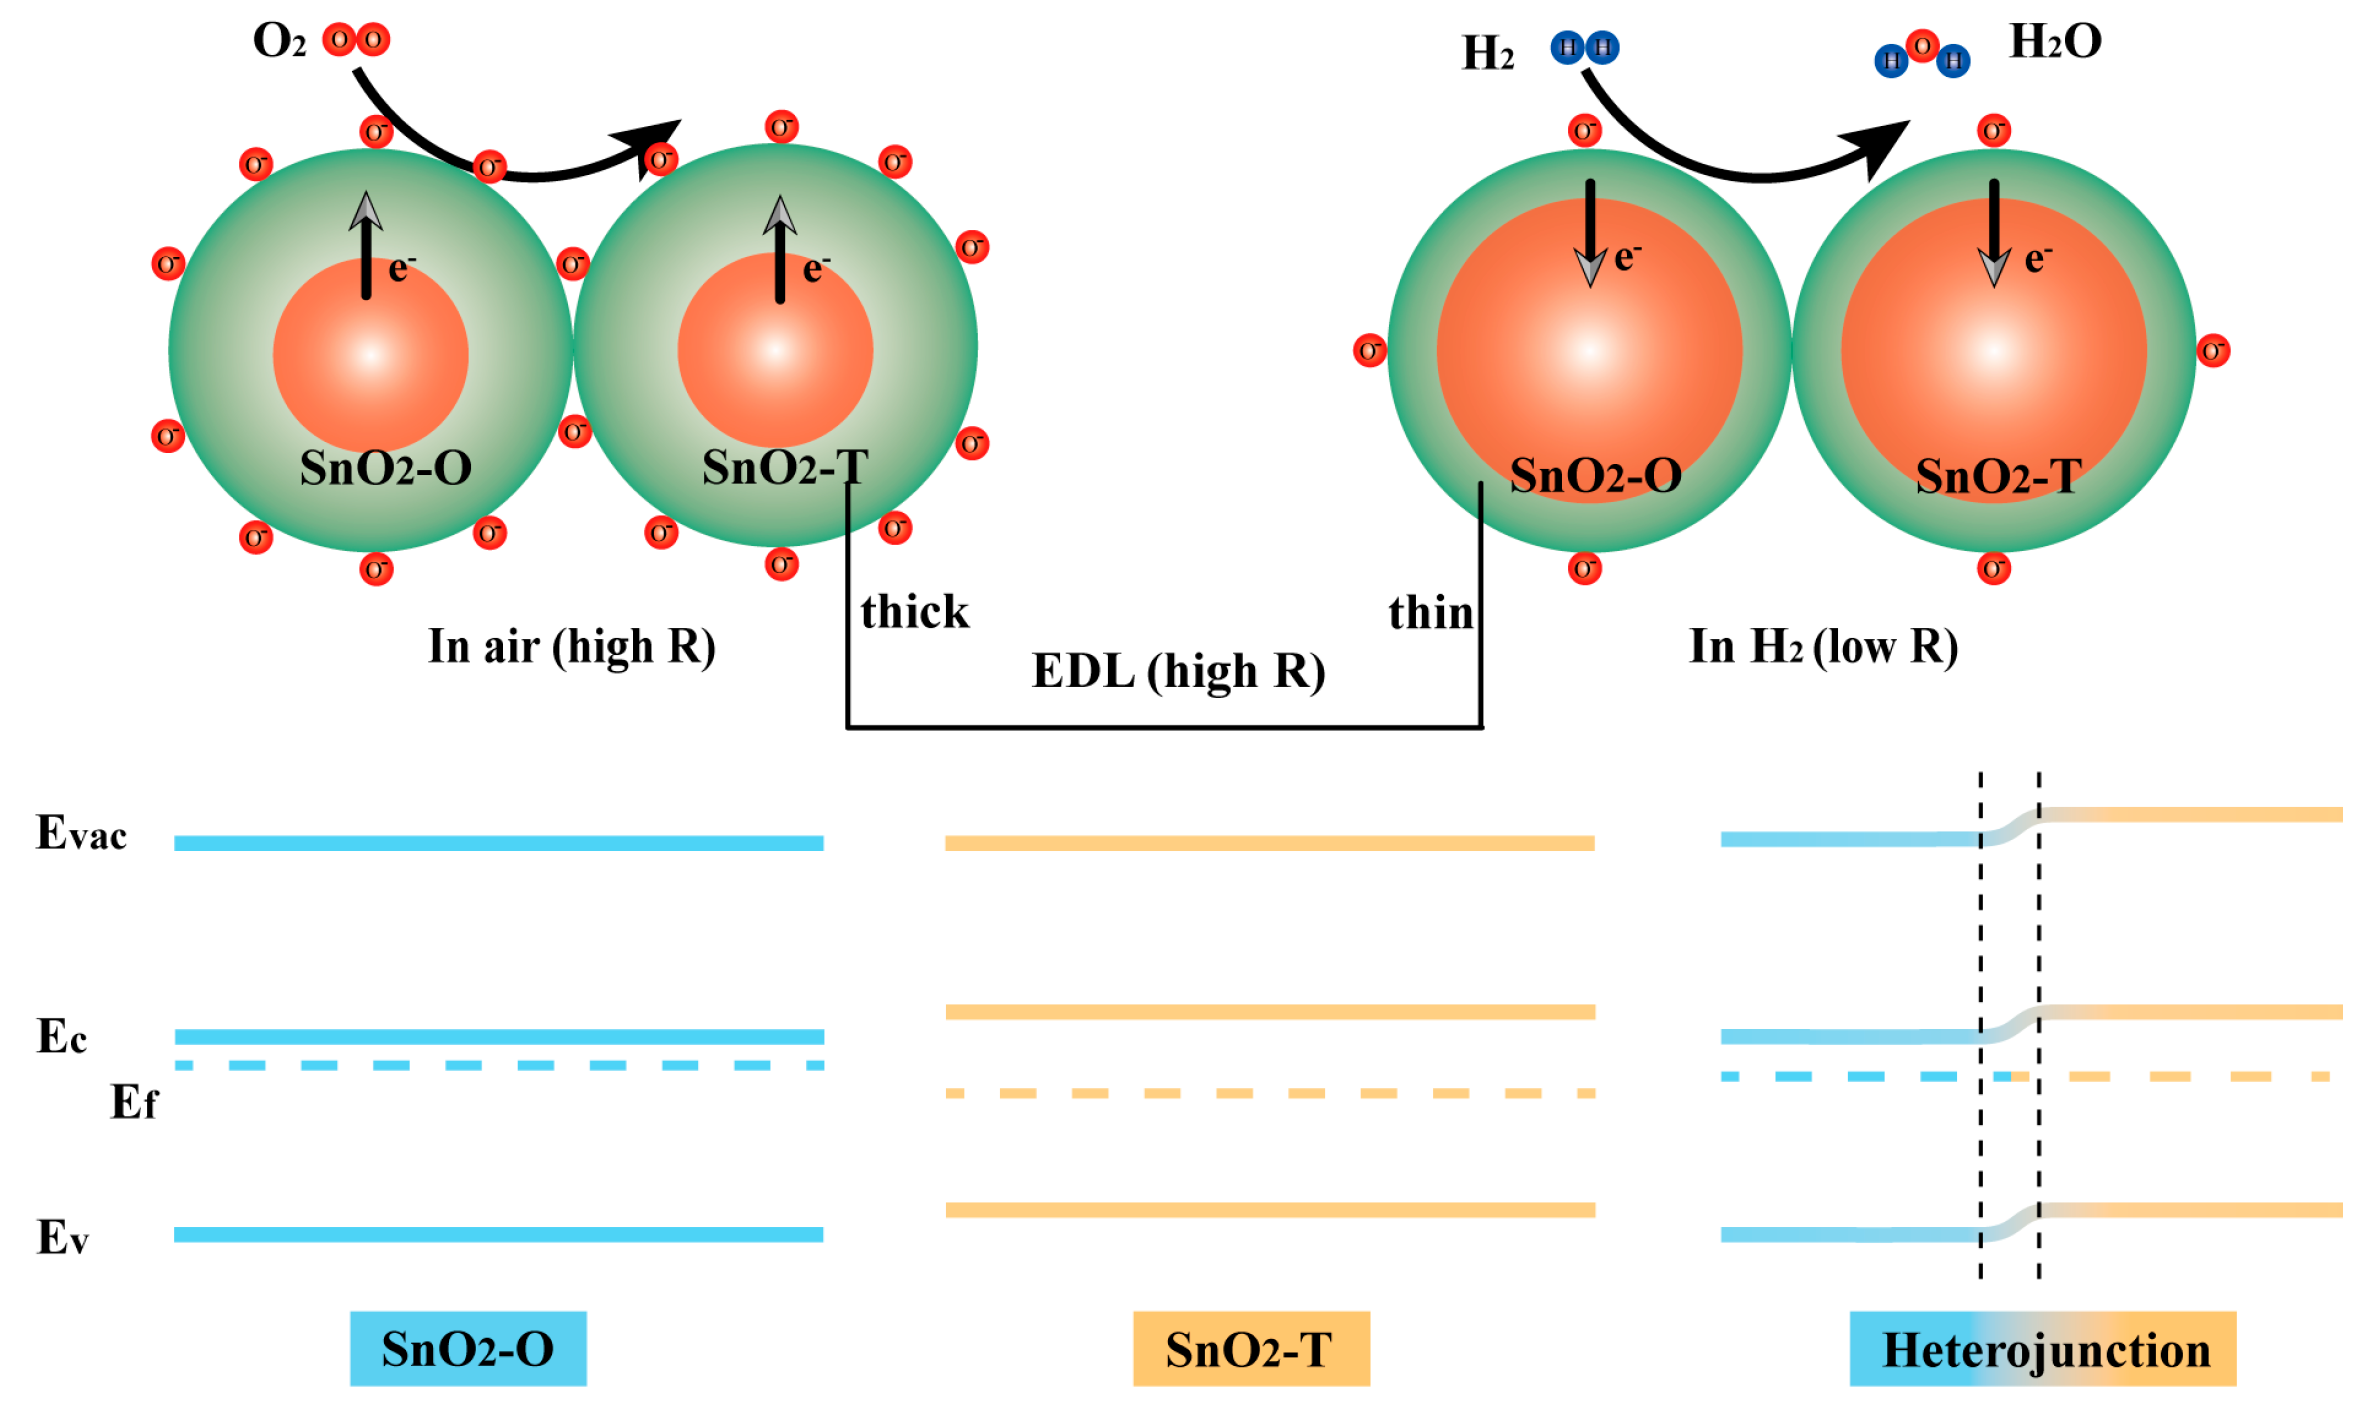
N-type semiconductors (such as SnO2, ZnO, and In2O3), where electrons serve as majority charge carriers, exhibit excellent gas sensing performance, particularly for reducing gases such as H2, CO, and NH3 [46,47]. Their gas sensing mechanism primarily involves two aspects: surface adsorption/reaction processes and the resulting changes in electrical conductivity, as shown in Figure 7 [48,49].
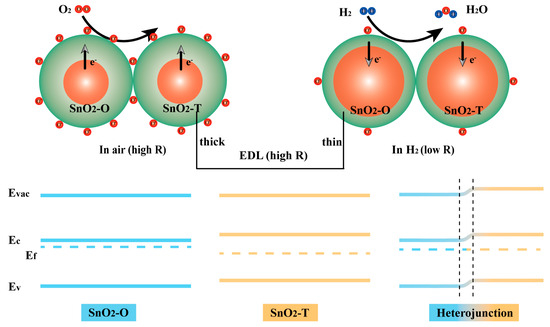
Figure 7.
Gas sensing mechanism for SnO2-C exposed to air and H2 gas.
Under ambient or elevated temperature conditions, oxygen molecules from the air are adsorbed onto the surface of the n-type semiconductor, forming chemisorbed oxygen species:
During this process, electrons transfer from the conduction band of the semiconductor to the adsorbed oxygen species on the surface, resulting in the formation of a surface depletion layer and band bending. This reduces the overall electrical conductivity of the material.
When a reducing gas such as H2 is introduced into the atmosphere, it reacts with the surface-adsorbed oxygen species as follows:
The reaction releases electrons back into the conduction band of the semiconductor, leading to a significant increase in electrical conductivity. Since the conductivity of n-type semiconductors primarily depends on the concentration of free electrons, the introduction of H2 causes the surface depletion layer to narrow, the conduction band electron density to increase, and the overall conductivity to rise [50]. This conductivity change is detected by an external circuit, producing a measurable gas sensing signal.
To improve the H2 sensing performance, the SnO2 prepared in this study adopts a mixed-phase structure composed of O-SnO2 and T-SnO2, forming an n–n type homojunction. The work functions of T-SnO2 and O-SnO2 are different. Upon contact, electrons transfer from one phase to the other until their Fermi levels align, resulting in the formation of an n–n heterojunction (as shown in Figure 7). This process also induces the formation of an electron depletion layer around the heterojunction. Under the influence of the n–n heterojunction, the depletion layer becomes wider, and the resistance of the SnO2-C sensor (approximately 13.5 MΩ) is significantly higher than that of the SnO2-NC sensor (approximately 7 MΩ). On the other hand, XPS analysis revealed that SnO2-C possessed a higher concentration of oxygen vacancies. These vacancies increase the surface electron density and enhance the adsorption activity, facilitating the enrichment and activation of oxygen molecules, and thus boosting the reaction kinetics between the adsorbed oxygen species and reducing gases such as H2. The synergistic effects of these two mechanisms improve not only the sensitivity and selectivity toward the target gas, but also the response/recovery speed and overall sensing stability.
4. Conclusions
In conclusion, this work demonstrated a facile CTAB-directed strategy to tailor Sn-MOF precursor morphology and, in turn, regulate the crystal phase composition of SnO2, leading to markedly enhanced H2 sensing performance. By introducing CTAB, we successfully stabilized mixed-phase SnO2 combining orthorhombic and tetragonal domains, which outperformed single-phase (tetragonal) SnO2 in every metric. Specifically, the mixed-phase sensing material delivered over twice the response of pure SnO2 at 100 ppm H2, achieved an ultralow detection limit of ~75 ppb, and exhibited faster response/recovery time, underscoring its superior sensitivity. These exceptional properties are attributed to the synergistic heterojunctions between coexisting SnO2 phases, which promote surface oxygen activation, as evidenced by a higher fraction of chemisorbed oxygen species, thereby facilitating more efficient redox reactions with hydrogen.
Although SnO2-C exhibited excellent sensitivity, its selectivity still required improvement. This limitation was commonly observed in unmodified metal oxide-based sensors, as various reducing gases underwent similar oxygen adsorption and electron transfer processes on the surface, resulting in overlapping response signals. While MOF-derived SnO2 possessed a high specific surface area and porosity, which were favorable for gas diffusion and adsorption, its intrinsic structure lacked molecular recognition capability. To enhance selectivity, previous studies often employed noble metal decoration or constructed heterojunctions to tune the band structure and promote selective reactions. However, these strategies were generally costly and lacked a clear direction for further optimization. In the follow-up of this work, we will attempt to introduce an MOF-based selective layer with molecular sieving capability on the surface of SnO2, aiming to achieve size-exclusion effects and thereby improve H2 selectivity. This strategy is under investigation and is expected to provide a new pathway for the development of highly selective MOF-derived SnO2 gas sensors.
Overall, this study establishes crystal phase engineering (via surfactant-assisted MOF templating) as an effective paradigm for designing high-performance gas sensors. These results not only advance the fundamental understanding of how crystal phase influences gas sensing behavior but also provide valuable guidance for designing future hydrogen safety sensors applicable to early warning systems and industrial-scale H2 monitoring.
Supplementary Materials
The following supporting information can be downloaded at: https://www.mdpi.com/article/10.3390/chemosensors13050192/s1, Figure S1: Composition of the gas-sensing device: (a) ceramic substrate, (b) Ag-Pd interdigital electrodes, (c) gas-sensing material, (d) device. Figure S2: Schematic of the gas sensing test setup. Figure S3: (a,b) Diameter and length distributions of Sn/H3BTC-NC. (c,d) Grain size distributions of Sn/H3BTC-C and SnO2-C. Figure S4: Long term stability measurement of SnO2-C sensor toward 100 ppm H2 at 280 °C. Figure S5: Response of the SnO2-C gas sensor toward 100 ppm H2 under different humidity conditions at 280 °C. Figure S6: EDS element mapping of SnO2-CA; Table S1: High-resolution XPS peak fitting parameters of SnO2-C. Table S2: High-resolution XPS peak fitting parameters of SnO2-NC.
Author Contributions
Methodology, M.L., L.W., S.R., S.C., X.Y. and C.C.X.; software, S.R., B.B. and X.L.; formal analysis, M.L. and C.Z.; investigation, M.L. and C.C.X.; resources, S.R., S.C., C.H., X.L. and X.Y.; data curation, M.L.; writing—original draft, M.L.; writing—review & editing, M.L., L.W., S.R., B.B., S.C., C.H., C.Z., X.Y. and C.C.X.; visualization, B.B.; funding acquisition, S.R. All authors have read and agreed to the published version of the manuscript.
Funding
The current work was financially supported by the National Natural Science Foundation of China (Nos. 52174298 and 52374411) and the Outstanding Youth Science Foundation of Shaanxi Province (No. 2025JC-JCQN-031).
Institutional Review Board Statement
Not applicable.
Informed Consent Statement
Not applicable.
Data Availability Statement
The raw data supporting the conclusions of this article will be made available by the authors on request.
Conflicts of Interest
The authors declare that they have no competing interests.
References
- Guo, J.; Chen, P. Interplay of Alkali, Transition Metals, Nitrogen, and Hydrogen in Ammonia Synthesis and Decomposition Reactions. Acc. Chem. Res. 2021, 54, 2434–2444. [Google Scholar] [CrossRef] [PubMed]
- Chen, Z.; Erwin, B.J.; Che, L. Hydrocracking of polyethylene to hydrocarbon fuels over Pt/USY catalysts: Assessment of the hydrogen donors. J. Clean. Prod. 2023, 424, 138861. [Google Scholar] [CrossRef]
- Singla, M.K.; Nijhawan, P.; Oberoi, A.S. Hydrogen fuel and fuel cell technology for cleaner future: A review. Environ. Sci. Pollut. Res. Int. 2021, 28, 15607–15626. [Google Scholar] [CrossRef] [PubMed]
- Boretti, A. Hydrogen internal combustion engines to 2030. Int. J. Hydrogen Energy 2020, 45, 23692–23703. [Google Scholar] [CrossRef]
- Tang, J.; Chu, M.-S.; Li, F.; Feng, C.; Liu, Z.-G.; Zhou, Y.-S. Development and progress on hydrogen metallurgy. Int. J. Min. Metmater. 2020, 27, 713–723. [Google Scholar] [CrossRef]
- Silva, S.F.; Coelho, L.; Frazao, O.; Santos, J.L.; Malcata, F.X. A Review of Palladium-Based Fiber-Optic Sensors for Molecular Hydrogen Detection. IEEE Sens. J. 2012, 12, 93–102. [Google Scholar] [CrossRef]
- Dey, A. Semiconductor metal oxide gas sensors: A review. Mat. Sci. Eng. B 2018, 229, 206–217. [Google Scholar] [CrossRef]
- Zhu, L.Y.; Ou, L.X.; Mao, L.W.; Wu, X.Y.; Liu, Y.P.; Lu, H.L. Advances in Noble Metal-Decorated Metal Oxide Nanomaterials for Chemiresistive Gas Sensors: Overview. Nanomicro Lett. 2023, 15, 89. [Google Scholar] [CrossRef]
- Wang, L.; Li, J.; Xu, C.; Yang, Z.; Tan, X.; Dong, Z.; Xu, L.; Zhang, D.; He, C. 2D SnSe2 micro-flower decorated with 0D In2O3 nanoparticles for low-temperature low-concentration TEA detection. Nano Mater. Sci. 2024, 6, 764–774. [Google Scholar] [CrossRef]
- Wang, W.; Cao, J.; Wang, D.; Zhang, R.; Zhang, Y.; Zhao, L. Insight into SnO2-based gas-sensitive materials and readout circuits for semiconductor gas sensors. Nano Mater. Sci. 2025, in press. [Google Scholar] [CrossRef]
- Ab Kadir, R.; Li, Z.; Sadek, A.Z.; Abdul Rani, R.; Zoolfakar, A.S.; Field, M.R.; Ou, J.Z.; Chrimes, A.F.; Kalantar-zadeh, K. Electrospun Granular Hollow SnO2 Nanofibers Hydrogen Gas Sensors Operating at Low Temperatures. J. Phys. Chem. C 2014, 118, 3129–3139. [Google Scholar] [CrossRef]
- Lu, S.; Zhang, Y.; Liu, J.; Li, H.-Y.; Hu, Z.; Luo, X.; Gao, N.; Zhang, B.; Jiang, J.; Zhong, A.; et al. Sensitive H2 gas sensors based on SnO2 nanowires. Sens. Actuators B 2021, 345, 130334. [Google Scholar] [CrossRef]
- Yin, X.-T.; Dastan, D.; Gity, F.; Li, J.; Shi, Z.; Alharbi, N.D.; Liu, Y.; Tan, X.-M.; Gao, X.-C.; Ma, X.-G.; et al. Gas sensing selectivity of SnO2-xNiO sensors for homogeneous gases and its selectivity mechanism: Experimental and theoretical studies. Sens. Actuators A 2023, 354, 114273. [Google Scholar] [CrossRef]
- Das, S.; Jayaraman, V. SnO2: A comprehensive review on structures and gas sensors. Prog. Mater Sci. 2014, 66, 112–255. [Google Scholar] [CrossRef]
- Wang, B.J.; Ma, S.Y. High response ethanol gas sensor based on orthorhombic and tetragonal SnO2. Vacuum 2020, 177, 113851. [Google Scholar] [CrossRef]
- Zhang, Y.; Yu, X.; Hou, Y.; Liu, C.; Xie, G.; Chen, X. Current research status of MOF materials for catalysis applications. Mol. Catal. 2024, 555, 113851. [Google Scholar] [CrossRef]
- Khan, M.; Akmal, Z.; Tayyab, M.; Mansoor, S.; Zeb, A.; Ye, Z.; Zhang, J.; Wu, S.; Wang, L. MOFs materials as photocatalysts for CO2 reduction: Progress, challenges and perspectives. Carbon Capture Sci. Technol. 2024, 11, 100191. [Google Scholar] [CrossRef]
- Huang, J.-M.; Zhang, X.-D.; Huang, J.-Y.; Zheng, D.-S.; Xu, M.; Gu, Z.-Y. MOF-based materials for electrochemical reduction of carbon dioxide. Coord. Chem. Rev. 2023, 494, 215333. [Google Scholar] [CrossRef]
- Liu, M.; Wang, L.; Ren, S.; Bai, B.; Chai, S.; He, C.; Zheng, C.; Yin, X.; Li, F. Preparation, improvement, and application of metal–organic framework-based sensing materials for gas leakage and emission: A review. Nano Mater. Sci. 2025, in press. [Google Scholar] [CrossRef]
- Iravani, S. Surfactant-free synthesis of metal and metal oxide nanomaterials: A perspective. RSC Sustain. 2023, 1, 72–82. [Google Scholar] [CrossRef]
- Sanei, S.A.; Masoudpanah, S.M.; Bafghi, M.S. CTAB-assisted solvothermal growth of CuCo2S4 on nickel foam for high-performance symmetric supercapacitor. J. Energy Storage 2023, 73, 109130. [Google Scholar] [CrossRef]
- Zhu, L.; Wang, J.; Liu, J.; Chen, X.; Xu, Z.; Ma, Q.; Wang, Z.; Liang, J.; Li, S.; Yan, W. Designing highly sensitive formaldehyde sensors via A-site cation deficiency in LaFeO3 hollow nanofibers. Appl. Surf. Sci. 2022, 590, 153085. [Google Scholar] [CrossRef]
- Zhu, L.; Zhang, J.; Wang, J.; Liu, J.; Yan, W. Hierarchical Heterojunctions of Metal Sulfide WS2 Nanosheets/Metal Oxide In2O3 Nanofibers for an Efficient Detection of Formaldehyde. Nanomaterials 2024, 14, 1702. [Google Scholar] [CrossRef] [PubMed]
- Forgan, R.S. Modulated self-assembly of metal-organic frameworks. Chem. Sci. 2020, 11, 4546–4562. [Google Scholar] [CrossRef]
- Kou, H.; Shao, T.; Dong, J.; Cheng, Y.; Zhang, F.; Guo, J.; Liu, X.; Wang, X. Ethanol sensor built on a SnO2/In2O3 composite generated from MOF. Sens. Actuators B 2023, 396, 134628. [Google Scholar] [CrossRef]
- Zhang, X.; Huang, H.; Zhang, Y.; Liu, D.; Tong, N.; Lin, J.; Chen, L.; Zhang, Z.; Wang, X. Phase Transition of Two-Dimensional beta-Ga2O3 Nanosheets from Ultrathin gamma-Ga2O3 Nanosheets and Their Photocatalytic Hydrogen Evolution Activities. ACS Omega 2018, 3, 14469–14476. [Google Scholar] [CrossRef]
- Shek, C.H.; Lai, J.K.L.; Lin, G.M.; Zheng, Y.F.; Liu, W.H. Nanomicrostructure, chemical stability and abnormal transformation in ultrafine particles of oxidized tin. J. Phys. Chem. Solids 1997, 58, 13–17. [Google Scholar] [CrossRef]
- Choi, P.G.; Izu, N.; Shirahata, N.; Masuda, Y. Improvement of sensing properties for SnO2 gas sensor by tuning of exposed crystal face. Sens. Actuators B 2019, 296, 126655. [Google Scholar] [CrossRef]
- Fondell, M.; Gorgoi, M.; Boman, M.; Lindblad, A. An HAXPES study of Sn, SnS, SnO and SnO2. J. Electron. Spectrosc. Relat. Phenom. 2014, 195, 195–199. [Google Scholar] [CrossRef]
- Bai, H.; Feng, C.; Chen, Y.; Du, Y.; Feng, Y.; Liu, K.; Yan, Y.; Liu, J.; Zhang, B.; Wang, J.; et al. Room temperature gas sensor based on porous NiO nanoplates modified with rGO nanosheets and SnO2 nanoparticles for accurate and rapid ppb-level NO2 detection. Nano Mater. Sci. 2025, in press. [Google Scholar] [CrossRef]
- Zhang, X.; Sun, S.; Wang, H.; Lyu, J.; Yu, X.; Yang, B.; Yang, M.; Duan, Z.; Yang, Q.; Cui, J. Mechanism insight into twin-dependent photocatalysis in near-infrared light-responsive Cu2O nanocrystals with rich oxygen vacancies. Nano Mater. Sci. 2024, in press. [Google Scholar] [CrossRef]
- Jing, J.; Li, J.; Xue, Q.; Wang, P.; Li, W.; Meng, Y.; Zhan, Z.; Zhang, Y.; Li, F. Stable Pt/PtO2-enhanced 3D inverse opal SnO2 gas sensor for high sensitivity and fast H2 sensing at low temperatures. Sens. Actuators B 2025, 431, 13746. [Google Scholar] [CrossRef]
- Yang, L.; Fan, W.; Li, Y.; Wei, L.; Zhao, X. Pressure-induced ferroelastic phase transition in SnO2 from density functional theory. J. Chem. Phys. 2014, 140, 164706. [Google Scholar] [CrossRef] [PubMed]
- Khomarloo, N.; Mohsenzadeh, E.; Gidik, H.; Bagherzadeh, R.; Latifi, M. Overall perspective of electrospun semiconductor metal oxides as high-performance gas sensor materials for NOx detection. RSC Adv. 2024, 14, 7806–7824. [Google Scholar] [CrossRef]
- Yang, W.; Wan, P.; Jia, M.; Hu, J.; Guan, Y.; Feng, L. A novel electronic nose based on porous In2O3 microtubes sensor array for the discrimination of VOCs. Biosens. Bioelectron. 2015, 64, 547–553. [Google Scholar] [CrossRef]
- Wang, Z.; Li, P.; Feng, B.; Feng, Y.; Cheng, D.; Wei, J. Wireless Gas Sensor Based on the Mesoporous ZnO-SnO2 Heterostructure Enables Ultrasensitive and Rapid Detection of 3-Methylbutyraldehyde. ACS Sens. 2024, 9, 2585–2595. [Google Scholar] [CrossRef]
- Xue, N.; Zhang, Q.; Zhang, S.; Zong, P.; Yang, F. Highly Sensitive and Selective Hydrogen Gas Sensor Using the Mesoporous SnO2 Modified Layers. Sensors 2017, 17, 2351. [Google Scholar] [CrossRef]
- Umar, A.; Ammar, H.Y.; Kumar, R.; Almas, T.; Ibrahim, A.A.; AlAssiri, M.S.; Abaker, M.; Baskoutas, S. Efficient H2 gas sensor based on 2D SnO2 disks: Experimental and theoretical studies. Int. J. Hydrogen Energy 2020, 45, 26388–26401. [Google Scholar] [CrossRef]
- Yin, X.-T.; Li, J.; Dastan, D.; Zhou, W.-D.; Garmestani, H.; Alamgir, F.M. Ultra-high selectivity of H2 over CO with a p-n nanojunction based gas sensors and its mechanism. Sens. Actuators B 2020, 319, 128330. [Google Scholar] [CrossRef]
- Majumdar, S.; Nag, P.; Devi, P.S. Enhanced performance of CNT/SnO2 thick film gas sensors towards hydrogen. Mater. Chem. Phys. 2014, 147, 79–85. [Google Scholar] [CrossRef]
- Zhang, H.; Li, Z.; Liu, L.; Xu, X.; Wang, Z.; Wang, W.; Zheng, W.; Dong, B.; Wang, C. Enhancement of hydrogen monitoring properties based on Pd–SnO2 composite nanofibers. Sens. Actuators B 2010, 147, 111–115. [Google Scholar] [CrossRef]
- Duan, P.; Duan, Q.; Peng, Q.; Jin, K.; Sun, J. Design of ultrasensitive gas sensor based on self-assembled Pd-SnO2/rGO porous ternary nanocomposites for ppb-level hydrogen. Sens. Actuators B 2022, 369, 132280. [Google Scholar] [CrossRef]
- Anand, K.; Singh, O.; Singh, M.P.; Kaur, J.; Singh, R.C. Hydrogen sensor based on graphene/ZnO nanocomposite. Sens. Actuators B 2014, 195, 409–415. [Google Scholar] [CrossRef]
- Ding, W.; Ansari, N.; Yang, Y.; Bachagha, K. Superiorly sensitive and selective H2 sensor based on p-n heterojunction of WO3–CoO nanohybrids and its sensing mechanism. Int. J. Hydrogen Energy 2021, 46, 28823–28837. [Google Scholar] [CrossRef]
- Suman, P.H.; Felix, A.A.; Tuller, H.L.; Varela, J.A.; Orlandi, M.O. Comparative gas sensor response of SnO2, SnO and Sn3O4 nanobelts to NO2 and potential interferents. Sens. Actuators B 2015, 208, 122–127. [Google Scholar] [CrossRef]
- Krishna, K.G.; Umadevi, G.; Parne, S.; Pothukanuri, N. Zinc oxide based gas sensors and their derivatives: A critical review. J. Mater. Chem. C 2023, 11, 3906–3925. [Google Scholar] [CrossRef]
- Shah, S.; Hussain, S.; Din, S.T.U.; Shahid, A.; Amu-Darko, J.N.O.; Wang, M.; Tianyan, Y.; Liu, G.; Qiao, G. A review on In2O3 nanostructures for gas sensing applications. J. Environ. Chem. Eng. 2024, 12, 11253. [Google Scholar] [CrossRef]
- Huang, M.; Wang, S.; Fu, H.; Shao, H.; Wang, Y.; Yu, K.; Huang, Y.; Jv, Z.; Wang, L. An efficient vapor-phase processing method derived mesoporous N-C@SnO2-Co3O4 hollow nanoboxes with abundant surface oxygen vacancy for highly improved gas sensing application. J. Alloys Compd. 2021, 863, 158341. [Google Scholar] [CrossRef]
- Kumar, V.; Gautam, D.; Gautam, Y.K.; Kumar, A.; Adalati, R.; Sanger, A.; Kang, S.B.; Jain, R.K. Experimental and theoretical studies of sputter deposited pure SnO2 thin films for high selective and humidity-tolerant H2 gas sensor. J. Mater. Sci. Mater. Electron. 2024, 35, 1957. [Google Scholar] [CrossRef]
- Zhang, Z.; Zhang, D.; Yue, C.; Liu, Z.; Mu, Y.; Yang, Z.; Dastan, D.; Zhang, X.; Yin, X.-T.; Ma, X. High sensitivity and surface mechanism of MOFs-derived metal oxide Co3O4-SnO2 hollow spheres to ethanol. J. Alloys Compd. 2023, 962, 171182. [Google Scholar] [CrossRef]
Disclaimer/Publisher’s Note: The statements, opinions and data contained in all publications are solely those of the individual author(s) and contributor(s) and not of MDPI and/or the editor(s). MDPI and/or the editor(s) disclaim responsibility for any injury to people or property resulting from any ideas, methods, instructions or products referred to in the content. |
© 2025 by the authors. Licensee MDPI, Basel, Switzerland. This article is an open access article distributed under the terms and conditions of the Creative Commons Attribution (CC BY) license (https://creativecommons.org/licenses/by/4.0/).

