Article

Design and Evaluation of Micromixers Fabricated with Alternative Technologies and Materials for Microanalytical Applications In Situ

by
Rosa M. Camarillo-Escobedo
1,2,*,
Jorge L. Flores
2,
Juana M. Camarillo-Escobedo
3,
Elizabeth Hernandez-Campos
4 and
Luis H. Garcia-Muñoz
5
1
Mechanic & Mechatronics Department, National Technological Institute of Mexico-La Laguna, Torreon 27000, Coahuila, Mexico
2
Department of Electro-Photonic Engineering, University of Guadalajara, Guadalajara 44430, Jalisco, Mexico
3
Electric and Electronic Engineering Department, National Technological Institute of Mexico-La Laguna, Torreon 27000, Coahuila, Mexico
4
Chemistry and Biochemistry Department, National Technological Institute of Mexico-La Laguna, Torreon 27000, Coahuila, Mexico
5
Computer Systems Engineering Department, National Technological Institute of Mexico-La Laguna, Torreon 27000, Coahuila, Mexico
*
Author to whom correspondence should be addressed.
Chemosensors 2025, 13(5), 191; https://doi.org/10.3390/chemosensors13050191
Submission received: 25 April 2025 / Revised: 15 May 2025 / Accepted: 16 May 2025 / Published: 21 May 2025
(This article belongs to the Section Analytical Methods, Instrumentation and Miniaturization)

Abstract

:
Micromixing is a crucial process in microfluidic systems. In biochemical and chemical analysis, the sample is usually tested with reagents. These solutions must be well mixed for the reaction to be possible, generally using micromixers manufactured with sophisticated and expensive technology. The present work shows the design and evaluation of micromixers fabricated with LTCC (low-temperature co-fired ceramics) and FDM (fused deposition modeling) technologies for the development of functional and complex geometries. Two-dimensional planar serpentine and 3D chaotic convection serpentine micromixers were manufactured and implemented in an automated microanalytical system using photometric methods. To evaluate the performance of the micromixers, flow, mixing and absorbance measurements were carried out. Green tape and PP materials were used and showed good resistance to the acidic chemical solutions. The devices presented achieved mixing times in seconds, a reduced dispersion due to their aspect ratio, high sensitivity, and precision in photometric measurement. The optical sensing cells stored sample volumes in a range of 10 to 600 µL, which allowed the reduction of reagent consumption and waste generation. These are ideal characteristics for in situ measurement, portable, and low-cost applications focused on green chemistry and biochemistry.

Graphical Abstract

1. Introduction

Currently, the growing interest in obtaining reliable, immediate, and environmentally friendly information for in situ analysis requires the development of portable microanalytical systems. These microanalyzers must integrate all the functions of the analytical process. Automation allows these functions to be performed in less time and with great efficiency, while the reduction of the architecture required for microanalysis allows for reduced reagent consumption and minimal waste. Therefore, microfluidics design plays a very important role in the miniaturization and portability. Microfluidics is the term used to describe flow in devices with dimensions ranging from millimeters to micrometers that are capable of handling volumes of fluid in the range of nano-microliters [1]. By reducing the diameter of the structure 10 times, the volume is reduced by 100 times [2] and less waste is produced. Intensive research over the past two decades into the development of microfluidic-based mixers has been driven by the possibility of exploiting a number of advantages that arise from the unique fluid behavior in a microfluidic environment. At microscale, fluid properties become increasingly stable and provide the possibility of exerting control over the different processes carried out in a microfluidic system [3]. On the other hand, microfluidic devices typically have features that give micromixers superior heat transfer and control [4], allowing reactions to be performed in an isothermal manner [5,6]. Because of their heat and mass transfer efficiencies, micromixers can be conveniently applied to develop reactions in which fast heating and cooling of the reaction mixture are required, such as highly exothermal reactions [7,8]. The mixing process is an important factor in achieving high sensitivity in analysis. At macroscale, mixing generally uses turbulence and a stirrer to achieve optimal mixing, while in micromixers, mixing is generated in a laminar flow regime. The operating conditions of micromixers can be represented by two dimensionless numbers, Reynold (Re) and Peclet (Pe), which relate to the movement of a fluid and its mass transport. There are studies and analysis of the performance of microfluidic devices in the literature; e.g., Nguyen and Wu [9] presented an extensive review that discusses the operation of the passive micromixers based on Reynold (Re), Peclet (Pe), and in dynamic cases the Strouhal number (St). The manufactured technologies were also analyzed. Barbosa et al. showed the finite element analysis at different Re values of the behavior of a fluid in a step in a laminar flow, where recirculation areas are shown in the lower and horizontal walls [10]. Hossain et al. [11] presented an analysis of mixing in microchannels at different Re values in different geometries: zig-zag; square-wave; and curved. The mixtures in the channels were analyzed using water and ethanol. In an extensive review, Ganguli et al. [12] analyzed passive micromixers with different types of complexity in shape, size, configuration, microchannel width, obstructions, flow, and operating conditions. The studies were based on terms of pressure drop and mixing indices (MI). In the same way, Wang et al. [13] showed the design of an elliptical serpentine as an option to the pressure drop presented by traditional serpentines such as zig-zag, square-wave and circular. Ran et al. [14] developed an acoustic micromixer that integrates serpentine sharp teeth and which generates a Re value up to 323. Yin et al. [15] presented a portable micro automated system using a seashell-like microfluidic chip that utilizes a dual colorimetric/fluorescence detection method. The system measured 217 mm (L) × 112 mm (w) × 100 mm (h).
Usually, most micromixers are mainly manufactured by photolithography, molding, etching, etc., and using materials such glass, silicon, and polymers (like PDMS), resulting in a slow, complicated, and expensive manufacturing process. One alternative to manufacture microfluidic devices is the LTCC [16,17]. The important features of LTCC technology are the manufacture of 3D structures using multiple layers, its chemical inactivity, chemical resistance, biocompatibility, hermeticity, and matching of coefficient of thermal expansion with silicon [18]. The LTCC microfluidic devices have been widely presented [17,19,20,21,22]. Similarly, there is a trend to use FDM manufacture technology (e.g., 3D printing) to develop fluidic microstructures, despite the complexity of manufacturing the microchannels, mainly due to the size of the filaments extruded, which are larger than typical channels used in microfluidics [23,24]. In a recent report, a fluidic channel device with a 3 mm diameter tube and 5 mm walls was fabricated with FDM using ABS polymer [25]. Leroy Cronin et al. [26] showed the flow of dye solutions through FDM-printed 800 μm wide channels made of PP, and also built reactionware to hold fluids by extruding acetoxysilicone polymer [27]. Rusling et al. [28] built microfluidic devices with 800 μm square channels (printed by extruding PET and PLA filaments) for amperometric detection of hydrogen peroxide and immuno-array-based detection of cancer protein biomarkers [29].
However, as described above, the application of micromixers in situ and an automated analytical process has not been fully explored. To this end, we developed a novel methodology for the fabrication of portable automated microanalyzers consisting of three stages: (1) miniaturization of the analytical method; (2) automation and control of the analytical method functions, both developed in previous studies; and (3) a methodology for designing and evaluation of micromixers.
In the present work, a methodology for designing and evaluation of micromixers for applications in microanalysis in situ is presented. The micromixer designs were evaluated using an automated microanalytic process based on our patent. Physical variables of the fluids were calculated for the optimal mixing procedure to be developed in the automated program. In addition, the miniaturized photometric analytical methods for determining the concentration of Co, F, and colored solutions were implemented in the micromixers as application examples. The results obtained were very close to those obtained with commercial equipment.

2. Materials and Methods

2.1. Materials and Equipment

Microfluidic devices were fabricated using ceramic DuPont Green tapes 951AX2 (DuPont Microcircuit Materials, Durham, NC, USA) for LTCC technology. The manufacturing process is described in [16,30]. Other microfluidic structures were manufactured by FDM technology using a 3D printing model Prusa i3 MK2S machine (Prusa Research s.r., Prague, Czech Republic) for printing a PLA structure with orange filament of 1.75 mm (Inky, Mex) and density of 1250 kg/m3, and a PP structure was printed with white filament manufactured by TecSol3D, Monterrey, Mexico. The latter is resistant to chemical solvents, bases, and acids. All micromixers were designed by Solidworks®. Chemical reagents of the analytical grade (Sigma Aldrich Química, Toluca, Mexico) were used. In each development and evaluation of microfluidic devices, the reagents to be used will be described. For hydraulic connections, silicone tubes with an internal diameter di = 1.2 mm (NResearch, West Caldwell, NJ, USA) and PTFE barb-type microactuator connectors with a di = 1.0 mm were used. The optical detection cells were internally integrated into the microstructures and covered with two optical windows of 0.1 mm thick borosilicate glass. The connectors for fluid inlet and outlet were made of titanium with a di = 1.0 mm and do = 1.5 mm (MAFSA, Torreón, Mexico) using epoxy glue for assembly. The microfluidic devices were validated using laboratory equipment: a Cole-Palmer 84000-00 magnetic stirrer (Cole Palmer, Vernon Hills, IL, USA) was used to compare the mixtures. A Perkin Elmer Junior III Spectrophotometer 6/8 (Perkin Elmer, Waltham, MA, USA) and a Jenway 6305III spectrophotometer (Coleparmer, St. Noets, UK), were used to contrast the absorbance measurements.

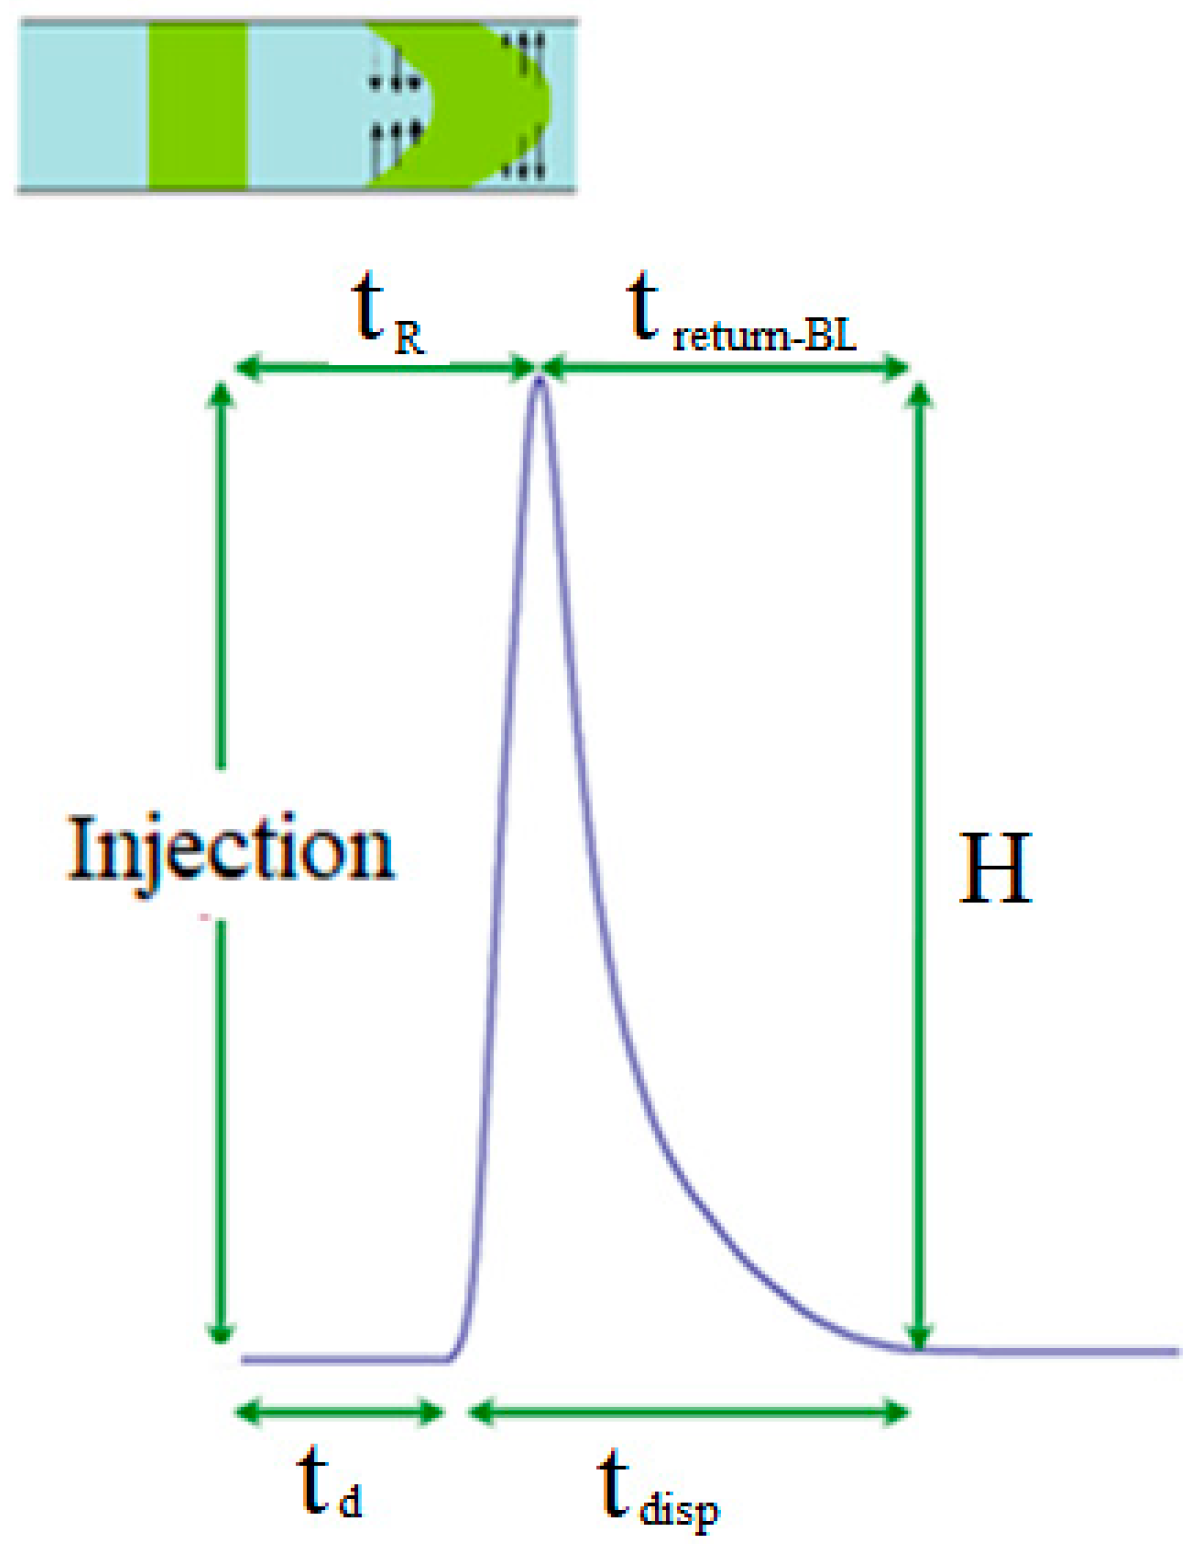
2.2. Analytical Methods

For the measurement of cobalt concentration, the Mexican patent number 359937 IMPI [31] was used based on the reaction between nitroso-R-salt (N-R-S), sulfuric acid (H2SO4), and cobalt (Co). For the measurement of fluorides concentration, the SPANDS method was miniaturized and used according to the Mexican standard NMX-AA-077-SCFI-2001 [32], in which a reaction is generated between fluoride ions and the colorful complex of Zirconil-SPADNS, where the concentration is inversely proportional to absorbance. The absorbance measurement was determined by [33],
A = S a S d S r S d
where Sa is the analytical signal, Sr is the reference signal, and Sd is due to the dark current of the photodiode.

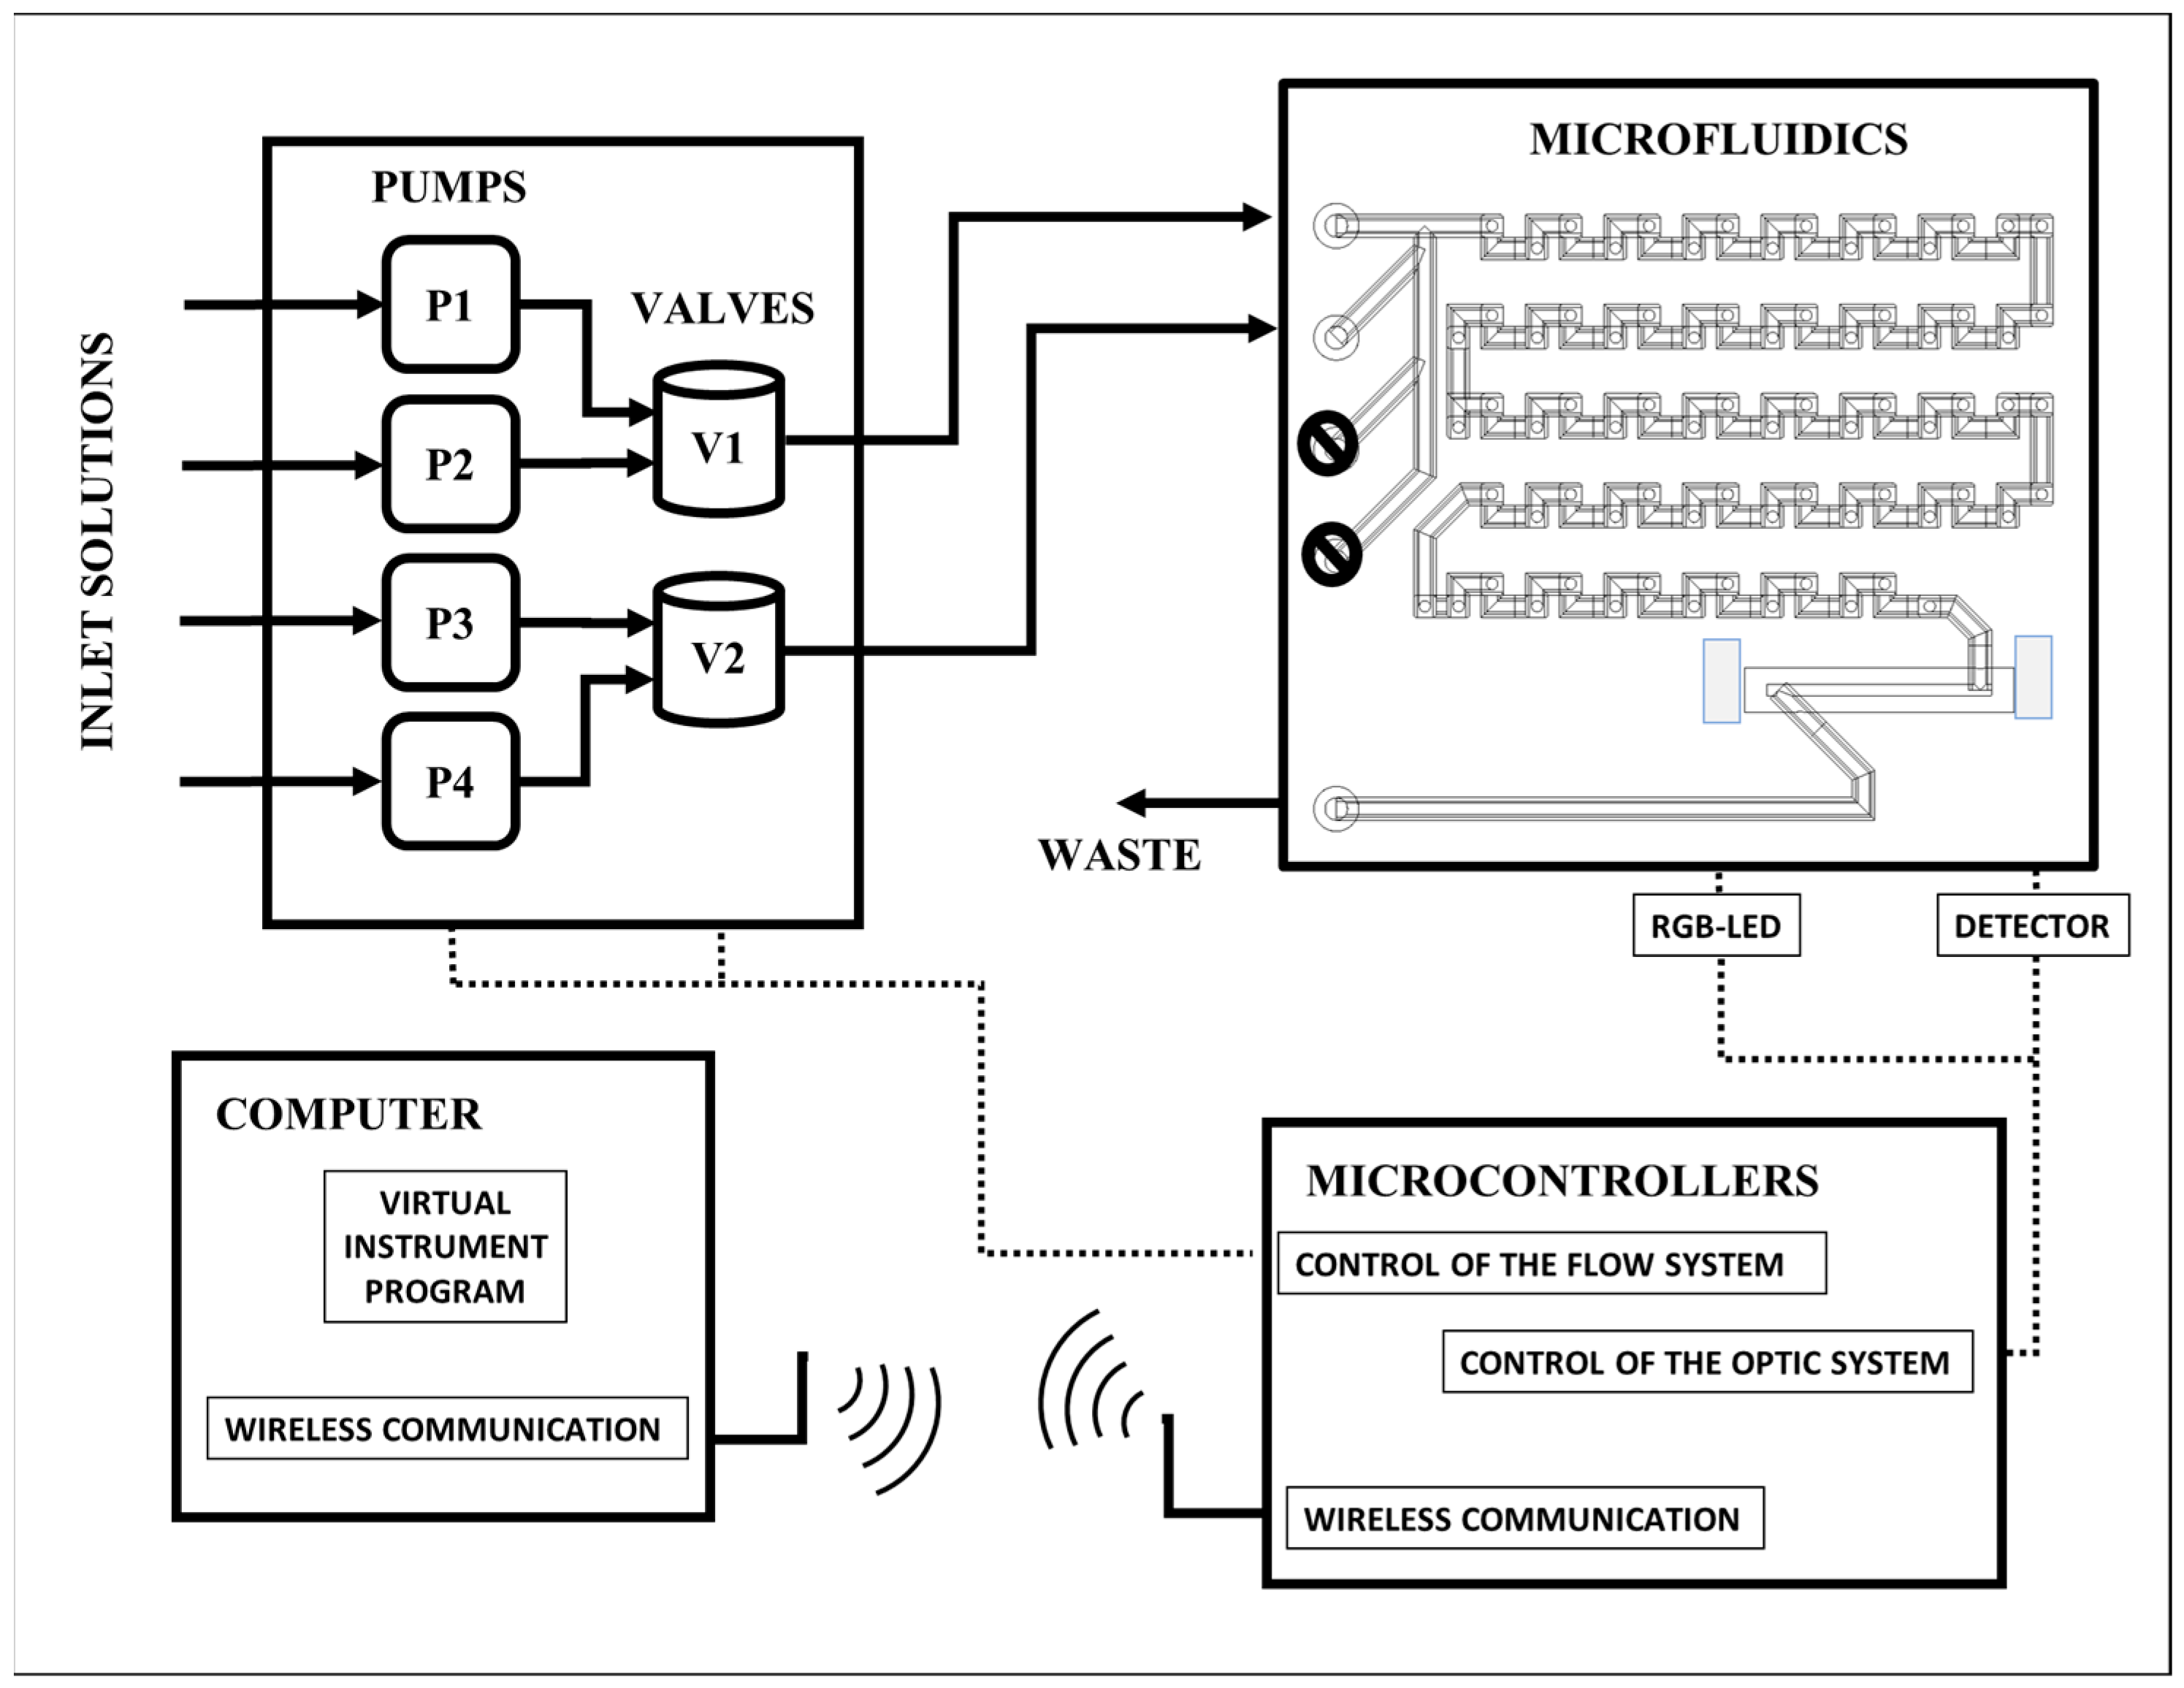
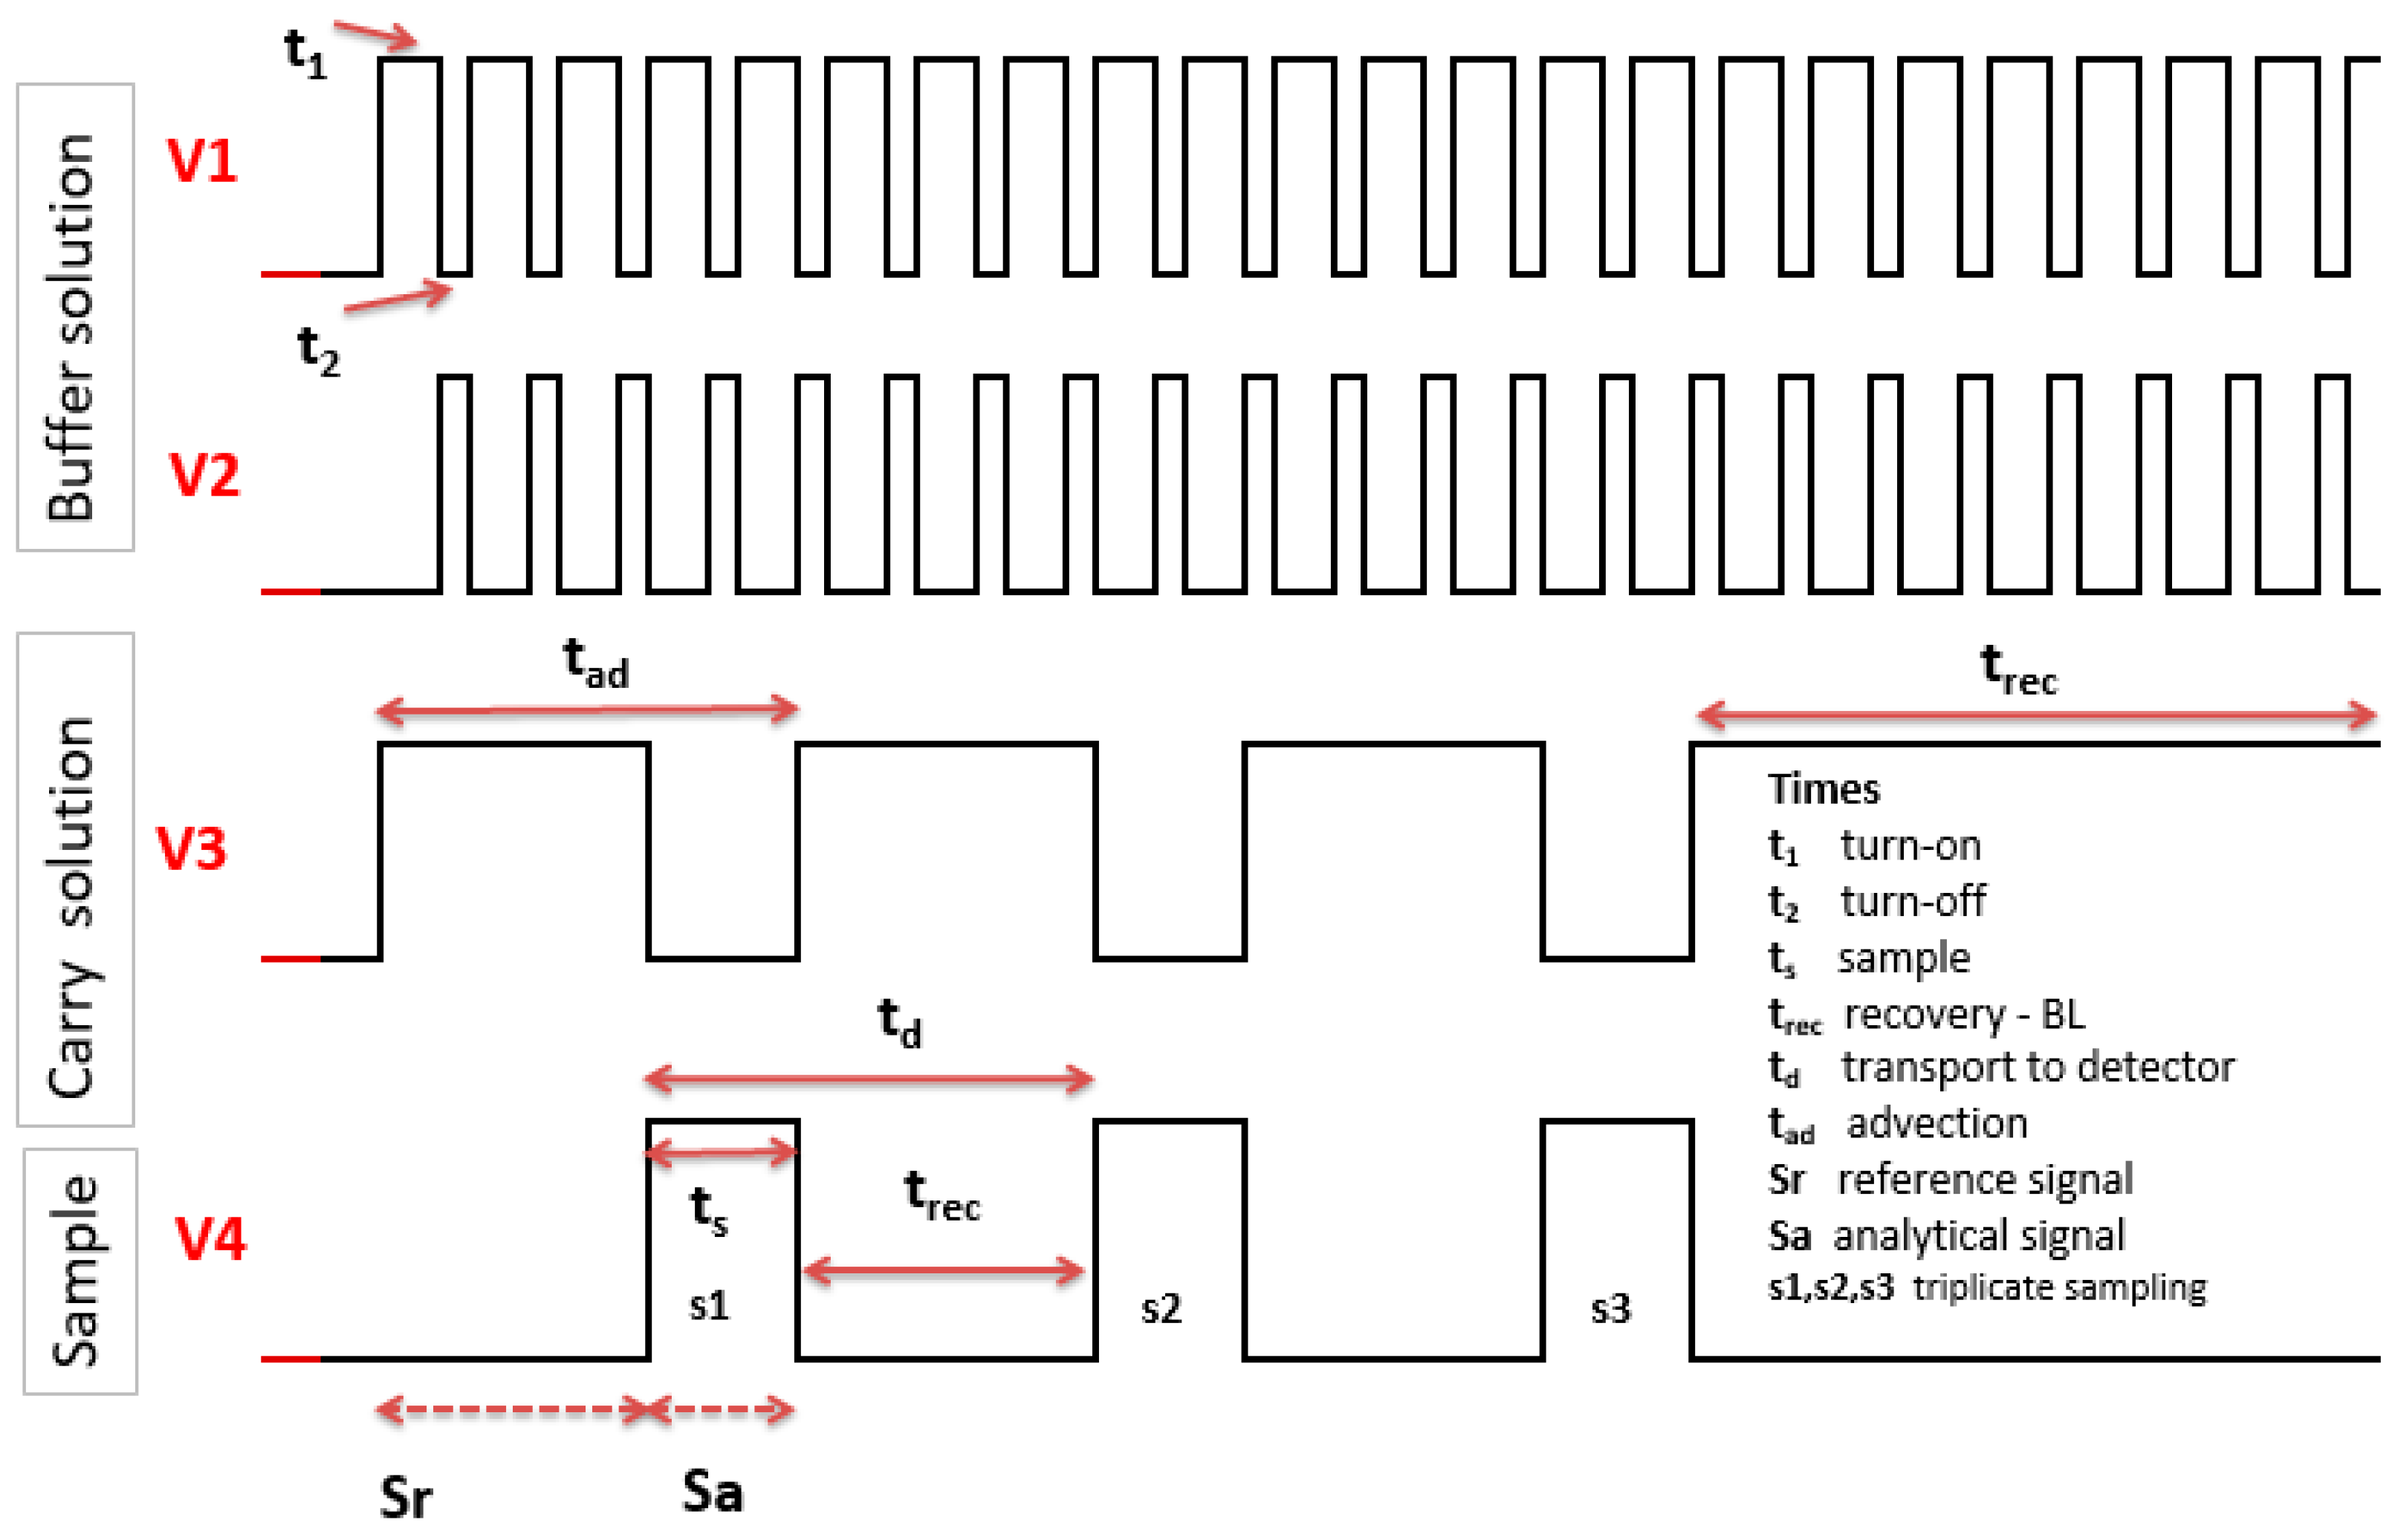
2.3. Automated Microanalytical Process

Figure 1 shows the scheme of the proposed device for microanalytical applications. For the fluid management, a compact flow device based on patent number 359937 IMPI [31] was implemented, in which all the steps of the microanalytical process were included. The hydrodynamic variables in each developed experiment, flow rate (Q), volume (V), mixing time, and wavelength (λ) for optical detection were programmed on a virtual instrumentation program. For details of this operating principle, the reader is referred to [34].

2.4. Statistical Method

The results obtained by the proposed devices were analyzed and compared with commercial equipment as reference. In particular, we estimated the root mean square error, RMSE, as figure of merit to compare the performance of the proposed device with measurements made with laboratory equipment.
Linear regression was used to model instrument performance, with triplicate or quadruplicate measurements taken for each increment of concentration on the variable under test. RSD (relative standard deviation) and variance (n = 4, 95% confidence) statistical techniques were used to validate measurement accuracy.

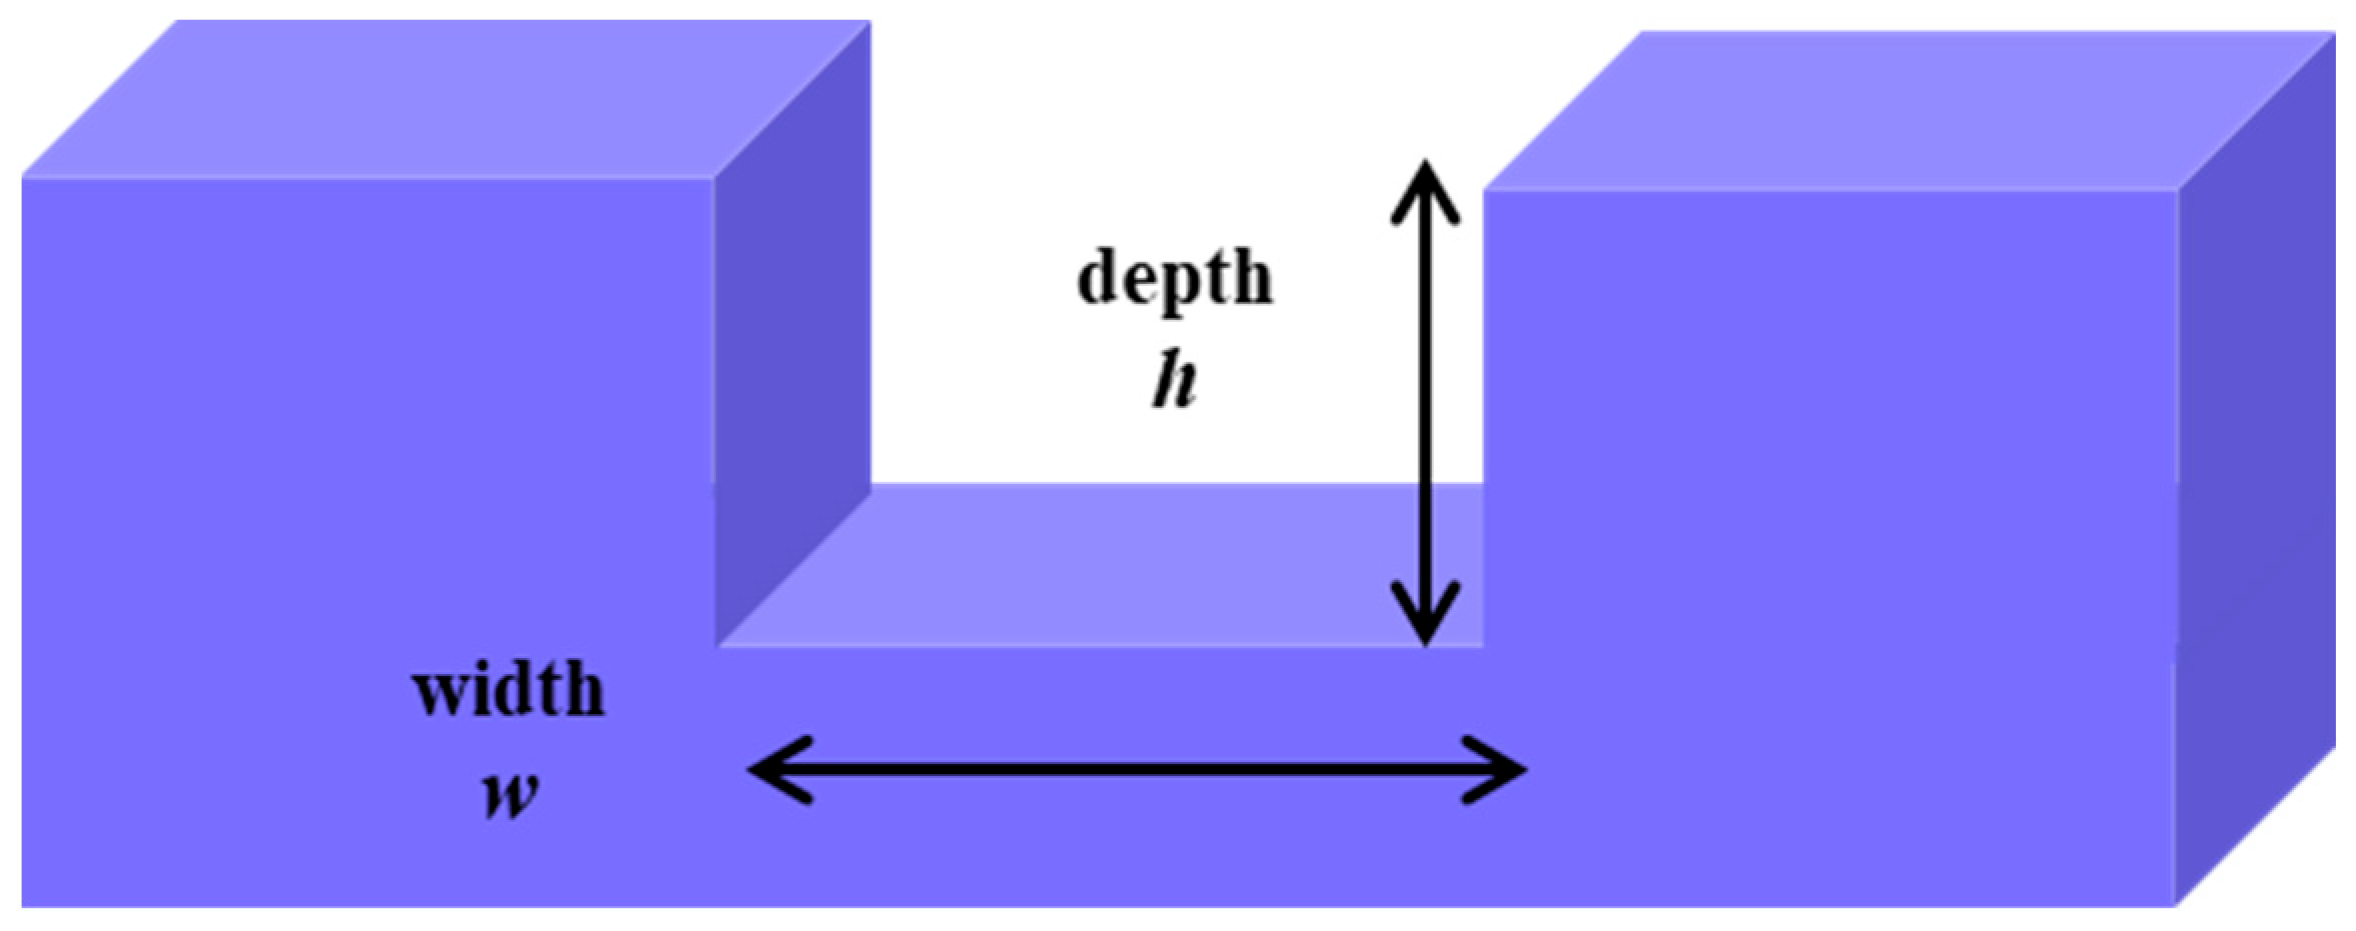
3. Micromixer Design

In microfluidics, the mixing occurs at very small Re and is mainly based on molecular diffusion, DM [35] and laminar behavior in microchannels, reactors, heaters, etc. In the internal geometries of microfluidic structures, the flow rate can be increased or decreased by channel geometry. A microchannel usually has an aspect ratio between depth (h) and width (w) of 1:10 (w >> h) considering a maximum hmax = 0.5 mm and minimum wmin = 0.05 mm for silicon, glass, and PDMS structures using the soft lithography process [35]. After extensive analysis and experimentation, an aspect ratio of w > h with hmin = 0.215 mm and wmax = 1.3 mm was defined [36], see Figure 2.
Once the aspect ratio is defined, the physical parameters of the fluid behavior are calculated, with the objective of electronically relating them to the automation of the analytical process. According to Poiseuille’s law (of laminar flow), the following analogy is made:
Voltage → Pressure; Current → Flow rate; Resistance → Geometry/Channel length
Therefore, the flow rate (Q) maintains a constant pressure drop (Δp) in the geometry/channel length (Rfluid) according to
p = Q R f l u i d
where R f l u i d = 8 μ L π r 4 for circular geometry and R f l u i d = 12 μ L w h 4 for rectangular geometry.
In microfluidic systems, mixing is mainly based on diffusion. To achieve diffusion, according to Fick’s law, the useful mixing length is related to the diffusion length, LD, and is calculated by
L D = 2 D M t
where DM is the molecular coefficient and t is the mixing time. As can be seen, the mixing time is small. Therefore, for a microchannel width (w) and DM in the order of 10−9 m2 s−1, the typical diffusion time (tdif) is calculated as
t d i f w 2 D M
These parameters are used to define the operating times of microactuators and sensors. When the signal is swept in the detection zone, a Gaussian signal is generated with a maximum peak at t = tdif with a width of w t d . This process is defined as Tylor dispersion and is another phenomenon to consider in the development of mixing in microfluidic structures, which was described by Squires and Quake [37]. Dispersion (D) occurs when a species in a fluid (dye, analyte molecules, proteins, cells or heat) is being transported into another fluid where it diffuses. The dispersion is defined by the mathematical relationship of the concentration of the injected sample (Co) and the concentration obtained in the detector (C); D = Co/C.
As noted above, a typical signal obtained by the detector is shown in Figure 3, where the maximum concentration signal can be estimated from D = Co/Cmax, where Cmax (H) is obtained in time t = tdif. In spectrophotometric methods, H represents the absorbance, and a high altitude is the optimal sensitivity represented on the detector.
In Figure 3, tR represents the residence time to mix inside the microchannels until the maximum peak is developed (this can be seen in the upper diagram of the graph), t is the time that elapses from the injection of the sample until reaching the detector, td is the detection time (dispersion and tBL refers to the return time to the base line (BL) signal or reference (blank). In the flow injection analysis, FIA, dispersion is controlled by the volume of injected sample (V), the flow rate (Q), the length (L), and diameter (d) or width (w) of channels [38]. In microfluidic structures, the dispersion effect can decrease, reducing the size of channels, so by setting these parameters in the design (w, L), the dispersion control will depend externally on Q and V. In passive micromixers, there are two strategies to achieve mixing: increasing the diffusion velocity by contraction of w or by a geometry with chaotic advection or convection in the channels [39,40,41]. In serpentine geometries, diffusion is dominated by advection, and the advection time tad is calculated by the flow velocity (vs) and the channel length (L), i.e.,
t a d = L v s
Some of these geometries have been described by N. T. Nguyen and S. Wereley [42] and Hossain et al. [11], and have the ability to operate from a pressure gradient. Some of these geometries are planar micromixers integrating obstacles on the channel walls, in zig-zag, micromixers with Tesla structures, type C, L, and twisted microchannels. This type of micromixer can be implemented under LTCC and FDM technologies as a monolithic structure and could be modularly connected to other stages of the microanalyzers, e.g., the detection system and the hydrodynamic system.
The operating conditions of the micromixers are determined by the dimensionless numbers Re and Pe, which represent the ratio between momentum and viscous friction defined by
R e = ρ v s h μ
R e = v s h v
respectively, where h is the hydraulic height, ρ is the density, v′ is the kinetic viscosity, and µ is the dynamic viscosity.
The dimensionless number Pe represents the ratio between the mass transport due to convection and that of diffusion defined by
P e = v s h D M
The relationship between the Re and Pe can be estimated as P ≈ 1000Re for liquid. For the development of a fast and optimal mixture, it is necessary that (Pe >> 1) [43].
Once the analysis and calculation of the physical variables have been carried out according to the design requirements, the dimensions of the microchannels and the type of micromixer are defined, depending on the miniaturized analytical method and the manufacturing technology used (micromilling tool or extruder/filament). To evaluate and optimize the micromixer, the parameters are configured in the automation program for the microanalytical process.

4. Results

For the injection process, the volumes were programmed as a function of time and the flow rates were generated by frequency, as shown in Figure 4. According to this study, the complete injection sequence was programed in virtual interface, shown in Figure 5. In this example, sampling was programmed in triplicate (i.e., 3 samples were analyzed in three cycles = 3), trec is recovery time between each sample, t1 (turn on) and t2 (turn off) are the mixing time that must be considered in the microvalve multicommutation (tdif), td is the time it takes from the injection of the sample until it reaches the detection section, tm is the time at which the sample volume is injected, and te is the dispersion time (Figure 3: tBL= td − tdif). The time from when the solutions are injected to when they reach the detector is called the advection time (tad).

4.1. LTCC Micromixers

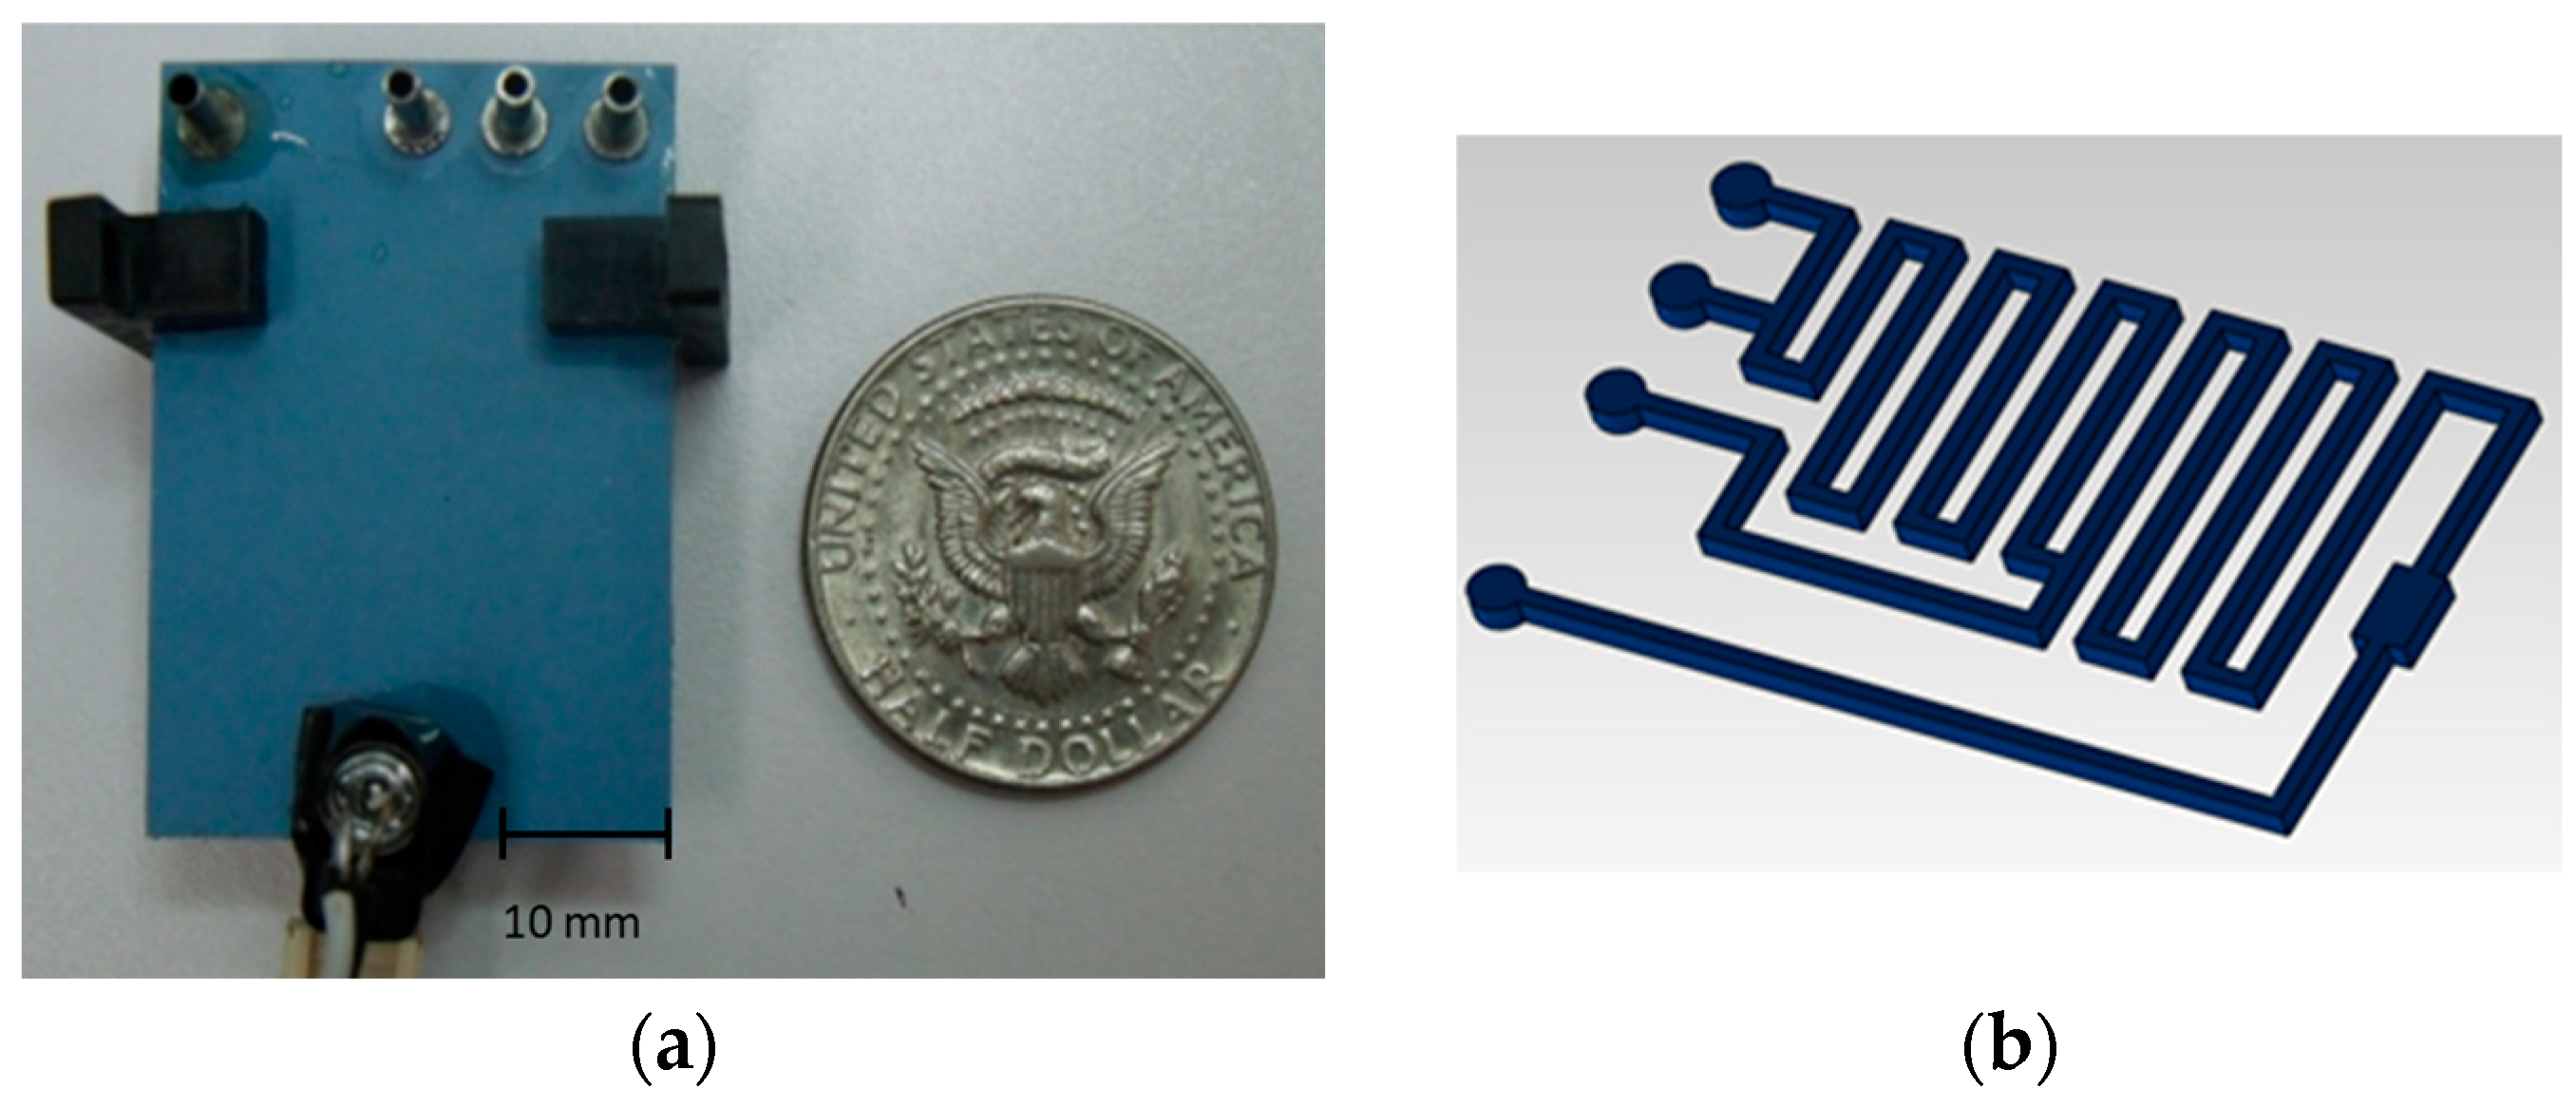
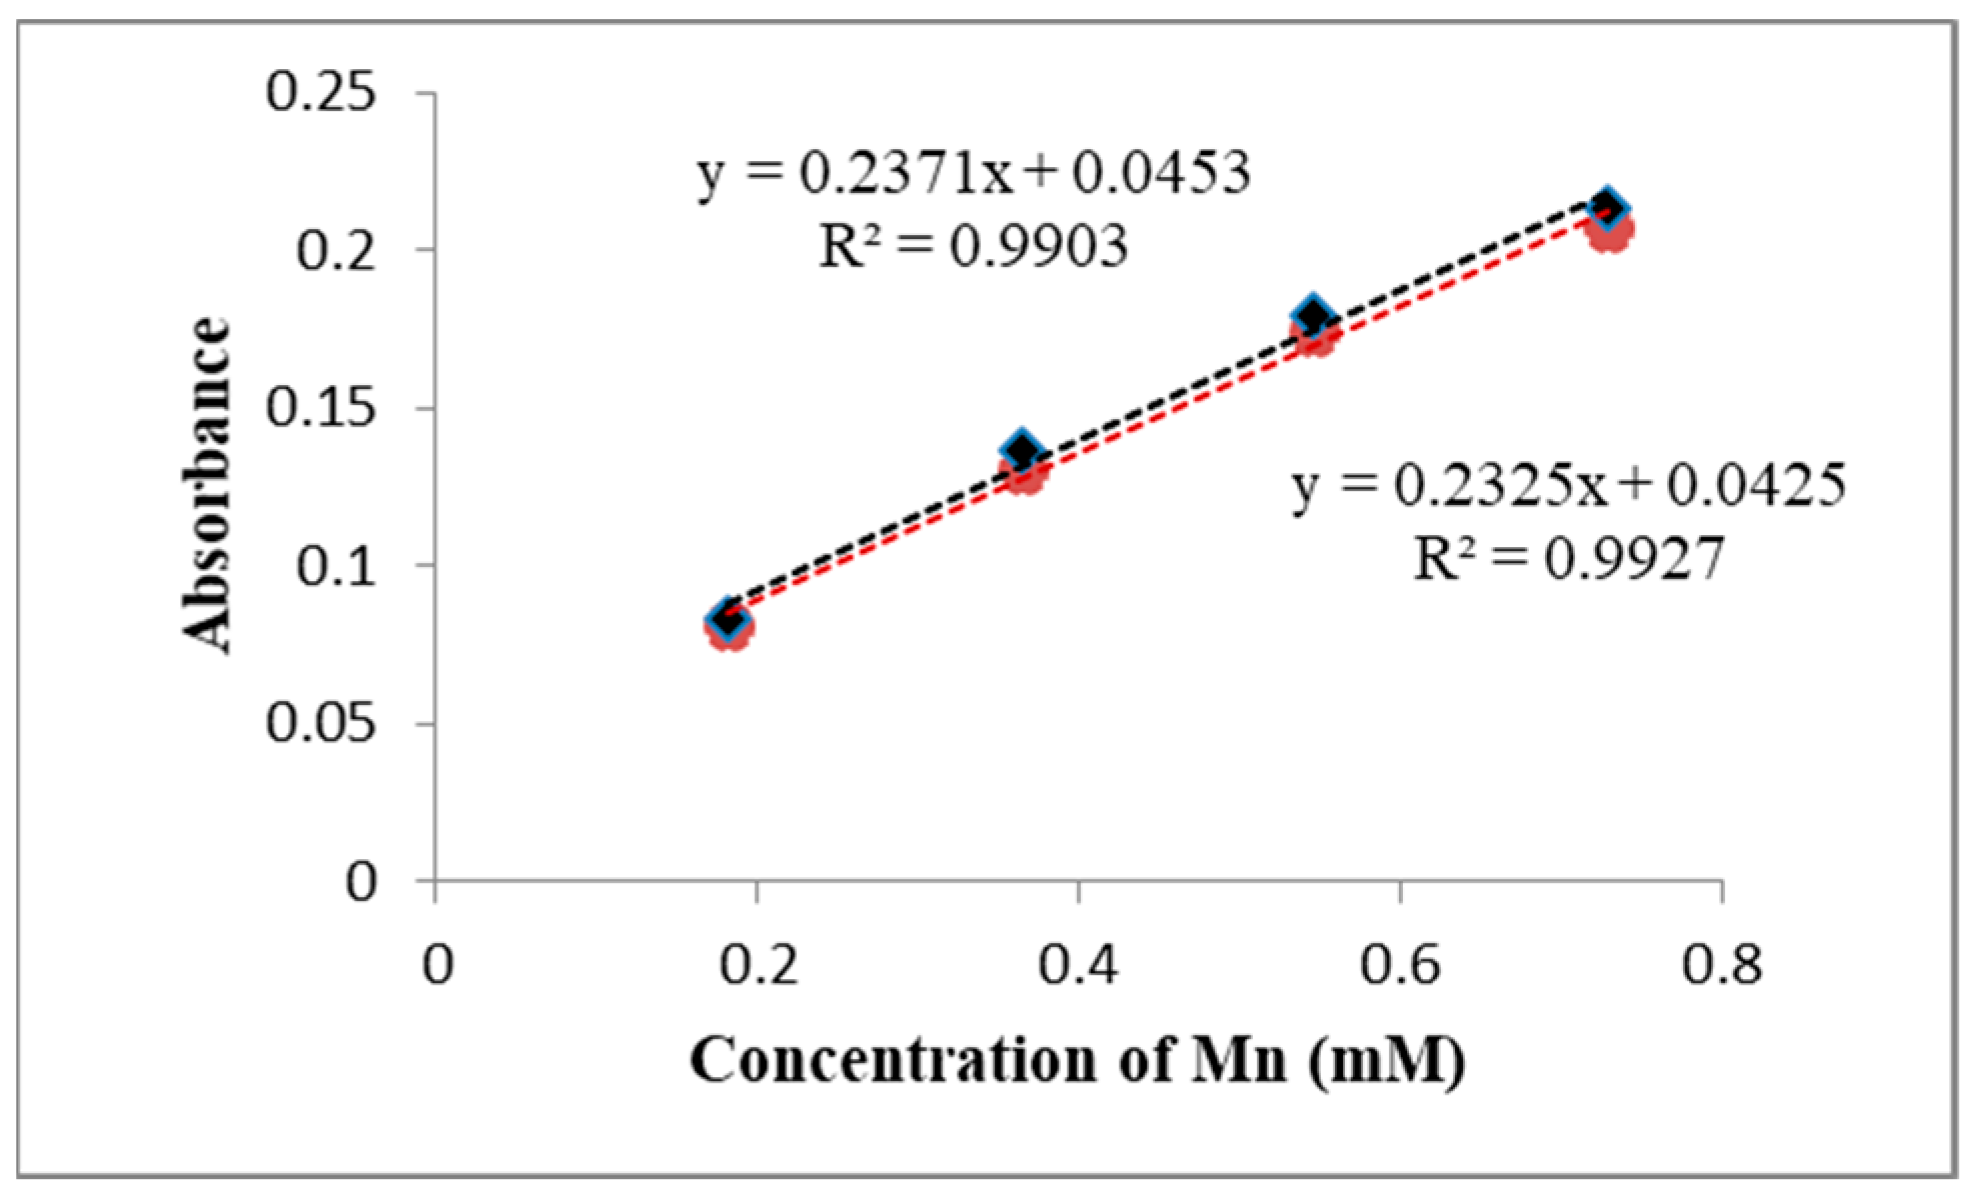
4.1.1. 2D LTCC Planar Serpentine Micromixer

In this micromixer, to accelerate mixing, serpentine channels were incorporated instead of long straight channels in order to develop chaotic advection and increase Re in a compact device. The microfluidic structure integrates three inlet streams that pass through the fixed geometry of the micromixer at constant velocities. For potassium permanganate (KMnO4) at 20 ppm of Mn, DM = 9 × 10⁻⁹ cm2s−1 [44], molecular diffusion is very low at short distances or very long times. In this type of microfluidic structure, diffusion is dominated by the advection achieved by the serpentine. For Q = 1.5 mL min−1, vs = 33.69 mm s−1 and considering L = 270 mm, tad = 8 s. According to Equations (4) and (5), Pe >> 1 and Re = 101.07, achieving optimal mixing in a short time, tdif = 84 ms.
The LTCC microfluidic structure design corresponds to a 2D planar serpentine micromixer with 90° angles to increase the contact area and induce chaotic advection, as shown in Figure 5a. The micromixer integrates an optical detection cell (V = 10 µL) composed of eight layers with dimensions of 3.5 mm × 1.7 mm × 1.72 mm and wavelength of λ = 525 nm. The channel dimensions were defined as w = 0.873 mm (±0.02) mm and h = 0.85 mm (±0.013). Eleven loops were integrated with a total length of L ≈ 270 mm, see Figure 5b.
Dilutions were developed based on a standard KMnO4 solution to evaluate the mixture. Figure 6 shows the calibration curve corresponding to the KMnO4 dilutions obtained by the two types of mixers. The equations in Figure 6 correspond to a linear fit to the experimental data (absorbance as a function of concentration) of the developed mixture by means of magnetic stirrer (Cole-Palmer 84000-00) where R2 = 0.9903 and by the LTCC micromixer is R2 = 0.9927. The results were very similar for both procedures, which proves an optimal mixture development by means of this micromixer.

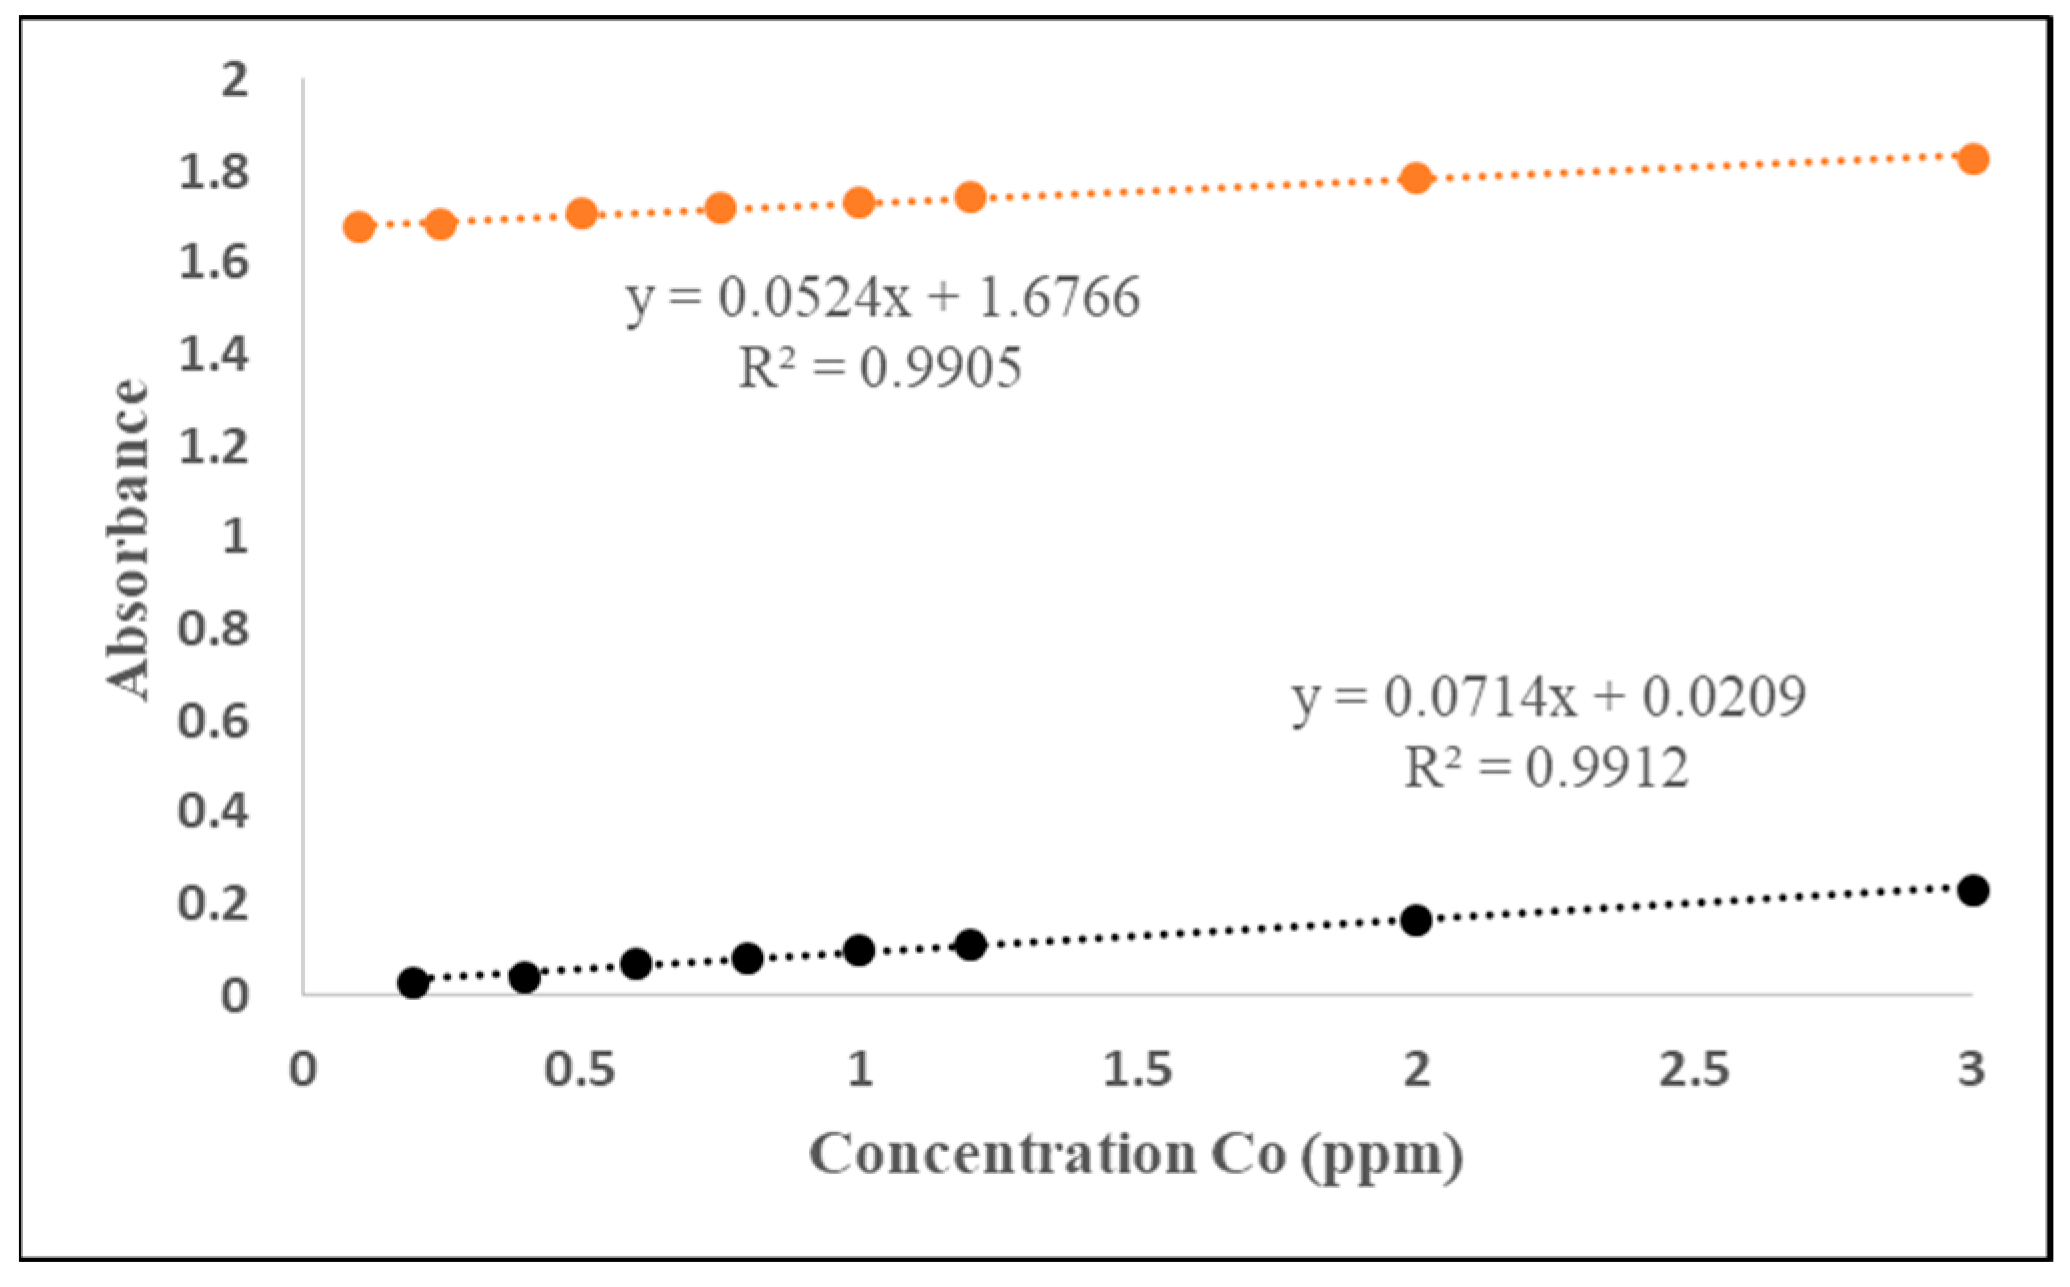
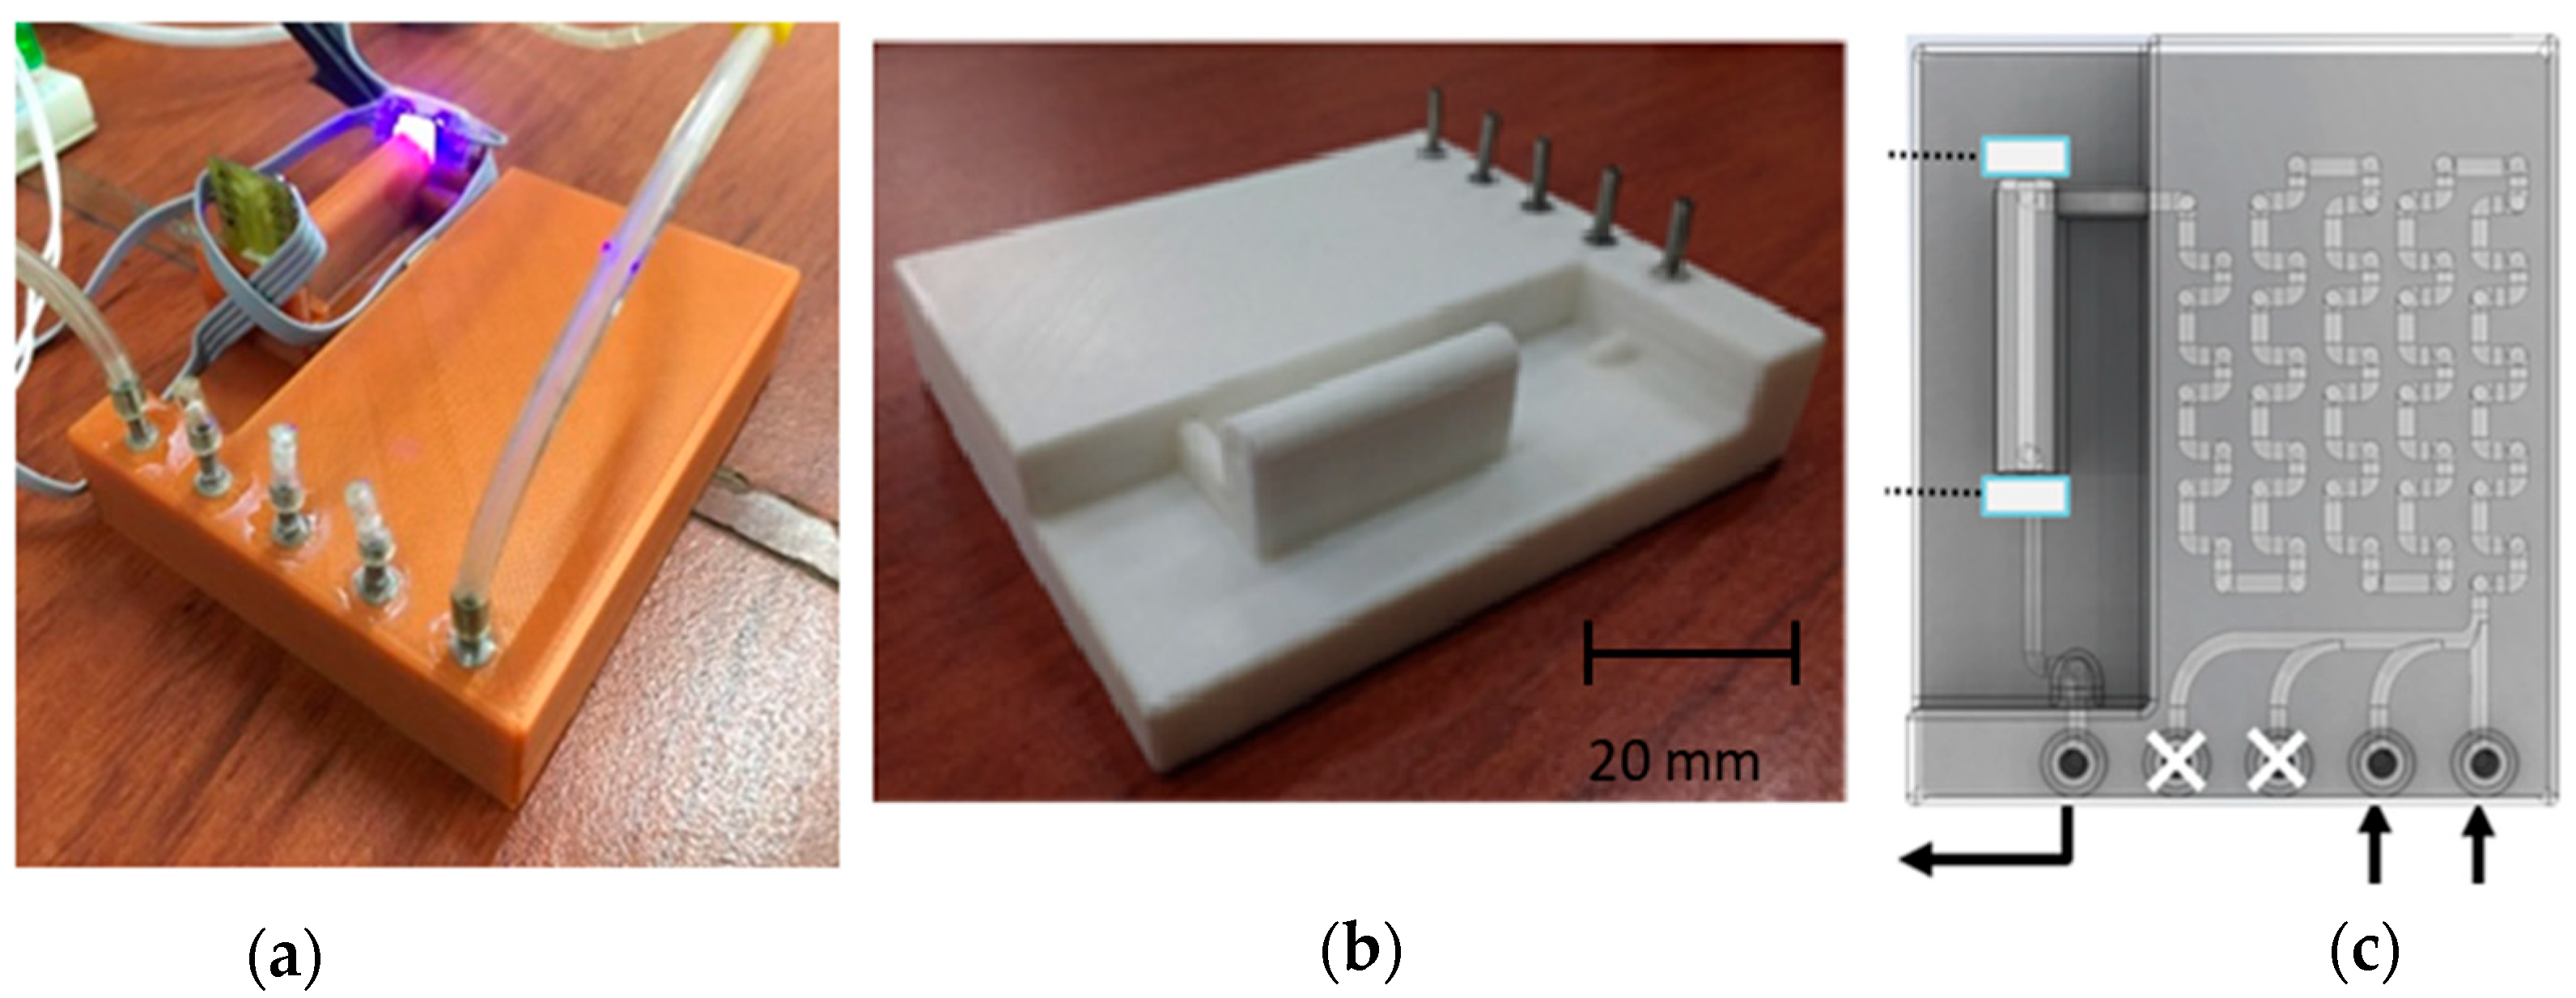
4.1.2. 3D LTCC L-Shaped Serpentine Micromixer

In this micromixer, to increase the velocity of concentration distribution of various solutions for a chemical reaction, the development of an advective and diffusive flow is necessary. The hydrodynamic values for this micromixer were defined as Q = 1.5 mL min−1; therefore, vs = 66.44 mm s−1 and considering L ≈ 600 mm, tad = 9 s. For DM = 1.73 × 10⁻⁵ cm2s−1, tdif = 88 ms. Data were obtained from [45]; therefore, Re = 1787 and Pe = 23042, ensuring fast and optimal mixing. Likewise, the hydrodynamic values were programed [34]. The microfluidic structure corresponds to a 3D L-shaped serpentine micromixer with chaotic advection, as shown in Figure 7. The channel dimensions were defined as w = 0.873mm (±0.02) mm and h = 0.431 mm (±0.013). Thirty L-shaped loops were integrated to achieve the base line (BL) and eight L-shaped loops were integrated to achieve the mixing sample with reagent. The total length of the serpentine was L ≈ 600 mm. The microstructure integrates an optical detection cell with an optical path of 25 mm, storing a sample volume of V ≈ 20 µL, composed of four layers with dimensions of 0.873 mm × 25 mm × 0.85 mm and wavelength of λ = 525 nm. The micromixer was evaluated for cobalt concentration according to Mexican patent number 359937 IMPI [31]. For the development of BL, sulfuric acid (H2SO4) at 0.25 M, nitroso-R-salt (N-R-S) at 0.1%, sodium acetate (C2H3NaO2) at 2 M, and sodium citrate at 0.5 M were used and for sampling. Cobalt 10 mg L−1 was used as a stock solution. The sampling process was based on two methods. The first method consisted of mixing solutions and reagents, and absorbance measurements were performed using a Cole-Palmer 84000-00 magnetic stirrer and a Perkin Elmer Junior III Spectrophotometer 6/8 with wavelength of λ = 540 nm. In the second method, the micromixer was used to mix solutions and reagents, and the absorbance was measured using an automated microanalysis method [31].
Figure 8 shows the calibration curves and the experimental data: the black points represent the absorbance measured by a commercial spectrometer (operating at λ = 540 nm) for the sample resulting from chemical agents with given Co concentrations, homogenized by the magnetic stirrer, and the black cut line corresponds to the linear approach. The orange points represent the absorbance measured by the microanalyzer (operating at λ = 525 nm) for different Co concentrations. In this case, the mixture was homogenized by the 3D serpentine micromixer of the microanalyzer. We observe that the linear approximations showed slightly different slopes, due to the wavelength used to estimate the absorbance. Statistically, both mixing and measuring methods showed similar trends: from the linear fit, we have R2 = 0.9912, and s R2 = 0.9905 for the spectrometer and microanalyzer, respectively.

4.2. FDM Micromixers

To evaluate the design of this 3D micromixer, structures were fabricated with PLA and PP filaments. A circular channel offers less resistance to fluid flow than a rectangular channel, but the vs depends on the channel diameter. For a flow rate Q = 3.9 mL min−1, vs = 25.6 mm s−1 and considering a length L ≈ 600 mm, tad = 23.44 s in a straight channel. The micromixer was based on a 3D circular serpentine, d < 2 mm (±0.02 mm), integrating 35 loops (to chaotic advection) with a total length of 518 mm. The micromixer integrates an optical detection cell with an optical path of 30 mm, storing V = 94.25 μL. The PLA micromixer and PP micromixer are shown in Figure 9.

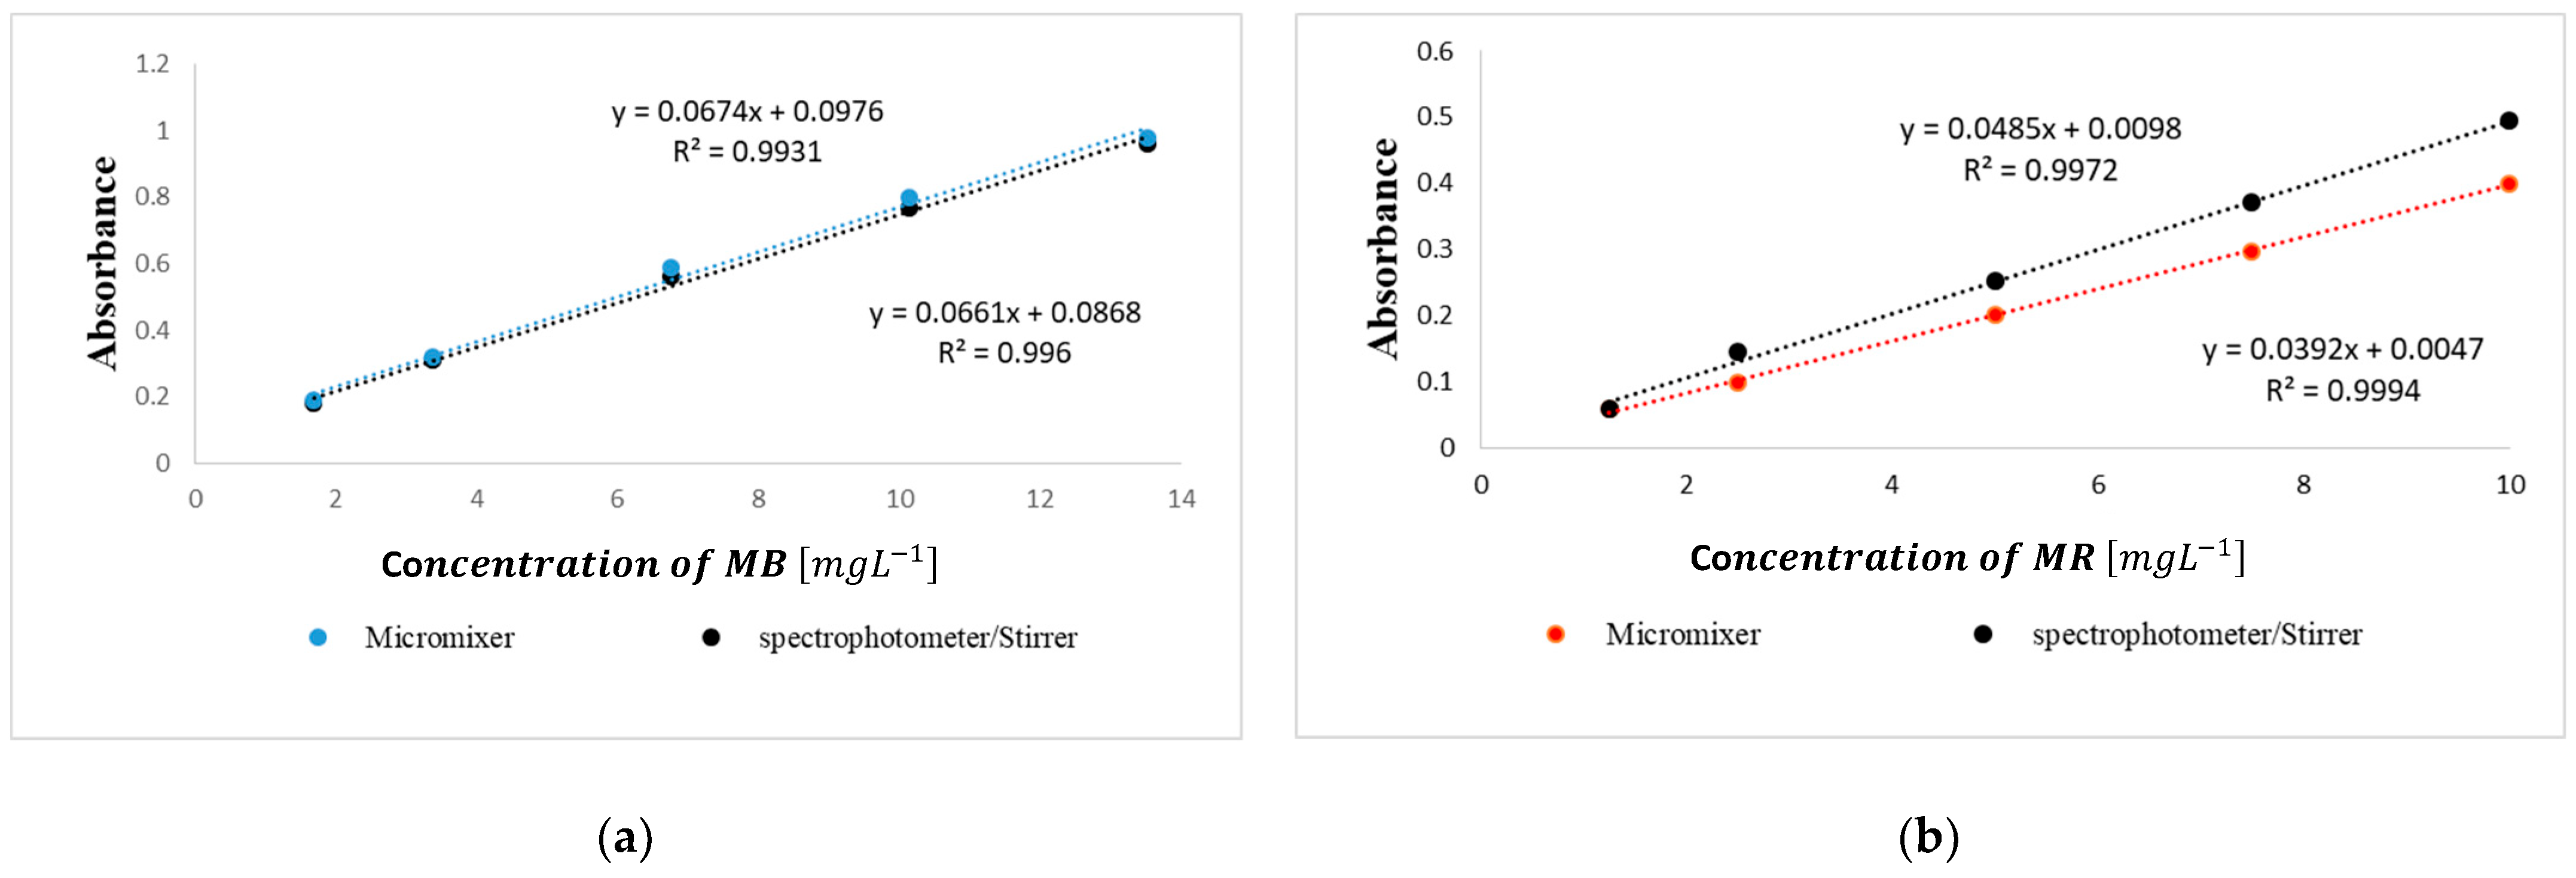
4.2.1. 3D Circular Serpentine Micromixer—PLA

The PLA filament specifications do not allow the use of corrosive solutions. Therefore, colored solutions were used instead. With a v′ = 1.3 mm2 s−1, Re = 49.7 and Pe = 49708, ensuring fast and optimal mixing. The PLA micromixer was evaluated using dilutions based on a stock solution of C16H18CIN3S (methylene blue, MB) at 25.11 μM concentration, measured at λ = 624 nm and another stock solution of C15H15N3O2 (methyl red, MR) at 37.13 μM measured at λ = 460 nm [46]. Figure 10a shows the calibration curve to the MB dilution and Figure 10b MR dilutions, both developed by two types of mixers using the magnetic stirrer and the absorbance was estimated with a Jenway 6305III spectrophotometer, obtaining for MB, R2 = 0.996, and for MR, R2 = 0.9972. The graph represents the absorbance measurements resulting from the mixture developed by the 3D serpentine micromixer for MB, where R2 = 0.9931 and for MR, R2 = 0.9994.

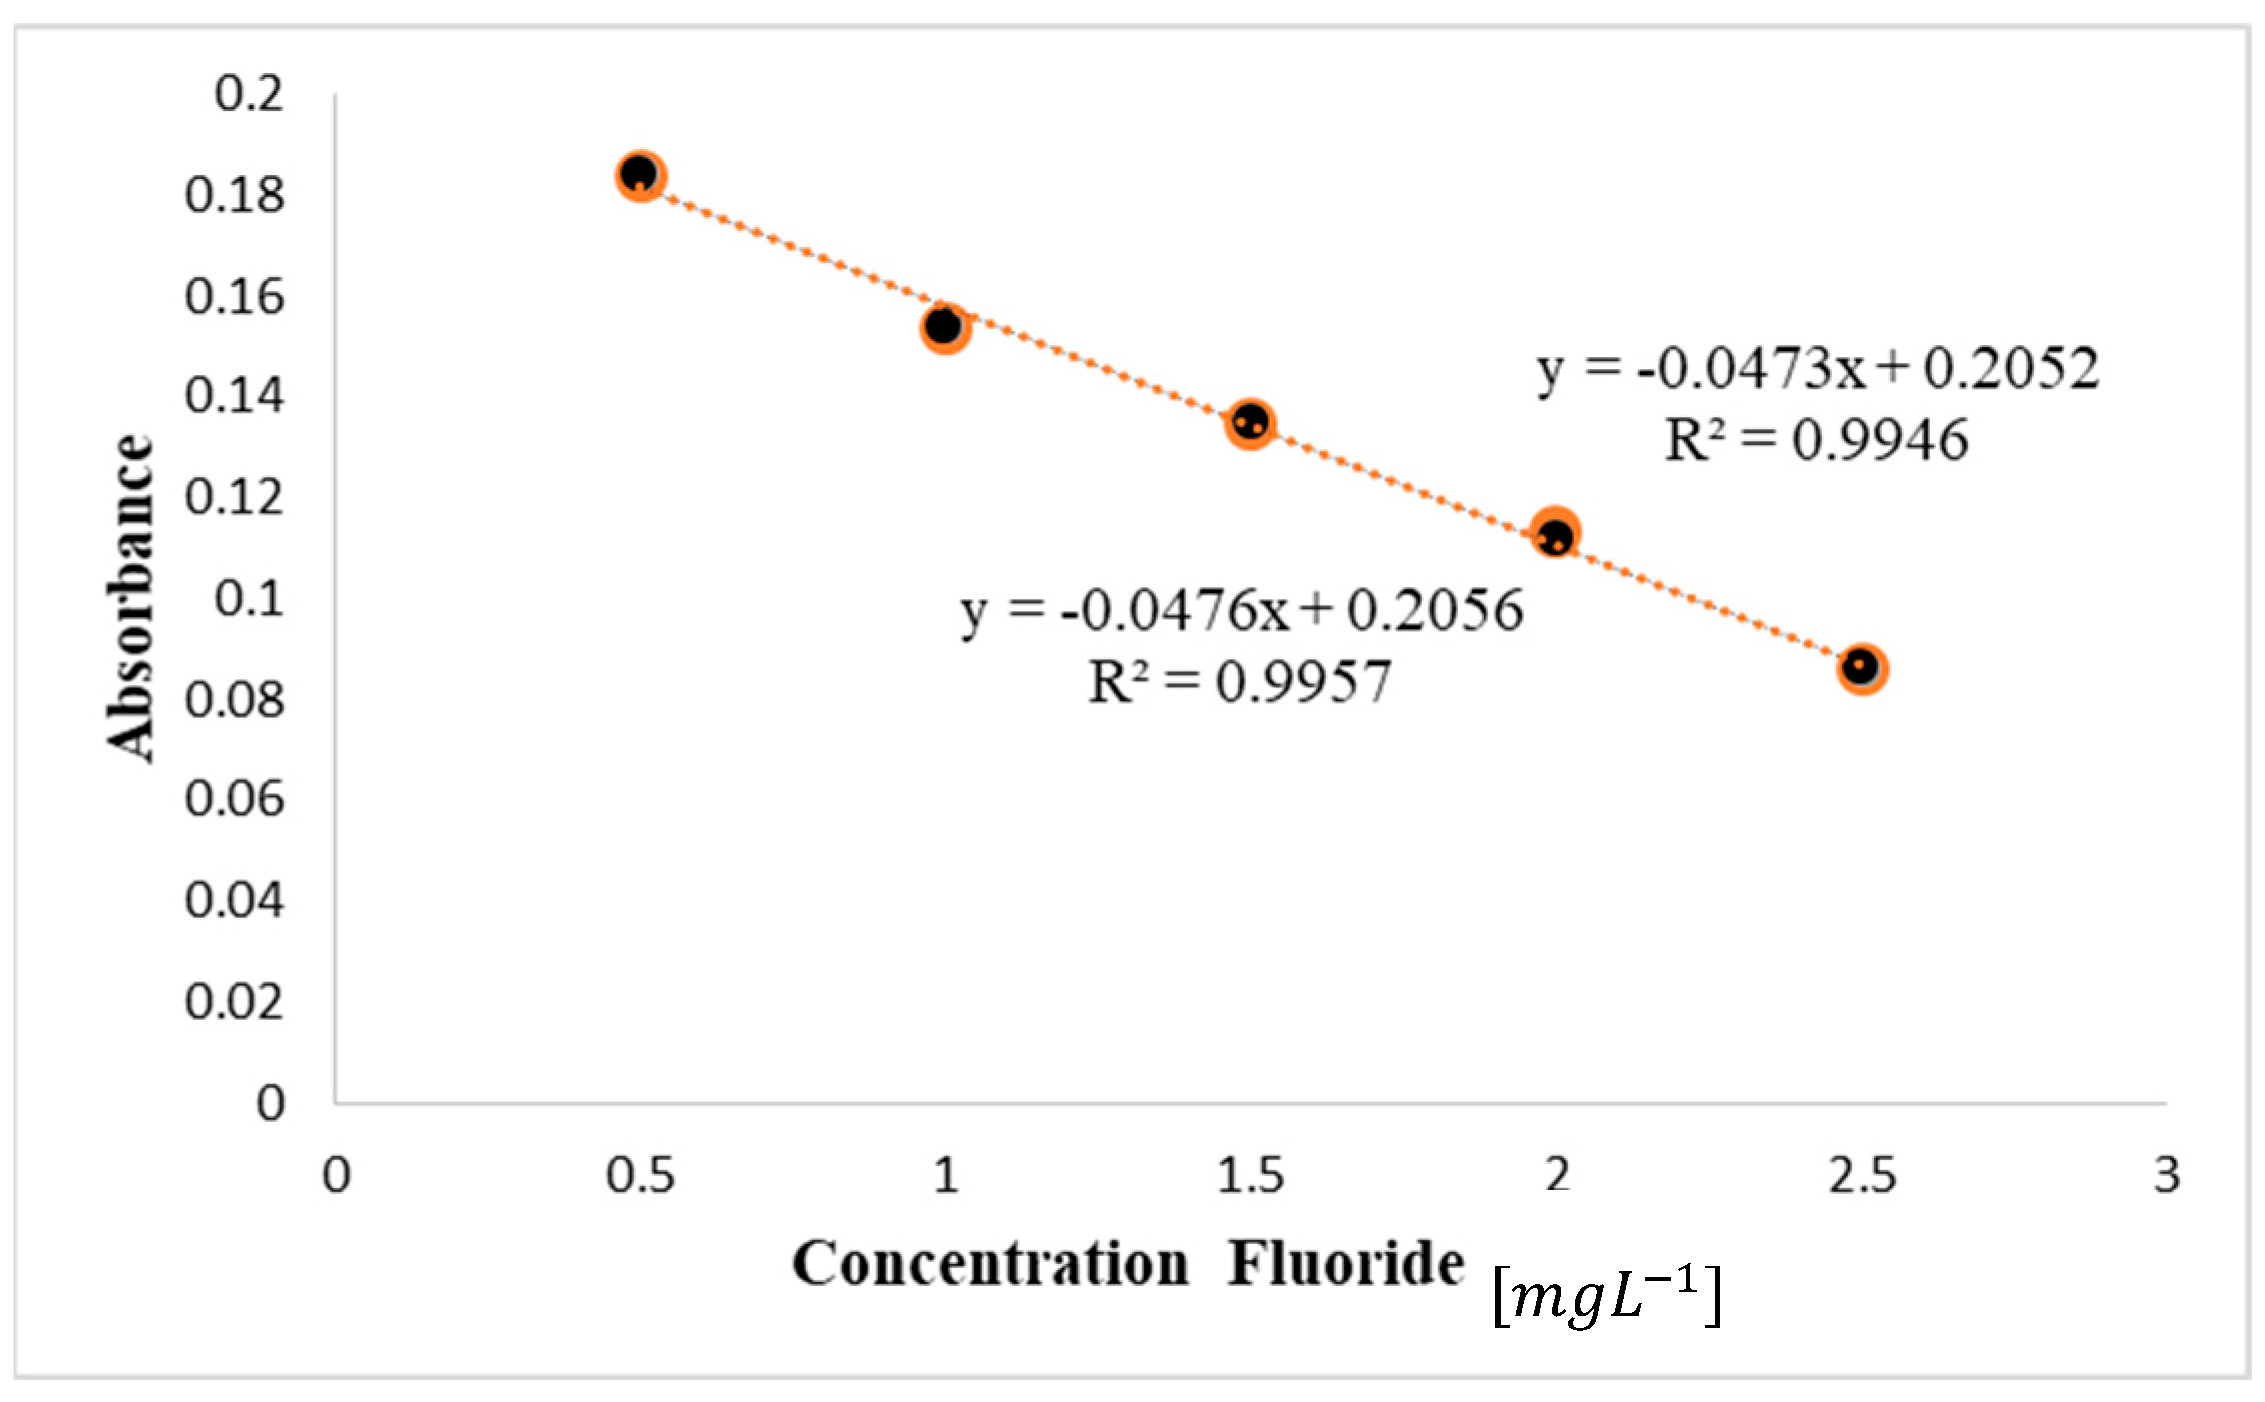
4.2.2. 3D Circular Serpentine Micromixer—PP

Another structure was made with polypropylene PP under the same design as the PLA 3D serpentine micromixer using the hydrodynamic values. PP is a material resistant to chemical solvents, bases, and acids at temperatures close to 80 °C and it is chemically inert. If v′ = 1.59 mm2 s−1, Re = 32.2 and Pe = 32201. The micromixer is shown in Figure 9b. The micromixer was evaluated to measure fluorides in water [34,46] using the SPANDS method measured at λ = 570 nm [32], which uses strong reagents such as sodium fluoride NaF, zirconium octahydrate ZnCl2, hydrochloric acid HCl, and SPANDS solution. In Figure 11, we can observe the absorbance as a function of fluoride concentration, measured by different techniques. In the first one, the fluoride concentration was mixed with reagents by stirrer and the absorbance was estimated with a Jenway 6305III spectrophotometer, obtaining R2 = 0.9957. In the second one, the mixing procedure and absorbance measurements were implemented in a PLA 3D serpentine micromixer, obtaining R2 = 0.9946.

5. Discussion

The micromixers discussed in this analysis were employed in an automated microanalytical process, utilizing the superposition of layers to construct microchannels. While LTCC technology removes material to create the internal geometry, FDM technology uses extrusion. Of the two technologies, 3D printing is simpler, cheaper, and faster for manufacturing microfluidic devices. In both technologies, the size of the internal channels depends largely on the milling tool or the extruder. In the case of acidic solutions, LTCC and PP materials showed very high performance. In the case of the PLA material, they have only been used to mix dye solutions due to limitations in working with corrosive chemical reactions or at high temperatures. When designing micromixers, it is necessary to analyze the fluid variables that influence the mixing process, which in microstructures depend mainly on diffusion time, tdif. Another variable to consider is tad, necessary time for the development of the microanalytical process and transport to the detector. In this work, tad >> tdif, allowing enough time to perform the mix. The optimal value of Q = 1.5 mL min−1 did not generate dispersion in any of the LTCC microstructures. The calculated tdif was defined for the multi-commutation times of the microactuators. The micromixers did not show any significant pressure drop. However, this was compensated by the electronically controlled flow rate. The stability of the hydrodynamic system is represented by F = 0.2146 [Hz] + 0.4318, r2 = 0.9992. For Qmin = 0.650mL min−1 (N = 5; 95% confidence).
In order to compare the results, the manufactured micromixer features are shown in Table 1. All passive micromixers generated advective flow through serpentine integration. The results showed higher Re and Pe values were achieved when heigh h was small in the microchannel (w > h), otherwise if h increased, their average velocity decreased. In the case of the 3D micromixers, although they had the same length L, the advection time tad in the 3D circular serpentine was longer. This may be necessary in cases where longer residence times, tR, are required for slow mixing processes. All micromixers achieved good mixing performance and very short time analysis with minimal error, characteristics necessary for in situ measurements.
The operating conditions of the micromixers were determined by the dimensionless numbers Re and Pe [9]. Figure 12 shows the operation of the micromixers described in Table 1. Also, Figure 12 shows the two characteristics lines that represent typical behavior for gas-es (Pe = Re) and liquids (Pe = 1000·Re). The region above Pe > 1000 indicates advec-tion-dominated transport, while diffusion dominates below Pe < 1000. The relationship between Reynolds (Re) and Peclet (Pe) numbers, highlighting flow regimes based on mo-mentum and mass transport characteristics. The red points correspond to advection-dominated conditions (Pe ≫ 1), where convective transport prevails over diffusion. These regimes are relevant for efficient mixing and transport in microfluidic and mesofluidic systems. The micromixers developed a laminar flow when Re < 2000. In designs that incorporate serpentine geometries, chaotic advection predominates over diffusion in the mixing process, resulting in a Peclet number much greater than 1 (Pe >> 1) and ensuring optimal mixing. This characteristic of the micromixers provided a significant advantage in sensitivity detection and reduces analysis time, allowing for greater sampling over a given period. Additionally, these micromixers did not require long channels for the mixing process, which reduced the size of the micromixer geometry, reagent volume, and waste generation.
During the experiment, air bubbles were present when changing the solution and reagent reservoirs. It was very important that the reservoirs always had a level above the hydraulic head. If the reservoirs emptied, the micropumps had a self-priming function, allowing the bubbles to be removed from the system without the need for external forces. Also, at values greater than Q = 3 mL min−1, air bubbles appeared in the detection cell generating light dispersion, which can result in an absorbance measurement error.
The LTCC serpentine 3D micromixer provided optimal mixing and good sensitivity. In this micromixer, one can observe the Schlieren effect [47,48] due to physical differences between the sample and the carrier, which could be the refractive index, viscosity, turbidity, etc. For example, in the case of sulfuric acid H2SO4 as a carry solution, this reflective effect is due to its density and reaction temperature. The dispersion of the sulfuric acid solution creates concentration gradients in the sample zone (BL) [49,50,51], which might cause artifacts in the acquired optical signal.
The signal obtained for the LTCC serpentine 3D micromixer is shown in Figure 13.
In the Co concentration measurement, the Schlieren effect was not significant because the amplitude of detected signal due to absorbance was higher than the one generated by the refraction effect.
To validate if a signal is clear and significant, a signal–noise ratio (SNR) should be SNR > 3. In this case, SNR was calculated as SNR = Sa/Sn. Based on the data from Figure 13, Sa = 105.60 mV and Sn = 2.6 mV, SNR = 40.5, where Sa is the analytical signal (e.g., sample 0.1 ppm) and Sn is the standard deviation of the baseline signal noise.
To minimize the Schlieren effect, the literature suggests increasing dispersion, increasing the injection volume, or varying the flow rate. In this experiment, we recommend to increase the trec (recovery time) between each sample to stabilize the BL, although this could increase the total analysis time.

6. Conclusions

In this work, we have demonstrated the design, fabrication, and photometric analytical applications of micromixers. Due to their low cost, dimensions, height, and the simple prototyping technologies used, this type of device could be used in field and real-time applications. Furthermore, we have shown that the micromixers achieve fast and optimal mixing processes. They show high sensitivity and precision in measurement of contaminants in water, with processing times in the order of seconds.
In particular, we have designed micromixers with geometries that integrate five ports and a pretreatment stage. This allows the development of complex mixtures in an analytical process; for example, for the determination of cobalt and fluorides. In future work, it is proposed that LTCC and FDM-PP micromixers be implemented in biochemical applications to evaluate their biocompatibility.

Author Contributions

Conceptualization, R.M.C.-E. and J.L.F.; methodology, J.M.C.-E. and E.H.-C.; software, L.H.G.-M.; validation, R.M.C.-E., J.L.F. and E.H.-C.; formal analysis, R.M.C.-E. and E.H.-C.; investigation, R.M.C.-E. and J.M.C.-E.; resources, J.M.C.-E. and J.L.F.; data curation, L.H.G.-M.; writing—original draft preparation, R.M.C.-E.; writing—reviewing and editing, R.M.C.-E., J.L.F., J.M.C.-E., L.H.G.-M. and E.H.-C.; visualization, L.H.G.-M.; supervision, J.M.C.-E. and E.H.-C.; project administration, R.M.C.-E. and J.M.C.-E. All authors have read and agreed to the published version of the manuscript.

Funding

This research received no external funding.

Institutional Review Board Statement

Not applicable.

Informed Consent Statement

Not applicable.

Data Availability Statement

Some original data presented in the study are openly available at https://doi.org/10.17632/64ykjhczr6.3 (accessed on 24 April 2025).

Conflicts of Interest

The authors declare no conflicts of interest.

Nomenclature

The following nomenclatures are used in this manuscript:
AAbsorbance-
wChannel widthm
QFlow ratem3/s
DMMolecular diffusionm2/s
DDispersioncm/s
CConcentrationM/L
ρDensityKg/m3
dDiameterm
R2Correlation coefficient-
LChannel lengthm
BLBase lineM/L
LDDiffusion lengthm
hHigh (depth) channelm
PePeclet number-
ReReynold number-
RfluidFluid resistance (geometry/length channel)mm
SaAnalytical signalV
SdDark signalV
SrReference signalV
tTimes
tadAdvection times
tdifDiffusion times
vsAverage velocitym/s
µDynamic viscosityKg/m-s
vKinematic viscositym2/s
VVolumem3

References

  1. Ottino, J.M.; Wiggins, S. Introduction: Mixing in Microfluidics. Philos. Trans. Math. Phys. Eng. Sci. 2004, 362, 923–935. [Google Scholar] [CrossRef] [PubMed]
  2. Manz, A.; Graber, N.; Widmer, H.M. Miniaturized Total Chemical Analysis Systems: A Novel Concept for Chemical Sensing. Sens. Actuators B Chem. 1990, 1, 244–248. [Google Scholar] [CrossRef]
  3. Capretto, L.; Cheng, W.; Hill, M.; Zhang, X. Micromixing Within Microfluidic Devices. In Topics in Current Chemistry; Lin, B., Ed.; Springer: Berlin/Heidelberg, Germany, 2011; Volume 304, pp. 27–68. ISBN 978-3-642-23049-3. [Google Scholar]
  4. Shestopalov, I.; Tice, J.D.; Rustem, I.F. Multi-Step Synthesis of Nanoparticles Performed on Millisecond Time Scale in a Microfluidic Droplet-Based System. Lab Chip 2004, 4, 316–321. [Google Scholar] [CrossRef]
  5. Mason, B.P.; Price, K.E.; Steinbacher, J.L.; Bogdan, A.R.; McQuade, D.T. Greener Approaches to Organic Synthesis Using Microreactor Technology. Chem. Rev. 2007, 107, 2300–2318. [Google Scholar] [CrossRef]
  6. Aoki, N.; Hasebe, S.; Mae, K. Mixing in Microreactors: Effectiveness of Lamination Segments as a Form of Feed on Product Distribution for Multiple Reactions. Chem. Eng. J. 2004, 101, 323–331. [Google Scholar] [CrossRef]
  7. Surangalikar, H.; Ouyang, X.; Besser, R. Experimental Study of Hydrocarbon Hydrogenation and Dehydrogenation Reactions in Silicon Microfabricated Reactors of Two Different Geometries. Chem. Eng. J. 2003, 93, 217–224. [Google Scholar] [CrossRef]
  8. Wilms, D.; Klos, J.; Frey, H. Microstructured Reactors for Polymer Synthesis: A Renaissance of Continuous Flow Processes for Tailor-Made Macromolecules? Macromol. Chem. Phys. 2008, 209, 343–356. [Google Scholar] [CrossRef]
  9. Nguyen, N.T.; Wu, Z. Micromixers—A Review. J. Micromech. Microeng. 2005, 15, R1–R16. [Google Scholar] [CrossRef]
  10. Barbosa-Saldaña, J.G.; Jiménez-Bernal, J.A.; Gutiérrez-Torres, C.d.C.; Quinto-Diez, P. Tri-Dimensional Numerical Analysis for Forced Convection over a Forward Facing Step. Inv. Ing. Tecnol. RIIT 2010, XI, 45–55. [Google Scholar]
  11. Hossain, S.; Ansari, M.A.; Kim, K.Y. Evaluation of the Mixing Performance of Three Passive Micromixers. Chem. Eng. J. 2009, 150, 492–501. [Google Scholar] [CrossRef]
  12. Ganguli, A.; Bhatt, V.; Yagodnitsyna, A.; Pinjari, D.; Pandit, A. A Review of Pressure Drop and Mixing Characteristics in Passive Mixers Involving Miscible Liquids. Micromachines 2024, 15, 691. [Google Scholar] [CrossRef]
  13. Wang, X.; Liu, Z.; Cai, Y.; Wang, B.; Luo, X. A Cost-Effective Serpentine Micromixer Utilizing Ellipse Curve. Anal. Chim. Acta 2021, 1155, 338–355. [Google Scholar] [CrossRef]
  14. Ran, B.; Liu, B.; Chen, C.; Tong, W.; Shi, J.; Du, J.; Yu, Z.; Bai, S.; Chen, H.; Zhu, Y. Acoustic Micromixing in a Serpentine Channel with Sharp Teeth for Controllable Nanomaterial Synthesis. Chem. Eng. J. 2025, 504, 159094. [Google Scholar] [CrossRef]
  15. Yin, B.; Zhu, H.; Zeng, S.; Sohan, A.M.; Wan, X.; Liu, J.; Zhang, P.; Lin, X. Chip-Based Automated Equipment for Dual-Mode Point-of-Care Testing Foodborne Pathogens. Biosens. Bioelectron. 2024, 257, 116338. [Google Scholar] [CrossRef]
  16. Gongora-Rubio, M.R.; Espinoza-Vallejos, P.; Sola-Laguna, L.; Santiago-Avilés, J.J. Overview of Low Temperature Co-Fired Ceramics Tape Technology for Meso-System Technology (MsST). Sens. Actuators A Phys. 2001, 89, 222–241. [Google Scholar] [CrossRef]
  17. Peterson, K.A.; Patel, K.D.; Ho, C.K.; Rohde, S.B.; Nordquist, C.D.; Walker, C.A.; Wroblewski, B.D.; Okandan, M. Novel Microsystem Applications with New Techniques in Low-Temperature Co-Fired Ceramics. Int. J. Appl. Ceram. Technol. 2005, 2, 345–363. [Google Scholar] [CrossRef]
  18. Golonka, L.J. Technology and Applications of Low Temperature Cofired Ceramic (LTCC) Based Sensors and Microsystems. Bull. Pol. Acad. Sci. Tech. Sci. 2006, 54, 221–231. [Google Scholar]
  19. Belavic, D.; Hrovat, M.; Dolanc, G.; Santo Zarnik, M.; Holc, J.; Makarovic, K. Design of LTCC-Based Ceramic Structure for Chemical Microreactor. Radioengineering 2012, 21, 195–200. [Google Scholar]
  20. Baeza, M. Ceramic Microsystem Incorporating a Microreactor with Immobilized Biocatalyst for Enzymatic Spectrophotometric Assays. Anal. Chem. 2010, 82, 1006–1011. [Google Scholar] [CrossRef]
  21. Malecha, K.; Pijanowska, D.; Golonka, L.; Torbicz, W. LTCC Enzymatic of Microreactors. J. Microelectron. Electron. Packag. 2007, 4, 51–56. [Google Scholar] [CrossRef]
  22. Malecha, K.; Pijanowska, D.G.; Golonka, L.J.; Piotr, K. Low Temperature Co-Fired Ceramic (LTCC)-Based Biosensor for Continuous Glucose Monitoring. Sens. Actuators B Chem. 2011, 155, 923–929. [Google Scholar] [CrossRef]
  23. Bhattacharjee, N.; Urrios, A.; Kang, S.; Folch, A. The Upcoming 3D-Printing Revolution in Microfluidics. Lab Chip 2016, 16, 1720–1742. [Google Scholar] [CrossRef]
  24. Nielsen, A.V.; Beauchamp, M.J.; Nordin, G.P.; Woolley, A.T. 3D Printed Microfluidics. Annu. Rev. Anal. Chem. 2020, 13, 45–65. [Google Scholar] [CrossRef] [PubMed]
  25. Andrew, J.; Capel, A.; Edmondson, S.; Christie, S.D.R.; Goodridge, R.D.; Bibbd, R.J.; Thurstans, M. Design and Additive Manufacture for Flow Chemistry. Lab Chip 2013, 13, 4583–4590. [Google Scholar] [CrossRef]
  26. Kitson, P.J.; Rosnes, M.H.; Sans, V.; Dragonea, V.; Cronin, L. Configurable 3D-Printed Millifluidic and Microfluidic ‘Lab on a Chip’ Reactionware Devices. Lab Chip 2012, 12, 3267–3271. [Google Scholar] [CrossRef] [PubMed]
  27. Symes, M.D.; Kitson, P.J.; Yan, J.; Richmond, C.J.; Cooper, G.J.T.; Bowman, R.W.; Vilbrandt, T.; Cronin, L. Integrated 3D-Printed Reactionware for Chemical Synthesis and Analysis. Lab Chip 2012, 4, 349–354. [Google Scholar] [CrossRef]
  28. Bishop, G.W.; Satterwhite, J.E.; Bhakta, S.; Kadimisetty, K.; Gillette, K.M.; Chen, E.; Rusling, J.F. 3D-Printed Fluidic Devices for Nanoparticle Preparation and Flow-Injection Amperometry Using Integrated Prussian Blue Nanoparticle-Modified Electrodes. Anal. Chem. 2015, 87, 5437–5443. [Google Scholar] [CrossRef]
  29. Kadimisetty, K.; Mosa, I.M.; Malla, S.; Satterwhite-Warden, J.E.; Kuhns, T.; Faria, R.C.; Leed, N.H.; Rusling, F.J. 3D-Printed Supercapacitor-Powered Electrochemiluminescent Protein Immunoarray. Biosens. Bioelectron. 2016, 15, 188–193. [Google Scholar] [CrossRef]
  30. Imanaka, Y. Multilayered Low Temperature Cofired Ceramics (LTCC) Technology, 1st ed.; Springer: New York, NY, USA, 2005; ISBN 978-0-387-23130-3. [Google Scholar]
  31. Available online: https://www.gob.mx/impi/prensa/premio-impi-a-la-innovacion-mexicana-2025-397164?state=published (accessed on 24 April 2025).
  32. NMX-AA-077-SCFI-2001; Waters Analysis, Determination of Fluoride in Natural, Wastewaters and Wastewaters Treated, Test Method. Secretaría de Economía: Mexico City, Mexico, 2001.
  33. Fonseca, A.; Raimundo, I.M. A Multichannel Photometer Based on an Array of Light Emitting Diodes for Use in Multivariate Calibration. Anal. Chim. Acta 2004, 522, 223–229. [Google Scholar] [CrossRef]
  34. Camarillo Escobedo, R.M.; Flores Nuñez, J.L.; Camarillo Escobedo, J.; García Muñoz, L.; Peña Dominguez, E. 3D Printed Opto-Microfluidic Autonomous Analyzer for Photometric Applications. HardwareX 2023, 14, e00406. [Google Scholar] [CrossRef]
  35. Standford University Stanford Microfluidics Foundry. Available online: https://www.stanfordmicrofluidics.com/ (accessed on 24 April 2025).
  36. Camarillo-Escobedo, R.M.; Camarillo-Escobedo, J.M. LTCC Technology Applied to the Development of Microfluidics Systems. In Proceedings of the MEMORIAS DEL XVI CONGRESO INTERNACIONAL ANUAL DE LA SOMIM, Monterrey, Mexico, 22–24 September 2010; Mexican Society of Mechanical Engineering SOMIM: Monterrey, Mexico, 2010; pp. 1–10. [Google Scholar]
  37. Squires, T.M.; Quake, S.R. Microfluidics: Fluid Physics at the Nanoliter Scale. Rev. Mod. Phys. 2005, 77, 977–1026. [Google Scholar] [CrossRef]
  38. Ruzicka, J.; Stewart, J. Flow Injection Analysis. II. Ultrafast Determination of Phosphorus in Plant Material by Continuous Flow Spectrophotometry. Anal. Chim. Acta 1975, 79, 79–91. [Google Scholar] [CrossRef]
  39. Ottino, J.M. Mixing, Chaotic Advection, and Turbulence. Annu. Rev. Fluid. Mech. 1990, 22, 207–254. [Google Scholar] [CrossRef]
  40. Stroock, A.D.; Dertinger, S.K.W.; Ajdari, A.; Mezić, I.; Stone, H.A.; Whitesides, G.M. Chaotic Mixer for Microchannels. Science 2002, 295, 647–651. [Google Scholar] [CrossRef]
  41. Lee, C.Y.; Chang, C.L.; Wang, Y.N.; Fu, L.M. Microfluidic Mixing: A Review. Int. J. Mol. Sci. 2011, 12, 3263–3287. [Google Scholar] [CrossRef]
  42. Nguyen, N.-T.; Wereley, S.; Mousavi, S.A. Fundamentals and Applications of Microfluidics, 3rd ed.; Artech House Publishers: Norwood, MA, USA, 2019; ISBN 978-1-63081-364-2. [Google Scholar]
  43. Wu, Z.; Nguyen, N.-T.; Huang, X. Nonlinear Diffusive Mixing in Microchannels: Theory and Experiments. J. Micromech. Microeng. 2004, 14, 604–611. [Google Scholar] [CrossRef]
  44. Ross, C.; Murdoch, L.C.; Freedman, D.L.; Siegrist, R.L. Characteristics of Potassium Permanganate Encapsulated in Polymer. J. Environ. Eng. 2005, 131, 1203–1211. [Google Scholar] [CrossRef]
  45. ERCROS Acido Sulfúrico-Ficha de Datos; Barcelona: Glen Ave, PA, USA, 2006; Available online: https://www.carlroth.com/medias/SDB-X946-ES-ES.pdf?context=bWFzdGVyfHNlY3VyaXR5RGF0YXNoZWV0c3wzMzg2OTh8YXBwbGljYXRpb24vcGRmfGFHSXdMMmhoTnk4NU1UYzFOelU1T1RFeU9Ua3dMMU5FUWw5WU9UUTJYMFZUWDBWVExuQmtaZ3w2MDQyYTYwZjY1ZDZhMTU3NThhOTUwYWY2ODczNDViNWQ0MDM0NTQxNjU0N2VkZWYzZTMyZDNiNGZkMTNhYzVi (accessed on 24 April 2025).
  46. Camarillo-Escobedo, R.M.; Flores-Nuñez, J.L.; Garcia-Torales, G.; Hernandez-Campos, E.; Camarillo-Escobedo, J.M. 3D Printed Opto-Microfluidic Autonomous Analyzer for Photometric Applications. Sens. Actuators A Phys. 2022, 337, 113425. [Google Scholar] [CrossRef]
  47. Zagatto, E.A.G.; Arruda, M.A.Z.; Jacintho, A.O.; Mattos, I.L. Compensation of the Schlieren Effect in Flow-Injection Analysis by Using Dual-Wavelength Spectrophotometry. Anal. Chim. Acta 1990, 234, 153–160. [Google Scholar] [CrossRef]
  48. Rocha, F.R.P.; Zagatto, E.A.G. Chemical Derivatization in Flow Analysis. Molecules 2022, 27, 1563. [Google Scholar] [CrossRef]
  49. Zeng, M.; Wang, C.; Li, L. Designed Oscillations of the Fe/H2SO4 System with the Flow Injection in a Partially-Closed Environment. Electrochem. Commun. 2009, 11, 1888–1891. [Google Scholar] [CrossRef]
  50. Rocha, F.R.P.; Nóbrega, J.A. Overcoming the Schlieren Effect in Flow Injection Spectrophotometry by Introduction of Large Sample Volumes. Determination of Chloride in the Electrolyte of Lead-Acid Batteries. J. Braz. Chem. Soc. 1997, 8, 625–629. [Google Scholar] [CrossRef]
  51. Dias, A.C.B.; Borges, E.P.; Zagatto, E.A.G.; Worsfold, P.J. A Critical Examination of the Components of the Schlieren Effect in Flow Analysis. Talanta 2006, 68, 1076–1082. [Google Scholar] [CrossRef] [PubMed]
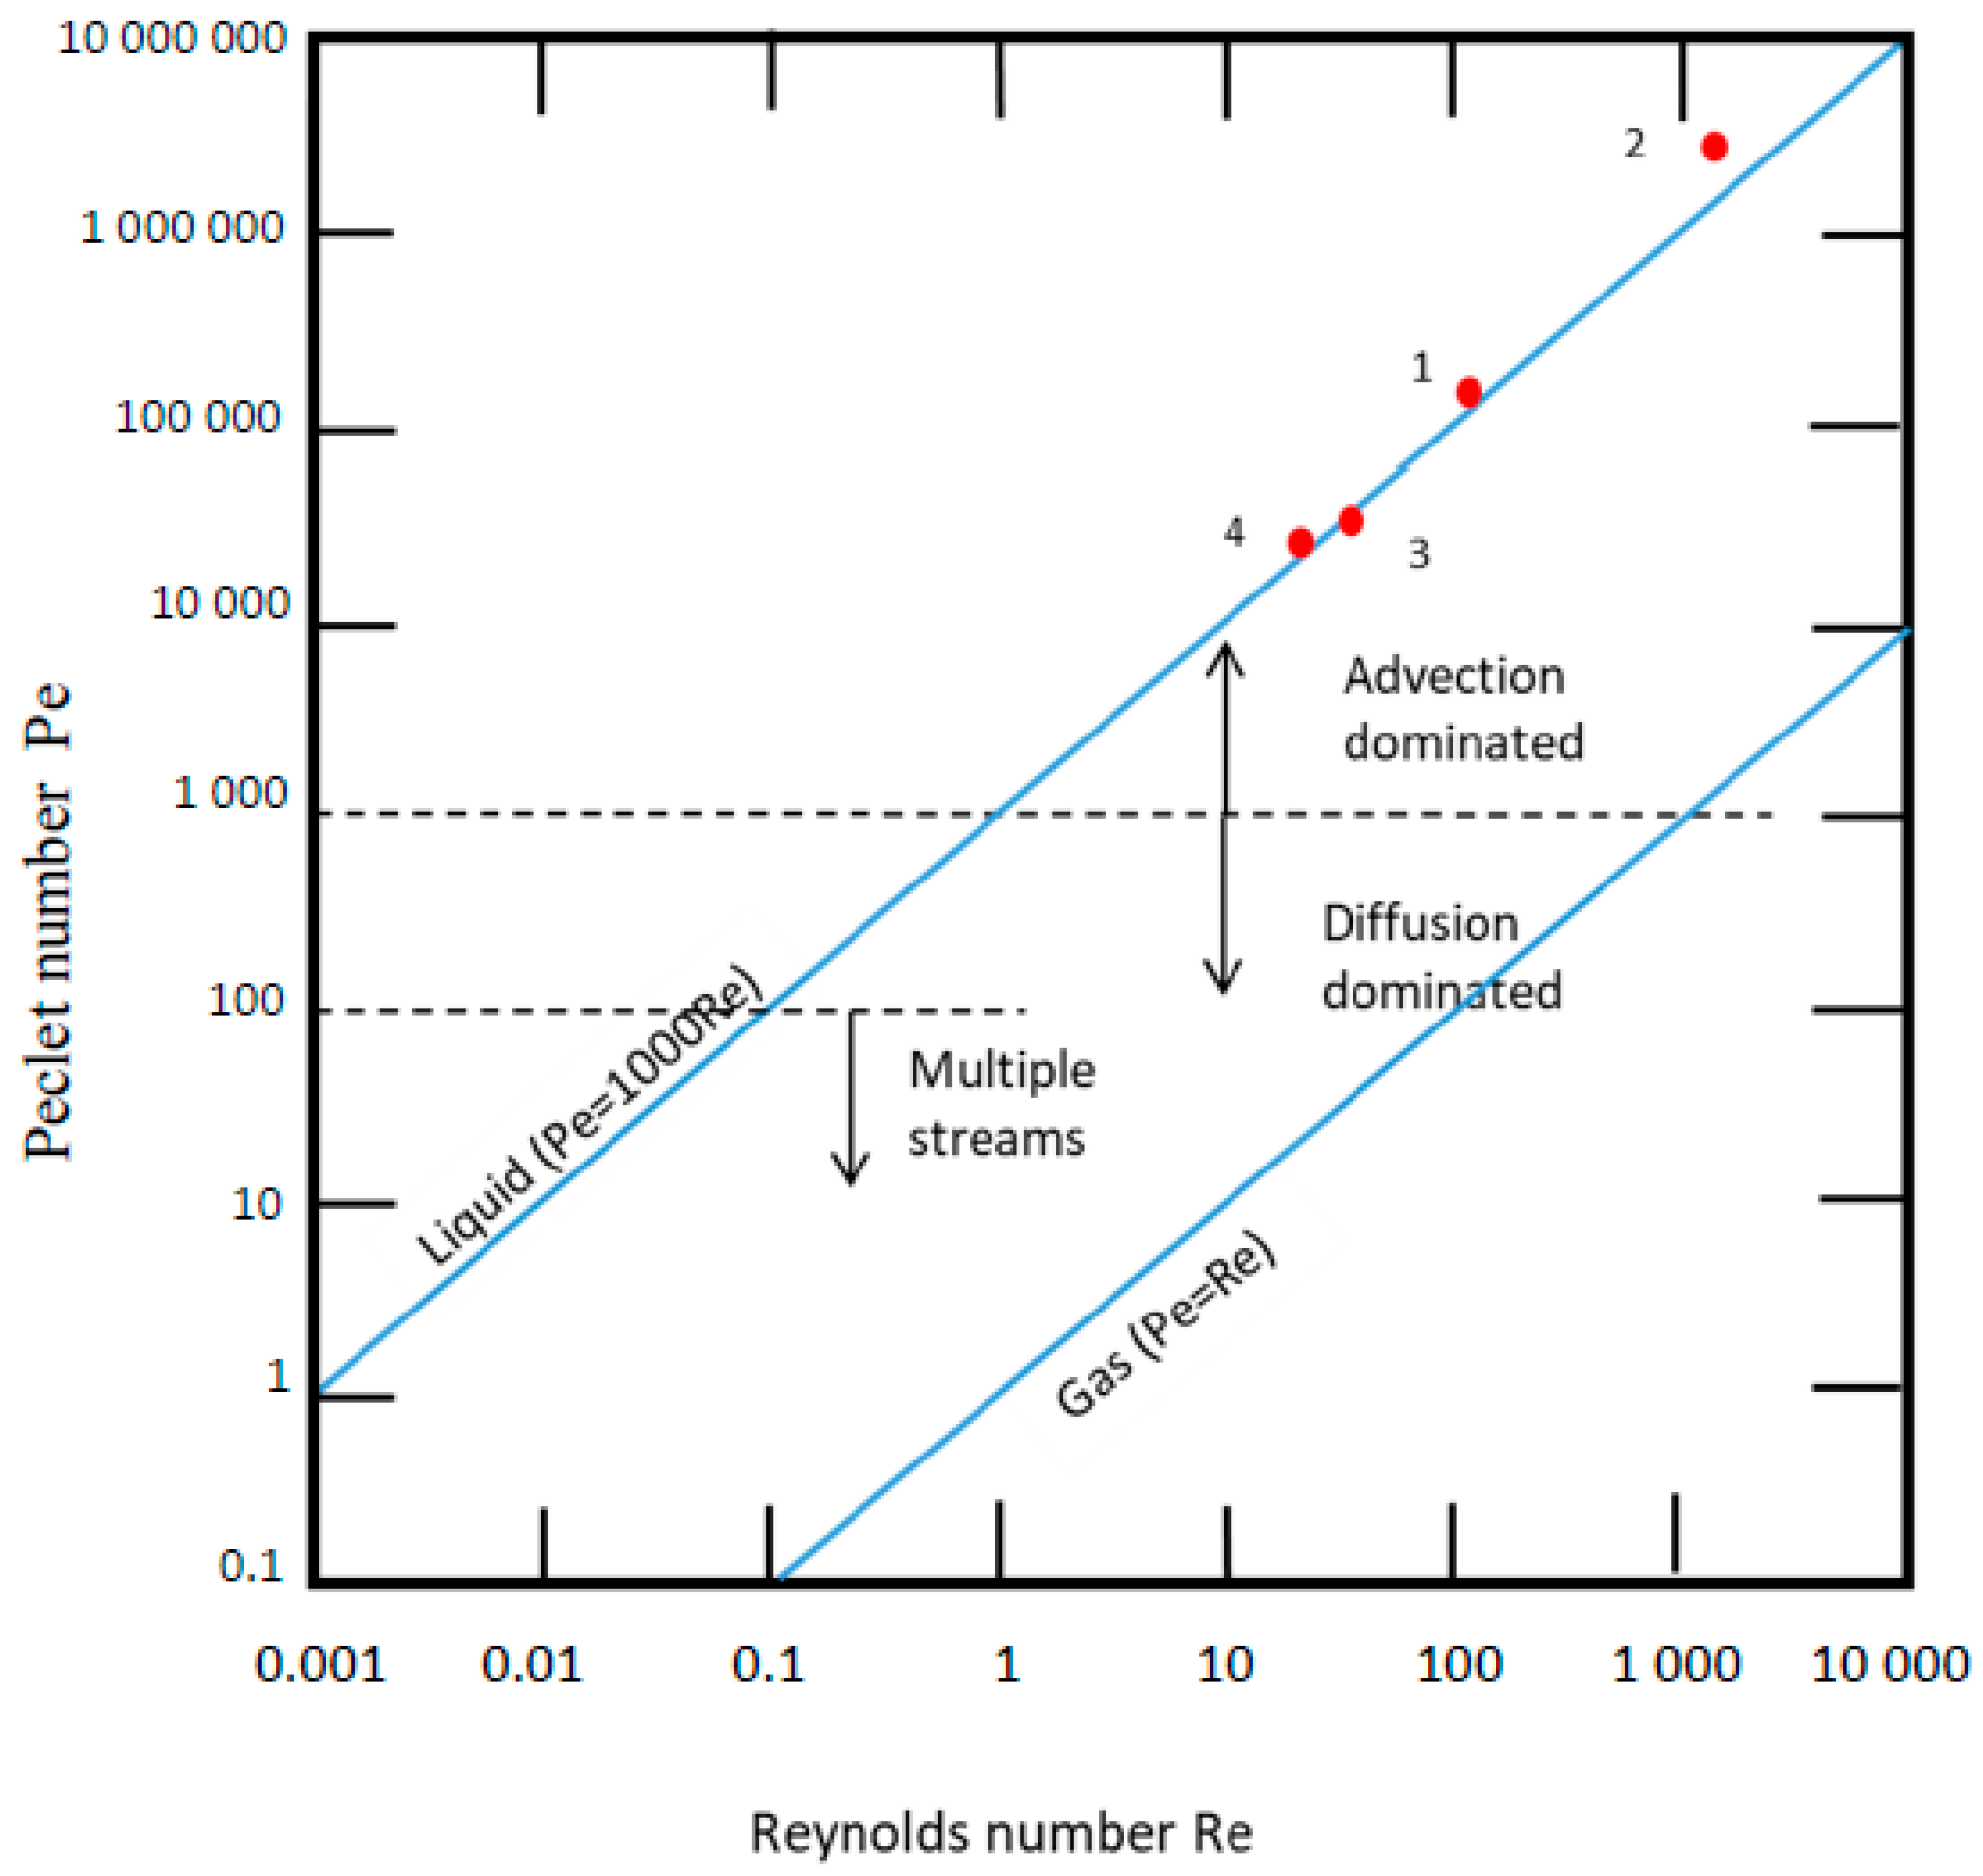
Figure 1. Block diagram of flow device [34].
Chemosensors 13 00191 g001
Figure 2. Aspect ratio h:w.
Chemosensors 13 00191 g002
Figure 3. Dispersion signal in the detector.
Chemosensors 13 00191 g003
Figure 4. Operation times for injection process.
Chemosensors 13 00191 g004
Figure 5. Two-dimensional LTCC planar serpentine micromixer; (a) monolithic structure 45 × 30 × 1.72 mm; (b) internal geometry.
Chemosensors 13 00191 g005
Figure 6. Absorbance as a function of concentration for two mixing procedures. Black line corresponds to magnetic stirrer and red line is for LTCC micromixer.
Chemosensors 13 00191 g006
Figure 7. 3D LTCC serpentine: (a) monolithic structure 53 × 53 × 3 mm; (b) micromixer with premixing.
Chemosensors 13 00191 g007
Figure 8. Calibration curve for two techniques: Black line, the mixing was by a stirrer and orange line, by the 3D LTCC serpentine micromixer.
Chemosensors 13 00191 g008
Figure 9. 3D serpentine micromixer 6.8 × 7.8 × 1.5 mm; (a) PLA micromixer; (b) PP micromixer; (c) internal geometry.
Chemosensors 13 00191 g009
Figure 10. Absorbance measurement as a function of concentration: (a) MB; (b) MR.
Chemosensors 13 00191 g010
Figure 11. Absorbance as a function of concentration for two mixing procedures: Mixed by stirrer (black line) and PP 3D micromixer (orange line).
Chemosensors 13 00191 g011
Figure 12. Operation ranges of micromixers. The data for the red points were determined based on reported geometry data and velocity (flow rate) data described in Table 1. Operation points of passive mixers based on chaotic advection and active mixers can be distributed around the two lines Pe = 1000Re for liquid and Pe = Re for gases [9].
Chemosensors 13 00191 g012
Figure 13. Schlieren effect in the 3D LTCC serpentine micromixer using H2SO4 as carry solution to Co concentration measurement.
Chemosensors 13 00191 g013
Table 1. Micromixer features.
No.TypeMaterialsNumber of NozzlesChannel Width
(µm)
Channel Height
(µm)
Typical Velocity
(mm s−1)
RePetad (s)Analite/SampleRMSE
12D serpentine planar
90°-shaped
Ceramics487385033.69 101.07101,0008KMnO40.005
23D Serpentine L-shapedCeramics587343166.4417871.7 × 1069Co0.002 *
33D Serpentine circularPLA52000200025.649.74970823.43MB
MR
0.021
0.061
43D Serpentine circularPP52000200025.632.203220123.43F0.012
* Linearity of response.
Disclaimer/Publisher’s Note: The statements, opinions and data contained in all publications are solely those of the individual author(s) and contributor(s) and not of MDPI and/or the editor(s). MDPI and/or the editor(s) disclaim responsibility for any injury to people or property resulting from any ideas, methods, instructions or products referred to in the content.

