1. Introduction
Baked goods represent a central element of the culinary traditions of many cultures [
1]. Their quality, defined by flavor, texture, and nutritional value, is closely linked to the fermentation process that precedes baking [
2]. This stage contributes to the development of complex aromas, enhances digestibility, and extends shelf life [
3,
4].
Bread, one of the oldest baked goods, has accompanied human evolution, becoming a symbol of nourishment and sharing. Today, its preparation represents both a tradition and an opportunity for innovation. Sourdough, for instance, is experiencing a resurgence due to its ability to impart a unique flavor and an appealing texture. Used in bread and other fermented products, it creates a soft crumb and a distinctive aroma that industrial yeasts cannot replicate [
5].
Interest in sourdough and cold fermentation is growing among both consumers and researchers [
5]. Due to its rich composition of wild yeasts and lactic acid bacteria, this fermentation method, which is slower than industrial processes, enhances the bread’s aromatic profile while also offering nutritional benefits [
6]. These include a reduction in phytic acid, increased bioavailability of minerals, and a decrease in FODMAPs (fermentable oligosaccharides, disaccharides, monosaccharides, and polyols) and immunogenic gluten peptides, making the bread more digestible. Furthermore, it promotes the production of bioactive peptides with potential health benefits [
7].
In the baking industry, scientific research is responding to the growing demand from consumers who are increasingly attentive to quality, taste, and health [
8]. Innovation and tradition converge to develop new products that meet these expectations [
2,
9]. A crucial aspect of research focuses on studying fermentation processes and optimizing parameters to improve the final product’s quality. Fermentation is a complex process, with its study requiring advanced tools and an interdisciplinary approach [
10].
Our study investigates the cold fermentation process with sourdough using innovative techniques such as the electronic nose (E-nose), as well as microbiological and traditional methods, including solid-phase microextraction gas chromatography–mass spectrometry (SPME-GC-MS). The aim is to identify the optimal fermentation point to obtain baked goods with distinctive and unique characteristics.
The E-nose, equipped with specific sensors, simulates the human olfactory system [
11] and detects volatile compounds released during fermentation, which are essential for the bread’s aromatic profile. This device enables rapid, objective, and non-invasive analysis, standing out for its high sensitivity, fast response time, low cost, and potential for miniaturization. In particular, it allows precise monitoring of the chemical transformations occurring in the dough, ensuring effective control of the fermentation process and guaranteeing uniformity in the final product. Compared to GC-MS, which requires compound separation and longer analysis times, the E-nose provides a faster and more integrative approach to assess the global volatile profile of the sample [
12].
Microbiological analysis identifies the dominant yeast and bacterial species and their role in acidification and aroma production, while SPME-GC-MS quantifies key volatile compounds [
13,
14]. Integrating these data establishes relationships between microbial composition, the volatilome, and the sensory characteristics of the product.
This study highlights the importance of a multidisciplinary approach in modern baking, emphasizing the innovative potential of the E-nose in fermentation processes [
15]. A deep understanding of chemistry and biology allows for improvements in the flavor and nutritional value of baked goods while also promoting more sustainable practices. Through the convergence of innovation and tradition, it is possible to meet the demands of a consumer base increasingly focused on quality and health.
The aim of this study was to optimize the cold fermentation time of sourdough and evaluate the potential use of the electronic nose (E-nose) for process monitoring, integrating microbiological and volatile compound analyses to enhance quality control and standardize baking.
2. Materials and Methods
To examine the unique characteristics of the samples, data from electronic nose analysis, chromatography, and microbiological methods were compared. This evaluation aimed to determine the reliability and effectiveness of each technique in identifying chemical compounds and sensory attributes. By combining these three approaches, it is possible to gain a comprehensive understanding of the chemical and biological processes that shape the sensory properties of the samples, particularly in relation to odor formation and development. The integration of microbiological insights with chemical and olfactory data sheds light on the interactions between microflora and volatile compounds during fermentation, revealing their impact on the final aromatic profile. This interdisciplinary method has broad applications in fields like baking, fermented beverage production, and overall food manufacturing, where understanding sensory dynamics is essential for enhancing product quality and consistency [
16,
17].
2.1. Experimental Desing
The artisanal bakery company PanContigo S.L. (Badajoz, Spain) supplied all the necessary ingredients for dough preparation. The formulation consisted of 80% flour–water mixture and 20% sourdough inoculum (PIE). The flour–water mixture was composed of 50% water and 50% flour. The flour used was a blend containing 25% whole wheat flour and 25% strong (high-protein) flour, providing a balanced base suitable for fermentation processes.
The dough was subjected to cold fermentation at 5 °C. All dough samples were prepared using the same batch of sourdough and processed under identical conditions. Fermentations were carried out in parallel, and measurements at 0 h served as the baseline for volatile evolution. To monitor the fermentation progress, samples were collected for pH measurement, electronic nose (E-nose) analysis, and microbiological evaluation. All analyses were performed under controlled laboratory conditions (20 ± 2 °C). E-nose measurements were conducted inside a fume hood to ensure a clean environment free from interfering volatile compounds. Different incubation temperatures were selected according to the analytical technique: 25 °C for E-nose measurements in a thermostatic water bath, to simulate sensory perception conditions; and 37 °C for GC-MS, to enhance the release of volatile compounds. Since the aim of this study was to compare global olfactory patterns and not the behavior of individual VOCs across techniques, this difference does not affect the validity of the comparative analysis.
For pH and microbiological analysis, one dough sample of 20 g was collected at each fermentation time (0 h, 4 h, 20 h, and 24 h) and analyzed in triplicate. For E-nose analysis, three 20 g dough samples were taken per time point and each was measured six times, resulting in 18 measurements per fermentation time and 72 measurements in total. These 72 E-nose data were randomly divided into two subsets: 52 measurements used for calibration and cross-validation, and 20 for external validation of the ANNDA model. For the GC-MS analysis, one dough sample of 20 g was collected per selected time point (0 h, 4 h, 8 h, 12 h, and 20 h), and three 2 g aliquots were extracted and analyzed in 20 mL vials equipped with septa.
2.2. Application of the Electronic Nose in Sourdough Quality Assessment for Artisan Bread Production
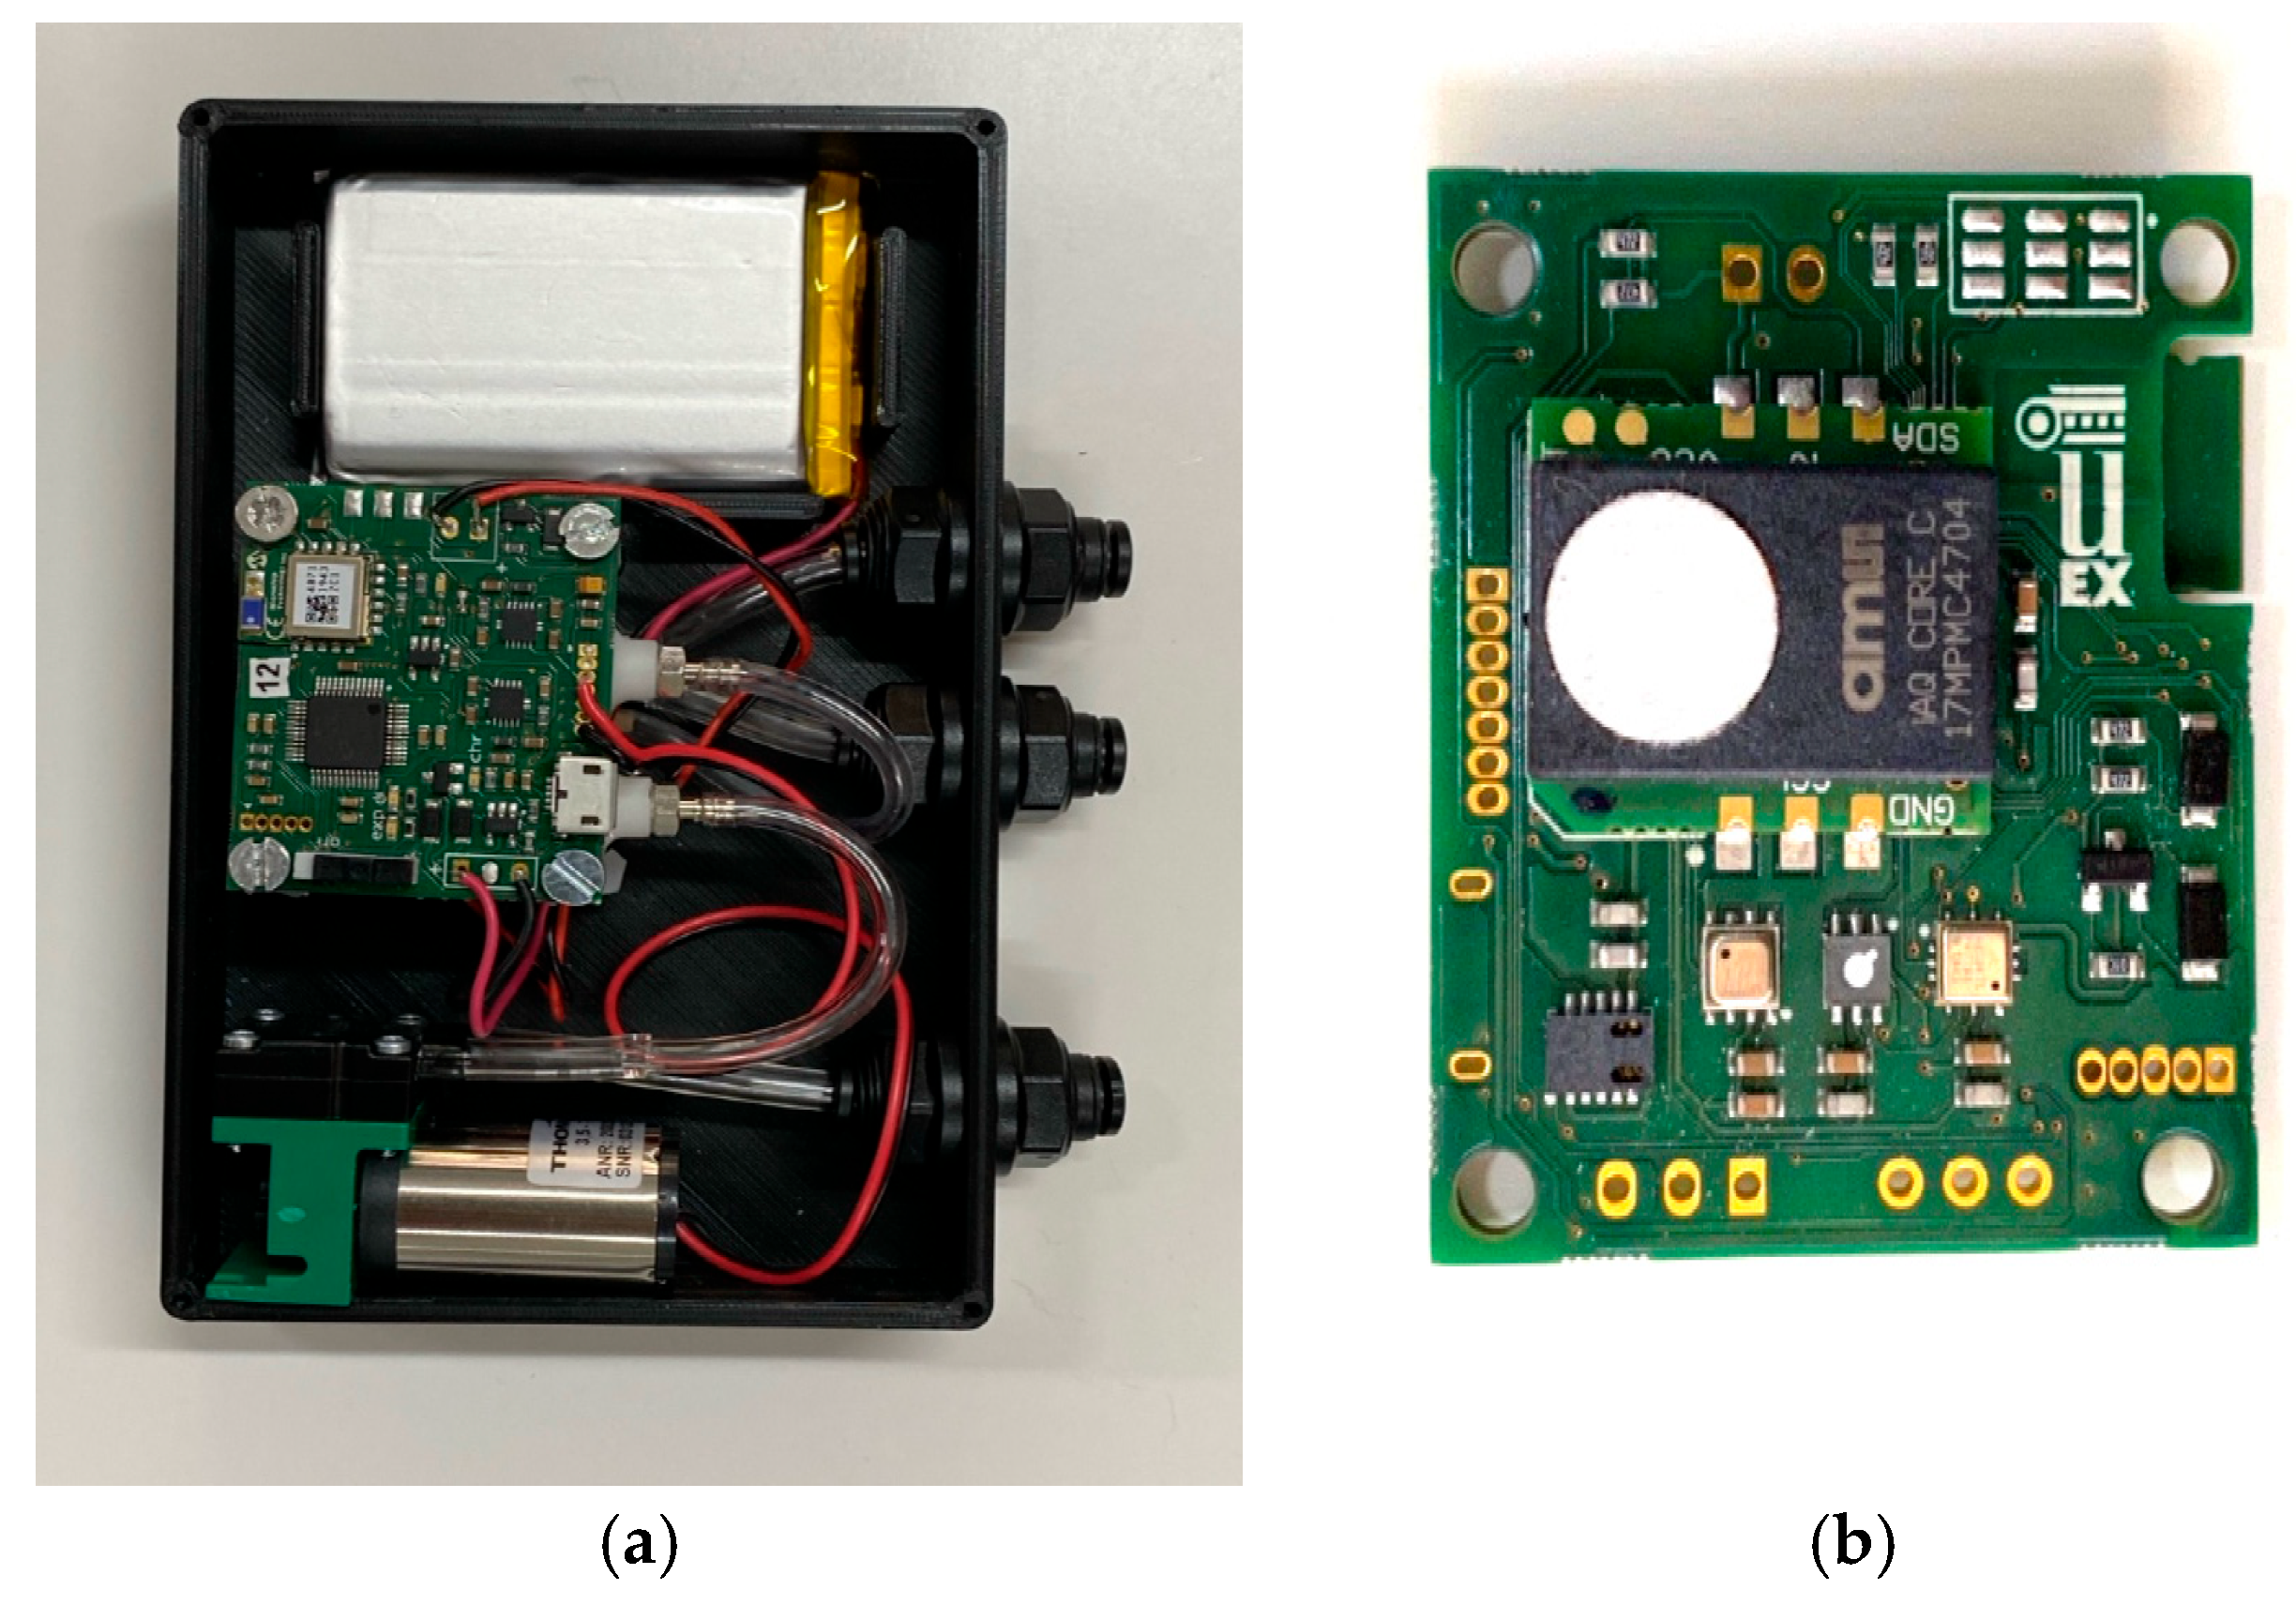
The analysis using the electronic nose provides an olfactory “fingerprint” that represents the volatile components released by the samples. This method stands out for its ability to identify and distinguish the different aromatic peculiarities which result from the complex interaction between the volatile substances present in the sample. The electronic nose is capable of detecting a wide range of compounds, including those responsible for the olfactory characteristics, without the need for direct human intervention, making it particularly useful for rapid and repeatable analyses. The E-nose device utilized in this study is a custom-developed prototype that communicates via Bluetooth through a dedicated mobile application. This portable device is designed to be compact and energy-efficient. It incorporates five metal–oxide–semiconductor (MOS) gas sensors, sourced from various manufacturers, to ensure broad selectivity. These sensors feature an integrated design that combines analog and digital electronics with a heated microplate and detection elements on a single chip. In addition to gas detection, the device is equipped with supplementary sensors to measure environmental parameters such as temperature, relative humidity, and atmospheric pressure [
18]. Raw E-nose data used in this analysis are available in
Supplementary File S1. A detailed description of the sensors used is provided in
Table 1.
The prototype features compact dimensions of 118 × 82 × 22.5 mm. The E-nose is powered by a rechargeable +3.7 VDC lithium battery and employs Bluetooth technology to communicate with a mobile application, enabling device control and configuration. The system includes a pump and a solenoid valve for sampling the headspace of the specimen.
The device’s total energy consumption is 684 mW, and the sensors have a response time of two seconds.
Figure 1 presents a photograph of the prototype alongside the electronic board of the E-nose.
Measurements performed by the E-nose are conducted in two main phases. The first is a desorption phase lasting 60 s, during which the sensors are exposed only to air. This phase serves as a reference point and allows for signal cleaning. The second is an adsorption phase, also lasting 60 s, where the sensors analyze the sample by drawing in its headspace. The transition between these two modes is managed by the solenoid valve, which is directly controlled by the microcontroller.
2.3. GC-MS Analysis Parameters for Cold-Fermented Sourdough
Volatile compounds from the bakery dough samples were analyzed using gas chromatography coupled with mass spectrometry (GC-MS). Analyses were performed on an Agilent 6850 gas chromatograph coupled to a 5975C single-quadrupole mass spectrometer (Agilent Technologies, Santa Clara, CA, USA), and equipped with a CombiPAL autosampler (CTC Analytics, Zwingen, Switzerland) for automated headspace sampling via solid-phase microextraction (SPME).
An amount of 2.0 g of dough was placed in 20 mL headspace glass vials, sealed with aluminum caps and PTFE/silicone septa (Agilent Technologies, Santa Clara, CA, USA). The extraction was carried out using SPME under agitated and heated conditions. A fiber coated with polydimethylsiloxane/divinylbenzene (PDMS/DVB, 65 µm, Supelco, Bellefonte, PA, USA) was exposed to the headspace following a pre-incubation of the sample at 37 °C for 5 min under continuous agitation at 250 rpm. Volatile compounds were extracted for 30 min and thermally desorbed in the GC injector for 10 min at 270 °C, under splitless mode.
The analytes were separated on an Agilent HP-5 column (30 m × 250 µm × 0.25 µm film thickness, 5% phenyl methyl siloxane) using helium as the carrier gas at a constant flow rate of 36 cm/s. The injector was maintained at 270 °C, with an injection pressure of 6.75 psi. The total flow was 14.8 mL/min, and the purge flow to the split vent was set at 10.8 mL/min starting at 1.00 min. The gas saver mode was activated at 20.0 mL/min after 2.00 min.
The GC oven program started at 35 °C and was held for 10 min, followed by a ramp of 7 °C/min up to 250 °C (held for 5 min), then a second ramp of 10 °C/min up to 270 °C, with a final maximum temperature of 325 °C. The total run time for the analysis was 45.71 min. Mass spectra were acquired in full scan mode (
m/
z 30–550), and compound identification was performed by comparison with the reference spectra from the NIST Mass Spectral Library (NIST/EPA/NIH, Gaithersburg, MD, USA). Therefore, all VOCs reported in this study are considered tentatively identified, as no analytical standards were used for confirmation. Peak areas were expressed as relative percentages, which reflect the composition of volatiles in each sample rather than their absolute concentration. This approach is appropriate for the purpose of this study, as the electronic nose responds to the global volatile profile based on the relative abundance of compounds in the headspace. Full peak area data and tentative compound identifications for all time points are available in
Supplementary File S2.
2.4. Microbial Groups and Their Role in Flavor Development
Each microbial group present in the dough plays a specific role in generating distinctive aromatic compounds, thereby shaping the final flavor profile [
5]. Understanding how these microbial communities evolve over time is essential for optimizing the production of desirable aromas and ensuring the quality of the final product [
19].
Dough fermentation is a complex process involving various microbial groups [
20], each of which contributes uniquely to the formation of volatile and aromatic compounds. Among the key microorganisms analyzed in this study are mesophilic aerobes, which thrive at moderate temperatures and participate in the production of volatile fatty acids and aldehydes, imparting freshness and a slight acidity to the dough [
21]. In contrast, under lower-temperature conditions, psychrophilic aerobes play a crucial role by producing alcohols and esters that contribute to subtle sweetness and fruity notes [
22].
Another significant group is the genus
Bacillus, known for synthesizing sulfur-containing compounds that enrich the aromatic profile with earthy and spicy nuances. Their identification was facilitated through the use of chromogenic agar, which enables the visible differentiation of species [
23]. Yeasts, on the other hand, are key contributors to fermentation, producing ethanol and esters that are fundamental to the development of fruity aromas and greater flavor complexity [
24]. To promote yeast growth while limiting bacterial competition, potato dextrose agar (PDA) enriched with chloramphenicol was employed.
Equally essential are
Lactobacillus spp., lactic acid bacteria that contribute to the production of lactic acid and other compounds responsible for the characteristic acidity and fermentation notes [
22]. Lastly, acetic acid bacteria play a crucial role in the synthesis of acetic acid, which imparts a sharp, sour, and slightly pungent flavor to the final product [
24].
The interaction among these different microbial groups defines the sensory properties of the dough, making fermentation a dynamic and multifaceted process in which each microbiological component plays a fundamental role in creating unique aromas and flavors.
To isolate and identify the aforementioned microbial groups, several culture media were used, selected based on the specific growth requirements of each group. Each medium was selected to favor the proliferation of a specific microbial group, ensuring accurate representation of microbial diversity.
- -
PCA (plate count agar) (CM0325B, Oxoid, Thermo Fisher Scientific, Madrid, Spain) was used to isolate mesophilic and psychrophilic aerobes, as it is ideal for estimating aerobic microorganism populations at moderate and low temperatures.
- -
HiCrome™ Bacillus Agar (92325, Millipore, Madrid, Spain) was used to differentiate Bacillus species by identifying specific colony colors.
- -
PDA (CM0139B, Oxoid, Thermo Fisher Scientific, Madrid, Spain), supplemented with chloramphenicol, was employed to selectively isolate yeasts by inhibiting bacterial growth.
- -
MRS (de Man, Rogosa, and Sharpe medium) (CM0361, Oxoid, Thermo Fisher Scientific, Madrid, Spain) was used to cultivate Lactobacillus spp., which require a nutrient-rich environment.
- -
ABS (agar for acetic acid bacteria) was used to promote the selective growth of acetic acid bacteria [
25].
The samples were analyzed at four time points (0, 4, 20, and 24 h) to monitor changes in microbial composition during fermentation. This temporal analysis enabled the observation of microbial population dynamics and their influence on the production of volatile and aromatic compounds. The microbial profiling of the samples allowed for the correlation between specific microbial population growth and the production of particular volatile compounds, which are essential for defining the dough’s aromatic profile.
2.5. Statistical Tools for Data Analysis and Interpretation
For the classification of the data obtained from the electronic nose, multivariate analysis methods were applied using PLS_Toolbox 9.5 (Eigenvector Research Inc., Wenatchee, WA, USA) within the MATLAB R2024b environment (The MathWorks Inc., Natick, MA, USA).
From the original data recorded by the E-nose sensors, characteristic values were derived based on the difference between the maximum value (Xmax), calculated as the average of the last five values during exposure to the reference gas (clean air), and the minimum value (Xmin), corresponding to the average of the last five values during exposure to the sample headspace. Prior to conducting more complex analyses, the collected data were autoscaled using MATLAB’s PLS_Toolbox by centering and normalizing each variable to unit standard deviation. This procedure enhances the comparability among sensors and ensures that all variables carry equal weight in subsequent analyses. These preprocessing strategies, combined with a controlled measurement environment (25 °C thermostatic bath, same-day analysis) and the use of clean-air baselines prior to each measurement, help minimize both short- and long-term sensor drift. Autoscaling further enhances robustness by normalizing signal magnitude differences across sensors, thus reducing the impact of drift and environmental variability on multivariate interpretation.
Although LDA and principal component analysis (PCA) are both dimensionality reduction techniques, LDA is a supervised method that maximizes class separation using predefined class labels, whereas PCA is an unsupervised method based solely on variance. The method applied in this study is LDA. LDA is a statistical and machine learning technique used to effectively separate two or more classes through a linear combination of predictor variables [
26]. Its primary objective is to reduce the dimensionality of the dataset while preserving relevant information, such as the T² statistic used to test the equality of means in a multidimensional context. LDA transforms the feature space by reducing it to a maximum of k − 1 dimensions, where k is the number of distinct classes. This technique calculates the mean of each class as a point in space and evaluates the dispersion of data around these means. It then defines a hyperplane—the linear discriminant—that maximizes the distance between class means while minimizing within-class variance. LDA assumes that the classes are normally distributed and share a common covariance matrix.
Subsequently, a supervised classification was performed using an artificial neural network discriminant analysis (ANNDA). A calibration set comprising 70% of the samples was used for model training and cross-validation, while the remaining 30% served as the test set to evaluate performance. The input layer included 16 neurons, corresponding to the 16 signal variables obtained from the five MOS gas sensors of the electronic nose. These included resistance, CO
2, ethanol, TVOCs, and other relevant signals, as detailed in
Table 1. In addition, the following metrics were used to study the ANNDA performance:
- -
TPR (true positive rate or recall): Measures the proportion of correctly identified samples in each class.
- -
Precision (P): Proportion of correctly classified positive samples over the total predicted as positive.
- -
F1 score: Harmonic mean of precision and recall, providing a balance between both metrics.
To evaluate significant differences in the chromatographic analyses among the different sourdough samples, a one-way analysis of variance (ANOVA) was applied. Tukey’s post hoc tests were performed to identify specific group pairs with statistically significant differences. Results were considered statistically significant when p < 0.05. All statistical analyses were conducted using IBM SPSS Statistics 20 (SPSS Inc., Chicago, IL, USA). Data were expressed as mean ± standard deviation.
3. Results and Discussion
3.1. Evaluating Sourdough Characteristics Using the Electronic Nose
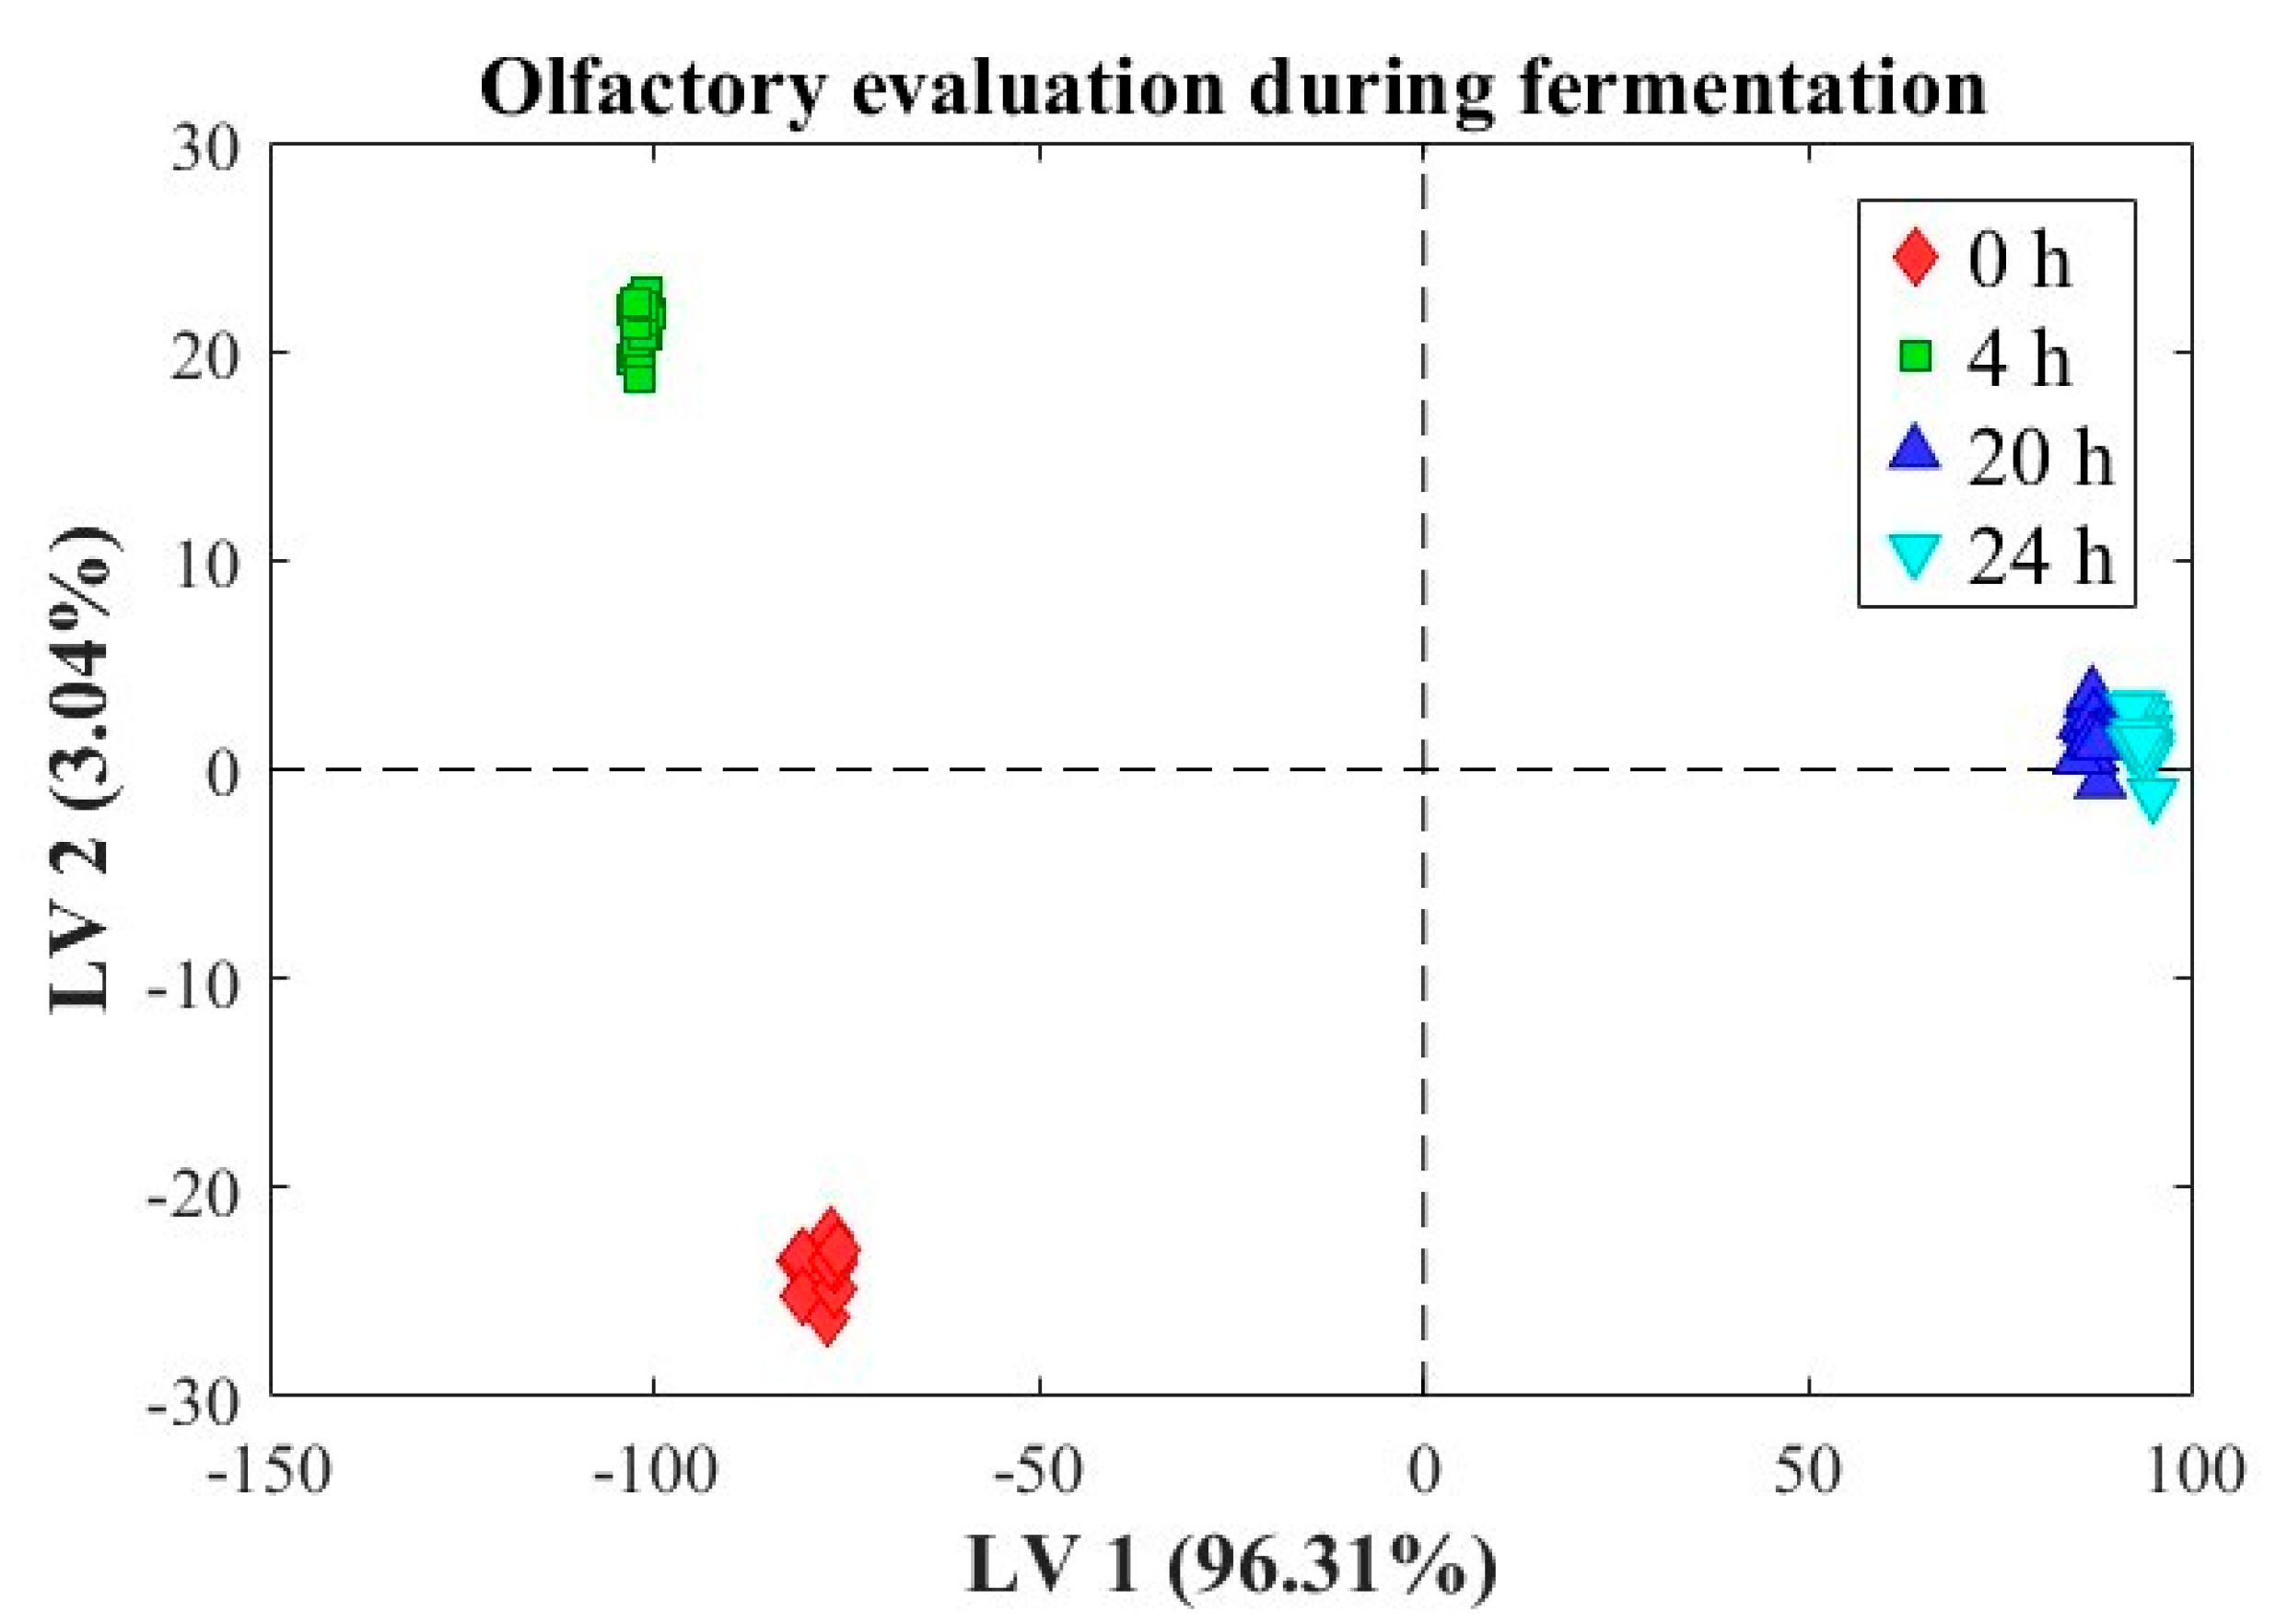
The presented graph (
Figure 2 illustrates a linear discriminant analysis (LDA) applied to the olfactory evolution of dough fermentation. The LDA model was constructed using only the 52 calibration samples. Its aim was to explore the class separation within the training set and to visualize the discriminative capacity of the E-nose data. This analysis does not evaluate generalization performance, which was instead assessed using an ANNDA model trained with the same calibration set and validated on an independent test set (20 measurements). The main axes represent the scores associated with the two most significant latent components: LV1 (96.31% of explained variance) on the horizontal axis and LV2 (3.04% of explained variance) on the vertical axis. These scores highlight the separation of sourdough at different fermentation times: 0 h (red diamonds), 4 h (green squares), 20 h (blue triangles), and 24 h (light blue inverted triangles).
The distribution of points along LV1 and LV2 reveals a clear temporal evolution of the olfactory profile, with a distinct separation between the initial observations (0 h) and subsequent ones (4, 20, and 24 h). The observations at 20 and 24 h exhibit greater similarity, clustering closely within the latent component space. The LDA analysis underscores a distinctive olfactory evolution during the flour fermentation process, characterized by a progressive temporal separation of observations along LV1. This pattern suggests that the primary axis of variation (LV1) captures the most significant changes in the olfactory profiles, accounting for nearly all the variance (96.31%). The 0 h dataset is clearly separated from the others, with negative scores on both LV1 and LV2. This indicates that the initial olfactory profiles are markedly distinct from those of subsequent stages, likely reflecting an absence or minimal levels of volatile metabolites derived from microbial activity, as the fermentation process has not yet begun. At 4 h, the cluster shifts significantly along LV1 and LV2 relative to the other analyzed clusters. This separation reflects early, substantial changes in olfactory compounds, associated with the initial production of primary metabolites, such as organic acids and alcohols, by active microbes. The observations at 20 and 24 h partially overlap, suggesting that the olfactory profiles at these stages are highly similar. This may indicate a stabilization in the production of volatile compounds characteristic of the fermentation process, such as esters and acids. The observed stability between these two stages suggests that the fermentative system has reached a metabolic plateau. The clear separation between different fermentation phases indicates that each time interval is characterized by a unique profile of volatile compounds. This result aligns with the microbiological evolution of the system, where the increasing population of lactic acid bacteria and yeasts contributes to the production of metabolites responsible for the olfactory characteristics. The stability observed in the later stages indicates a balance between the various microbial groups and their metabolites, a crucial aspect for determining the sensory quality of the final product. In this study, the optimal fermentation point was defined as the moment when the dough exhibited both stable olfactory profiles—based on E-nose signal clustering—and a plateau in microbial dynamics and acidification. This equilibrium state, observed from 20 h onwards, was considered indicative of the technological completion of fermentation.
The graph demonstrates that LDA is an effective tool for discriminating and monitoring olfactory evolution during flour fermentation. The results reveal a clear temporal progression of olfactory profiles, with a marked differentiation in the early stages and stabilization at later times. These findings can be leveraged to optimize the fermentation process and enhance control over the sensory characteristics of the final product.
Subsequently, an artificial neural network based on discriminant analysis (ANNDA) was trained using variables extracted from the electronic nose sensor system, with the goal of classifying the samples into four fermentation stages: 0 h, 4 h, 20 h, and 24 h. To assess the robustness of the classification model beyond the training dataset, the data were partitioned into 70% for calibration and 30% for independent validation. During the calibration phase, the model achieved perfect accuracy (100%), correctly classifying all 52 samples (13 per class). From the validation phase, using the remaining 30% of the data (5 samples per class), the confusion matrix shown in
Table 2 was obtained.
The model maintained a very high accuracy of 95%, with only one misclassified sample from class 20 h, which was unassigned rather than wrongly assigned to a different class. This minor decrease in performance may be attributed to a higher similarity between the volatile profile of class 20 h and that of class 24 h, as also observed in the LDA analysis. To provide a more complete evaluation of the ANNDA model, performance metrics including recall (TPR), precision (P), and F1 score were extracted from the confusion matrix for each fermentation stage and are summarized in
Table 3.
These values indicate excellent model performance across all classes, with slightly lower recall observed at the 20 h stage. The overall classification reliability is reflected by F1 scores close to or equal to 1.00.
These findings support the use of electronic nose systems in combination with artificial intelligence models as powerful tools for olfactory discrimination and automated control of fermentation processes. The results are consistent with recent studies demonstrating the effectiveness of this approach in complex food matrices such as cheese [
12] and beer [
27], reaffirming its applicability in both artisanal and industrial sourdough production. A schematic diagram of the E-nose measurement setup used for sampling and data acquisition is provided in
Supplementary File S3.
3.2. GC-MS: VOCs Detected in Sourdough Analyzed in Different Periods
An analysis of volatile organic compounds (VOCs) in the bread dough samples at different fermentation times was performed using gas chromatography–mass spectrometry (GC-MS). This analysis enabled the identification of a variety of compounds with different volatile profiles throughout the process, as shown in
Table 4.
Table 4 presents the evolution of volatile organic compounds (VOCs) at different fermentation times (0 h, 4 h, 8 h, 12 h, and 20 h), showing significant changes in their composition. This suggests that fermentation dynamically modulates the aromatic profile and consequently the sensory properties of the final product [
28].
In the initial fermentation phase (0 h–4 h), terpenic compounds such as 1R-α-pinene (22.95%), L-β-pinene (25.54%), β-pinene (25.78%), o-pymene (33.33%), limonene (28.27%), and γ-terpinene (31.46%) predominate, contributing herbal, resinous, and citrus notes. Simultaneously, there is a significant increase in ethanol (2.73% at 0 h to 4.53% at 4 h) and the appearance of acetic acid (2.17% at 4 h), indicating the activation of yeasts and lactic acid bacteria responsible for alcoholic and lactic fermentation [
8].
In the intermediate fermentation phase (8 h), the production of ethanol (6.32%), acetic acid (5.87%), and 1-heptanol (10.58%) intensifies, imparting a greater contribution of alcoholic and herbal notes. Additionally, compounds such as 1-octen-3-ol (4.93%) appear, imparting earthy and fungal notes, suggesting the enzymatic degradation of lipids [
27].
In the final fermentation phase (12–20 h), the concentration of acetic acid (12.75% at 12 h, 12.53% at 20 h) and cis-3-nonen-1-ol (11.27% at 12 h, 9.98% at 20 h) reach their highest values, intensifying the perception of acidic and herbal notes. Increases in fruity and sweet compounds such as ethyl acetate (1.19% at 0 h to 11.53% at 20 h) and isoamyl acetate (nd at 0 h to 33.33% at 20 h) are also notable, which aligns with the conversion of aldehydes into alcohols and esters in prolonged fermentations [
29].
Furthermore, the decrease in terpenic compounds such as β-pinene (25.78% at 0 h to nd at 20 h) and limonene (28.27% at 0 h to 1.58% at 20 h) confirms their progressive volatilization, affecting the perception of bread freshness [
28].
Relationship Among VOCs and Quality Traits
The evolution of VOCs during sourdough fermentation has a direct impact on the organoleptic characteristics of the product, influencing its aroma, flavor, and texture. Recent studies have shown that the generation of certain volatile compounds is directly related to the sensory quality of bread and its acceptance by consumers [
29].
Esters and alcohols, such as ethyl acetate (11.53% at 20 h) and isoamyl acetate (33.33% at 20 h), contribute fruity and sweet notes, enhancing the sensory perception of the bread [
30]. Additionally, the higher presence of ethanol (11.95% at 20 h) and 1-pentanol (6.08% at 20 h) adds complexity to the alcoholic profile, generating a sensation of aromatic maturation [
8].
On the other hand, the increase in acetic acid (12.53% at 20 h) and 1-octen-3-ol (6.83% at 20 h) imparts acidic and earthy notes, which are appreciated in artisanal breadmaking. However, excessive levels of these compounds could produce undesirable flavors [
28].
A progressive reduction in terpenes, such as limonene (28.27% at 0 h to 1.58% at 20 h) and β-pinene (25.78% at 0 h to nd at 20 h), suggests a loss of aromatic freshness during prolonged fermentation, potentially affecting the final product’s perception [
29].
From a technological perspective, modulating the fermentation time allows for optimizing VOC production to enhance the bread’s sensory quality. These findings suggest that balancing the production of fruity, herbal, and acidic compounds is key to achieving an appealing aromatic profile. Additionally, sensory studies are recommended to correlate these VOCs with consumer perception and define strategies to improve fermentation processes in the baking industry [
29].
A limitation of this study is the lack of absolute quantification, which prevents direct comparison with human odor thresholds. Future work should include quantification with internal standards and sensory validation to confirm the perceptual impact of individual VOCs.
3.3. Microbial Diversity and Its Role in Sourdough Fermentation Dynamics
The microbial evolution of sourdough during the fermentation process at 5 °C is illustrated in
Figure 3 highlighting the temporal variations of various microbial groups, expressed in log10 colony-forming units per gram (cfu/g), along with the changes in the system’s pH. The monitored groups include total mesophilic aerobes (light blue line), yeasts (light green line),
Lactobacillus spp. (yellow line), total psychrophilic aerobes (red line), and acetic acid bacteria (purple line), with pH represented on the right-hand axis by the dark blue line. Measurements were conducted at four distinct time points: at the beginning of fermentation (0 h), after 4 h, after 20 h, and beyond 24 h.
Regarding total mesophilic aerobes, the initial population (approximately 9 log10 cfu/g) progressively decreases, dropping below 6 log10 cfu/g after 24 h. This decline suggests that these microorganisms compete with other groups and that the conditions for their growth become less favorable during low-temperature fermentation. In contrast, Lactobacillus spp. exhibit significant growth, increasing from approximately 8 log10 cfu/g to over 9 log10 cfu/g within 20 h, before stabilizing, indicating that these bacteria play a central role in the later stages of fermentation. The yeast population grows slowly throughout the process, increasing from approximately 6 log10 cfu/g to about 7.5 log10 cfu/g beyond 24 h, adapting to the fermentation conditions and contributing to the production of volatile metabolites. Total psychrophilic aerobes, on the other hand, maintain a stable population of approximately 7 log10 cfu/g throughout the fermentation period, suggesting they are not significantly affected by environmental changes. Acetic acid bacteria, although initially present in small amounts (around 3 log10 cfu/g), show a slight growth during the process, reaching about 4 log10 cfu/g after more than 24 h. The system pH decreases significantly, from approximately 5.8 to 3.8 after 24 h, a reduction associated with the production of organic acids, such as lactic and acetic acid, by the predominant microorganisms, particularly Lactobacillus spp. and acetic acid bacteria. These findings highlight the competitive dynamics among the various microbial groups and their adaptation to low-temperature fermentation conditions. The increases in the populations of Lactobacillus spp. and yeasts reflect their well-known role in the production of acidic and aromatic compounds in sourdough. The decrease in mesophilic aerobes can be attributed to system acidification, which limits the growth of less acid-tolerant microorganisms. Furthermore, the stability of the psychrophilic aerobic population suggests that the favorable temperature does not generate significant competition with other groups. Finally, the increase in yeast and acetic acid bacterial populations underscores the complementarity of metabolic processes in defining the final characteristics of the fermented product. These results confirm that fermentation at 5 °C promotes a balanced development of lactic acid bacteria and yeasts, contributing to pH control, a critical factor for the quality and safety of sourdough.
4. Conclusions
This study demonstrated the capability of the electronic nose (E-nose) to effectively and efficiently monitor the olfactory evolution of bread dough across different fermentation phases. Each phase exhibited a distinct volatile profile that coincided with measurable changes in microbial group counts, overall volatile composition, and pH levels. While these temporal associations are evident, further studies are needed to confirm the specific microbial contributions to VOC production. Notably, the increase in concentrations of yeasts and lactic acid bacteria appeared to be temporally associated with the production of key volatile compounds such as acetic acid and ethanol, which are crucial for the sensory quality of bread.
Integrating both traditional and advanced analytical techniques, including microbiological assays and SPME-GC-MS, facilitated a deeper understanding of the impact of microbial interactions on volatile compound profiles. It should be noted that the identification of VOCs was tentative and based solely on spectral comparison with the NIST library, without confirmation by analytical standards.
The findings suggest that the electronic nose provides a rapid, non-invasive method for quality assessment and offers substantial potential for enhancing quality control in artisanal bread production by ensuring process consistency and fermentation optimization.
Although parallel trends were observed between microbial groups and VOC evolution, no direct statistical correlations were established in this study. Future work may include targeted correlation analyses to better understand microbe–aroma relationships.
Employing a multidisciplinary approach, this study highlights the electronic nose as a valuable tool for the bakery industry to monitor real-time microbiota changes that directly affect the aromatic profiles, and thereby the sensory quality of bread prior to baking. Consequently, this device proves to be a promising asset for the standardization and enhancement of fermentation processes, laying a robust foundation for implementing more effective and efficient quality controls in the food industry.


 ,
, 


