Review

Current Opportunities and Trends in the Gas Sensor Market: A Focus on e-Noses and Their Applications in Food Industry

1
Department of Mathematics and Physics, Università Cattolica del Sacro Cuore, Via della Garzetta 48, 25133 Brescia, Italy
2
Interdisciplinary Laboratories for Advances Materials Physics (I-Lamp), Via della Garzetta 48, 25133 Brescia, Italy
3
School of Economics, Università Cattolica del Sacro Cuore, Largo A. Gemelli 1, 20123 Milano, Italy
4
Adesso Group, Maslak, Ahi Evran Cd. Olive Plaza D:11, 34398 Istanbul, Turkey
*
Authors to whom correspondence should be addressed.
Chemosensors 2025, 13(5), 181; https://doi.org/10.3390/chemosensors13050181
Submission received: 13 March 2025 / Revised: 30 April 2025 / Accepted: 1 May 2025 / Published: 12 May 2025

Abstract

:
Electronic noses (e-noses) are devices developed to recognize/classify odors and used in many fields, matching the current societal needs and concerns, such as food integrity and quality control, environmental monitoring, medical diagnostics, safety, and security in urban and industrial settlements. In this study, we review the application fields of e-noses based on a market analysis of currently available devices. A total of 44 companies active up to 2024, as well as 265 products, have been identified by considering the web pages of companies that feature e-noses among their products. These devices have been classified according to (i) the sensing mechanisms underlying the device performances and (ii) the application fields. The most diffused sensing devices/systems are chemiresistors (12.8%), electrochemical sensors (13.0%), catalytic beads (12.4%), and those based on optical detection techniques (16.0%). Commercial e-noses find large application in the industrial (21.0%) and chemical and petrochemical (21.0%) fields. A focus is made on the food and beverage application field, which is still a minor part of the overall share (6.0%) but is rapidly increasing and plays a relevant role in future applications where safety, sustainability, and quality issues are strictly intertwined. From this study, a rather complex picture emerges, and a proper taxonomy is expected to correctly classify the different kinds of e-noses.

1. Introduction

The biological functionality of Nature and living species has inspired many technological innovations. The biological olfactory system of living creatures has enabled them to be aware of dangers and to identify and classify food. In technology, transferring the features of biological olfactory systems to an electronic device is a long-standing and challenging issue, currently raising a great interdisciplinary research interest. An electronic nose (e-nose) is a device that provides real-time measurement of odor concentrations from a source and recognizes and detects odors using a sensor array without the need to separate it into its constituent components [1]. In particular, a sensing material is in charge of transducing odors into data that are analyzed via a pattern recognition system [2]. Although the first studies for the measurement of odors began in the 1920s [3], it was in the 1980s [1] that the experiments were carried out using the first gas sensor array. Over the years, advances in odor sensor technology, biochemistry, electronics, and artificial intelligence (AI) have contributed to the development of devices that can measure and discriminate volatile organic compounds or specific target gas molecules. Nowadays, a large variety of technologies for the detection of odors is available on the market [1,4]. These exploit different sensor types such as chemiresistors, conductive polymers, optical sensors, surface acoustic wave devices, and electrochemical gas sensors.
The e-nose market is an emergent and rapidly growing field, yet it is still quite fragmented into many highly competitive companies without dominant players. This aspect testifies to the enormous potential of e-nose technology for future research efforts and business investments. Currently, North America reports the largest market with the highest growth rate, followed by Europe, Asia, and Oceania. On a worldwide scale, the e-nose market promises to show fast growth in the next years [5]. The main players in this rapid development are the advances in AI and machine learning (ML), which tremendously boost e-nose performances, along with the discovery of novel sensing materials.
The initial studies on the measurement of odors were based on the work by Zwaardemaker and Hogewind [3] in 1920, who measured the conductivity of a fine spray of water, discovering that its conductivity changed when volatile substances were added to it. In 1954, Hartman [6] devised the first device for measuring tastes, defining flavor as the combined action of the senses of smell and taste experienced when chewing food. In 1961, Moncrieff [7] reported studies on different coating materials such as polyvinyl chloride and vegetable oils, which can provide different data to distinguish between simple and complex flavors. In 1965, Buck [8] pointed out that conductivity modulation can be used to distinguish flavors in specific samples, while Dravnieks and Trotter [9] used modulation of the contact potential to track flavors. All these studies were the first recorded approaches to flavor assessment. Later, e-noses combined with chemometrics analysis became reference tools to provide a non-human analysis of flavor and fragrances [10]. In 1982, Persaud and Dodd [11] and Ikegami and Kaneyasu [12] mentioned, for the first time, an e-nose in association with a sensor array to classify aromas. In 1988, Gardner and Bartlett [13] described the e-nose as “an instrument which comprises an array of electronic chemical sensors with partial specificity and appropriate pattern recognition system, capable of recognizing simple or complex odors”.
Since the beginning of the 1990s, the demand for odor sensor technology has increased significantly, as evidenced by the growing number of studies and articles on this subject. Figure 1 and Figure 2 provide an overview of the fast growth of the e-nose research field in academic publishing. In particular, Figure 1 shows the increasing weight of e-nose application in food sensing and classification (inset of Figure 1, nearly 2× in the last ten years), while Figure 2 displays the increasing weight (3×) of machine learning as a tool for the development of sensing systems (inset of Figure 2) in the last ten years.
Currently, e-noses are widely used in many fields such as food and beverage, agriculture, farming, medical, air monitoring, military, and defense due to their high speed, compact structure, and low cost, which allows them to provide reliable solutions for gas monitoring [14,15]. From the point of view of research, e-noses are at the crossroad of materials science [15,16,17,18,19,20,21,22,23,24], device physics and engineering [25,26,27,28,29,30,31,32,33,34], and AI applications [35,36,37,38,39,40,41,42]. The synergy among these application fields, along with the use of IOT strategies, is, on the one hand, expected to further boost the diffusion of e-noses and, in general, of e-sensing [19], and, on the other hand, to disclose novel approaches to olfactory perception [43]. Over the years, commercially available e-noses have been listed in tables that appeared in various scientific papers, usually reviews [1,14,44,45,46], which sometimes focused on a specific application field, such as, e.g., environment [47,48,49], medicine [50], and food [51]. To move forward in understanding the state-of-the-art and trends, we have conducted market research on e-nose manufacturers around the world. We report the outcome in this review to draw a picture of the kind of e-noses available on the market, to obtain a landscape of the manufacturers in gas sensing, and to disclose future scenarios in application fields. One of the results of this research is a database of the main e-nose manufacturers, their products, the types of sensors employed in each device, and the application areas where the manufacturers operate. We have used the company websites as the main source of information.
These data are reported in specific tables along the manuscript (for food applications) and in the Supplementary Information File (for all other application fields).
The difference between the present and past reviews on e-noses (recently discussed in Ref. [52], which analyzes quite a large set of reviews on e-noses from 1994 to 2024) stems from the fact that we gathered info directly from the market, looking for commercially available devices, rather than from literature. Current scientific literature is used to comment on the results we obtained from our market survey to add possible perspectives and application trends or to detail the principles behind e-nose technology.
Our market research has reported a great number of commercially available e-noses. These devices differ in the type of sensor arrays and the data analysis methods, which are optimized for specific applications. E-noses operate not only in the classification of odors, but also in the detection of volatile compounds that cannot be recognized by the human nose. As shown in the following, the applications of commercial e-noses range from healthcare to food and beverage, defense, industry, and environmental monitoring applications.
A consequence of the diversification in the use of gas sensing devices is that the line between traditional systems for gas analysis and actual e-nose devices has become quite loose in the market communication. While some manufacturers refer to their devices as e-noses, other companies avoid this definition and refer to their products as gas detectors or gas monitoring devices. Despite the different nomenclature, these latter products may be considered e-noses since they contain a sensor array for the detection and classification of more than one type of gas.
We have classified each type of gas sensor and sensing technology available on the market and organized them, with the help of bar charts, showing the distribution of the technologies and their application areas.
The present review is organized as follows: Section 2 describes the components and working mechanism of an e-nose and details each type of e-nose technology in terms of its structure, characteristics, and distribution on the market. Section 3 focuses on the ML paradigms that are, nowadays, implemented in e-nose devices for the analysis of gas compositions. Section 4 presents an overview of the application areas of e-noses. We first detail their use in the food and beverage industry that resulted from our market research. To achieve this goal, we report on the worldwide manufacturers and relevant products available on the market and identify the type of sensor and specific applications for each product. Following this focus, we briefly list and analyze e-noses in the other application fields. This allows us to place food applications properly within the overall landscape. Finally, Section 5 summarizes the outcome of our review study and the findings of the market research conducted.

2. E-Noses: Working Principle and Sensors Classification

Being aware of possible oversimplifications and misconceptions [53], we assume that the operation of an e-nose shares many similarities with the physiology of biological noses in terms of the tasks performed and the working mechanism, as schematized in Figure 3. An e-nose typically consists of three parts: a multi-sensor array, a pre-processing unit, and a pattern recognition system. Accordingly, its working mechanism consists of three steps:
  • The perception of odor particles, such as volatile organic compounds (VOCs), by the sensor array corresponds to the olfactory receptors in the biological olfactory system;
  • The processing of the odor signal occurs in the olfactory bulbs [54];
  • The delivery of the information for odor identification occurs through trained ML algorithms as an analogy to what happens in the brain cortex, matching with the response patterns stored in the brain memory [55].
The fundamental difference between an electronic and a biological node lies in the fact that the latter hosts hundreds of olfactory receptors, whereas the former must perform using a much smaller number of sensors [56,57]. The block diagram in Figure 3 details the hardware and software units of an e-nose. The former consists of the gas sensor array, while the latter comprises both the signal-processing component and the pattern recognition system, where the data are prepared and classified based on ML algorithms.

Sensors in e-Noses

The performances of an e-nose mainly depend on the following parameters [58]:
  • Sensitivity: the intensity of the sensor’s response after exposure to a target gas. This is usually defined as a relative change of the signals registered before and during the exposure to gas analytes;
  • Response time: the time interval the sensor array takes to measure an analyte. It is usually defined as the time required for the sensor signal to increase from 0% to 90% of the total response;
  • Recovery time: the time required by the sensor signal to decrease to 10% of the maximum response;
  • Selectivity: the ability to discern the concentration of a substance in the presence of other interfering substances;
  • Resolution: the minimum significant variation of the signal;
  • Drift: the tendency of the output signal to monotonically vary due to a change of sensor material properties over the measurement time;
  • Repeatability: the ability to provide a stable signal in repeated measurements;
  • Detection Limit or Limit of Detection (LOD): the lowest analyte concentration detected by the sensor, i.e., the lowest concentration of an analyte that can be reliably distinguished from background noise;
  • Limit of Quantification (LOQ): the lowest concentration that can be measured with acceptable precision and accuracy (see, e.g., Ref. [59]);
  • Operating Temperature: the temperature range for proper gas analysis [60,61].
Depending on the field of application, one or the other parameter might be most crucial in determining the efficiency of the e-nose device. For instance, industrial and safety/security applications mostly require quick response time, while biomedical and environmental applications require high (e.g., sub ppm) sensitivity and a good capability of discrimination in complex mixtures of volatiles. Wearable devices need miniaturization and low-power consumption.
Gas sensor devices exploit a variety of technologies that determine the best application fields of each e-nose type. In Figure 4, we report on the distribution of sensor types used in e-noses as obtained in our market research. We point out that not all devices strictly belong to the e-nose category when used alone. However, even those not properly defined as e-noses rely on techniques that fulfill the functionality of an e-nose device when they are combined with pattern recognition algorithms.
In the following, we first present the gas sensors featured in e-noses, consistent with the definition of Ref. [13]. These represent approximately 60% of the bar chart and include chemiresistors, based on either metal oxide semiconductor (MOS) or conducting polymer (CP), electrochemical (EC) gas sensors, catalytic bead (CB) sensors, quartz crystal microbalance (QCM) sensors, acoustic wave sensors, photoionization detector (PID) sensors, and optical sensors (Opt). The working principle of each sensor type is sketched in Figure 5, while we summarize the specific advantages and disadvantages together with the major application fields in Table S1 of the Supplementary Information File. Then, we extend the description to other technologies employed for gas sensing purposes, i.e., UV and IR spectroscopy, Non-Dispersive Infrared (NDIR) and Fourier-Transform Infrared (FTIR) spectroscopy, gas chromatography (GC) and mass spectrometry (GC/MS), ion mobility spectrometry (IMS), and flame ionization detector (FID). Finally, we briefly list types of sensors and sensing technologies gathered under the categories “other” and “unknown” (i.e., not specified).
Chemiresistors are among the most diffuse sensing layers. They include metal-oxide semiconductors (MOS), nanostructured carbon, and transition metal dichalcogenides (TMDs). They consist of an active layer connected through electrodes to a constant voltage source. Under normal conditions, current flows in the circuit and an initial value of the current, I0, are measured. In the presence of the target gas, molecule chemisorption takes place at the active layer surface. This causes a variation of the conductivity of the system; thus, a new current value, Igas [62]. The variation of current intensity, Igas/I0, or resistance, Rgas/R0, during the exposure usually defines the sensor response. Regarding the sensing mechanism, MOS can be classified as p-type and n-type chemiresistors depending on the oxide doping and, thus, on the type of majority charge carriers. In n-type chemiresistors (SnO2, ZnO, etc. [4]), oxidizing gases (e.g., NO2) cause a decrease in the number of electrons and, thus, in the current intensity. Conversely, reducing gases inject electrons into the system, causing a current increase. In p-type chemiresistors, the majority carriers are holes, leading to the opposite sensing behavior [63].
Thanks to their sensitivity to a large number of gases, MOS are among the most widely used sensor types in e-nose devices [64]. In particular, they are often preferred in the field of quality control of food and beverage production, specifically in the detection of contamination and spoilage, as well as the determination of the geographic origin and aging [65]. Beyond MOS, several other materials, such as, e.g., carbon nanotubes, graphene, and 2D transition metal dichalcogenides [23,66], are currently under intense investigation in view of their implementation as active layers [15]. For instance, the commercial e-nose based on nanostructured carbon chemiresistors has been recently placed on the market by SmartNanotubes [67]. While tests reported remarkable sub-ppm detection limit and a discrete range of linear response, the signal reproducibility and tolerance against poisoning over time are still major limitations [68]. Thus, commercial e-noses based on chemiresistors are still mostly based on metal oxides due to their best performance in terms of signal stability, sensitivity (up to the sub-ppm –part per million- level), and short response and recovery times. Moreover, their compact size, simple fabrication process, and ease of use are further advantages pushing towards the choice of MOS. On the other hand, they consume a large amount of power, are sensitive to humidity, and the response time increases significantly at low temperatures due to much slower oxide surface reactivity. In addition, they offer weak selectivity because they are simultaneously sensitive to reducing and oxidizing gases [2].
Conducting polymers (CP) represent another class of sensing materials employed in chemiresistors. They offer a manifold of electrical measurement schemes, including the simple two-contact scheme typical of chemiresistors, and, therefore, are often classified among chemiresistors [69,70]. Sensors based on CP are the first type of sensors employed in commercial e-nose systems, broadly used nowadays in many fields such as, e.g., the medical, pharmaceutical, and food and beverage industries, as well as environmental monitoring.
Though the most appropriate definition for this class of materials would be π-conjugated polymers, CP still appears in the description of commercially available products (see, e.g., the Cyranose 320 by Sensigent, which is a portable handheld e-nose consisting of 32 individual conducting polymer sensors blended with carbon black composite). In addition, recent papers ([71,72]) still adopt this definition. The electrical conductivity of conjugated polymers can be tuned via chemical doping. For example, conducting polymers have modifiable backbones, end groups, and side chains, which enable tailoring their electrical properties and surface chemistry and, therefore, the response to targeted gas/vapors. Furthermore, conducting polymers can be hybridized with conducting fillers to further improve response intensity and dynamics at room temperature. The working mechanism of CP–based chemiresistors sensors is the interaction of the CP-sensitive material with VOCs, leading to a change in the polymer conductivity [2,70,73]. Their primary advantage is the ability to operate at room temperature, i.e., without the need for heating, which simplifies their use and reduces power consumption. Moreover, they are sensitive to a wide range of gases and resistant to sensor poisoning, and they have short response times and low costs [74]. The disadvantages are signal drift due to the oxidation of polymers over time and high sensitivity to humidity and temperature [75]. Recent developments on CP sensing layers can be mainly ascribed to printable electronics approaches, as discussed in Section 6.2 of Ref. [76], which enable solution processing of sensing layers and make them particularly suited for developing fully printed gas sensors on virtually any type of substrate.
E-noses based on electrochemical (EC) gas sensors are used in security systems and industrial and medical fields [1]. Their working principle is based on the current or voltage change upon gas exposure [77]. This change results from the electrochemical oxidation or reduction of VOCs at the surface of a sensing electrode [78,79]. EC gas sensors excel in low power consumption, robustness, high-range operation temperatures, sensitivity to diverse gases, good resolution, and resistance against poisoning by spurious gases. However, their large size and very low sensitivity to gases with low molecular weight, particularly the aromatic hydrocarbons, restrict their range of application [2]. Even so, EC sensors report a large share of approximately 15% of the market distribution.
Catalytic bead (CB) sensors are implemented in e-noses for environmental and chemical monitoring, particularly for flammable gas detection. Their operation is based on the oxidation of combustible gases on the catalytic element. They consist of two elements: a detector, which contains a catalytic material and is, thus, susceptible to combustible gases, and a compensator, which is the inactive component. The two parts connect to form a Wheatstone bridge circuit that generates signals proportional to gas concentration. When flammable gases are present, detector resistance rises, causing an imbalance in the circuit that generates the output voltage signal [1,80]. The main benefits of this sensor type are fast response and recovery times, high specificity in detecting combustible gases, small size, and inexpensive operating costs. However, signal drift and low selectivity are their drawbacks [1,2]. Finally, CB sensors are only sensitive to oxygen-containing compounds. CB sensors report a high share on the market (13%) and are mostly employed in refineries, chemical plants, and mines for the detection of toxic and flammable gases.
Quartz crystal microbalance (QCM) sensors are the simplest type of piezoelectric acoustic wave device [1]. This sensor type is one of the commonly used in e-noses applied to security systems, environmental monitoring, and pharmaceutical and food industries. The sensing principle of a QCM relies on the piezoelectric effect of the quartz crystal [45,81]. Acting as a mass transducer, the QCM detects gases through the shift of its resonant frequency caused by the change in the mass of sensitive materials after gas absorption or desorption. Remarkably, this sensor can also be used in liquid or gas environments. The major advantages are the high sensitivity, fast response time, and low detection limits. Moreover, QCM sensors offer stability, portability, and reduced cost. On the other hand, this sensor type has severe disadvantages, which include its difficult implementation in e-nose devices, complex circuitry, poor signal-to-noise ratio, and high sensitivity to temperature and humidity. On the market, QCM has a very small share of 0.25%, mainly represented by Electronic Sensor Technology [82]. Such limited use of QCM sensors is likely due to the restricted applicability to rather simple gas mixtures because one needs to assume that the crystal surface roughness and viscosity remain constant during the interaction with the gas [83].
Acoustic wave sensors operate on the same principle as QCM devices. Specifically, a piezoelectric layer present in the sensor produces the acoustic wave, which can be of many kinds, such as, e.g., surface acoustic wave (SAW), bulk acoustic wave (BAW), tube acoustic wave device, and, more recently, flexural plate wave (FPW) [84]. In e-nose devices, SAW sensors are the most commonly used and cover 1% of the market distribution with products by Karlsruher Institut für Technologie (KIT) [85] and Electronic Sensor Technology [82]. Acoustic wave sensors are very attractive in environmental monitoring, the food and beverage industry, chemical detection, and the automotive industry because of their high sensitivity and fast response time. In addition to the ability to react to almost all types of gases, they have a small size and low cost. However, they have high sensitivity to temperature and a poor signal-to-noise ratio [48].
Photoionization detectors (PID) are well-known devices able to detect the presence of VOCs even at very low concentrations [86,87]. The working principle is based on the interaction of ultraviolet (UV) light with organic compounds with an ionization potential less than or equal to the energy of UV radiation [44]. As a result, photoionization of the VOC occurs, and the airborne splits into positive and negative ions. Thus, the PID measures the photoemitted charge carriers of the ionized gas as a function of the VOC concentration [88]. We point out that PID sensors alone are not e-noses in the strictest sense because, as stated by Wilson and Baietto in Ref. [1], “they do not provide a collective data output from a sensor array and are designed to detect and identify individual components of a gas mixture.” Even so, PID sensors are commercially available, combined with other detectors, for gas sensing in environmental monitoring, industrial and transportation systems, public security, and the analysis of chemical and physical composition of soil [45].
The use of optical sensors for chemical sensing is common in environmental monitoring and biomedical applications. Optical sensors exploit properties such as absorbance, reflection, fluorescence, and refractive index to detect and quantify the presence of a gas analyte. Among them, fluorescence measurement is the most common method [89], followed by colorimetric measurements [90,91]. Colorimetric sensors are the simplest optical sensors. They consist of chemically sensitive, multicolored dyes that change color as a result of their interaction with the analyte gases. The advantages of colorimetric sensors are the ease of manufacturing, low cost, simple operation, high portability, and short response time [92]. Fluorescent sensors are more sensitive than colorimetric sensors and detect light emissions from the gas analyte at lower wavelengths [93]. These sensors can be coupled with optical fibers, which facilitate the signal transfer and minimize the signal loss [91]. The general benefits of optical sensors include the ability to discern compounds in gas mixtures and the high sensitivity. Moreover, optical sensors have a lightweight, quick response and high tolerance to electromagnetic interference. On the other hand, their complex sensor-array system makes their implementation hard, the use of optics and electrical components limits their portability, and their sensitivity to stray light interference affects the signal quality [1].
While, so far, single sensors used in e-nose sensor arrays have been discussed, in the following, analytical systems that can be driven as e-noses are introduced. Indeed, the possibility to extract a suitable number of features from a single spectrum (e.g., optical, MS-GC) can be exploited to proceed with ML-based data analysis, where each spectrum is the outcome of an exposure to a gas mixture and each point of the spectrum can be regarded as a feature from a single sensor in an e-nose sensor array.
In this sensor class, we collect systems based on spectrometers coupled to different light sources.
Ultraviolet (UV) absorption spectrophotometry technology is used in the detection of gases. The working principle exploits the ability of gas molecules to absorb light at specific wavelengths. Following the interaction with the analyte, the light intensity decrease is recorded and analyzed as a function of wavelength. This method provides high sensitivity and selectivity, and it is a very common analytical technique in biomedical and analytical chemistry for the measurement of gas concentrations [94]. The devices that utilize this technology can be considered as e-noses in combination with a pattern recognition algorithm. Commercially available devices on the market are UVA 17 CD m and the UVA 17 HW Series from Dr. Födisch Umweltmesstechnik AG [95].
Infrared (IR) spectroscopy measures the wavelength-resolved light absorption by molecules in a gas mixture. The technique relies on the fact that in a molecule, absorption of IR light occurs at specific wavelengths that are resonant with vibrational levels characteristic of the molecule. By analyzing the absorption peaks of the recorded spectrum, the molecule is identified. IR spectroscopy is broadly used in the detection of hazardous gases, refrigerant and ammonia leaks, hydrocarbons, and combustible gases in high-temperature hazardous area locations. MSA Safety is the main manufacturer of IR spectroscopy-based sensing devices for industrial and safety applications [96].
UV/IR spectroscopy-based sensors combine UV and IR spectroscopy in a single apparatus, along with advanced signal processing algorithms for pattern recognition. They allow flame detection for a variety of gases, flammable liquids, and even volatile solids [97]. Therefore, they are generally used in chemical storage, oil and gas pipelines, petrochemical facilities and refineries, and gas engine rooms. However, in this research, this sensing method has a small share with 1.51%. Zero Two Series from MSA Safety [96] utilizes UV/IR for safety monitoring.
Non-dispersive IR (NDIR) technology is mostly used to detect carbon oxides (CO, CO2). The working principle is based on the absorption of IR light at specific wavelengths by the gas component that travels through the sampling chamber. The absorbed light intensity is used to measure the relevant gas concentration. Specifically, an optical filter placed in front of the detector absorbs every wavelength of light except the one absorbed by the oxide molecules, which hits the IR detector. NDIR performs in gas emission monitoring, e.g., for the detection of hazardous gases in oil and gas refineries and chemical storage, in water treatment, and in chemical plants. In our market research, we have identified a few devices by Honeywell International Inc. [98] and International Gas Detectors Ltd. [99] that utilize NDIR technology.
Fourier-transform infrared (FTIR) spectroscopy uses an interferometer to detect the IR spectrum without the need for dispersive media. As such, it records the absorbed light simultaneously at all wavelengths, which allows rapid analysis of the target gas. The detection of narcotics, precursors, cutting agents and common chemicals, and various environmental monitoring applications use FTIR spectroscopy technology. IR, NDIR, and FTIR occupy 17% of the market distribution pie chart. Thermo Fisher Scientific Inc. [100] and Honeywell International Inc. [98] produce sensing devices equipped with FTIR technology for chemical detection in industrial processes.
Gas chromatography (GC) is an analytical technique used to separate gas molecules in an organic sample mixture and analyze their concentration. The technique exploits a carrier gas to transport VOCs through the GC system up to an analytical sector in charge of the gas separation. Then, gas is analyzed, and a chromatogram of the sample composition is produced. GC successfully performs for VOCs with molecular weight lower than 1250 Da and a good thermal stability of their structure in order not to degrade during the GC analysis [101]. GC is frequently applied in the analysis of fire remnants, drugs, and toxins in blood and other body fluids, and in driver alcohol detection systems [102]. The main producers of GC-based gas sensors are Thermo Fisher Scientific Inc. [100], Shimadzu [103], and Agilent [104].
Mass spectrometry (MS) is based on the ionization of compounds in a mixture and their qualitative and quantitative analysis by measurement of their mass-to-charge ratio (m/z) [105]. It is widely used in analytical laboratories for the study of the physical, chemical, or biological properties of both inorganic and organic compounds. For gas sensing purposes, MS finds application in the detection of narcotics and explosives, aroma profiling, environmental analysis, and the cosmetics and fragrance industry. In our market research, we have found one product by Plasmion GmbH, which uses a stand-alone MS for gas sensing [106].
The combination of gas chromatography (GC) and mass spectrometry (MS) enables the separation and quantification of complex gas mixtures, as well as the identification of unknown compounds. GC is in charge of pre-separation of the gases in vacuum, which are then ionized and quantified by MS. The gas compounds are classified according to their m/z ratios, and their intensity is recorded as a function of m/z and for various scans (i.e., retention times). The GC/MS method also provides mass chromatograms, i.e., the temporal evolution of intensity for a specific mass. The total ion chromatogram is obtained by combining the intensities of all mass chromatograms. The recorded data set is scanned with a spectral library to provide qualitative results about the compounds present in the gas mixture [107].
GC/MS sensing technology is currently used for food and environment (air pollution) analysis, in the pharmaceutical, chemical, and oil industries, in forensic medicine and toxicology, and in scientific research laboratories. The main producers of GC/MS-based sensors are Agilent [104], whose products are devoted to the detection of, e.g., cell fatty acid in red blood and to analyze impurities in drug products, and Shimadzu [103], which produce GC/MS sensing devices for the analysis of fatty acids in aviation turbine fuel. Nowadays, GC and GC/MS-based sensors share 12% of the market distribution.
Ion mobility spectrometry (IMS) is an analytical chemistry method used to identify gases in a mixture based on their separation (ionization) after interaction with an inert gas such as helium or nitrogen [108]. Specifically, the technique measures the ion mobility when ions propagate in an electric field, from which the size-to-charge ratio and thus the ion constituents are obtained. Sensors based on IMS can be used as a stand-alone device or after pre-separation of ions through chromatography for sensitive and selective detection of compounds in more complex mixtures [109]. IMS is employed in the detection and classification of chemical warfare agents, toxic industrial chemicals, explosives, and narcotics. It shares of 4% among all sensor types, and the main manufacturers of IMS-based sensors are Bertin Environics [110], Smiths Detection [111], and Owlstone Inc. [112].
The operation of a flame ionization detector (FID) is based on the measurement of ions released during the combustion of the target compound in a flame fueled with hydrogen or helium gas. The latter produces negligible ions during combustion, while it serves to ionize gas molecules of the target compound. After gas ionization, ions propagate between two electrodes and are attracted towards the negative plate, where the current is collected. Once the ions hit the collector, a current intensity change is recorded, which would be proportional to the concentration of the ionized species [113]. FID shares similarities with PID in its working principles. However, its application differs in that FID is particularly good at detecting natural gas (methane), while PID is better at measuring toxic VOCs in landfills, where non-toxic methane would interfere with the measurement. PID and FID together share 9% and are exploited by, e.g., RAE by Honeywell [114] and Thermo Fisher Scientific Inc. [100].
Others and unknown. Under the label “Others”, we have collected minor types of sensors which, altogether, reach a share of 8–9% of the market. These include thermal conductivity gas sensors (used in GC), photometers, parametric measuring methods, systems such as zirconium-dioxide sensor, colorimetric gas sensor, flame spectrophotometry, bio-optic smell sensors, electrode pin-less microsensor, optical particle counter (OPC), galvanic fuel cell, tunable diode laser absorption spectroscopy technology, and gamma radiation. Besides, some manufacturers prefer to use their own proprietary sensing technologies, such as, e.g., catalytic sensing technology by Dräger Safety AG & Co. KGaA [115].
Finally, the sensor class referred to as “Unknown”, with a share of 7%, includes devices for which the manufacturers have not specified the sensor type.

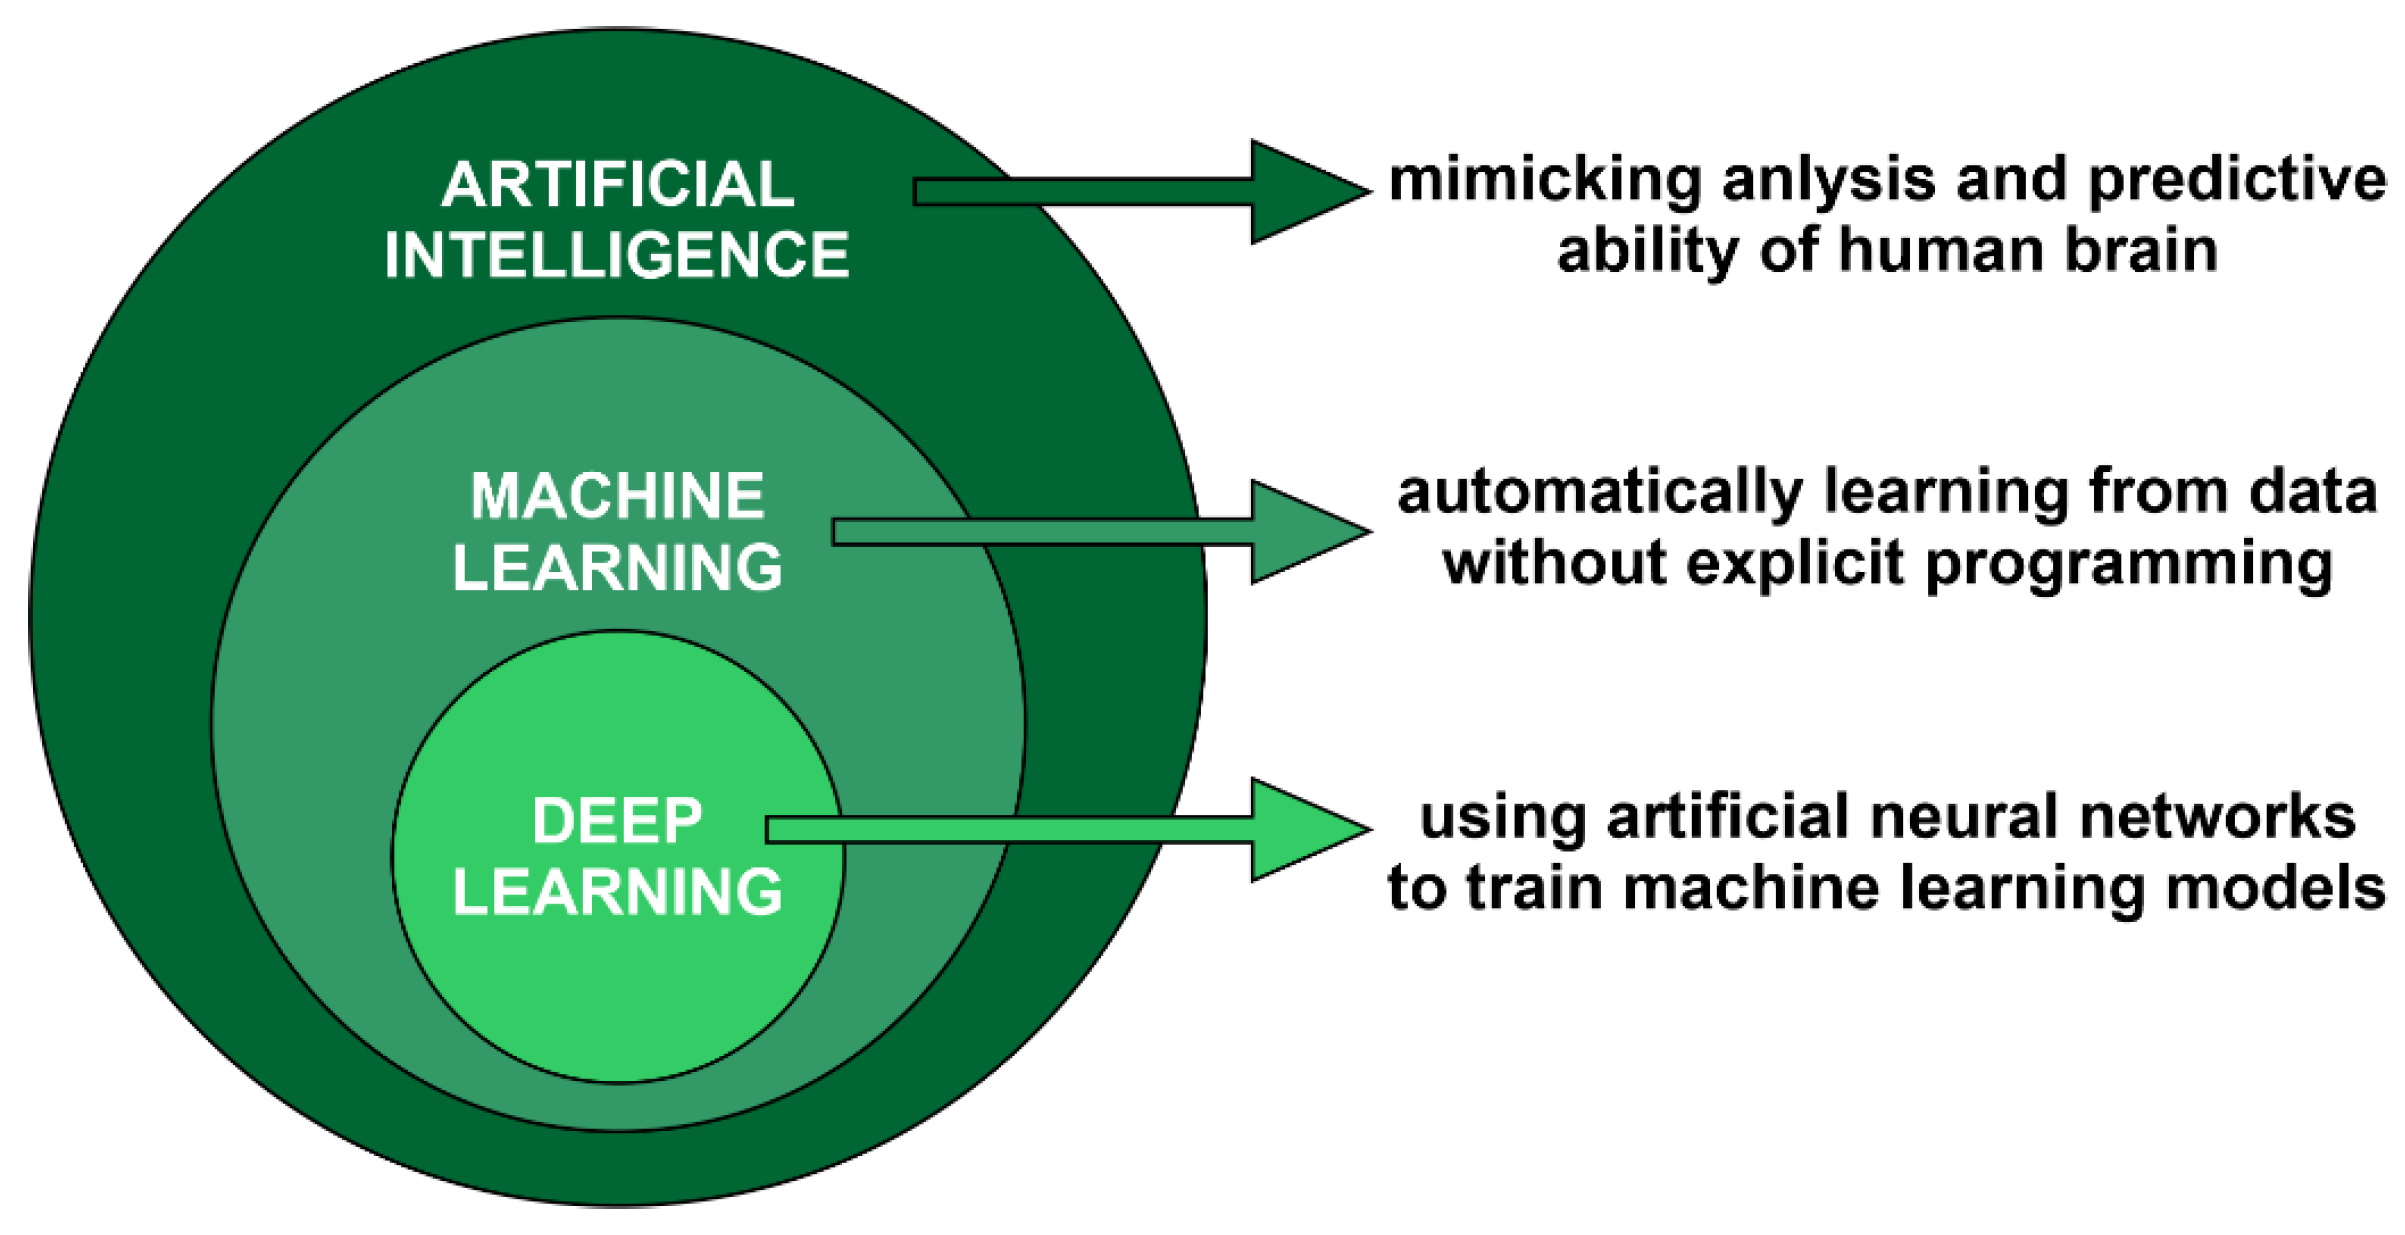
3. Machine Learning and Artificial Intelligence in e-Nose Technology
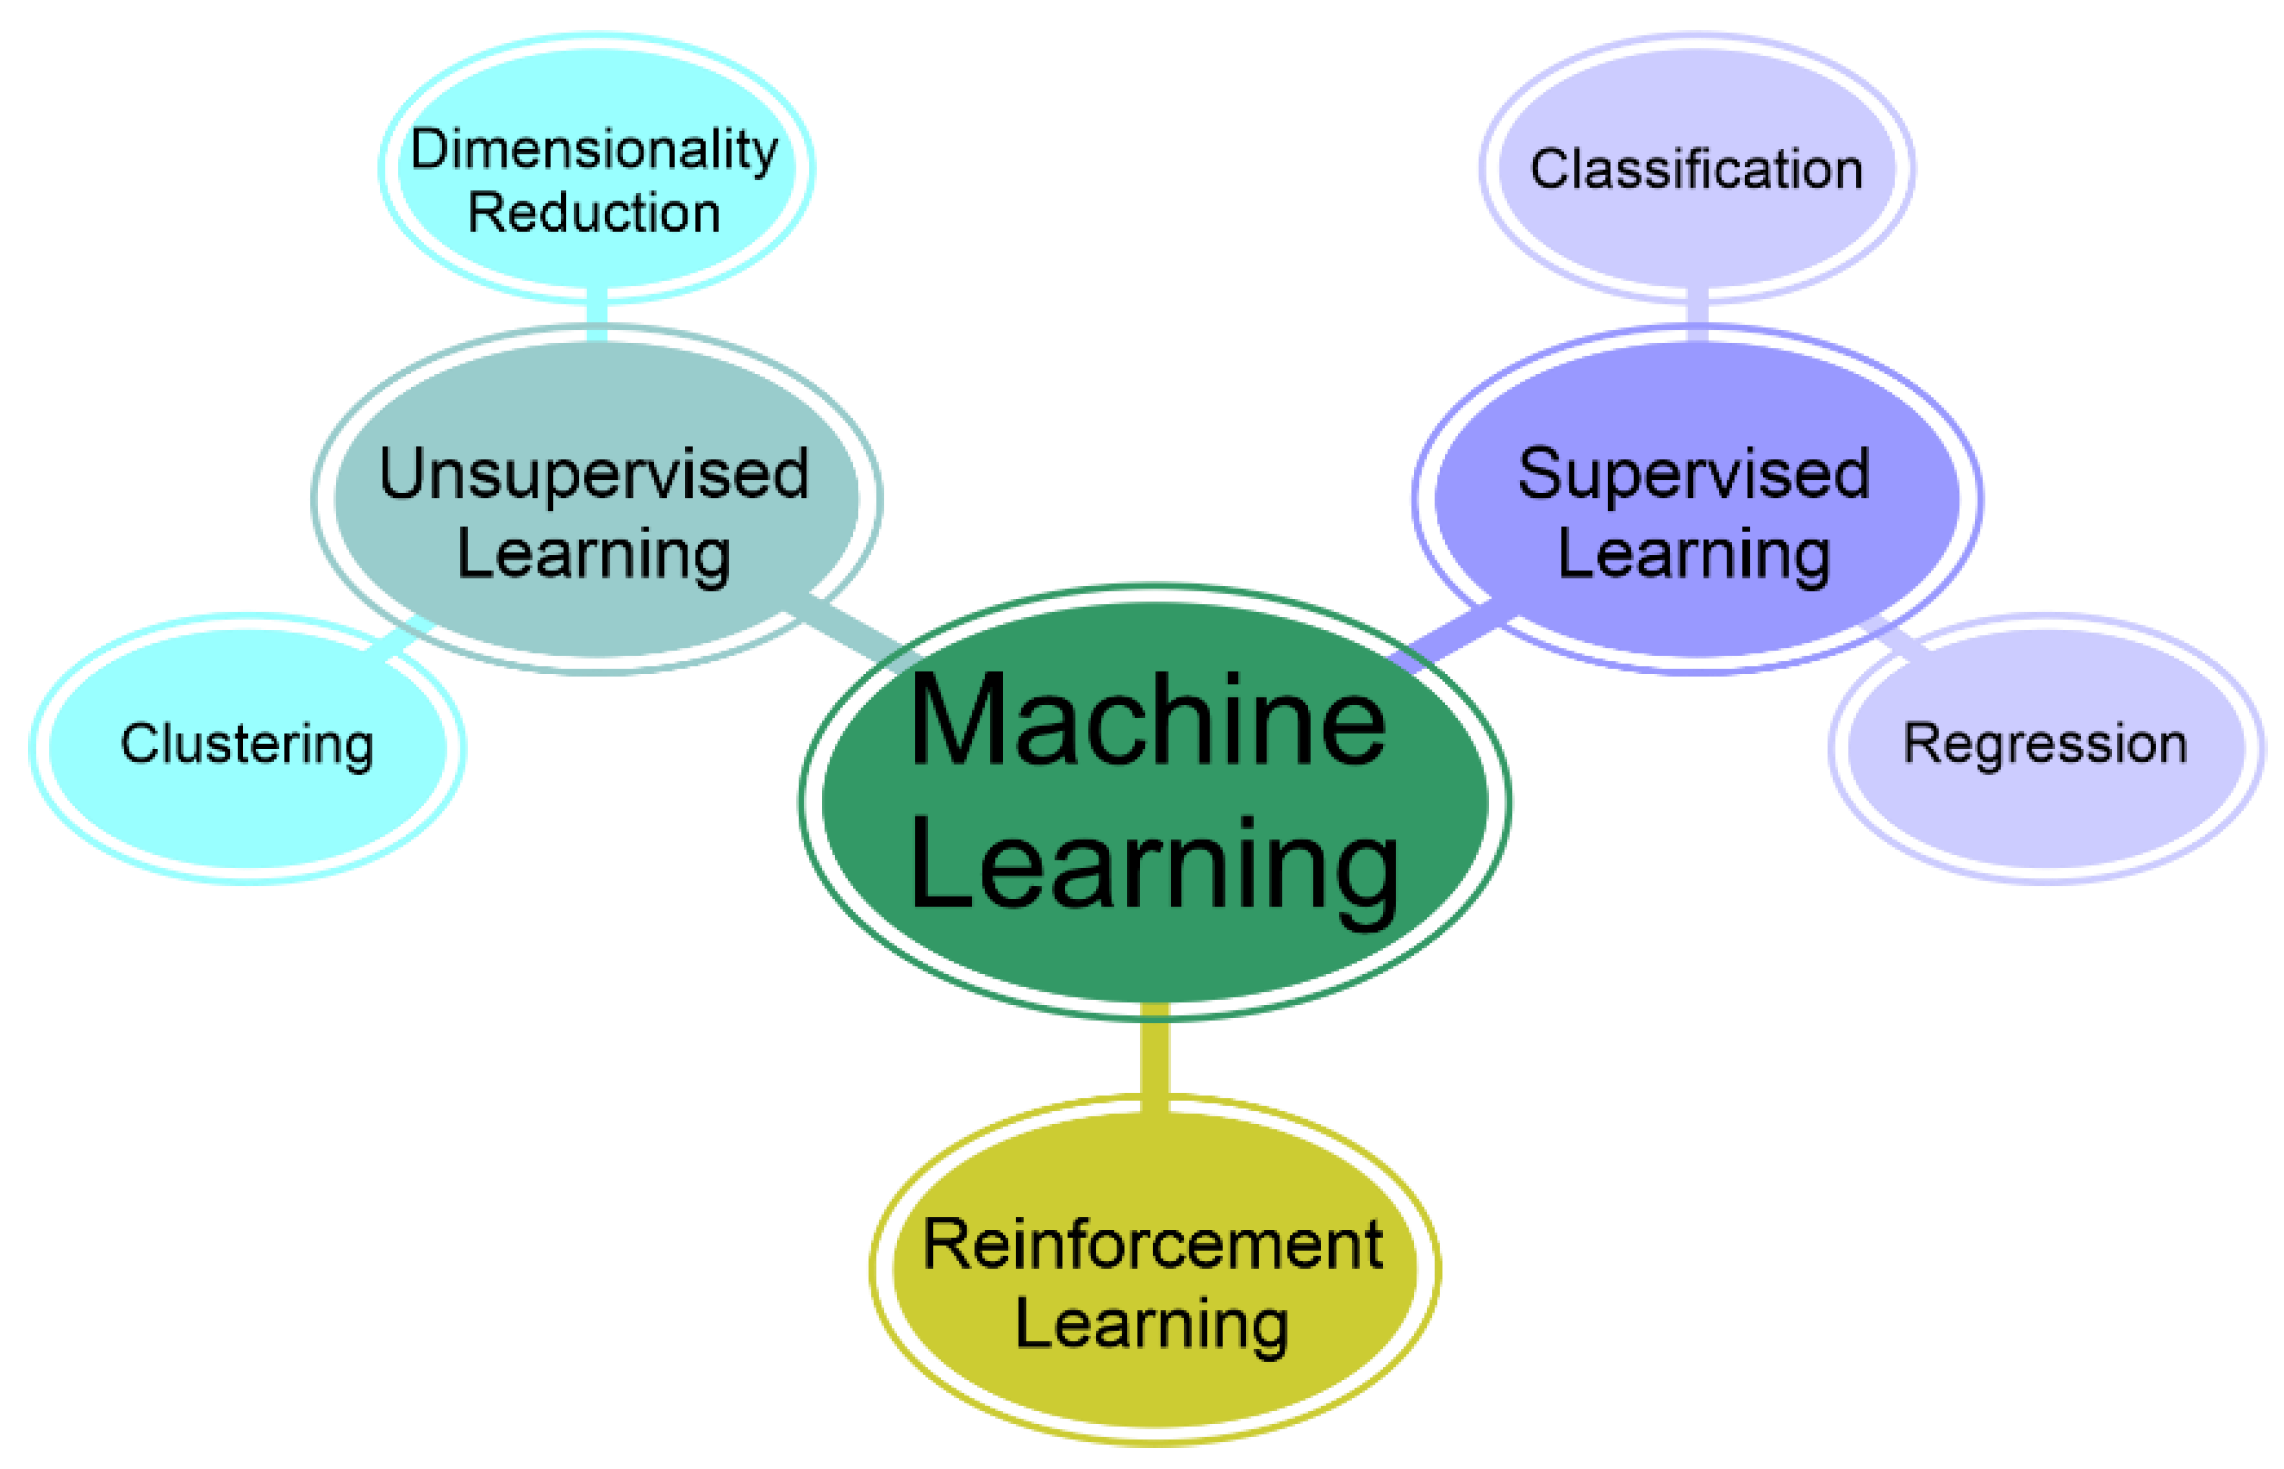
Due to the increasing importance of machine learning approaches in the field of gas sensing (see, e.g., Figure 2 and Refs. [33,34,35,36,37,38,39,40,41]), the integration of AI and ML into e-nose devices has recently pushed far forward the development of this gas sensing technology. Commercially available e-noses offer a manifold of ML-based data processing opportunities, and, usually, there is no specific analysis for a specific application, while many ML tools are bundled in each device. In general, ML methods enable the e-nose with precise odor identification with quantitative and qualitative analysis. These aspects are addressed in detail in Ref. [116].
Understanding the basic differences between AI and ML is essential to appreciate how their implementation can boost e-nose functionality and accuracy. Although often used as synonyms, AI and ML refer to different concepts in computer science [117,118]. AI broadly concerns the ability of machines to conduct tasks that would traditionally require human intelligence, such as, for instance, visual perception, speech recognition, decision-making, and language translation. Therefore, AI enables systems to function intelligently and independently, much like the human mind, and to mimic cognitive functions that used to be within the domain of the human mind. ML is a specialized subset of AI, as visualized in the schematic of Figure 6. Unlike traditional programming, in which precise instructions are given, ML algorithms harness their skill through experience by figuring out patterns in a large dataset with the aim of making predictions or classifications.
The food and beverage field offers many examples where tools that are more characteristic of AI are combined with e-noses to proceed through data analysis and classification with ML methods. For example, Ref. [119] presents a dual approach to improve food ripeness classification based on image recognition through a camera combined with an e-nose. Computer vision techniques and an e-nose are combined in Ref. [120] to detect the cooking state of grilled chicken.
In addition to AI and ML, a third concept is deep learning (DL), which is a subset of ML. DL develops the architectures of artificial neural networks in charge of learning patterns by mimicking how the human brain processes information. The main difference between ML and DL lies in the fact that the latter learns data representations in a hierarchical manner automatically, while ML requires manual aids through feature engineering. This enables DL to find intricate patterns and dependencies within the data without any human intervention, which, as a result, enables DL to scale up very high in terms of performance and generalization.
In this section, we focus on the set of ML algorithms that make a computer either learn, forecast, or make a decision based on data. Specifically, we discuss the role of ML in training e-noses to reach an extremely high level of accuracy for the recognition and classification of different odors, including those of new scents. This ability is essential in applications that rely on precision and adaptability, such as hazardous gas identification and breath analysis for disease diagnosis. Therefore, the use of AI and ML elevates e-noses to the next level by continuously improving their performance, while adapting themselves over time. Section 3.1 introduces the supervised, unsupervised, and reinforcement ML paradigms, the data preparation methods, and the most relevant ML algorithms employed for odor classification. Moreover, it outlines some of the key problems in ML model building, such as overfitting and underfitting, and the techniques to validate models and analyze their performance. Section 3.2 and 3.3 describe the preparation procedure and analysis methods, respectively, of the collected data for odor classification. Finally, Section 3.4 discusses the strategy of building, training, and evaluating an ML-based model for the treatment of e-nose datasets.

3.1. ML Paradigms

Conventionally, e-noses are composed of an array of physical sensors. As a result, the collected dataset is a matrix where each column corresponds to one of the sensors and each row to one of the exposed gases. In complex datasets, one physical sensor can provide information about more than one feature, thus augmenting the number of columns of the matrix.
The analysis of such datasets is the main task of ML. As depicted in Figure 7, ML algorithms divide into three types: supervised, unsupervised, and reinforcement learning. As described in the following, each type of learning paradigm presents its own strengths and is appropriate for different classes of problems and tasks.
The basic idea of supervised learning is to learn input-to-output mapping in order to make the right prediction with new data. To this goal, the algorithm learns first from a labeled dataset in which the correct target output accompanies its training example, which is later applied to novel datasets where the outcome is well-defined and the data is labeled. Some common algorithms are linear regression, logistic regression, support vector machines, and neural networks. Their application is wide and diverse, from email spam detection to image recognition to medical diagnosis [121,122].
The unsupervised learning algorithm learns from unlabeled responses through the identification of underlying patterns, structures, or relations that are intrinsic and embedded within the data. K-means clustering, principal component analysis (PCA), and hierarchical clustering are among the most popular methods. Clearly, unsupervised learning is useful in analyzing and exploring data whose underlying patterns are not already available. Exemplary applications are customer segmentation, anomaly detection, or gene-expression clustering, where the main task of unsupervised learning is to interpret structure into data that has no predetermined classes or labels [123,124,125].
The reinforcement learning algorithm is based on training to make correct decisions based on the rewards received or the penalties imposed as consequences of previous actions. The approach is similar to a trial-and-error learning method, in which someone tests different types of actions and infers the best one from the obtained results, thereby improving its decision-making ability. Common algorithms in reinforcement learning include Q-learning, deep Q-networks (DQNs), and policy-gradient methods. Reinforcement learning is especially effective when applied in dynamic environments, where there is a constant need for the agent to update its strategy. The most general uses are in robotics, game playing (such as AlphaGo), and autonomous vehicles, where real-time decision-making is a crucial aspect [126,127,128,129].

3.2. Data Preparation

A dataset is typically divided into three subsets: training, validation, and testing. The training subset is the largest one, i.e., from 60% to 70% of the whole dataset, and enables the development of models based on the data at hand. The validation and test subsets each correspond to 15% to 20% of the whole dataset and allow the evaluation and fine-tuning of the developed model. Specifically, the validation step is useful to choose the optimal learning algorithm and select the best hyperparameters; the test provides an assessment of the performance of the final model. In the case of a big dataset, it is advisable to allocate up to 95% of the dataset for the training, and 2.5% each for testing and validation. In fact, the larger the size of the training, the more accurate the predictions of the developed model [130]. The implementation of an ML algorithm into the e-nose technology requires high accuracy and fast response, a simple training phase, robustness against outliers, an estimator of uncertainty, small memory storage, and low power consumption.
The two most important steps of data preparation are the standardization and the normalization [130,131,132,133,134,135]. While there is no common rule to decide, given a dataset, if we have to use standardization or normalization, unsupervised learning algorithms more often use standardization rather than normalization.

3.3. Data Analysis

A pattern recognition unit requires a supervised classification algorithm. For odor classifications, the most commonly used pattern classification algorithms are support vector machine (SVM), principal component analysis (PCA), linear discriminant analysis (LDA), k-nearest neighbor (k-NN) and artificial neural network (ANN) [136,137,138], whose main features of these algorithms are described later in this section. A summary of the specific advantages and disadvantages is reported in Table S2 of the Supplementary Information File.
The difficulty of the classification problem depends on how much the values for objects in the same category differ, which, in turn, is determined by the complexity of the dataset, as well as by noise in the acquisition. In the evaluation of the classifier’s performance, the error rate, expressed as the percentage of models assigned to the wrong category [139], is considered. The final stage of the pattern classification system consists of the assignment of the input patterns to a class, depending on the measurements taken from the selected features.
The support vector machine (SVM) algorithm is typically applied to the classification of data points [140]. It is in charge of generating the optimal hyperplane, also called the decision boundary, which separates the data points into distinct classes (features) [141]. The best hyperplane is the one that maximizes the margin between two distinct data classes and, thus, contributes to a better generalization of the classification problem to new, unseen data sets. The data points closest to the hyperplane are defined as support vectors [130].
Principal component analysis (PCA) is useful when dealing with datasets with several features, because its main effect is to reduce the number of columns while preserving the data variance [142,143,144]. E-nose applications are a typical case of the many-variable problem, with a high risk of overfitting a model to the data. Therefore, the dimensionality reduction provided by PCA crucially helps to focus on a few variable subset and achieve reliable results for the complete variable set.
Feature extraction could be done by using different methods. In e-nose applications, feature extraction methods allow for the extraction of original response curves, transform domains, curve fitting parameters, phase space and dynamic moments, parallel factor analysis, energy vector, power density spectrum, and window functions [145]. However, the efficiency of a feature extraction method depends on the gas sensor type, the detection targets, and the specific demands of the application [145,146].
Linear discriminant analysis (LDA) is a statistical method used for pattern recognition and data classification. In addition, it is also a powerful method for data analysis and interpretation. LDA is a supervised learning algorithm that is used to find the linear combination of features that best separates two or more classes of instances. LDA differs from PCA because PCA selects new axes (dimensions) while preserving the variance and, hence, the shape of the data, whereas LDA chooses axes to optimize the separation ability of the two classes.
LDA works in a three-step process. The first step is to calculate the between-class separation ability or variance [147], defined as the distance between the mean values of different classes. Clearly, the closer the mean values, the more complex the algorithm problem.
The second step is to calculate the within-class variance, i.e., the distance between the mean of each class and its sample. As expected, the higher the variance within a class, the more difficult the separation of the classes.
In the third step, a lower-dimensional space is created, which maximizes the between-class separation ability and minimizes within-class variance [148,149].
Figure 8 provides a visual representation of the working principle of LDA for dimensionality reduction and classification. The original dataset consists of two classes, represented by blue and green points, distributed in a high-dimensional space (a). The goal of LDA is to find an optimal projection that maximizes class separability. Data points are projected onto a selected axis (e.g., a random direction), leading to significant class overlap. This projection is not optimal, as it does not maximize the distinction between classes (b). LDA determines the optimal projection direction by maximizing the between-class variance while minimizing the within-class variance (c). The optimal axis is chosen to enhance class separability, shown here with red arrows indicating the adjustment. Data points are finally projected onto the LDA axis (d), achieving maximum class separability. The resulting one-dimensional representation preserves the distinction between the original classes, enabling effective classification.
K-nearest neighbor (k-NN) aims at solving both classification and regression problems. In the training phase, it assigns an instance to the class of the k-NN [150]. Then, the working logic is to find the most similar data points and classify them. When new data comes in, the algorithm makes a prediction on the similarity. Importantly, K-NN does not make hypothetical predictions and works on the structure of the data itself. Therefore, it is quite suitable for making a classification when little or no prior knowledge of the distribution of the data is available [151]. However, larger values of k yield smoother classes, but computation complexity will increase exponentially as the number of samples increases [150,152].
K-NN keeps all training examples in memory after the creation of the model. In the assignment of incoming x samples to a cluster, a distance function calculates the proximity of two points [134,148,153].
Artificial Neural Networks (ANN), inspired by the human brain’s structure, are computational models designed to recognize patterns, make decisions, and solve complex problems by learning from data.
The brain, which is the main control unit in the nervous system, consists of chains of neurons [154]. A neuron, drawn in Figure 9a, is a brain cell carrying messages in the form of impulses. Dendrites receive and transmit signals (impulses) in between other neurons and cells via axons. When the impulse reaches the axon terminals, the axon releases a chemical substance called neurotransmitter in the synaptic cleft, the gap separating dendrites from distinct neurons. In this way, the impulse propagates to the next neuron.
Figure 9b shows the concept of a biological neural network applied to the ANN single-layer perceptron model. The impulses received are the inputs, and the transmitted one is the output. A function f(x) is used for linear binary classification, and the output is calculated as weighted sum of the inputs x i w i   shifted by a bias value   b i . For n inputs, the output reads:
y ^ = i = 1 n x i w i + b i .
For complex systems, a multi-layer perceptron model is required, in which one or more hidden layers operate in between the input and output layers in the way represented in Figure 9c [155]. The number of hidden layers depends on the complexity of the task. The weights applied to the input layers play an important role in determining the activation of the hidden layers. Similarly, the weights applied to the hidden layers are decisive in activating the output layer [156]. The activation of each layer is regulated by an activation function, such as, e.g., linear, binary step, sigmoid, hyperbolic tangent, rectified linear unit (ReLu), and softmax activation functions [148].
The data of a gas sensor array is often non-linear [157], and ANN based on multi-layer models offers a great aid in the identification of odors in a chemical mixture, provided there is a training phase with adequate and relevant examples.

3.4. Model Building: Training and Evaluation

Model building is a crucial step in the ML pipeline, involving the design, training, and evaluation of algorithms to capture patterns and relationships within data. The process typically begins with data pre-processing, where raw data is cleaned and transformed to ensure quality inputs. This includes handling missing values, normalizing or scaling features, and encoding categorical variables. Once the data is prepared, feature selection or extraction identifies the most informative variables. This step improves model efficiency by reducing the dataset dimensionality and attenuating the overfitting tendency. Common techniques include PCA and feature importance metrics.
The next phase is selecting an appropriate model architecture. Common algorithms include linear models (e.g., Linear and Logistic Regression), tree-based methods (e.g., Decision Trees, Random Forests), SVM, and ANN. The choice of model is based on the type of problem (classification/regression/clustering) and the dataset characteristics. Once a model is chosen, it undergoes training using a labeled dataset (in supervised learning) or unlabeled data (in unsupervised learning). Hyperparameter tuning is performed to optimize the model’s performance, using techniques such as grid search or randomized search. Cross-validation is employed to assess the model’s generalizability and to prevent overfitting by ensuring performance consistency across multiple data subsets.
After training, the model is evaluated using metrics such as accuracy, precision, recall, F1-score, or mean squared error, depending on the task. It is common to split the dataset into training, validation, and testing sets to assess the model’s performance and minimize bias in the results. The model evaluation follows the training phase by comparing the target predictions with the actual value. A model prediction can be either true or false, meaning that the model is either right or wrong. In addition, when the model is applied to the training dataset where the correct answers are known, an actual value can be classified as either positive, i.e., corresponding to one of the values of the training dataset, or negative, i.e., another value. Thus, the model can predict four possible results, which compose the so-called confusion matrix [158]:
  • A true positive (TP) refers to a correct prediction of an actual value of the dataset.
  • A false positive (FP) refers to a wrong prediction about a value that actually belongs to the dataset.
  • A true negative (TN) refers to a correct prediction about a value that does not belong to the dataset.
  • A false negative (FN) corresponds to a wrong prediction of a value outside the dataset.
In the context of e-nose systems, the most relevant evaluation criteria are accuracy, precision, sensitivity, specificity, and F1-Score:
Accuracy measures how often the classifier guesses correctly:
A c c u r a c y = T P + T N T P + T N + F N + F P
Precision counts the true positive values out of all positive values:
P r e c i s i o n = T P T P + F P
Sensitivity (TP Rate) expresses the effectiveness of the model in knowing the truth, i.e., in predicting correctly the actual values:
S e n s i t i v i t y = T P T P + F N
Specificity (TN Rate) measures how well the classifier has predicted TN values:
S p e c i f i c i t y = T N T N + F P
F1-score is the weighted average of Precision and Sensitivity:
F 1 s c o r e = 2 ( P r e c i s i o n ) ( S e n s i t i v i t y ) P r e c i s i o n + S e n s i t i v i t y
As already remarked, in e-noses, ML plays a major role, and virtually all manufacturers offer a software package for data analysis and classification. Despite the use of different ML approaches, none appears to be a first choice: usually, systems are equipped with a portfolio of tools (mostly PCA, DFA, PLS, LDA) for data analysis. Some manufacturers [159,160,161] offer software packages including ANN or SVM to add further capabilities of classification of unknown samples. As an example in a selected application field, in the following section, we will focus on the adoption of ML algorithms for food and beverage applications.

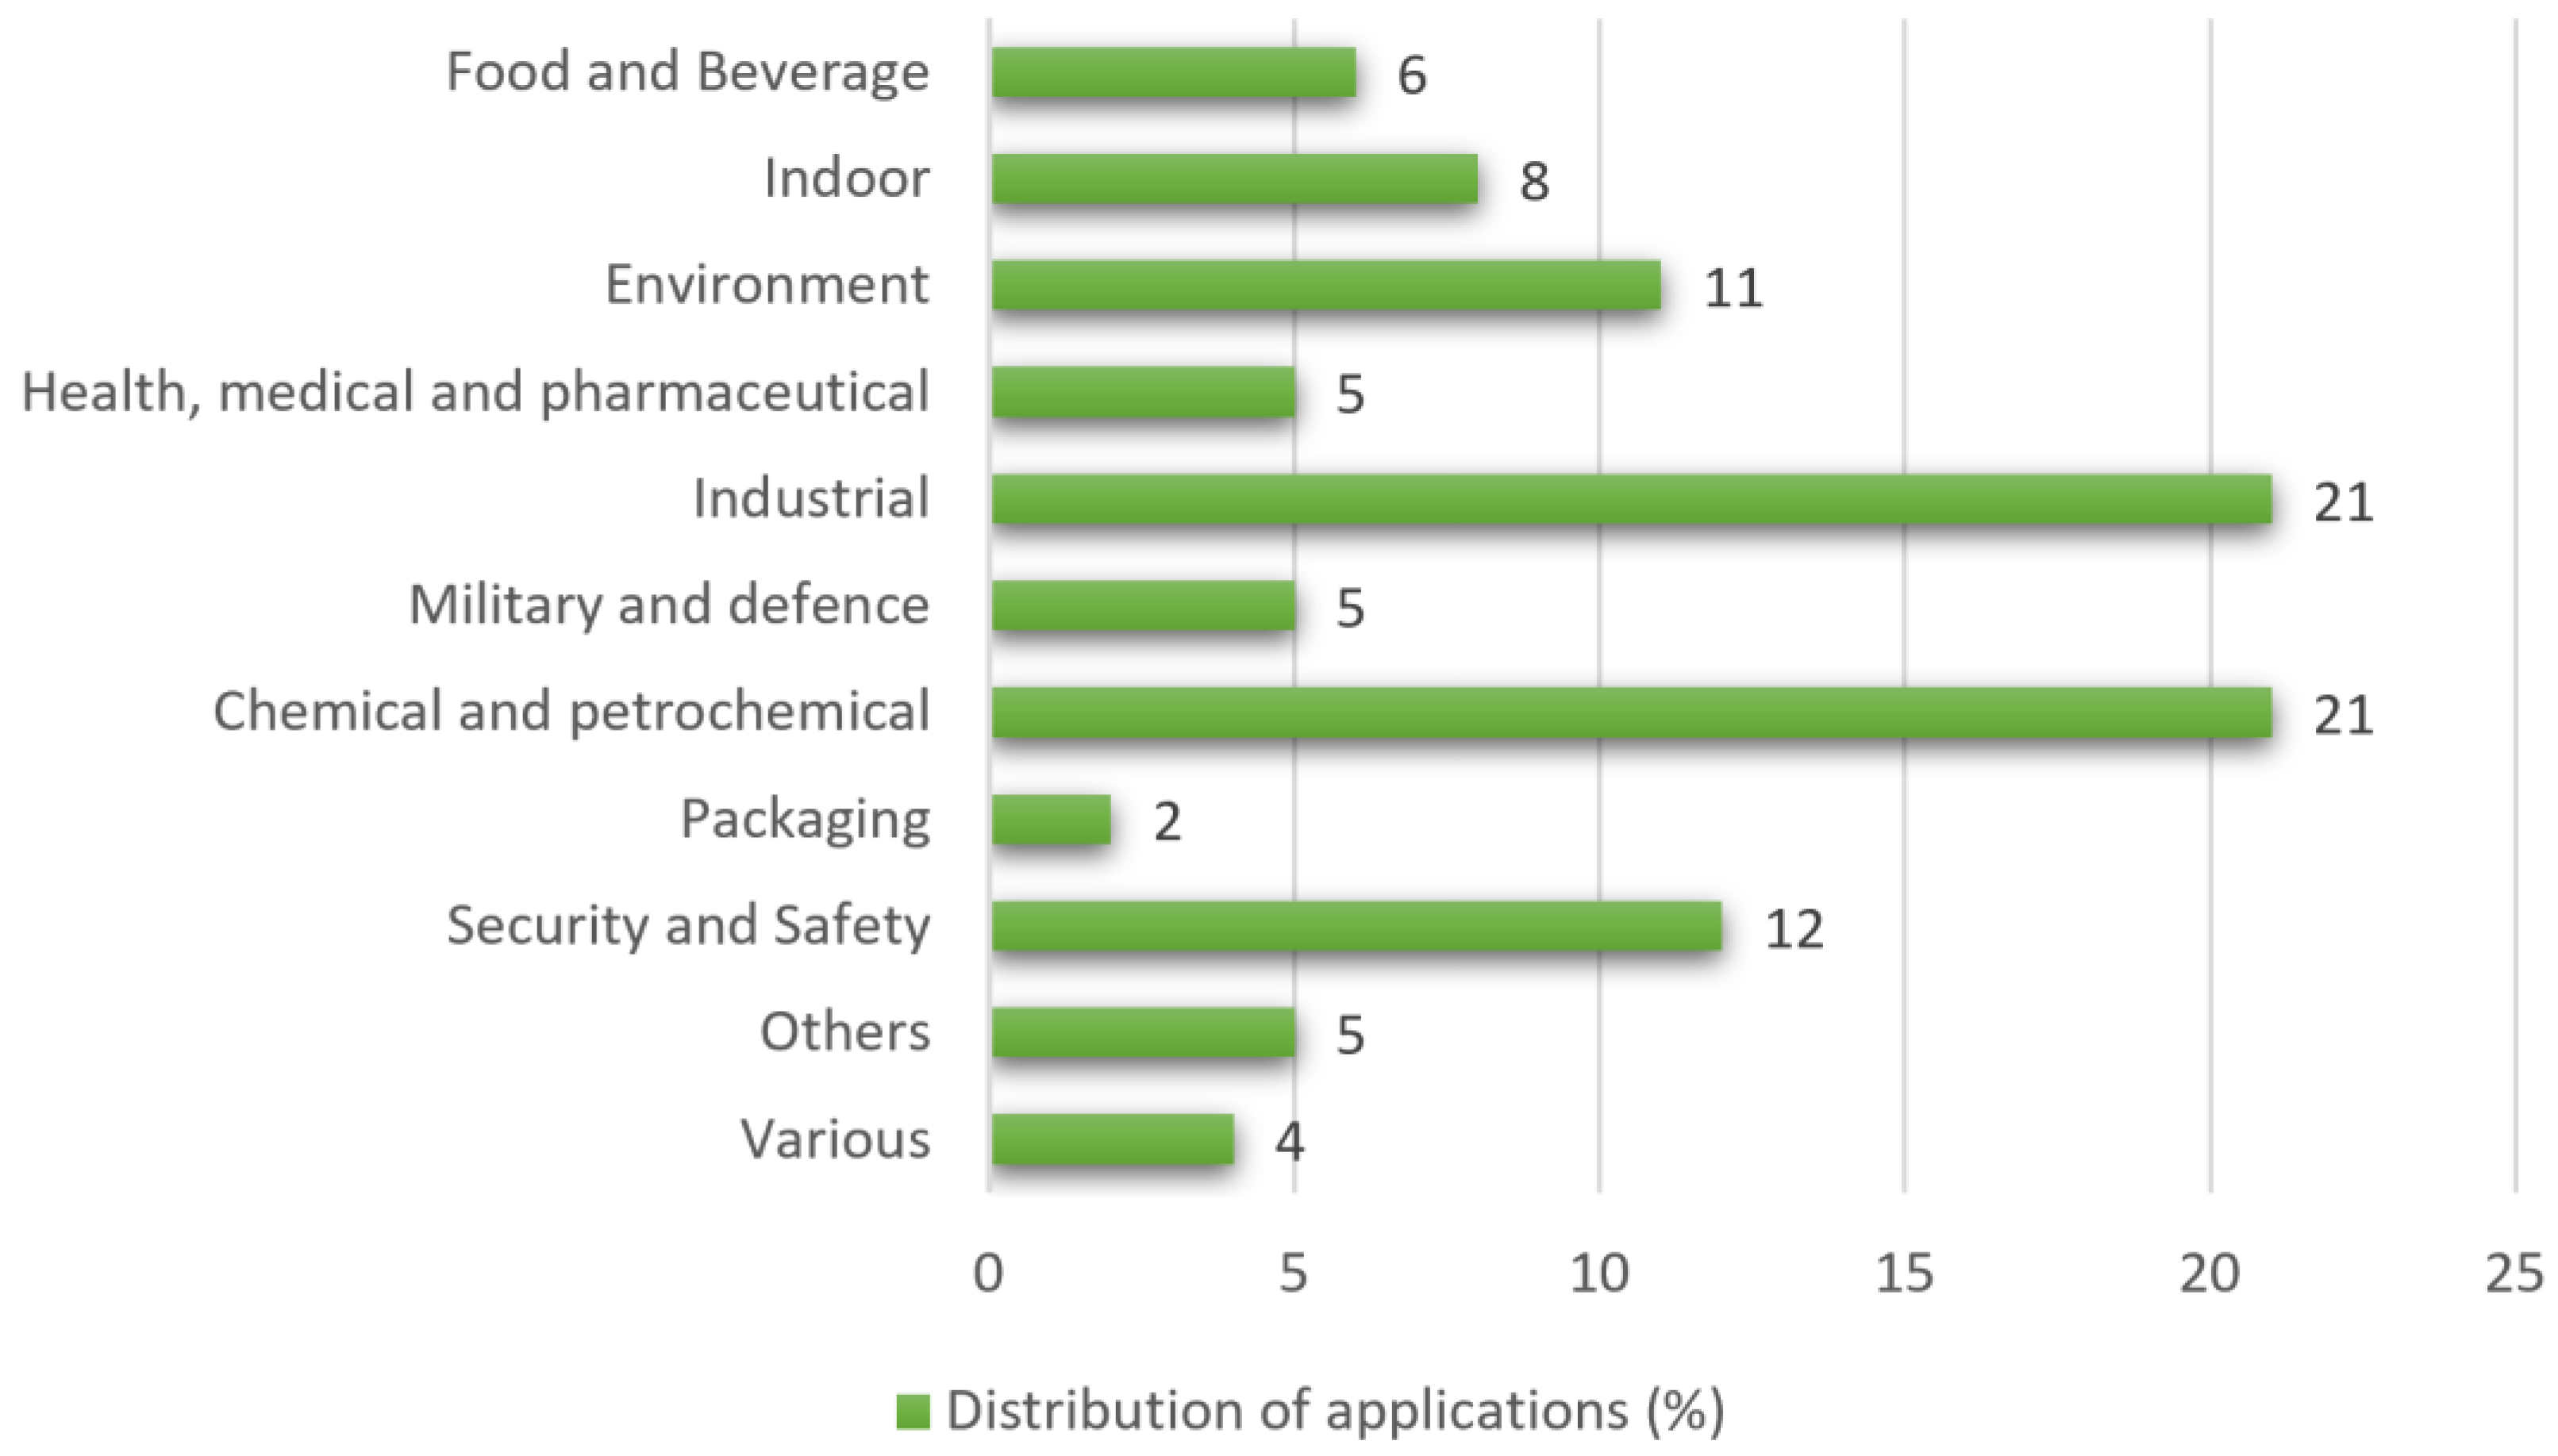
4. Application Fields of e-Nose Technology

In our market research, we identify eleven fields of application of the e-nose technology whose distribution is represented by the bar chart in Figure 10, namely food and beverage, indoor monitoring, environment including outdoor usage, health/medical/pharma, industrial, military and defense, chemical and petrochemical, packaging, security and safety, others, and various. In this section, we detail each application area and list the manufacturers involved in each application sector. Table S3 of the Supplementary Information File collects the e-nose manufacturers and relevant products, for which we have identified the type of sensor and the specific application fields.

4.1. Food and Beverage

According to the World Health Organization, more than 200 diseases are spread through food, and food poisoning problems and consequences constitute an important social problem [162]. Moreover, European Commission statistics report around 88 million tons of annual food waste in Europe [163], with an estimated cost of 143 billion Euros. Thus, a technology that can evaluate food quality through early detection, automation, and standardization of food contamination is vital in terms of human health and potential financial implications for companies. Food and beverage deterioration may occur due to changes in enzyme activity during production and storage. E-noses aid monitoring of the quality of food and beverages through the detection of harmful bacteria or, in general, unwanted contamination. This application field represents 6% of the e-nose application areas, and the companies involved are AIRSENSE Analytics GmbH [164], Alpha MOS [165], Aryballe [166], FoodSniffer [167], Gerstel GmbH & Co. KG. [168], Honeywell International Inc. [98], RAE Systems by Honeywell [114], International Gas Detectors Ltd. [99], Karlsruher Institut für Technologie (KIT) [85], Owlstone Inc. [112], RipeSense Limited by Jenkins Group Limited [169], Sacmi Imola Scarl [161], Sensigent [160], Shimadzu [103], Agilent [104], and Plasmion GmbH [106]. Table 1 provides a database of manufacturers and their products with details on their usage in the food and beverage industry. There is a relevant part of the list featuring MS/GC approaches, while the applications span from beverages (quality and contamination) to food (ripeness, freshness, contamination).
Based on a recent review by M. Wang and Y. Chen [170], a statistical analysis on a set of about 250 applications of e-noses in food and beverages was carried out. The analysis refers to the content of Tables 10 to 21 in Ref. [170] by considering the food type, the model of the e-nose (either commercial or homemade), the sensor type, and the analysis methods. In some cases, e-nose measurements were coupled with other techniques such as MS-GC or FT-IR, but these techniques are not considered in the present statistical analysis. The main results are shown in Figure 11. Among the top 10 food types (Figure 11a), rice is the most investigated, followed by tea, beef, and pork. Overall, meat (beef, pork, chicken, sausage, and ham) is the most studied category in this set. The list of the top 10 analytical methods is largely dominated by PCA (Figure 11b), which is often used in combination with one of the other methods in the list that features ANOVA, PLS-DA, LDA, and SVM from the second to the fifth share, respectively. The most-used sensors in e-noses (Figure 11c) are definitely MOS (78,3%), with a smaller share represented by FID (13,0%). It is also interesting to consider sensor usage by food category (Figure 11d). Consistent with the results shown in panel (c), MOS sensors are found in e-noses used to probe all food categories. However, apart from MOS, we observe that FID is mainly used in the analysis of beverages and dairy, and QMB is used in fruit analysis. From the same dataset, it was also possible to register that the share of self-made e-noses was 21.3%. However, these self-made e-noses are usually assembled by using commercially available sensors, often chosen among those featured in the TGS series of Figaro sensors [171].
Finally, we observe that, according to a recent Mordor Intelligence report [172], the end-user market share of food and beverage is very large, i.e., close to 30%, slightly below waste management (32%), which represents the largest share, and above military and defense, in spite of the apparently limited number of e-noses targeted by manufacturers for food and beverage applications. This suggests that the adoption level of e-noses in this field is high, due to the manifold of possible applications in the food and beverage market, which is highly diversified in terms of products and processes that need to be monitored.
Table 1. Database of e-nose manufacturers and products for the food and beverage industry.
ManufacturerProductSensor TechnologyApplication AreaRef.
AIRSENSE Analytics GmbH &
PCA Technologies
Portable Electronic Nose (PEN3)MOSQuality control: food freshness, oil rancidity, off-odor of packaging materials, flavor degradation, aroma characterization in beverages; Process control: spice dosage in food production, inspection of fermentation processes, monitoring of coffee roasting[173]
Alpha MOSHeracles NeoFlash GC technologyQuality control: Food flavor, fraud detection on product origin, detection of food adulteration, gelatin quality[174]
Aryballe TechnologiesNeOse AdvanceOptical sensor based on array of Mach-Zehnder InterferometersDiscrimination of flavored beverages and of coffee samples, vanillin quality, automation of home cooking by detecting odor changes, determination of food ripeness or freshness[175]
FOODSnifferThe FOODsnifferOptoelectronic sensor (LED self-aligned to a broadband Mach–Zehnder interferometer and a photodetector array)Determination of food ripeness or freshness, detection of poisoned food[167]
Gerstel GmbH
& Co. KG
ChemSensor 4440AHeadspace GC and quadrupole MSRoutine quality control and measurements of flavors[168]
Honeywell AnalyticsGasAlertMicro 5EC, CBNH3 from refrigerants, PH3 from fumigation in food & beverage industry[176]
GasAlertMicro 5 IREC, IRBy-product of yeast fermentation in wineries and breweries; Solid CO2 (dry ice) used as a refrigerant and for carbonation; CO2 used in packaging to extend storage shelf life in food industry and cold storage[176]
Sensepoint XCD RTDECNo detailed information[177]
Manning AirScan IRF9IRQuality control: banana ripeness, food processing, wineries; Process monitoring: beverage and gas bottling plants, product coolers, rack houses, refrigeration systems[178]
RAE Systems
by Honeywell
Honeywell BW™ UltraPID, IRDetection of NH3 in refrigeration and agriculture, of CO2 in wineries and breweries, of HCN in perishable food shipping[179]
International Gas
Detectors Ltd.
TOC-750X SeriesEC, IR, PID, CBProcess monitoring: beverage plants, breweries, food processing, refrigeration in commercial kitchens[180]
TOC-30IR, EC, and CBRefrigeration, hospitality/beverage and breweries; used in freezers/coolers and commercial kitchens, bottle stores, and more[181]
POLIPID, EC, CB, NDIRBeverage industry and agriculture[182]
Karlsruher Institut für Technologie (KIT)SAGASSAW sensor arrayCoffee analysis[159]
Owlstone Inc.LonestarField Asymmetric Ion Mobility Spectrometer (FAIMS)Detection of food and beverage taints, food freshness, and odors[183]
RipeSense Limited
(by Jenkins Group Ltd.)
ripeSense®ColorimetricDetection of food ripeness[169]
Sacmi Imola ScarlEOS Aroma6 MOS sensorsAnalysis of flavors and aromas of olive oil[161]
SensigentCyranose® 320NoseChip™ Nanocomposite sensor arrayMicrobiological food spoilage screening, detection of foodborne bacteria on beef[184]
eNose AquaNoseChip™ Nanocomposite sensor arrayDetection of contamination in bottled water, wine, beer, distilled spirits, soda, and juices[185]
eNose QANoseChip™ Nanocomposite sensor arrayDetection of contamination in bottled water, food and beverage containers, and in bottles for recycling and reusing[185]
Shimadzu Co.Nexis GC-2030GCAroma components analysis in essential oils and beers, determination of volatile substances in liquors, analysis of components in kimchi, identification of sulfur compounds[186]
GC-2010 ProGC, FIDCheck for residual solvent in food packaging; analysis of vegetable oils, alcohol congeners in alcoholic beverages, mineral oil residues in food, aroma components in Japanese sake, fatty acid content ratio in polysorbate 80, THP in soil, residual pesticides in agriproducts, volatile substances in the headspace of wine[187]
Nexis SCD-2030GCAnalysis of volatile sulfur compounds and hydrogen
sulfide in beer
[188]
GCMS-TQ8050 NXTriple Quadrupole GC/MSAnalysis of residual pesticides, mineral oil residues,
dioxins in foods and animal feed
[189]
GCMS-TQ8040 NXTriple Quadrupole GC/MSQuality control: metabolites analysis in tomato juice and beer, pesticide residues, food deterioration, chemical contaminants in marine fish, determination of geographical origin of agricultural products; Analysis of fragrance
components in aroma oils
[190]
GCMS-QP2010 SEGC/MSDetermination of organophosphorus pesticide in herbal products; analysis of VOCs in drinking water[191]
Multi-Dimensional GC/GCMS SystemGC, GC/MSAnalysis of fragrance components in food and beverages[192]
TD-30 SeriesGC/MSAnalysis of fragrance components in food[193]
Agilent7000D Triple Quadrupole GC/MSQuadrupole GC/MSQuantitative analysis of ethylene oxide and ethylene
chlorohydrin in sesame seeds, polycyclic aromatic hydrocarbon (PAH) compounds in salmon and beef, pesticides in strawberries and complex food matrices, PAH compounds in edible oil, nitrosamines in drinking water
[194]
7010D Triple Quadrupole GC/MSQuadrupole GC/MSQuantitative analysis of multiresidue pesticides in salmon, strawberries, and olive oil[195]
7250 GC/Q-TOFGC/MSQuantitative analysis of pesticides and other contaminants in food matrices[196]
8860 GC SystemGCMeasurement of purgeable organic compounds in
drinking water; Analysis of alcohols, aldehydes, and esters in spirits
[197]
Intuvo 9000 GC SystemGCDioxin analysis in food and animal feed, analysis of fatty acid methyl esters (FAME), test of drinking water, and food safety[198]
8890 GC SystemGCDetection of benzene and derivatives in water,
semi-volatile organic compounds in drinking water,
organophosphorus and organochlorine pesticides in fruit and vegetables, FAME analysis
[199]
7890B GC SystemGCFAME analysis, detection of polycyclic aromatic hydrocarbon (PAH) compounds in salmon, drinking water, pumpkin seed oil and other edible oil, off-odor compounds in drinking water, multiple pesticide residues in complex food matrices[200]
7820A GC SystemGCQuantitative analysis of food preservatives, pesticide residues in food products, organochlorine pesticides in drinking water[201]
5977C GC/MSDQuadrupole GC/MSAnalysis of endrin and DDT stability, and of semi-volatile organic compounds in drinking water[202]
Plasmion GmbHSICRIT® ionizationMS, GC/MSAroma profiling of coffee beans[203]

4.2. Other Application Areas

In order to appreciate the high potential and large versatility of the e-nose technology, we now provide a brief overview of other current applications available on the market beyond the food and beverage industry sector. This will also help make a quantitative comparison of how strongly e-noses sit on the food and beverage industry market compared to other usage application areas (see also the bar chart reported in Figure 10).
Airborne particles, household odors, volatile organic compounds, and microorganisms such as viruses and bacteria are among the major indoor threats against the health, comfort, and well-being of people. Monitoring the indoor air condition and detection of these pests is one of the strengths of e-nose technology. Indeed, the allocated usage area has a share of 8%.
The companies operating in this field are Altitude Tech Ltd. [204], IQ Air [205], Aryballe Technologies [166], CDx Inc. [206], Dräger Safety AG & Co. KGaA [115], Honeywell International Inc. [98], ATMO [207], International Gas Detectors Ltd. [99], MSA Safety [96], RAE Systems by Honeywell [114], SENSIT Technologies [208], SGX Sensortech [209], Gentex [210], ScioSense [211], Shimadzu Co. [103], RoboScientific [212], AerNos [213], and Noze [214].
One of the most pressing issues of this age is the rise in air pollution caused, for instance, by dangerous chemicals dissolved in the air, harmful gases from wastewater [215], plants and sewers treatment. E-Nose application covers 11% of the total usage distribution and involves the following companies: AIRSENSE Analytics GmbH [164], PCA Technologies [216], CDx Inc. [206], Dr. Födisch Umweltmesstechnik AG [95], Honeywell International Inc. [98], RAE Systems by Honeywell [114], International Gas Detectors Ltd. [99], MSA [96], Odotech by Envirosuite [217], Owlstone Inc. [112], Pem-Tech Inc. [218], Sacmi Imola Scarl [161], Sensidyne LP [219], SENSIT Technologies [208], SGX Sensortech [209], Crowcon Detection Instruments Ltd. [220], Teledyne Gas and Flame Detection [221], Thermo Fisher Scientific Inc. [100], Shimadzu [103], Agilent [104], AerNos [213], Noze [214], JPL Electronic Nose [222], and Plasmion GmbH [106].
E-nose technology is increasingly needed in disease diagnosis thanks to its high accuracy, quick response time, and relatively low cost, and it currently covers 5% of the application distribution. They generally perform by detecting volatile compounds in the patient’s breath, possibly identifying diseases with case-specific chemicals. Companies producing e-Noses for health, medical, and pharmaceutical purposes are AIRSENSE Analytics GmbH [164], Alpha MOS [165], CDx Inc. [206], Dr. Födisch Umweltmesstechnik AG [95], Dräger Safety AG & Co. KGaA [115], Honeywell International Inc. [98], RAE Systems by Honeywell [114], ATMO [207], International Gas Detectors Ltd. [99], Owlstone Inc. [112], Sensigent [160], Shimadzu Co. [103], Agilent [104], and Plasmion GmbH [106].
In the industrial field, e-noses are generally employed for the measurement of odor and gas emissions in factory ambient, and, nowadays, shares 21% of the application distribution. Examples are the control of the production process, the monitoring of the plant growth, the measurement of pollutants in potentially explosive atmospheres, the analysis of ambient air constituents, and the measurement of compressed gases. Additionally, e-noses are employed in shipping and shipyards, landfills, commercial buildings, industrial manufacturing, and various processing plants. The companies selling in this application field are AIRSENSE Analytics GmbH [164], Alpha MOS [165], Aryballe Technologies [166], Dr. Födisch Umweltmesstechnik AG [95], Honeywell International Inc. [98], RAE Systems by Honeywell [114], International Gas Detectors Ltd. [99], Karlsruher Institut für Technologie [85], MSA [96], Owlstone Inc. [112], Proengin Inc. [223], Sensidyne LP [219], SENSIT Technologies [208], SGX Sensortech [209], Smiths Detection [111], Gentex [210], Crowcon Detection Instruments Ltd. [220], Teledyne Gas and Flame Detection [221], Thermo Fisher Scientific Inc. [100], Shimadzu [103], and Agilent [104]. In addition, within an EU Horizon Project, Politechnika Wroclawska, Poland, has developed the SENSODOR [224] product for odor impact assessment in an industrial context.
Military and defense occupy 5% in the pie chart of the distribution of all usage areas, including the detection of explosive chemicals and materials, and, more specifically, biological and chemical weapons. The companies involved in this business are AIRSENSE Analytics GmbH [164], Bertin Environics [110], Honeywell International Inc. [98], RAE Systems by Honeywell [114], International Gas Detectors Ltd. [99], MSA [96], Owlstone Inc. [112], Proengin Inc. [223], Smiths Detection [111], and Gentex [210].
E-noses are used in chemical processing and manufacturing plants, laboratories, oil and gas plants, chemical storage, and refineries, reaching a 21% share among all application sectors. The manufacturers involved in this application field are AIRSENSE Analytics GmbH [164] and its main partner PCA Technologies [216], CDx Inc. [206], Dr. Födisch Umweltmesstechnik AG [95], Dräger Safety AG & Co. KGaA [115], Honeywell International Inc. [98], RAE Systems by Honeywell [114], International Gas Detectors Ltd. [99], Karlsruher Institut für Technologie [85], MSA Safety [96], Pem-Tech Inc. [218], Sensidyne LP [219], SENSIT Technologies [208], SGX Sensortech [209], Smiths Detection [111], Gentex [210], Crowcon Detection Instruments Ltd. [220], Teledyne Gas and Flame Detection [221], Thermo Fisher Scientific Inc. [100], Shimadzu [103], and Agilent [104].
Packaging material, specifically food packaging, demands careful checks because it should not cause changes in the smell of the product. Moreover, product packaging is often automated, which can possibly benefit from e-noses to provide better control of the process. While smart packaging has the potential to significantly minimize waste, and some smart tags with colorimetric sensors are emerging, e-noses occupy only 2% in the usage distribution chart, mainly represented by AIRSENSE Analytics GmbH [164], PCA Technologies [216], Alpha MOS [165], Gerstel GmbH & Co. KG [168], International Gas Detectors Ltd. [99], Sensigent [160], and Shimadzu [103]. This is due to several factors, including that most gas sensors are still somewhat expensive and require a power supply. As a result, it is difficult to include them in disposable packaging. Thus, the search for new detection methods is required to enable gas sensors to be widely integrated into packaging.
The category of safety and security comprises the use of e-noses to detect pollutants, gas leakage, and toxic or flammable substances to ensure the safety of employees in the workplace and to detect dangerous substances. This category has a large 12% rate among all classes and the companies producing e-noses for this kind of application are AIRSENSE Analytics GmbH [164], Dräger Safety AG & Co. KGaA [115], Honeywell International Inc. [98], RAE Systems by Honeywell [114], International Gas Detectors Ltd. [99], MSA Safety [96], Sensidyne LP [219], SENSIT Technologies [208], SGX Sensortech [209], Gentex [210], Thermo Fisher Scientific Inc. [100], AerNos [213], Noze [214], and Plasmion GmbH [106].
The “Others” category, with a share of 5%, gathers the application fields listed below together with the companies involved:
  • Aviation: AIRSENSE Analytics GmbH [164], Shimadzu [103];
  • Consumer Appliance: Aryballe [166];
  • Mining: MSA Safety [96], SGX Sensortech [209];
  • Biology: RAE Systems by Honeywell [114];
  • Electrical and electronic: International Gas Detectors Ltd. [99];
  • Household: Noze [214], AerNos [213];
  • Agriculture and Livestock: Honeywell [98], RoboScientific [212];
  • Transportation: Proengin Inc. [223].
Finally, we classify as “Various” e-nose devices for which the detection of only a specific type of gas, without a specific application area, was mentioned in the product catalog of the company. We, therefore, assume that that sensor could serve in a variety of uses. This class accounts for 4% of the usage distribution chart and is mainly represented by Agilent [104] and Crowcon Detection Instruments Ltd. [220].
Based on the analysis carried out so far, we can discuss the adoption level of e-noses in different application fields. The adoption level is based on a combination of aspects, including market penetration, technological maturity, commercial availability, and real-world deployment. Commercial availability is determined by e-nose systems that can be sold for a specific application field. For example, the food industry already uses commercial e-noses such as PEN 3, Cyranose, and Alpha MOS FOX et al. [170], while healthcare e-noses (e.g., for cancer detection) are mostly in clinical trials, although some commercial systems are used [225]. Regulatory approval also plays a relevant role in the adoption of a technology, which is then strictly related to certifications such as the U.S. Food and Drug Administration (FDA), European Conformity (CE), and International Organization for Standardization (ISO) markings. Industrial gas sensors are CE-certified, while medical breath analyzers often require lengthy FDA approval. Standardization approaches also affect the diffusion of e-noses, as discussed in Ref. [226]. Market demand and the Return on Investment (ROI) metric are key aspects for adoption. Indeed, there should be a clear economic incentive for industries to adopt e-noses. Food manufacturers can save millions by detecting spoilage early, while consumer e-noses (e.g., smartphone-based sensors) still struggle with cost vs. demand. Looking at the technical side (technological readiness), adoption depends on whether sensors in e-noses are accurate, stable, and scalable enough for the application. For instance, MOS sensors work well in industrial settings but struggle with humidity in agriculture. Environmental monitoring has already implemented real-time e-nose networks in cities, with high adoption levels that can foster further development for e-nose adoption.
Finally, the adoption level can be evaluated by considering whether a targeted application field is dominated by academic papers or by actual deployed systems.
In light of these remarks, high adoption levels of e-noses are found in the food and beverage industry, with applications that include spoilage detection, freshness monitoring, and flavor profiling. The adoption is driven by the needs of strict quality control, cost savings, and compliance with FDA/ISO regulations. Environmental monitoring for air quality assessment and pollutant detection (VOCs, CO₂) can be ranked at a high adoption level. In this case, drivers are government regulations (EPA) and industrial safety requirements. The same holds for industrial safety applications such as gas leak detection (chemical plants, oil refineries), where drivers are worker safety laws and real-time monitoring demand. Here, key factors for high adoption are mature sensor technologies (MOS, electrochemical), clear ROI (cost savings vs. traditional lab tests), and regulatory support.
Examples of moderate adoption fields are healthcare and diagnostics, where applications are well known (mainly breath analysis for diseases such as lung cancer, diabetes, COPD, COVID-19), but relevant challenges, such as clinical validation and regulatory hurdles (FDA/CE), are still present. Agriculture also represents a moderate adoption field. Soil health monitoring and pest/disease detection represent key applications driven by precision farming trends and IoT integration, but problems related to calibration for diverse environments cannot be excluded. Finally, an example of an emerging adoption field is consumer electronics, with expected applications in smart home air quality sensors and wearable health devices. Here, challenges are miniaturization, power efficiency, and consumer affordability.

5. Conclusions

Based on a market analysis of currently available devices, we reviewed the application fields of e-noses. A total of 44 companies active up to 2024, as well as 265 products, have been identified on the web by considering the web pages of companies that feature e-noses among their products. These devices have been classified according to (i) the sensing mechanisms underlying the device performances and (ii) the application fields.
From this study, a rather complex picture emerged, with the taxonomy based on scientific literature being, to some extent, different from the current presentation of e-noses drawn from market data.
Strictly speaking, an e-nose is made of an array of physical sensors, and the signal from the array must be processed with AI approaches. However, through ML, several devices can be operated as e-noses, but they are not made of an array of sensors and are mostly based on spectroscopy/spectrometry approaches.
On the market, e-noses aimed to detect a single gas still coexist with devices that are able to discriminate complex patterns, with the latter category being closer to the definition introduced by Gardner and Bartlett [13], while the former category can be regarded as a strategy to increase the discrimination of a single analyte rather than classify a complex mixture.
Beyond these findings, we also observe that ML and, in some cases, data augmentations are currently boosting the development of virtual e-noses, i.e., electronic noses based on single sensors, which are aimed at simplifying the device layout by reducing the number of sensors and to enhance the classification/discrimination capabilities [33,36,227,228]. In this case, the definition of e-nose needs to be extended to single sensors that allow for the extraction of a manifold of features, each being regarded as a virtual sensor. These multi-feature virtualization approaches can be found even in traditional e-noses to enhance their capability of discrimination by providing more read-out channels for each exposure to a gas mixture.
The food and beverage industry is expected to have a central role in the future of e-noses. Indeed, here, e-noses can help with addressing issues that go beyond mere technical, analytical, or economic (i.e., production of goods) aspects, as they can help to promote and strengthen all the steps leading to sustainability, good health, and preservation of quality and cultural heritage in food production. In food and beverage, multi-sensor data fusion approaches are already at work for quality control [229], but they still represent a challenge in how to effectively extract features from different sensing systems. Furthermore, olfaction, along with taste, still represents a major challenge in the categorization and reconstruction of odor or aroma profiles. Therefore, major contributions from AI are expected to cope with this challenge and provide novel perspectives [43,230,231].

Supplementary Materials

The following supporting information can be downloaded at: https://www.mdpi.com/article/10.3390/chemosensors13050181/s1, Table S1: Main usage area, advantages, and disadvantages of sensors for e-nose application; Table S2: Data classification algorithms for e-nose applications; Table S3: Database of e-nose manufacturers and commercially available devices.

Author Contributions

Conceptualization, L.S.; methodology, B.G. and L.S.; validation, B.G., S.M. and L.S.; data curation, S.M. and B.G.; writing—original draft preparation, S.M., B.G. and L.S. writing—review and editing, S.M., M.G., M.Z., S.P. and L.S.; visualization, S.M.; supervision, L.S.; funding acquisition, L.S. All authors have read and agreed to the published version of the manuscript.

Funding

This research was funded by the PON Project, grant number CUP J55F21002900001.

Institutional Review Board Statement

Not applicable.

Informed Consent Statement

Not applicable.

Data Availability Statement

The data presented in this study are available on request from the corresponding author.

Acknowledgments

SM and MG acknowledge support from Antares Vision S.p.A.

Conflicts of Interest

B.G. is currently employed in Adesso Group. S.M. has been supervised by Antares Vision S.p.A. during the PON Project. M.G. has received partial research grant from Antares Vision S.p.A.

Abbreviations

AIArtificial Intelligence
ANNArtificial Neural Network
BAWBulk Acoustic Wave
CBCatalytic Bead
CPConducting Polymer
DBSDeep Brain Stimulation
DDTDichloro Diphenyl Trichloroethane
DFADeterministic Finite Automata
DLDeep Learning
DQNDeep Q-Networks
E-noseElectronic Nose
ECElectrochemical
FAIMSField Asymmetric Ion Mobility Spectrometry
FAMEFatty Acids Methyl Ester
FIDFlame Ionization Detector
FNFalse Negative
FPFalse Positive
FPWFlexural Plate Wave
FTIRFourier Transform Infrared
GCGas Chromatography
GC/MSGas Chromatography-Mass Spectrometry
IMSIon Mobility Spectrometry
IRInfrared
IoTInternet of Things
k-NNk-Nearest Neighbor
LDALinear Discriminant Analysis
LODLimit of Detection
LOQLimit of Quantification
MLMachine Learning
MOSMetal Oxide Semiconducting
NDIRNon-Dispersive Infrared
OPCOptical Particle Counter
OPLS-DAOrthogonal Projections to Latent Structures Discriminant Analysis
OptOptical
PAHPolycyclic Aromatic Hydrocarbon
PCAPrincipal Component Analysis
PIDPhotoionization Detector
PLSPartial Least-Squares
PLS-DAPartial Least-Squares Discriminant Analysis
PLSRPartial Least-Squares Regression
ppmParts Per Million
QCMQuartz Crystal Microbalance
ReLuRectified Linear Unit
SAWSurface Acoustic Wave
SVMSupport Vector Machine
TMDTransition Metal Dichalcogenides
TNTrue Negative
TPTrue Positive
t-SNEt-distributed Stochastic Neighbor Embedding
U-MAPUniform Manifold Approximation and Projection
UVUltraviolet
VOCVolatile Organic Compound

References

  1. Wilson, A.D.; Baietto, M. Applications and Advances in Electronic-Nose Technologies. Sensors 2009, 9, 5099–5148. [Google Scholar] [CrossRef]
  2. Park, S.Y.; Kim, Y.; Kim, T.; Eom, T.H.; Kim, S.Y.; Jang, H.W. Chemoresistive materials for electronic nose: Progress, perspectives, and challenges. InfoMat 2019, 1, 289–316. [Google Scholar] [CrossRef]
  3. Zwaardemaker, H.; Hogewind, F. On Spray-Electricity and Waterfall-Electricity. KNAW Proc. 1920, 22, 429–437. [Google Scholar]
  4. Arshak, K.; Moore, E.; Lyons, G.; Harris, J.; Clifford, S. A review of gas sensors employed in electronic nose applications. Sens. Rev. 2004, 24, 181–198. [Google Scholar] [CrossRef]
  5. S & S Insider. Available online: https://www.snsinsider.com/reports/electronic-nose-market-1303 (accessed on 11 March 2025).
  6. Hartman, J. A possible method for the rapid estimation of flavours in vegetables. Proc. Amer. Soc. Hort. Sci. 1954, 64, 335–342. [Google Scholar]
  7. Moncrieff, R. An instrument for measuring and classifying odours. J. Appl. Physiol. 1961, 16, 742–749. [Google Scholar] [CrossRef]
  8. Buck, T.M.; Allen, F.G.; Dalton, J.V. Detection of Chemical Species by Surface Effects on Metals and Semiconductors. In Surface Effects in Detection; Bell Telephone Laboratories: Murray Hill, NJ, USA, 1965. [Google Scholar]
  9. Dravnieks, A.; Trotter, P.J. Polar vapour detector based on thermal modulation of contact potential. J. Sci. Instrum. 1965, 42, 624. [Google Scholar] [CrossRef]
  10. Pybus, D.; Sell, C. The Chemistry of Fragrances; RSC Paperbacks: Cambridge, UK, 1999. [Google Scholar]
  11. Persaud, K.C.; Dodd, G. Analysis of discrimination mechanisms in the mammalian olfactory system using a model nose. Nature 1982, 299, 352–355. [Google Scholar] [CrossRef]
  12. Ikegami, A.; Kaneyasu, M. Olfactory detection using integrated sensors. In Proceedings of the 3rd International Conference on Solid-State Sensors and Actuators, Philadelphia, PA, USA, 11–14 June 1985. [Google Scholar]
  13. Gardner, J.W.; Bartlett, P.N. A brief history of electronic noses. Sens. Actuators B Chem. 1994, 18, 210–211. [Google Scholar] [CrossRef]
  14. Karakaya, D.; Ulucan, O.; Turkan, M. Electronic Nose and Its Applications: A Survey. Int. J. Autom. Comput. 2020, 17, 179–209. [Google Scholar] [CrossRef]
  15. Galvani, M.; Freddi, S.; Sangaletti, L. Disclosing Fast Detection Opportunities with Nanostructured Chemiresistor Gas Sensors Based on Metal Oxides, Carbon, and Transition Metal Dichalcogenides. Sensors 2024, 24, 584. [Google Scholar] [CrossRef] [PubMed]
  16. Rabchinskii, M.K.; Sysoev, V.V.; Glukhova, O.E.; Brzhezinskaya, M.; Stolyarova, D.Y.; Varezhnikov, A.S.; Solomatin, M.A.; Barkov, P.V.; Kirilenko, D.A.; Pavlov, S.I.; et al. Guiding Graphene Derivatization for the On-Chip Multisensor Arrays: From the Synthesis to the Theoretical Background. Adv. Mater. Technol. 2022, 7, 2101250. [Google Scholar] [CrossRef]
  17. Piras, A.; Ehlert, C.; Gryn, G. Sensing and sensitivity: Computational chemistry of graphene-based sensors. WIREs Comput. Mol. Sci. 2021, 1111, e1526. [Google Scholar] [CrossRef]
  18. Paghi, A.; Mariani, S.; Barillaro, G. 1D and 2D Field Effect Transistors in Gas Sensing: A Comprehensive Review. Small 2023, 19, 2206100. [Google Scholar] [CrossRef]
  19. Grassi, S.; Benedetti, S.; Casiraghi, E.; Buratti, S. E-sensing systems for shelf life evaluation: A review on applications to fresh food of animal origin. Food Packag. Shelf Life 2023, 40, 101221. [Google Scholar] [CrossRef]
  20. Zarra, T.; Galang, M.G.; Ballesteros, F., Jr.; Balgiorno, V.; Naddeo, V. Environmental odour management by artificial neural network—A review. Environ. Int. Part B 2019, 133, 105189. [Google Scholar] [CrossRef]
  21. Tonezzer, M.; Thi Thanh Le, D.; Van Duy, L.; Hoa, N.D.; Gasperi, F.; Van Duy, N.; Biasioli, F. Electronic noses based on metal oxide nanowires: A review. Nanotechnol. Rev. 2022, 11, 897–925. [Google Scholar] [CrossRef]
  22. Wilson, A.D. Application of Electronic-Nose Technologies and VOC-Biomarkers for the Noninvasive Early Diagnosis of Gastrointestinal Diseases. Sensors 2018, 18, 2613. [Google Scholar] [CrossRef]
  23. Freddi, S.; Sangaletti, L. Trends in the development of electronic noses based on carbon nanotubes chemiresistors for breathomics. Nanomaterials 2022, 12, 2992. [Google Scholar] [CrossRef]
  24. Abideen, Z.U.; Arifeen, W.U.; Nuwan, Y.M. Emerging trends in metal oxide-based electronic noses for healthcare applications: A review. Nanoscale 2024, 16, 9259–9283. [Google Scholar] [CrossRef]
  25. Liu, L.; Na, M.; Yu, J.; Zhao, W.; Zhu, Y.; Hu, C. Sniffing Like a Wine Taster: Multiple Overlapping Sniffs (MOSS) Strategy Enhances Electronic Nose Odor Recognition Capability. Adv. Sci. 2023, 11, 2305639. [Google Scholar] [CrossRef] [PubMed]
  26. Hierlemann, A.; Gutierrez-Osuna, R. Higher-Order Chemical Sensing. Chem. Rev. 2008, 108, 563–613. [Google Scholar] [CrossRef] [PubMed]
  27. Ao, S.; Liu, M.; Wang, D.; Zhu, E.; Liu, K.; Wang, W.; Ling, Y.; Fu, W.; Zhang, Z. Dual-parameter gas sensing with functional graphene field-effect transistors. Cell Rep. Phys. Sci. 2023, 4, 101564. [Google Scholar] [CrossRef]
  28. Lee, S.W.; Kim, B.H.; Seo, Y.H. Olfactory system-inspired electronic nose system using numerous low-cost homogenous and hetrogenous sensors. PLoS ONE 2022, 18, e0295703. [Google Scholar] [CrossRef]
  29. Parichencko, A.; Huang, S.; Pang, J.; Ibarlucea, B.; Cuniberti, G. Recent Advances in technologies toward the development of 2D matarials-based electronic noses. Trends Anal. Chem. 2023, 166, 117185. [Google Scholar] [CrossRef]
  30. Liu, B.; Huang, Y.; Kam, K.W.; Cheung, W.F.; Zhao, N.; Zheng, B. Functionalized graphene-based chemiresistive electronic nose for discrimination of disease-related volatile organic compounds. Biosens. Bioelectron. X 2019, 1, 100016. [Google Scholar] [CrossRef]
  31. Nallon, E.C.; Schnee, V.P.; Bright, C.; Polcha, M.P.; Li, Q. Chemical Discrimination with an Unmodified Graphene Chemical Sensor. ACS Sens. 2016, 1, 26–31. [Google Scholar] [CrossRef]
  32. Johnson, K.L.; Rose-Pehrsson, S.L. Sensor Array Design for Complex Sensing Tasks. Annu. Rev. Anal. Chem. 2015, 8, 287–310. [Google Scholar] [CrossRef]
  33. Hayasaka, T.; Lin, A.; Copa, V.C.; Lopez, L.P., Jr.; Loberternos, R.; Ballesteros, L.I.M.; Kubota, Y.; Liu, Y.; Salvador, A.A.; Lin, L. An electronic nose using a single graphene FET and machine learning for water, methanol, and ethanol. Microsyst. Microengineering 2002, 6, 50. [Google Scholar] [CrossRef]
  34. Li, Z.; Askim, J.R.; Suslick, K.S. The Optoelectronic Nose: Colorimetric and Fluorometric Sensor Arrays. Chem. Rev. 2019, 1, 231–292. [Google Scholar] [CrossRef]
  35. Pannone, A.; Raj, A.; Ravichandran, H.; Das, S.; Chen, Z.; Price, C.A.; Sultana, M.; Das, S. Robust chemical analysis with graphene chemosensors and machine learning. Nature 2024, 634, 572–578. [Google Scholar] [CrossRef] [PubMed]
  36. Huang, S.; Croy, A.; Bierling, A.L.; Khavrus, V.; Panes-Ruiz, L.A.; Dianat, A.; Ibarlucea, B.; Cuniberti, G. Machine learning-eneabled graphene-based electronic olfactation sensors and their olfactory performance assessmen. Appl. Phys. Rev. 2023, 10, 021406. [Google Scholar] [CrossRef]
  37. Fang, C.; Li, H.-Y.; Li, L.; Su, H.-Y.; Tang, J.; Bai, X.; Liu, H. Smart electronic Nose Enabled by an All-Feature Olfactory Algorithm. Adv. Intell. Syst. 2022, 4, 2200074. [Google Scholar] [CrossRef]
  38. Leon-Medina, J.X.; Parés, N.; Anaya, M.; Tibaduiza, D.; Pozo, F. Data classification Methodology for Electronic Nose Using Uniform Manifold Approximation and Projection and Extreme Learning Machine. Mathematics 2022, 10, 29. [Google Scholar] [CrossRef]
  39. Sagar, M.S.I.; Allison, N.R.; Jalajamony, H.M.; Fernandez, R.E.; Sekhar, P.K. Modern Data Analysis in Gas Sensors. J. Electrochem. Soc. 2022, 169, 127512. [Google Scholar] [CrossRef]
  40. Liu, T.; Guo, L.; Wang, M.; Su, C.; Wang, D.; Dong, H.; Chen, J.; Wu, W. Review on algorithm Design in Electronic Noses: Challenges, Status, and Trends. Intell. Comput. 2023, 3, 0012. [Google Scholar] [CrossRef]
  41. Yaqoob, U.; Younis, M.I.; Sensors, C.G. Challenges, and the Potential of Machine Learning—A Review. Sensors 2021, 21, 2877. [Google Scholar] [CrossRef]
  42. Yang, Y.; Wang, X.; Zhao, L.; Li, Z.; Sun, Y. An E-nose system for identification and quantification of hazardousgas mixtures using a combined strategy of CNNs and attentional mechanisms. Phys. Scr. 2024, 99, 096001. [Google Scholar] [CrossRef]
  43. Lee, B.K.; Mayhew, E.J.; Sanchez-Lengeling, B.; Wei, J.N.; Quian, W.W.; Little, K.A.; Andres, M.; Nguyen, B.B.; Yasonik, J.; Parker, J.K.; et al. A principal odor map unifies diverse tasks in olfactory perception. Science 2023, 381, 999–1006. [Google Scholar] [CrossRef]
  44. Röck, F.; Barsan, N.; Weimar, U. Electronic Nose:  Current Status and Future Trends. Chem. Rev. 2008, 108, 705–725. [Google Scholar] [CrossRef]
  45. Staerz, A.; Roeck, F.; Weimar, U.; Barsan, N.; Nose, E. Electronic Nose. Surf. Interface Sci. 2020, 9, 335–379. [Google Scholar]
  46. Sberveglieri, G.; Genzardi, D.; Greco, G.; Nunez-Carmona, E.; Pezzottini, S.; Sberveglieri, V. The Electronic Nose: Review on Sensor Arrays and Future Perspectives. Chem. Eng. Trans. 2022, 95, 265–270. [Google Scholar]
  47. Wilson, A.D. Review of Electronic-nose Technologies and Algorithms to Detect Hazardous Chemicals in the Environment. Procedia Technol. 2012, 1, 453–463. [Google Scholar] [CrossRef]
  48. Gowdhaman, P.; Venkatesan, T.; Banupriya, R.; Nimal, A.T.; Pandya, H.M. Comprehensive Review of Latest e-Nose Sensor Technologies. J. Environ. Nanotechnol. 2020, 9, 31–41. [Google Scholar] [CrossRef]
  49. Jońca, J.; Pawnuk, M.; Arsen, A.; Sówka, I. Electronic Noses and Their Applications for Sensory and Analytical Measurements in the Waste Management Plants—A Review. Sensors 2022, 22, 1510. [Google Scholar] [CrossRef]
  50. Wojnowski, W.; Dymerski, T.; Gębicki, J.; Namieśnik, J. Electronic Noses in Medical Diagnostics. Curr. Med. Chem. 2019, 26, 197–215. [Google Scholar] [CrossRef]
  51. Sanaeifar, A.; ZakiDizaji, H.; Jafari, A.; de la Guardia, M. Early detection of contamination and defect in foodstuffs by electronic nose: A review. TrAC Trends Anal. Chem. 2017, 87, 257–271. [Google Scholar] [CrossRef]
  52. Rabehi, A.; Helal, H.; Zappa, D.; Comini, E. Advancements and Prospects of Electronic Nose in Various Applications: A Comprehensive Review. Appl. Sci. 2024, 14, 4506. [Google Scholar] [CrossRef]
  53. Boeker, P. On ‘Electronic Nose’ methodology. Sens. Actuators B Chem. 2014, 204, 2–17. [Google Scholar] [CrossRef]
  54. Turner, A.; Magan, N. Electronic noses and disease diagnostics. Nat Rev. Microbiol. 2004, 2, 161–166. [Google Scholar] [CrossRef]
  55. Schaller, E.; Bosset, J.O.; Escher, F. Electronic Noses and Their Application to Food. LWT—Food Sci. Technol. 1998, 31, 305–316. [Google Scholar] [CrossRef]
  56. Chang, J.B.; Subramian, V. Electronic Noses Sniff Success. Available online: https://spectrum.ieee.org/electronic-noses-sniff-success (accessed on 29 February 2008).
  57. Gardner, J.W.; Bartlett, P.N.; Principles, E.N. Electronic Noses. Principles and Applications. Meas. Sci. Technol. 2000, 11, 1087. [Google Scholar]
  58. Hu, W.; Wan, L.; Jian, Y.; Ren, C.; Jin, K.; Su, X.; Bai, X.; Haick, H.; Yao, M.; Wu, W. Electronic Noses: From Advanced Materials to Sensors Aided with Data Processing. Adv. Mater. Technol. 2018, 4, 2. [Google Scholar] [CrossRef]
  59. Kruse, J.; Worner, J.; Schneider, J.; Dorksen, H.; Pein-Hackelbusch, M. Methods for Estimating the Detection and Quantifica-tion Limits of Key Substances in Beer Maturation with Electronic Noses. Sensors 2024, 24, 3520. [Google Scholar] [CrossRef]
  60. Örnek, Ö.; Karlık, B. An Overview of Metal Oxide Semiconducting Sensors in Electronic Nose Applications. IBU Repos. 2024, 2, 506–515. [Google Scholar]
  61. Brattoli, M.; Gennaro, G.D.; Pinto, V.D.; Loiotilde, A.D.; Lovascio, S.; Penza, M. Odour Detection Methods: Olfactometry and Chemical Sensors. Sensors 2011, 11, 5290–5322. [Google Scholar] [CrossRef]
  62. Naz, S.; Javid, I.; Konwar, S.; Singh, P.K.; Sahni, M.; Bhattacharya, B. Solid state gas sensor. Mater. Today Proc. 2021, 34, 802–812. [Google Scholar] [CrossRef]
  63. Kim, H.; Lee, J. Highly sensitive and selective gas sensors using p-type oxide semiconductors: Overview. Sens. Actuators B Chem. 2014, 192, 607–627. [Google Scholar] [CrossRef]
  64. Wang, C.; Yin, L.; Zhang, L.; Xiang, D.; Gao, R. Metal Oxide Gas Sensors: Sensitivity and Influencing Factors. Sensors 2010, 10, 2088–2106. [Google Scholar] [CrossRef]
  65. Berna, A. Metal Oxide Sensors for Electronic Noses and Their Application to Food Analysis. Sensors 2010, 10, 3882–3910. [Google Scholar] [CrossRef]
  66. Kim, Y.; Shon, I.; Shin, D.; Yoo, H.; Park, J.; Chung, S.; Kim, H. Recent Advances in Functionalization and Hybridization of Two-Dimensional Transition Metal Dichalcogenide for Gas Sensor. Adv. Eng. Mater. 2023, 26, 2301063. [Google Scholar] [CrossRef]
  67. SmartNanotubes. Available online: https://smart-nanotubes.com/ (accessed on 11 March 2025).
  68. Peters, R.; Beijer, N.; ‘t Hul, B.; Bruijns, B.; Munniks, S.; Knotter, J. Evaluation of a Commercial Electronic Nose Based on Carbon Nanotube Chemiresistors. Sensors 2023, 23, 5302. [Google Scholar] [CrossRef] [PubMed]
  69. Torad, N.L.; Ayad, M.M. Gas Sensors Based on Conducting Polymers. In Gas Sensors; IntechOpen: London, UK, 2020. [Google Scholar]
  70. Lange, U.; Mirsky, V.M. Chemiresistors based on conducting polymers: A review on measurement techniques. Anal. Chim. Acta vol. 2011, 687, 105–113. [Google Scholar] [CrossRef] [PubMed]
  71. Machungo, C.; Berna, A.Z.; McNevin, D.; Wang, R.; Trowell, S. Comparison of the performance of metal oxide and conducting polymer electronic noses for detection of aflatoxin using artificially contaminated maize. Sens. Actuators B Chem. 2022, 360, 131681. [Google Scholar] [CrossRef]
  72. Li, S.; Tang, W.; Chen, S.; Si, Y.; Liu, R.; Guo, X. Flexible Organic Polymer Gas Sensor and System Integration for Smart Packaging. Adv. Sens. Res. 2023, 2, 2300030. [Google Scholar] [CrossRef]
  73. Sierra-Padilla, A.; García-Guzmán, J.J.; López-Iglesias, D.; Palacios-Santander, J.M.; Cubillana-Aguilera, L. E-Tongues/Noses Based on Conducting Polymers and Composite Materials: Expanding the Possibilities in Complex Analytical Sensing. Sensors 2021, 21, 4976. [Google Scholar] [CrossRef]
  74. Deshmukh, S.; Bandyopadhyay, R.; Bhattacharyya; Pandey, R.; Jana, A. Application of electronic nose for industrial odors and gaseous emissions measurement and monitoring—An overview. Talanta 2015, 144, 329–340. [Google Scholar] [CrossRef]
  75. James, D.; Scott, S.M.; Ali, Z.; O’Hare, W.T. Chemical Sensors for Electronic Nose Systems. Microchim. Acta 2004, 149, 1–17. [Google Scholar] [CrossRef]
  76. Pecunia, V.; Petti, L.; Andrews, J.B.; Ollearo, R.; Gelinck, G.H.; Nasrollahi, B.; Jailani, J.M.; Li, N.; Kim, J.H.; Ng, T.N.; et al. Roadmap on printable electronic materials for next-generation. Nano Futures 2024, 8. [Google Scholar] [CrossRef]
  77. Strike, D.J.; Meijerink, M.G.; Koudelka-Hep, M. Electronic noses—A mini-review. J. Anal. Chem. 1999, 364, 499–505. [Google Scholar] [CrossRef]
  78. Hobbs, B.; Tantrum, A.; Chan-Henry, R. Liquid electrolyte fuel cells. In Techniques and Mechanisms in Gas Sensing; Moseley, P.T., Norris, I.O.W., Williams, D.E., Eds.; Taylor & Francis: Bristol, UK, 1991; pp. 161–188. [Google Scholar]
  79. Man, G.; Stoeber, B.; Walus, K. Detecting and Identifying Clandestine Drug Laboratories: Sensing Technology Assessment; Technical Report TR-04; Government of Canada Publications: Ottawa, ON, USA, 2008. [Google Scholar]
  80. Figaro Engineering. Available online: https://www.figaro.co.jp/en/technicalinfo/principle/catalytic-type.html (accessed on 11 March 2025).
  81. Yuwono, A.S.; Lammers, P.S. Odor pollution in the environment and the detection instrumentation. Agric. Eng. Int. CIGR J. Sci. Res. Dev. 2004, 6, 2. [Google Scholar]
  82. Electronic Sensor Technology. Available online: https://www.estcal.com/ (accessed on 11 March 2025).
  83. Tomandl, A.; Wolpers, M.; Ogle, K. Investigations of the kinetics of surface treatments by advanced methods. In Directorate-General for Research and Innovation; European Commission: Brussels, Belgium, 2006. [Google Scholar]
  84. Cheeke, J.; Wang, Z. Acoustic wave gas sensors. Sens. Actuators B Chem. 1999, 59, 146–153. [Google Scholar] [CrossRef]
  85. KIT—The Research University in the Helmholtz Association. Novel Detection Methods in Biological and Chemical Sensing. Available online: https://www.imt.kit.edu/m_rapp.php (accessed on 11 March 2025).
  86. Spinelle, L.; Gerboles, M.; Kok, G.; Sauerwald, T. Sensitivity of VOC Sensors for Air Quality Monitoring Within the EURAMET Key-VOC Project. In Proceedings of the Fourth Eunetair Scientific Meeting, Linköping, Sweden, 3 June 2015. [Google Scholar]
  87. Safeopedia. What is a Photoionization Detector (PID)? Available online: https://www.safeopedia.com/definition/7120/photoionization-detector-pid (accessed on 11 August 2019).
  88. Kalit, M.T.; Marković, K.; Kalit, N.; Havranek, J. Application of electronic nose and electronic tongue in the dairy industry. Mljekarstvo 2014, 64, 228–244. [Google Scholar] [CrossRef]
  89. Di Natale, C.; Salimbeni, D.; Paolesse, R.; Macagnano, A.; D’Amico, A. Porphyrins-based opto-electronic nose for volatile compounds detection. Sens. Actuators B Chem. 2000, 65, 220–226. [Google Scholar] [CrossRef]
  90. Rakow, N.A.; Suslick, K.S. A colorimetric sensor array for odour visualization. Nature 2000, 406, 710–713. [Google Scholar] [CrossRef]
  91. Tromberg, B.J.; Sepaniak, M.J.; Alarie, J.P.; Vo-Dinh, T.; Santella, R.M. Development Of Antibody-Based Fiber-Optic Sensors for detection of a benzo[a]pyrene metabolite. Anal. Chem. 1988, 60, 1901–1908. [Google Scholar] [CrossRef]
  92. Kangas, M.J.; Burks, R.M.; Atwater, J.; Lukowicz, R.M.; Williams, P.; Holmes, A.E. Colorimetric Sensor Arrays for the Detection and Identification of Chemical Weapons and Explosives. Crit. Rev. Anal. Chem. 2016, 47, 138–153. [Google Scholar] [CrossRef]
  93. Laffort, P. Models for describing intensity interactions in odor mixtures: A reappraisal. In Perception of Complex Smells and Tastes; Laing, D.G., Cam, W.S., McBride, R.L., Ache, B.W., Eds.; Academic Press: New York, NY, USA, 1989; pp. 20–223. [Google Scholar]
  94. Khan, S.; Newport, D.; Le Calvé, S. Gas Detection Using Portable Deep-UV Absorption Spectrophotometry: A Review. Sensors 2019, 19, 5210. [Google Scholar] [CrossRef]
  95. Dr. Födisch Umweltmesstechnik AG. Available online: https://www.foedisch.de/ (accessed on 11 March 2025).
  96. MSA Safety Italy. Available online: https://www.it.msasafety.com/?r=NA&locale=en (accessed on 11 March 2025).
  97. AZO Sensor. Available online: https://www.azosensors.com/article.aspx?ArticleID=1327 (accessed on 11 March 2025).
  98. Honeywell International Inc. Available online: https://www.honeywell.com/ (accessed on 11 March 2025).
  99. International Gas Detectors Ltd. Available online: https://www.internationalgasdetectors.com/ (accessed on 11 March 2025).
  100. Thermo Fisher Scientific Inc. Available online: https://www.thermofisher.com/it/en/home.html (accessed on 11 March 2025).
  101. Thermo Fisher Scientific. Gas Chromatography—How a Gas Chromatography Machine Works, How to Read a Chromatograph and GC × GC. Available online: https://www.technologynetworks.com/analysis/articles/gas-chromatography-how-a-gas-chromatography-machine-works-how-to-read-a-chromatograph-and-gcxgc-335168 (accessed on 11 March 2025).
  102. Hajšlová, J.; Čajka, T.; Chromatography, G. Gas Chromatography–Mass Spectrometry (GC–MS). In Food Toxicants Analysis; Elsevier: Amsterdam, The Netherlands, 2007; pp. 419–473. [Google Scholar]
  103. Shimadzu Corporation. Available online: https://www.shimadzu.com/ (accessed on 11 March 2025).
  104. Agilent. Available online: https://www.agilent.com/ (accessed on 11 March 2025).
  105. Kienitz, H.; Brunner, E. Experimental Thermodynamics Volume II—Reference Materials for Thermometric Fixed Points; International Union of Pure and Applied Chemistry: Zürich, Switzerland, 1968; pp. 71–85. [Google Scholar]
  106. Plasmion GmbH. Available online: https://plasmion.com/industrial-sensory-system/ (accessed on 11 March 2025).
  107. Ant Teknik. Available online: https://www.antteknik.com/tr/urun-kategori/?c=gaz-kromatografi-gc-gcms (accessed on 11 March 2025).
  108. Eiceman, G.A.; Karpas, Z.; Hill, H.H., Jr. Ion Mobility Spectrometry; CRC Press: Boca Raton, FL, USA, 2013; pp. 205–230. [Google Scholar]
  109. Maestre, R.F. Ion Mobility Spectrometry: History, Characteristics and Applications. Rev. UDCA Actual. Divulg. Científica 2012, 15, 2. [Google Scholar]
  110. Bertin Environics. Available online: https://www.environics.fi/ (accessed on 11 March 2025).
  111. Smiths Detection Group Ltd. Available online: https://www.smithsdetection.com/ (accessed on 11 March 2025).
  112. Owlstone Inc. Available online: https://www.owlstoneinc.com/ (accessed on 11 March 2025).
  113. Inst Tools. Flame Ionization Detector (FID) Principle. Available online: https://instrumentationtools.com/flame-ionization-detector-fid-principle/?utm_content=cmp-true (accessed on 11 March 2025).
  114. RAE Systems by Honeywell. The PID Handbook; Honeywell: Charlotte, NC, USA, 2013. [Google Scholar]
  115. Drägerwerk AG & Co. KGaA. Available online: https://www.draeger.com/en-us_us/Home (accessed on 11 March 2025).
  116. Ye, Z.; Liu, Y.; Li, Q. Recent Progress in Smart Electronic Nose Technologies Enabled with Machine Learning Method. Sensors 2021, 21, 7620. [Google Scholar] [CrossRef]
  117. Papp, S.; Weidinger, W.; Munro, K.; Ortner, B.; Cadonna, A.; Langs, G.; Licandro, R.; Meir-Huber, M.; Nikolić, D.; Toth, Z.; et al. The Handbook of Data Science and AI; Carl Hanser Verlag GmbH & Co. KG: Munich, Germany, 2022. [Google Scholar]
  118. Barbierato, E.; Gatti, A.; Incremona, A.; Pozzi, A.; Toti, D. Breaking Away From AI: The Ontological and Ethical Evolution of Machine Learning. IEEE Access 2025, 13, 55627–55647. [Google Scholar] [CrossRef]
  119. Chen, L.-Y.; Wu, C.-C.; Chou, T.-I.; Chiu, S.-W. Development of a Dual MOS Electronic Nose/Camera System for Improving Fruit Ripeness Classification. Sensors 2018, 18, 3256. [Google Scholar] [CrossRef] [PubMed]
  120. Fedorov, F.S.; Yaqin, A.; Krasnikov, D.V.; Kondrashov, V.A.; Ovchinnikov, G.; Kostyukevich, Y.; Osipenko, S.; Nasibulin, A.G. Detecting cooking state of grilled chicken by electronic nose and computer vision techniques. Food Chem. 2021, 350, 128747. [Google Scholar] [CrossRef] [PubMed]
  121. Domingos, P. A few useful things to know about machine learning. Commun. ACM 2012, 55, 78–87. [Google Scholar] [CrossRef]
  122. Cortes, C.; Vapnik, V. Support-vector networks. Mach. Learn. 1995, 20, 273–297. [Google Scholar] [CrossRef]
  123. Frey, B.J.; Dueck, D. Clustering by passing messages between data points. Science 2007, 315, 972–976. [Google Scholar] [CrossRef]
  124. Bishop, C.M. Pattern Recognition and Machine Learning; Springer: Berlin/Heidelberg, Germany, 2006. [Google Scholar]
  125. Castelletti, F.; Niro, F.; Denti, M.; Tessera, D.; Pozzi, A. Bayesian Learning of Causal Networks for Unsupervised Fault Diagnosis in Distributed Energy Systems. IEEE Access 2024, 12, 61185–61197. [Google Scholar] [CrossRef]
  126. Sutton, R.S.; Barto, A.G. Reinforcement Learning: An Introduction; MIT Press: Cambridge, MA, USA, 2018. [Google Scholar]
  127. Mnih, V.; Kavukcuoglu, K.; Silver, D.; Rusu, A.A.; Veness, J.; Bellemare, M.G.; Graves, A.; Riedmiller, M.; Fidjeland, A.K.; Ostrovski, G.; et al. Human-level control through deep reinforcement learning. Nature 2015, 518, 529–533. [Google Scholar] [CrossRef]
  128. Pozzi, A.; Toti, D. Imitation Learning for Agnostic Battery Charging: A DAGGER-Based Approach. IEEE Access 2023, 11, 115190–115203. [Google Scholar] [CrossRef]
  129. Matrone, S.; Pozzi, A.; Ogliari, E.; Leva, S. Deep Learning-Based Predictive Control for Optimal Battery Management in Microgrids. IEEE Access 2024, 12, 141580–141593. [Google Scholar] [CrossRef]
  130. Berthold, M.R.; Borgelt, C.; Hoppner, F.; Klawonn, F. Guide to Intelligent Data Analysis; Springer: London, UK, 2012. [Google Scholar]
  131. Li, T. Machine Learning-Based Inverse Solution for Predictions of Impact Conditions Buring Car Collisions; University of California: Berkeley, CA, USA, 2019. [Google Scholar]
  132. T. A. Team. How, When, and Why Should You Normalize/Standardize/Rescale Your Data? Available online: https://towardsai.net/p/data-science/how-when-and-why-should-you-normalize-standardize-rescale-your-data-3f083def38ff (accessed on 29 May 2020).
  133. Manthani, S. Data Normalization and Standardization. Available online: https://sathish-manthani.medium.com/data-normalization-and-standardization-7ce8cb6472ae (accessed on 31 January 2020).
  134. Burkov, A. The Hundred-Page Machine Learning Book; Andriy Burkov: Quebec City, QC, Canada, 2019. [Google Scholar]
  135. Geller, S. Normalization vs. Standardization—Quantitative Analysis. Available online: https://towardsdatascience.com/normalization-vs-standardization-quantitative-analysis-a91e8a79cebf (accessed on 5 April 2019).
  136. Shao, X.; Li, H.; Wang, N.; Zhang, Q. Comparison of Different Classification Methods for Analyzing Electronic Nose Data to Characterize Sesame Oils and Blends. Sensors 2015, 15, 26726–26742. [Google Scholar] [CrossRef] [PubMed]
  137. Estakhroueiyeh, H.R.; Rashedi, E. Detecting moldy Bread using an E-nose and the KNN classifier. In Proceedings of the 5th International Conference on Computer and Knowledge Engineering (ICCKE), Mashhad, Iran, 29–30 October 2015. [Google Scholar]
  138. Papadopoulou, O.S.; Panagou, E.Z.; Mohareb, F.R.; Nychas, G.E. Sensory and microbiological quality assessment of beef fillets using a portable electronic nose in tandem with support vector machine analysis. Food Res. Int. 2013, 50, 241–249. [Google Scholar] [CrossRef]
  139. Harifi, S.; Khalilian, M.; Mohammadzadeh, J.; Ebrahimnejad, S. Using Metaheuristic Algorithms to Improve k-Means Clustering: A Comparative Study. Rev. D’Intelligence Artif. 2020, 34, 297–305. [Google Scholar] [CrossRef]
  140. Finance, T. Support Vector Machine Algorithm Explained. 2023. Available online: https://financetrain.com/support-vector-machine-algorithm-explained (accessed on 11 March 2025).
  141. Ihl, P.D. Machine Learning Fundamentals. Available online: https://www.startupengineer.io/_repos/_transfer/data_science/06_ml_fund/ (accessed on 16 March 2021).
  142. Flomo, G. How to Cluster Images Based on Visual Similarity. Available online: https://towardsdatascience.com/how-to-cluster-images-based-on-visual-similarity-cd6e7209fe34 (accessed on 13 October 2020).
  143. Galarnyk, M. PCA Using Python (Scikit-Learn). Available online: https://towardsdatascience.com/pca-using-python-scikit-learn-e653f8989e60 (accessed on 17 November 2021).
  144. Serrano, L. Principal Component Analysis (PCA). Available online: https://www.youtube.com/watch?v=g-Hb26agBFg&t=1057s (accessed on 9 February 2019).
  145. Yan, J.; Guo, X.; Duan, S.; Jia, P.; Wang, L.; Peng, C.; Zhang, S. Electronic Nose Feature Extraction Methods: A Review. Sensors 2015, 15, 27804–27831. [Google Scholar] [CrossRef]
  146. Roussel, S.; Forsberg, G.; Steinmetz, V.; Grenier, P.; Bellon-Maurel, V. Optimisation of electronic nose measurements. Part I: Methodology of output feature selection. J. Food Eng. 1998, 37, 207–222. [Google Scholar]
  147. Sawla, S.; Analysis, L.D. Available online: https://medium.com/@srishtisawla/linear-discriminant-analysis-d38decf48105 (accessed on 5 June 2018).
  148. James, G.; Witten, D.; Hastie, T.; Tibshirani, R. An Introduction to Statistical Learning with Applications in R; Springer: Berlin/Heidelberg, Germany, 2021. [Google Scholar]
  149. Izenman, A.J. Modern Multivariate Statistical Techniques: Regression, Classification, and Manifold Learning; Springer: Berlin/Heidelberg, Germany, 2013. [Google Scholar]
  150. Blatt, R.; Bonarini, A.; Calabro, E.; Torre, M.D.; Matteucci, M.; Pastorino, U. Lung Cancer Identification by an Electronic Nose based on an Array of MOS Sensors. In Proceedings of the 2007 International Joint Conference on Neural Networks, Orlando, FL, USA, 12–17 August 2007. [Google Scholar]
  151. Aouada, S.; Zoubir, A.; See, C.M. Source detection in the presence of nonuniform noise. In Proceedings of the IEEE International Conference on Acoustics, Speech, and Signal Processing, Montreal, QC, Canada, 17–21 May 2004. [Google Scholar]
  152. Scott, S.M.; James, D.; Ali, Z. Data analysis for electronic nose systems. Microchim. Acta 2006, 156, 183–207. [Google Scholar] [CrossRef]
  153. Bhujel, S. KNN and Naïve Bayes—Data Science. Available online: https://sudipbhujel.com.np/knn-nb-classifier/ (accessed on 6 August 2020).
  154. Ungu, V.J. Biological Neural Network (BNN) to Artificial Neural Network (ANN). Available online: https://medium.com/@vjuugm18/biological-neural-network-bnn-to-artificial-neural-network-ann-91ddd0080d5 (accessed on 23 May 2020).
  155. Cassani, R. Code for a Simple MLP (Multi-Layer Perceptron). Available online: https://github.com/rcassani/mlp-example (accessed on 11 March 2025).
  156. Jain, A.; Mao, J.; Mohiuddin, K. Artificial neural networks: A tutorial. Computer 1996, 29, 31–44. [Google Scholar] [CrossRef]
  157. Haugen, J.; Kvaal, K. Electronic nose and artificial neural network. Meat Sci. 1998, 49, S273–S286. [Google Scholar] [CrossRef]
  158. Mu, A.C.; Guido, S. Introduction to Machine Learning with Python a Guide for Data Scientists; O’Reilly.: Springfield, MI, USA, 2016. [Google Scholar]
  159. SAGAS by Karlsruher Institut für Technologie (KIT). Available online: https://www.kit-technology.de/en/technology-offers/details/331 (accessed on 11 March 2025).
  160. Sensigent LLC. Available online: https://www.sensigent.com/ (accessed on 11 March 2025).
  161. EOS Aroma by Sacmi Imola Scarl. Available online: https://sacmi.com/en-US/corporate/news/5827/The-Sacmi-made-‘electronic-nose’-for-olive-oil (accessed on 11 March 2025).
  162. World Health Organization. Foodborne Diseases. Available online: https://www.who.int/health-topics/foodborne-diseases#tab=tab_1 (accessed on 11 March 2025).
  163. European Commission. Food Waste. Available online: https://www.ec.europa.eu/food/safety/food-waste_en (accessed on 11 March 2025).
  164. AirSense Analytics GmbH. Available online: https://airsense.com/en (accessed on 11 March 2025).
  165. Alpha MOS. Available online: https://www.alpha-mos.com/electronic-nose (accessed on 11 March 2025).
  166. Aryballe. Available online: https://aryballe.com/ (accessed on 11 March 2025).
  167. FOODSniffer. Available online: https://www.myfoodsniffer.com/ (accessed on 11 March 2025).
  168. GERSTEL GmbH & Co. KG. Available online: https://gerstel.com/en (accessed on 11 March 2025).
  169. The New Zealand Institute for Plant and Food Research Limited. Available online: https://www.plantandfood.com/en-nz/ (accessed on 11 March 2025).
  170. Wang, M.; Chen, Y. Electronic nose and its application in the food industry: A review. Eur. Food Res. Technol. 2024, 250, 21–67. [Google Scholar] [CrossRef]
  171. Anwar, H.; Anwar, T.; Murtaza, S. Review on food quality assessment using machine learning and electronic nose system. Biosens. Bioelectron. X 2023, 14, 100365. [Google Scholar] [CrossRef]
  172. Mordor Intelligence. Electronic Nose Market Size & Share Analysis—Growth Trends & Forecasts (2025–2030). Available online: https://www.mordorintelligence.com/industry-reports/electronic-nose-market (accessed on 11 March 2025).
  173. Portable Electronic Nose (PEN3) by AIRSENSE Analytics GmbH & PCA Technologies. Available online: https://airsense.com/en/products/portable-electronic-nose (accessed on 11 March 2025).
  174. Heracles Neo by Alpha MOS. Available online: https://www.alpha-mos.com/smell-analysis-heracles-electronic-nose (accessed on 11 March 2025).
  175. NeOse Advance by Aryballe Technologies. Available online: https://aryballe.com/our-products/device-solutions/ (accessed on 11 March 2025).
  176. GasAlertMicro 5 Series by Honeywell Analytics. Available online: https://sps.honeywell.com/us/en/products/safety/gas-and-flame-detection/portables/gasalertmicro-5-series (accessed on 11 March 2025).
  177. Sensepoint XCD RTD by Honeywell Analytics. Available online: https://sps.honeywell.com/us/en/products/safety/gas-and-flame-detection/industrial-fixed/sensepoint-xcd-rtd (accessed on 11 March 2025).
  178. Manning AirScan IRF9 by Honeywell Analytics. Available online: https://www.honeywellanalytics.com/en/products/2014/05/08/09/42/irf9-manning-airscan.
  179. Honeywell BW™ Ultra by RAE Systems RAE Systems by Honeywell. Available online: https://sps.honeywell.com/us/en/products/safety/gas-and-flame-detection/portables/honeywell-bw-ultra (accessed on 11 March 2025).
  180. TOC-750X Series by International Gas Detectors Ltd. Available online: https://www.internationalgasdetectors.com/product/750-atex-addressable-gas-detector/ (accessed on 11 March 2025).
  181. TOC-30 by International Gas Detectors Ltd. Available online: https://www.internationalgasdetectors.com/product/toc-30-analogue-gas-detector/ (accessed on 11 March 2025).
  182. POLI by International Gas Detectors Ltd. Available online: https://www.internationalgasdetectors.com/product/multi-gas-monitor-poli/ (accessed on 11 March 2025).
  183. Lonestar by Owlstone Inc. Available online: https://www.owlstoneinc.com/products/lonestar/ (accessed on 11 March 2025).
  184. Cyranose® 320 by Sensigent. Available online: https://www.sensigent.com/cyranose-320.html (accessed on 11 March 2025).
  185. eNose Aqua and QA by Sensigent. Available online: https://www.sensigent.com/enoseproducts.html (accessed on 11 March 2025).
  186. Nexis GC-2030 by Shimadzu Co. Available online: https://www.shimadzu.com/an/products/gas-chromatography/gas-chromatograph/nexis-gc-2030/index.html (accessed on 11 March 2025).
  187. GC-2010 Pro by Shimadzu Co. Available online: https://www.shimadzu.com/an/products/gas-chromatography/gas-chromatograph/gc-2010-pro/index.html (accessed on 11 March 2025).
  188. Nexis SCD-2030 by Shimadzu Co. Available online: https://www.shimadzu.com/an/products/gas-chromatography/gc-accessories-components/nexis-scd-2030/index.html (accessed on 11 March 2025).
  189. GCMS-TQ8050 NX by Shimadzu Co. Available online: https://www.shimadzu.com/an/products/gas-chromatograph-mass-spectrometry/triple-quadrupole-gc-msms/gcms-tq8050-nx/index.html (accessed on 11 March 2025).
  190. GCMS-TQ8040 NX by Shimadzu Co. Available online: https://www.shimadzu.com/an/products/gas-chromatograph-mass-spectrometry/triple-quadrupole-gc-msms/gcms-tq8040-nx/index.html (accessed on 11 March 2025).
  191. GCMS-QP2010 SE by Shimadzu Co. Available online: https://www.shimadzu.com/an/products/gas-chromatograph-mass-spectrometry/single-quadrupole-gc-ms/gcms-qp2010-se/applications.html (accessed on 11 March 2025).
  192. Multi-Dimensional GC/GCMS System by Shimadzu Co. Available online: https://www.shimadzu.com/an/products/gas-chromatography/gc-accessories-components/advanced-flow-technology-series/index.html (accessed on 11 March 2025).
  193. TD-30 Series by Shimadzu Co. Available online: https://www.shimadzu.com/an/products/gas-chromatograph-mass-spectrometry/gc-ms-system/td-30-series/index.html (accessed on 11 March 2025).
  194. 7000D Triple Quadrupole GC/MS by Agilent. Available online: https://www.agilent.com/en/product/gas-chromatography-mass-spectrometry-gc-ms/gc-ms-instruments/7000d-triple-quadrupole-gc-ms (accessed on 11 March 2025).
  195. 7010D Triple Quadrupole GC/MS by Agilent. Available online: https://www.agilent.com/en/product/gas-chromatography-mass-spectrometry-gc-ms/gc-ms-instruments/7010d-triple-quadrupole-gc-ms (accessed on 11 March 2025).
  196. 7250 GC/Q-TOF by Agilent. Available online: https://www.agilent.com/en/product/gas-chromatography-mass-spectrometry-gc-ms/gc-ms-instruments/7250-gc-q-tof (accessed on 11 March 2025).
  197. 8860 GC System by Agilent. Available online: https://www.agilent.com/en/product/gas-chromatography/gc-systems/8860-gc-system (accessed on 11 March 2025).
  198. Intuvo 9000 GC System by Agilent. Available online: https://www.agilent.com/en/product/gas-chromatography/gc-systems/intuvo-9000-gc-system (accessed on 11 March 2025).
  199. 8890 GC System by Agilent. Available online: https://www.agilent.com/en/product/gas-chromatography/gc-systems/8890-gc-system (accessed on 11 March 2025).
  200. 7890B GC System by Agilent. Available online: https://www.agilent.com/en/product/gas-chromatography/gc-systems/7890b-gc-system (accessed on 11 March 2025).
  201. 7820A GC System by Agilent. Available online: https://www.agilent.com/en/product/gas-chromatography/gc-systems/7820a-gc-system (accessed on 11 March 2025).
  202. 5977C GC/MSD by Agilent. Available online: https://www.agilent.com/en/product/gas-chromatography-mass-spectrometry-gc-ms/gc-ms-instruments/5977c-gc-msd (accessed on 11 March 2025).
  203. SICRIT® Ionization by Plasmion GmbH. Available online: https://plasmion.com/technology/ (accessed on 11 March 2025).
  204. Altitude Technologies Ltd. Sensly—A Smart, Portable Pollution Sensor for Your Home by Altitude Tech Ltd.—Kickstarter. Available online: https://www.kickstarter.com/projects/sensly/sensly-a-smart-portable-pollution-sensor-for-your (accessed on 11 March 2025).
  205. IQAir. AirVisual Series Air Quality Monitors. Available online: https://www.iqair.com/commercial-air-quality-monitors (accessed on 11 March 2025).
  206. MyDx. Available online: https://www.mydxlife.com/ (accessed on 11 March 2025).
  207. Atmotech Inc. Available online: https://atmotube.com/ (accessed on 11 March 2025).
  208. Sensit Technologies. Available online: https://gasleaksensors.com/it/ (accessed on 11 March 2025).
  209. SGX Sensortech. Available online: https://www.sgxsensortech.com/ (accessed on 11 March 2025).
  210. Gentex (Ex-Vaporsense). Available online: https://www.gentex.com/ (accessed on 11 March 2025).
  211. Sciosense, B.V. Available online: https://www.sciosense.com/ (accessed on 11 March 2025).
  212. Roboscientific. Available online: https://www.roboscientific.com/ (accessed on 11 March 2025).
  213. AerNos Inc. Available online: https://www.aernos.com/ (accessed on 11 March 2025).
  214. Noze. Available online: https://www.noze.ca/ (accessed on 11 March 2025).
  215. Muñoz, R.; Sivret, E.C.; Parcsi, G.; Lebrero, R.; Wang, X.; Suffet, I.H.; Stuetz, R.M. Monitoring Techniques for Odour Abatement Assessment. Water Res. 2010, 44, 5129–5149. [Google Scholar] [CrossRef] [PubMed]
  216. PCA Technologies. Available online: https://www.pcatechnologies.com/en (accessed on 11 March 2025).
  217. Envirosuite Ltd. Available online: https://envirosuite.com/ (accessed on 11 March 2025).
  218. Pem-Tech Inc. Available online: https://www.pem-tech.com/ (accessed on 11 March 2025).
  219. Sensidyne LP. Available online: https://sensidyne.com/ (accessed on 11 March 2025).
  220. Crowcon Detection Instruments Ltd. Available online: https://www.crowcon.com/ (accessed on 11 March 2025).
  221. Teledyne Gas and Flame Detection. Available online: https://www.teledynegasandflamedetection.com/en-us (accessed on 11 March 2025).
  222. NASA—Jet Propulsion Laboratory—California Institute of Technology. Available online: https://enose.jpl.nasa.gov/ (accessed on 11 March 2025).
  223. Proengin. Available online: https://www.proengin.com/en/ (accessed on 11 March 2025).
  224. European Commission—CORDIS. Monitoring Networks and Autonomous Platforms for Odor Impact Assessment Using Electronic Noses. Available online: https://cordis.europa.eu/project/id/101033564 (accessed on 11 March 2025).
  225. Li, Y.; Wei, X.; Zhou, Y.; Wang, J.; You, R. Research progress of electronic nose technology in exhaled breath disease analysis. Microsyst. Nanoeng. 2023, 9, 129. [Google Scholar] [CrossRef] [PubMed]
  226. Cipriano, D.; Capelli, L. Evolution of Electronic Noses from Research Objects to Engineered Environmental Odour Monitoring Systems: A Review of Standardization Approaches. Biosensors 2019, 9, 75. [Google Scholar] [CrossRef]
  227. Zanotti, M.; Freddi, S.; Sangaletti, L. Physical Virtualization of a GFET for a Versatile, High-Throughput, and Highly Discriminating Detection of Target Gas Molecules at Room Temperature. Adv. Mater. Technol. 2024, 10, 2400985. [Google Scholar] [CrossRef]
  228. Huang, S.; Croy, A.; Panes-Ruiz, L.A.; Khavrus, V.; Bezugly, V.; Ibarlucea, B.; Cuniberti, G. Machine Learning-Enabled Smart Gas Sensing Platform for Identification of Industrial Gases. Adv. Intell. Syst. 2022, 4, 2200016. [Google Scholar] [CrossRef]
  229. Cheng, J.; Sun, R.; Shi, L.; Dai, C. An effective method fusing electronic nose and fluorescence hyperspectral imaging for the detection of pork freshness. Food Biosci. 2024, 59, 103880. [Google Scholar] [CrossRef]
  230. Cho, S.-Y.; Jung, H.-T. Artificial Intelligence: A Game Changer in Sensor Research. ACS Sens. 2023, 8, 1371–1372. [Google Scholar] [CrossRef]
  231. Masson, J.-F. Roadmap for the Use of Machine Learning and Artificial Intelligence in Sensing. ACS Sens. 2024, 9, 3805–3807. [Google Scholar] [CrossRef]
Figure 1. Published documents containing “e-nose” OR “sensor array” OR “electronic nose” in the title (cyan). Published documents containing “e-nose” OR “sensor array” OR “electronic nose” AND “food” in the title/abstract/keyword (blue). Inset: Relative weight of e-nose application in the food sector. Source: Scopus.
Chemosensors 13 00181 g001
Figure 2. Published documents containing “gas sensor” AND “machine learning” in the title (pink). Published documents containing “gas sensor” AND “machine learning” AND “food” in the title (purple). Inset: Relative weight of machine learning approaches in the field of gas sensing over the last 35 years. Source: Scopus.
Chemosensors 13 00181 g002
Figure 3. Analogy between a biological olfactory system (grey boxes) and the structure of an e-nose (blue and orange boxes).
Chemosensors 13 00181 g003
Figure 4. Distribution of sensor types for e-nose devices available on the market. MOS = metal oxides sensors, CP = conductive polymer; EC = electrochemical; CB = catalytic bead; QCM = quartz crystal microbalance; SAW = surface acoustic wave; PID = photoionization detector; FID = flame ionization detector; Opt = optical; UV = ultraviolet; IR = infrared; NDIR = non-dispersive infrared; FTIR = Fourier-transform infrared; GC = gas chromatography; MS = mass spectrometry; IMS = ion mobility spectrometry.
Chemosensors 13 00181 g004
Figure 5. Working principle of sensors employed in e-nose devices.
Chemosensors 13 00181 g005
Figure 6. Schematic of the concepts of artificial intelligence, machine learning, and deep learning.
Chemosensors 13 00181 g006
Figure 7. Overview of machine learning paradigms and their main subcategories. Machine learning is broadly categorized into supervised learning, unsupervised learning, and reinforcement learning. Supervised learning includes classification (e.g., decision trees, support vector machines, LDA) and regression (e.g., linear regression, neural networks). Unsupervised learning consists of clustering (e.g., k-means, hierarchical clustering, DBS) and dimensionality reduction (e.g., principal component analysis, t-SNE, U-MAP). Reinforcement learning enables decision-making through trial and error, with typical applications such as training autonomous agents in robotics and optimizing strategies in game playing.
Chemosensors 13 00181 g007
Figure 8. Illustration of the Linear Discriminant Analysis (LDA) process for dimensionality reduction and classification. (a) Initial dataset: The original dataset consists of two classes, represented by blue and green points, distributed in a high-dimensional space. (b) Projection onto an arbitrary axis as represented by the red arrows; (c) Finding the optimal discriminant axis; (d) Projection onto the optimal axis.
Chemosensors 13 00181 g008
Figure 9. (a) Structure of a biological neuron. (b) Single-layer perceptron model. (c) Multi-layer perceptron model.
Chemosensors 13 00181 g009
Figure 10. Distribution of commercially available e-nose models according to the application areas declared by the manufacturing company.
Chemosensors 13 00181 g010
Figure 11. Analysis of data on e-noses for food and beverages retrieved from Ref. [170]. (a) Top 10 food types; (b) Top 10 analytical methods; (c) Most-used sensors in e-noses; (d) Sensor usage by food category. The color for each sensor type is the same as in (c).
Chemosensors 13 00181 g011
Disclaimer/Publisher’s Note: The statements, opinions and data contained in all publications are solely those of the individual author(s) and contributor(s) and not of MDPI and/or the editor(s). MDPI and/or the editor(s) disclaim responsibility for any injury to people or property resulting from any ideas, methods, instructions or products referred to in the content.

