Article

Study on the Geographic Traceability and Growth Age of Panax ginseng C. A. Meyer Base on an Electronic Nose and Fourier Infrared Spectroscopy

1
College of Horticulture, Jilin Agricultural University, Changchun 130118, China
2
College of Medical Information, Changchun University of Chinese Medicine, Changchun 130117, China
3
Key Laboratory of Bionic Engineering, Ministry of Education, Jilin University, Changchun 130022, China
4
School of Mechanical and Aerospace Engineering, Jilin University, Changchun 130022, China
5
School of Business, Computing and Applied Sciences, University of Gloucestershire, The Park, Cheltenham GL50 2RH, UK
*
Author to whom correspondence should be addressed.
Chemosensors 2025, 13(5), 176; https://doi.org/10.3390/chemosensors13050176 (registering DOI)
Submission received: 1 March 2025 / Revised: 22 April 2025 / Accepted: 6 May 2025 / Published: 10 May 2025

Abstract

:
During ginseng selection, marketing promotion, and sales, it is imperative to expeditiously differentiate the overall quality grades, identify the geographic traces and determine the growth ages. This facilitates the selection of the most appropriate quality grade for each product, thereby ensuring the most efficacious marketing strategy. In this study, a new method is proposed and developed for the classification of ginsengs with diverse geographical traceability and with various growth ages by combining an electronic nose (E-nose) system and machine learning with Fourier-transform infrared spectroscopy (FTIR) as a calibration technology. An investigation has been carried out to discover the differences in the secondary metabolites and odor of three types of ginseng with different geographic traceability and three growth ages of ginseng from the same geographic traceability site. In the proposed method, five types of ginseng samples have been successfully tested. The optimal Mean-SVM model combined with an E-nose system classified ginseng samples with different geographic traceability and different growth years with accuracies of 100% and 82% in the training and test sets, respectively. These results have significant implications for ginseng’s geographic traceability, growth age determination, and overall quality control. It is believed that the future implementation of the proposed method would significantly protect the health and economic interests of consumers as well as promoting the use of an E-nose in the market surveillance of consumable products such as ginseng and other foods.

1. Introduction

Panax ginseng C. A. Mey is a perennial herb in the family Araliaceae [1]. Ginseng is renowned for its medicinal properties. The cultivation and processing of ginseng have a long and extensive history, with records of its use dating back millennia [2]. Ginseng is a botanical specimen that contains a variety of chemical components, including ginsenosides, volatile oils, polysaccharides, amino acids, lignans, and minerals [3]. Saponins represent the predominant bioactive compounds in ginseng, with the capacity of impeding the production of reactive oxygen species and nitric oxide, whilst concomitantly facilitating blood circulation [4,5]. The pharmacological significance of ginseng has been confirmed by previous studies. Different parts of ginseng contain hundreds of ginsenosides, which have a variety of effects, including anti-inflammatory [6], anti-cancer [7], and anti-diabetic properties [8]. The ingestion of ginseng by people on a daily basis has been demonstrated to enhance immunity, improve resistance, and regulate physiological functions. Sathya et al. conducted a differential analysis of total phenols, saponins, and other related substances in ginseng samples from three different geographic traceability sites in northeastern China [9]. This analysis revealed significant variations among the ginseng samples, which were found to be closely associated with their respective growing areas, growing environments, and cultivation techniques. Furthermore, Dai et al. demonstrated that the ginsenoside content in ginseng tends to accumulate gradually with the number of growth years [10]. Ginseng undergoes significant changes in its active ingredient content, chemical activity, and efficacy due to the specific growing environment and age of growth [11]. It is imperative that a rapid and precise identification process be established for the geographic traceability of ginsengs, as well as the growth years.
Previous studies have proved that the geographical traceability and growth years of ginseng directly impact the main components of ginseng. Alkanes and alcohols are reported to be the main volatile organic components (VOCs) in ginseng. The alkanes and alcohols have been shown to increase with the increase in total saponins and crude polysaccharides, which directly affected the release of alkanes and alcohols [12]. People often subjectively classify ginseng by its aroma. Still, people’s sense of smell is mostly similar with the aroma of ginseng, so they cannot distinguish it objectively and accurately, resulting in incorrect judgment. Nowadays, there are well-established technical methodologies for analyzing the geographic traceability and growth years of ginseng by saponins and phenols, the main components of ginseng, including high-performance liquid chromatography (HPLC), gas chromatography–mass spectrometry (GC–MS), liquid chromatography–mass spectrometry (LC–MS), Fourier-transform infrared spectroscopy (FTIR), and Raman spectra (Raman), amongst others [13,14,15]. However, these methods are not widely used due to their reliance on larger analytical instruments, high input costs, and cumbersome technical operations. Among these methods, FTIR is currently one of the most popular detection techniques used for the identification of ginseng due to its superior response in terms of sample identification and molecular structure analysis. Zhang et al. analyzed the differences in the content of constituents between the fibrous roots and rhizomatous roots of ginseng using FTIR and two-dimensional infrared correlation spectroscopy. The results demonstrated that the calcium oxalate and starch contents of the rhizomatous roots varied with the number of years of growth [16]. Han et al. successfully identified ginseng from 10 origins using FTIR, second-order derivative spectroscopy (SD-IR) double-indexed sequence analysis (DISA), and two-dimensional infrared correlation spectroscopy (2D-IR-COS) [17]. Despite the evident benefits of FTIR in terms of cost and operational efficiency, it must be noted that this method does not permit the execution of rapid and non-destructive detection. Non-destructive testing has been of great interest for the identification of Chinese herbal medicines such as ginsengs. The E-nose represents a recent innovation in detection technology, which has been developed for the purpose of emulating the mammalian olfactory organ. This has been achieved by means of a combination of machine learning with qualitative and quantitative analysis of the detected gases [18]. Aunsa-Ard et al. conducted an analysis of the aroma of coffee beans from different sources. This analysis was carried out using an E-nose system combined with a principal component analysis (PCA) algorithm. The results of this study demonstrated that E-nose technology exhibited an excellent detection ability in differentiating the aroma of coffees from varying altitudes and those that underwent different processing and roasting processes [19]. Li et al. utilized a homemade E-nose system in conjunction with pattern recognition to achieve 100% recognition accuracy in the classification of six groups of morphologically similar herbs [20]. In the context of ginseng selection and sale, it is imperative to expeditiously differentiate between overall quality grades, identify geographic traceability, and determine the age of the ginseng. This will ensure that the most appropriate grade is selected for each ginseng product, thus facilitating the most effective marketing strategy. The employment of the E-nose system, which boasts the advantages of rapid, non-destructive, and accurate detection, in the classification of ginseng quality is of great significance to the supervision of the Chinese herbal medicine market.
In this study, five types of ginsengs with different qualities were analyzed: (1) The ginseng samples were identified by FTIR. (2) Volatile gases were collected from the ginseng by an E-nose system. (3) The optimal model combined with the E-nose was selected to classify the ginseng quality grade. The objective of this study was to establish a non-destructive, precise, and objective method of distinguishing between the geographic traceability and the age of ginseng by means of the E-nose system, and to provide a new detection means for the supervision of the Chinese herbal medicines market.

2. Materials and Methods

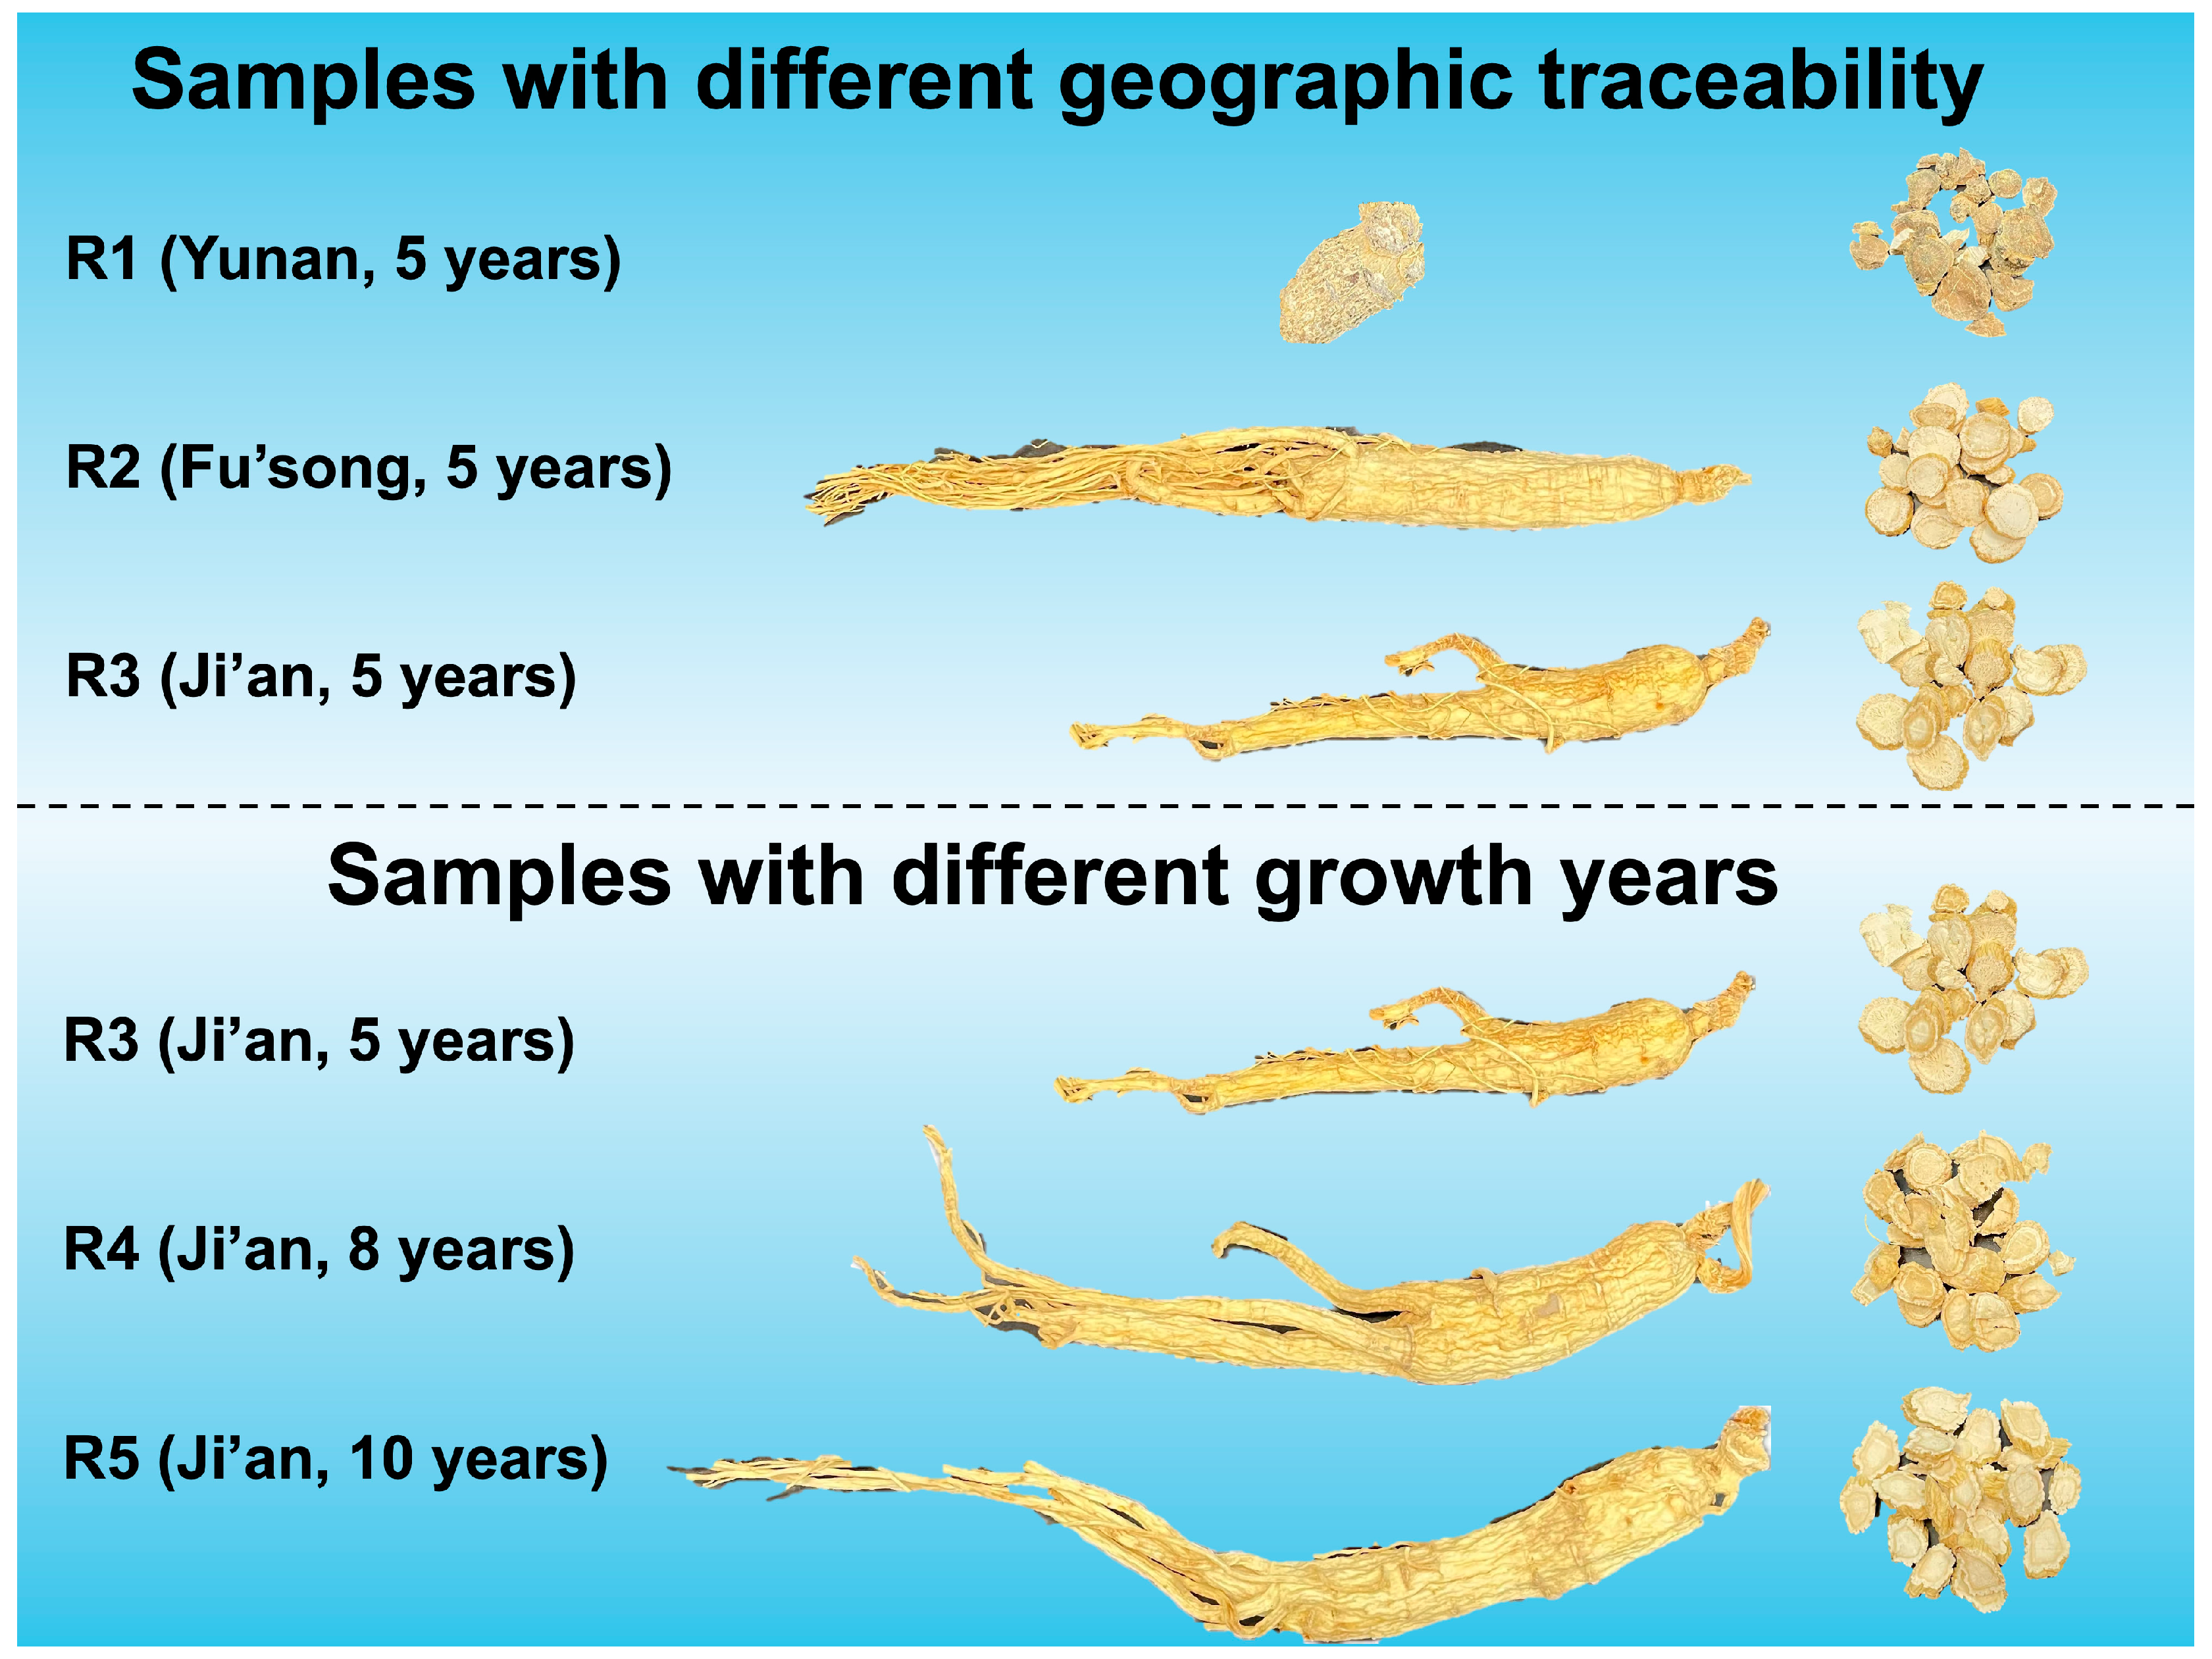
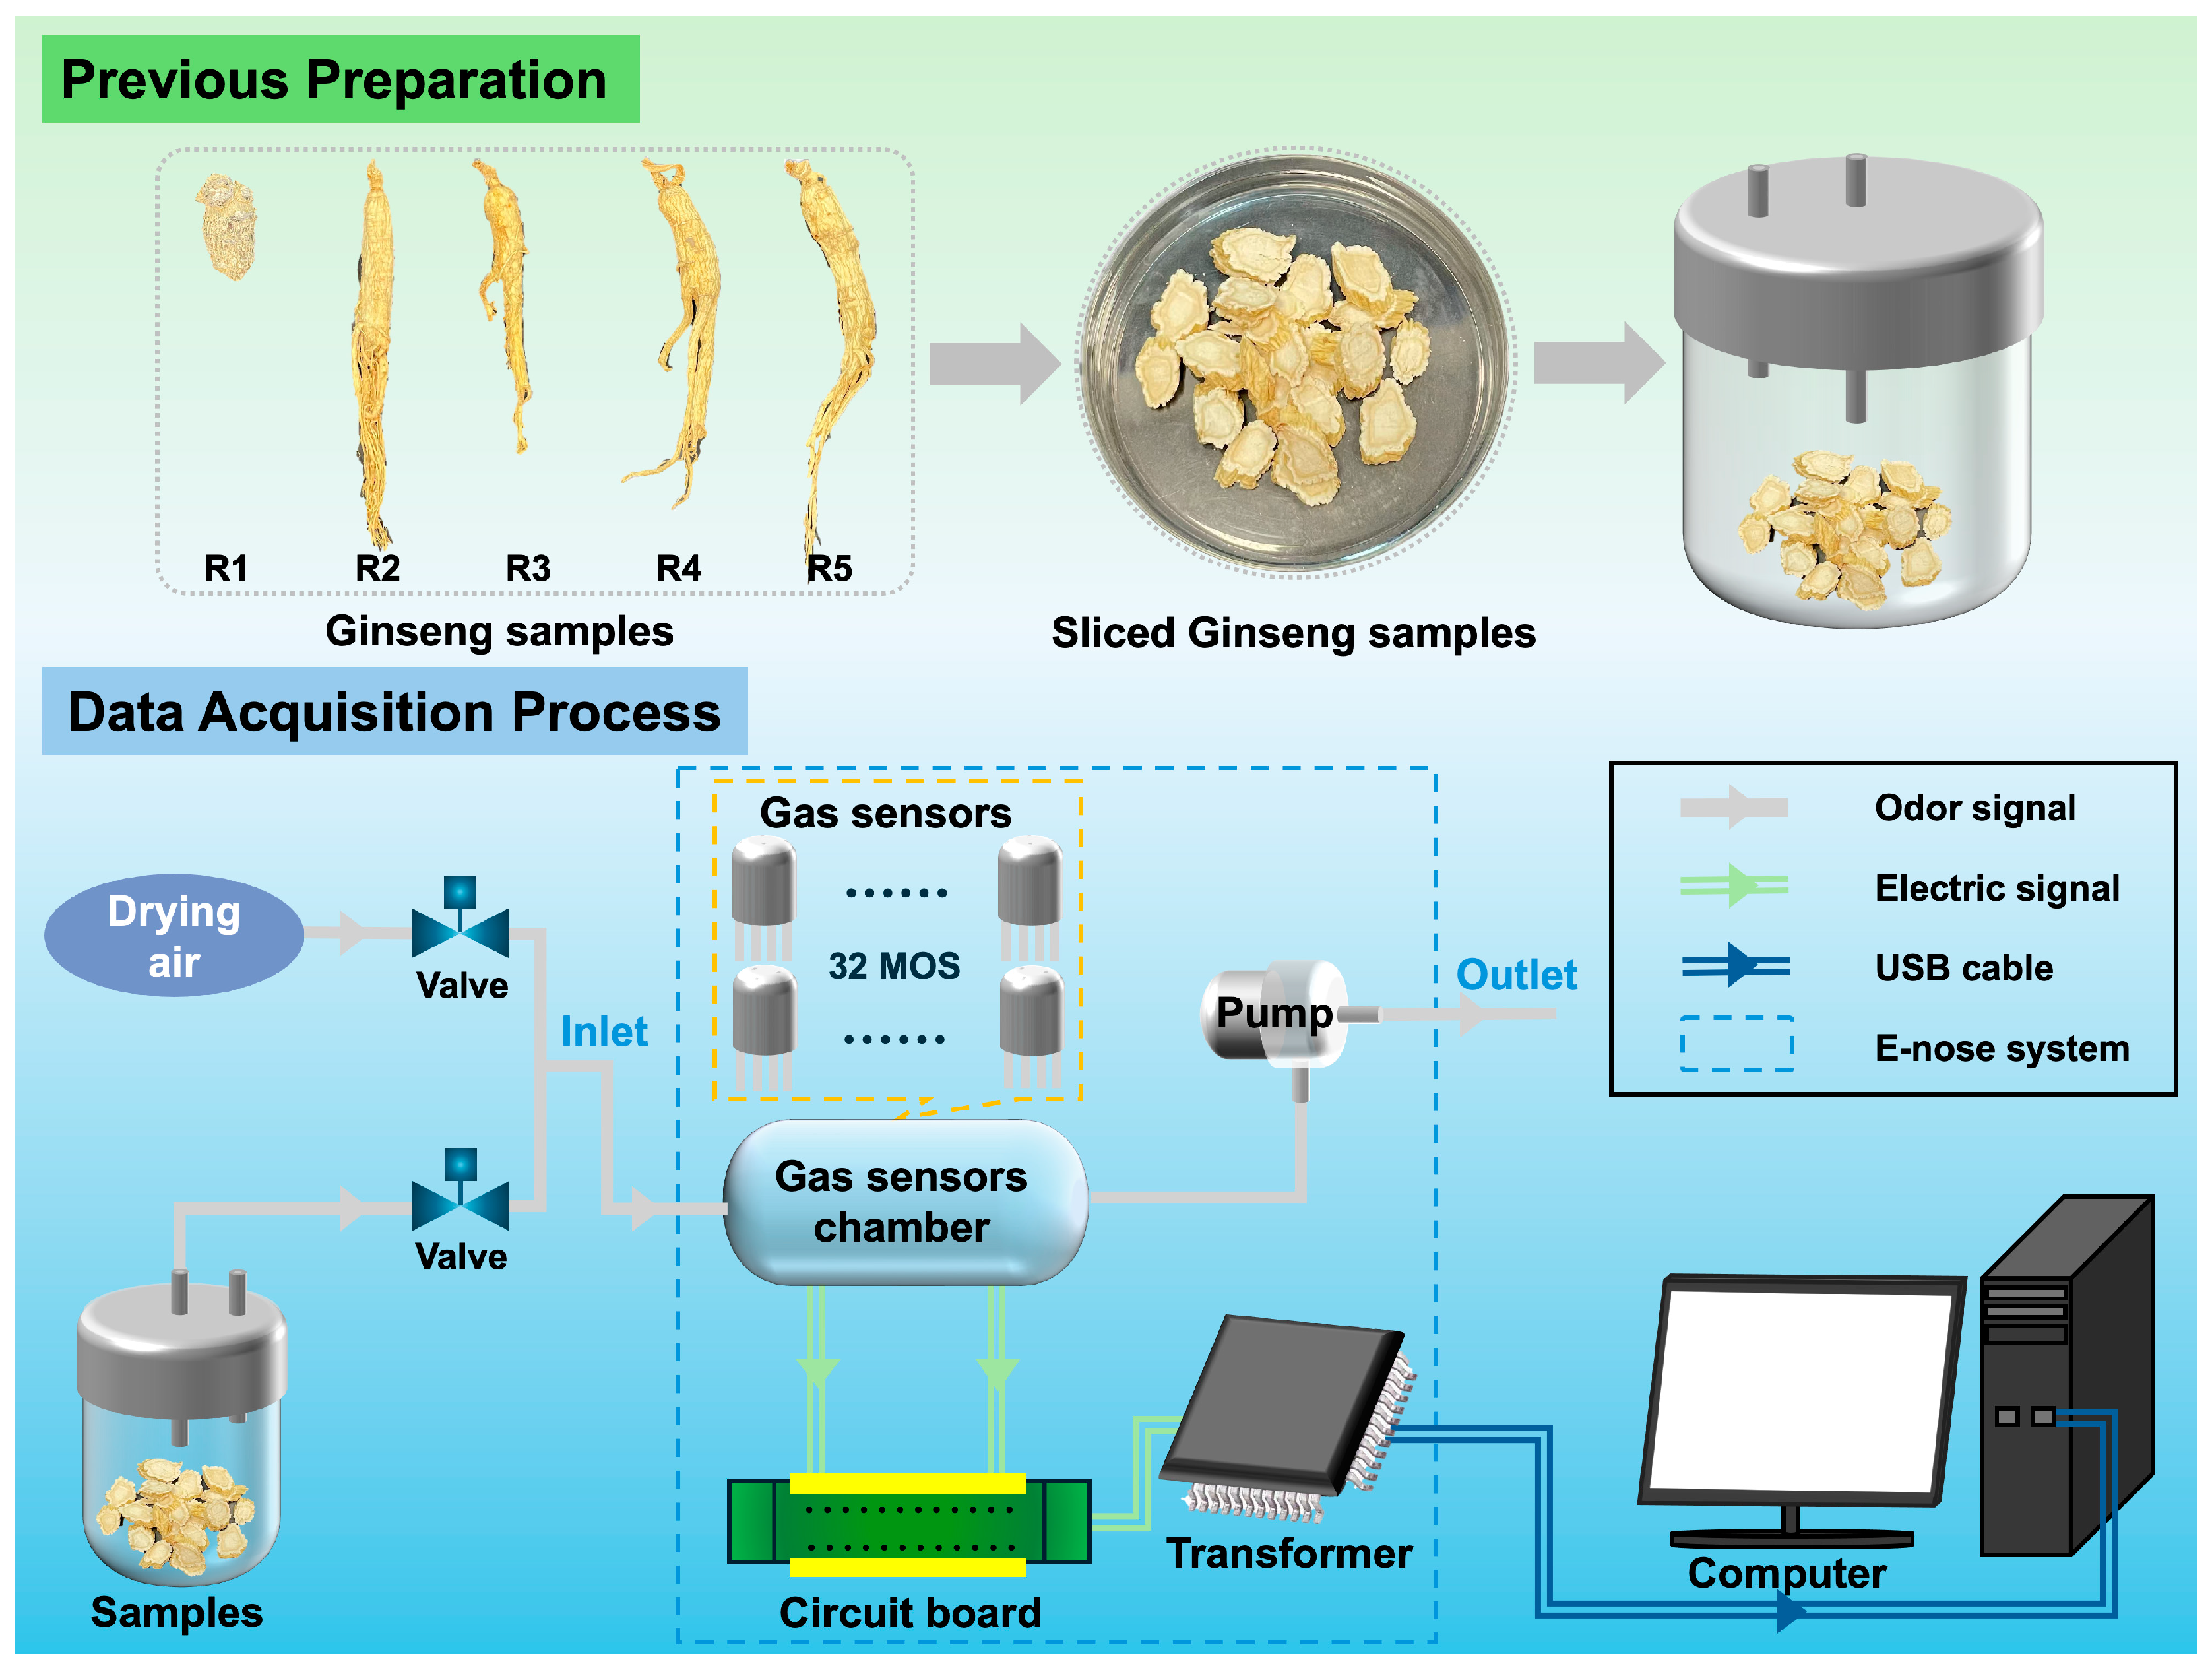
2.1. Samples Selection and Preparation

The five types of ginseng samples were selected from three different production areas in China, namely Ji’an, Jilin Province, Fu’song, Jilin Province, and Yunnan Province. The basic environmental information of the three production areas are shown in Table 1. Five-year-growth-age ginseng samples from three regions were used for analysis of different geographic traceability. Among them, three different growth ages were collected for the ginseng produced in Ji’an, namely less than 5 years, 8 years, and 10 years. The ginseng samples are shown in Figure 1. Despite the differences in the overall appearance of some samples, the experiment is still significant because consumers mostly buy ginseng products that have been sliced or ground into powder. The ginseng samples were sliced and crushed prior to assay preparation. The five different ginseng samples were used to facilitate FTIR and E-nose detection. Each type of ginseng sample was divided into 30 servings (20 g per serving) for E-nose detection, yielding a total of 150 datasets from the five ginseng varieties. Furthermore, the samples were required to produce sufficient VOCs for E-nose detection within a constrained timeframe. The samples were thoroughly washed, dried at 45 °C for 12 h, and then sealed for preservation. Detailed parameters for all five ginseng varieties are provided in Table 2.

2.2. FTIR

In this study, the full chemical composition of the samples was determined by FTIR spectra (IRAffinity-1, Shimadzu, Japan), which reflected the major secondary metabolites of the ginseng samples. Before starting the experiment, the samples were dried and ground. This was carried out to produce a powder form. Ginseng samples were dried in an oven at 45 °C for 4 h. For FTIR analysis, 0.015 g of dried sample was homogenized with 0.165 g of KBr using an agate mortar and pestle. Grinding was performed rapidly (<2 min) to achieve a fine powder with a particle size of <2 µm. The mixture was pressed into tablets at a maximum pressure of 15 MPa, with a tablet permeability of 60–70% [21]. Spectral data were acquired using the IRsolution software 1.50 (Windows operating system). A total of 32 scans were added in the 4000–400 cm−1 region with a FTIR spectral resolution of 4 cm−1. The samples were analyzed by observing the peaks in the FTIR spectra presented by the relevant molecular structures of the samples.

2.3. E-Nose

To analyze the quality of ginseng, 20 g ginseng samples were weighed and placed in a 1 L glass container, which was then sealed with a plastic wrap. It was advised that the glass be left to stand for a period exceeding 20 min to ensure the maintenance of a stable gas balance within the beaker. Subsequently, zero gas (indoor air filtered by activated carbon) was pumped into the cleaning channel, and the sensor was reset. The sampling frequency was 100 Hz (100 digital points per second). The sampling time of each sample was 60 s, and a total of 6000 digital points were collected per sample. According to previous studies and analyses of VOCs in ginseng, a total of 91 compounds have been identified, belonging to seven chemical classes: terpenes, acids, esters, alcohols, aromatic hydrocarbons, aldehydes, and alkanes [22]. In order to obtain more data, an E-nose system consisting of an array of 32 MOS sensors each was selected for sampling. The E-nose system was developed by the Key Laboratory of Engineering Bionics of the Ministry of Education, Jilin University, China. For the experimental study, the process of sampling by the E-nose is shown in Figure 2. In this study, the maximum value (Max), mean value (Mean), and wavelet transform (WT) were utilized for the purpose of feature extraction from the E-nose response data.

2.4. Data Processing and Analysis

FTIR spectral data were processed using Origin 2021 software. Inter-sample differences were evaluated using the Spearman correlation coefficient analysis, chosen for its robustness with non-parametric spectral data distributions. The E-nose response data were analyzed using the R programming language (version 4.2.3) for feature extraction and pattern recognition. To objectively establish the ginseng grade identification model, the 150 datasets were randomly split into training and test sets. The training set was designed to encompass sufficient samples to reflect data diversity, while the test set consisted entirely of unseen data to ensure unbiased model evaluation [1]. Accordingly, an 80:20 split (training/test) was adopted. Additionally, 40 datasets were allocated as a validation subset for subgroup analysis, enabling further assessment of the model’s classification accuracy. Furthermore, the accuracy of ginseng grade differentiation was visualized using confusion matrix plots.

3. Results and Discussion

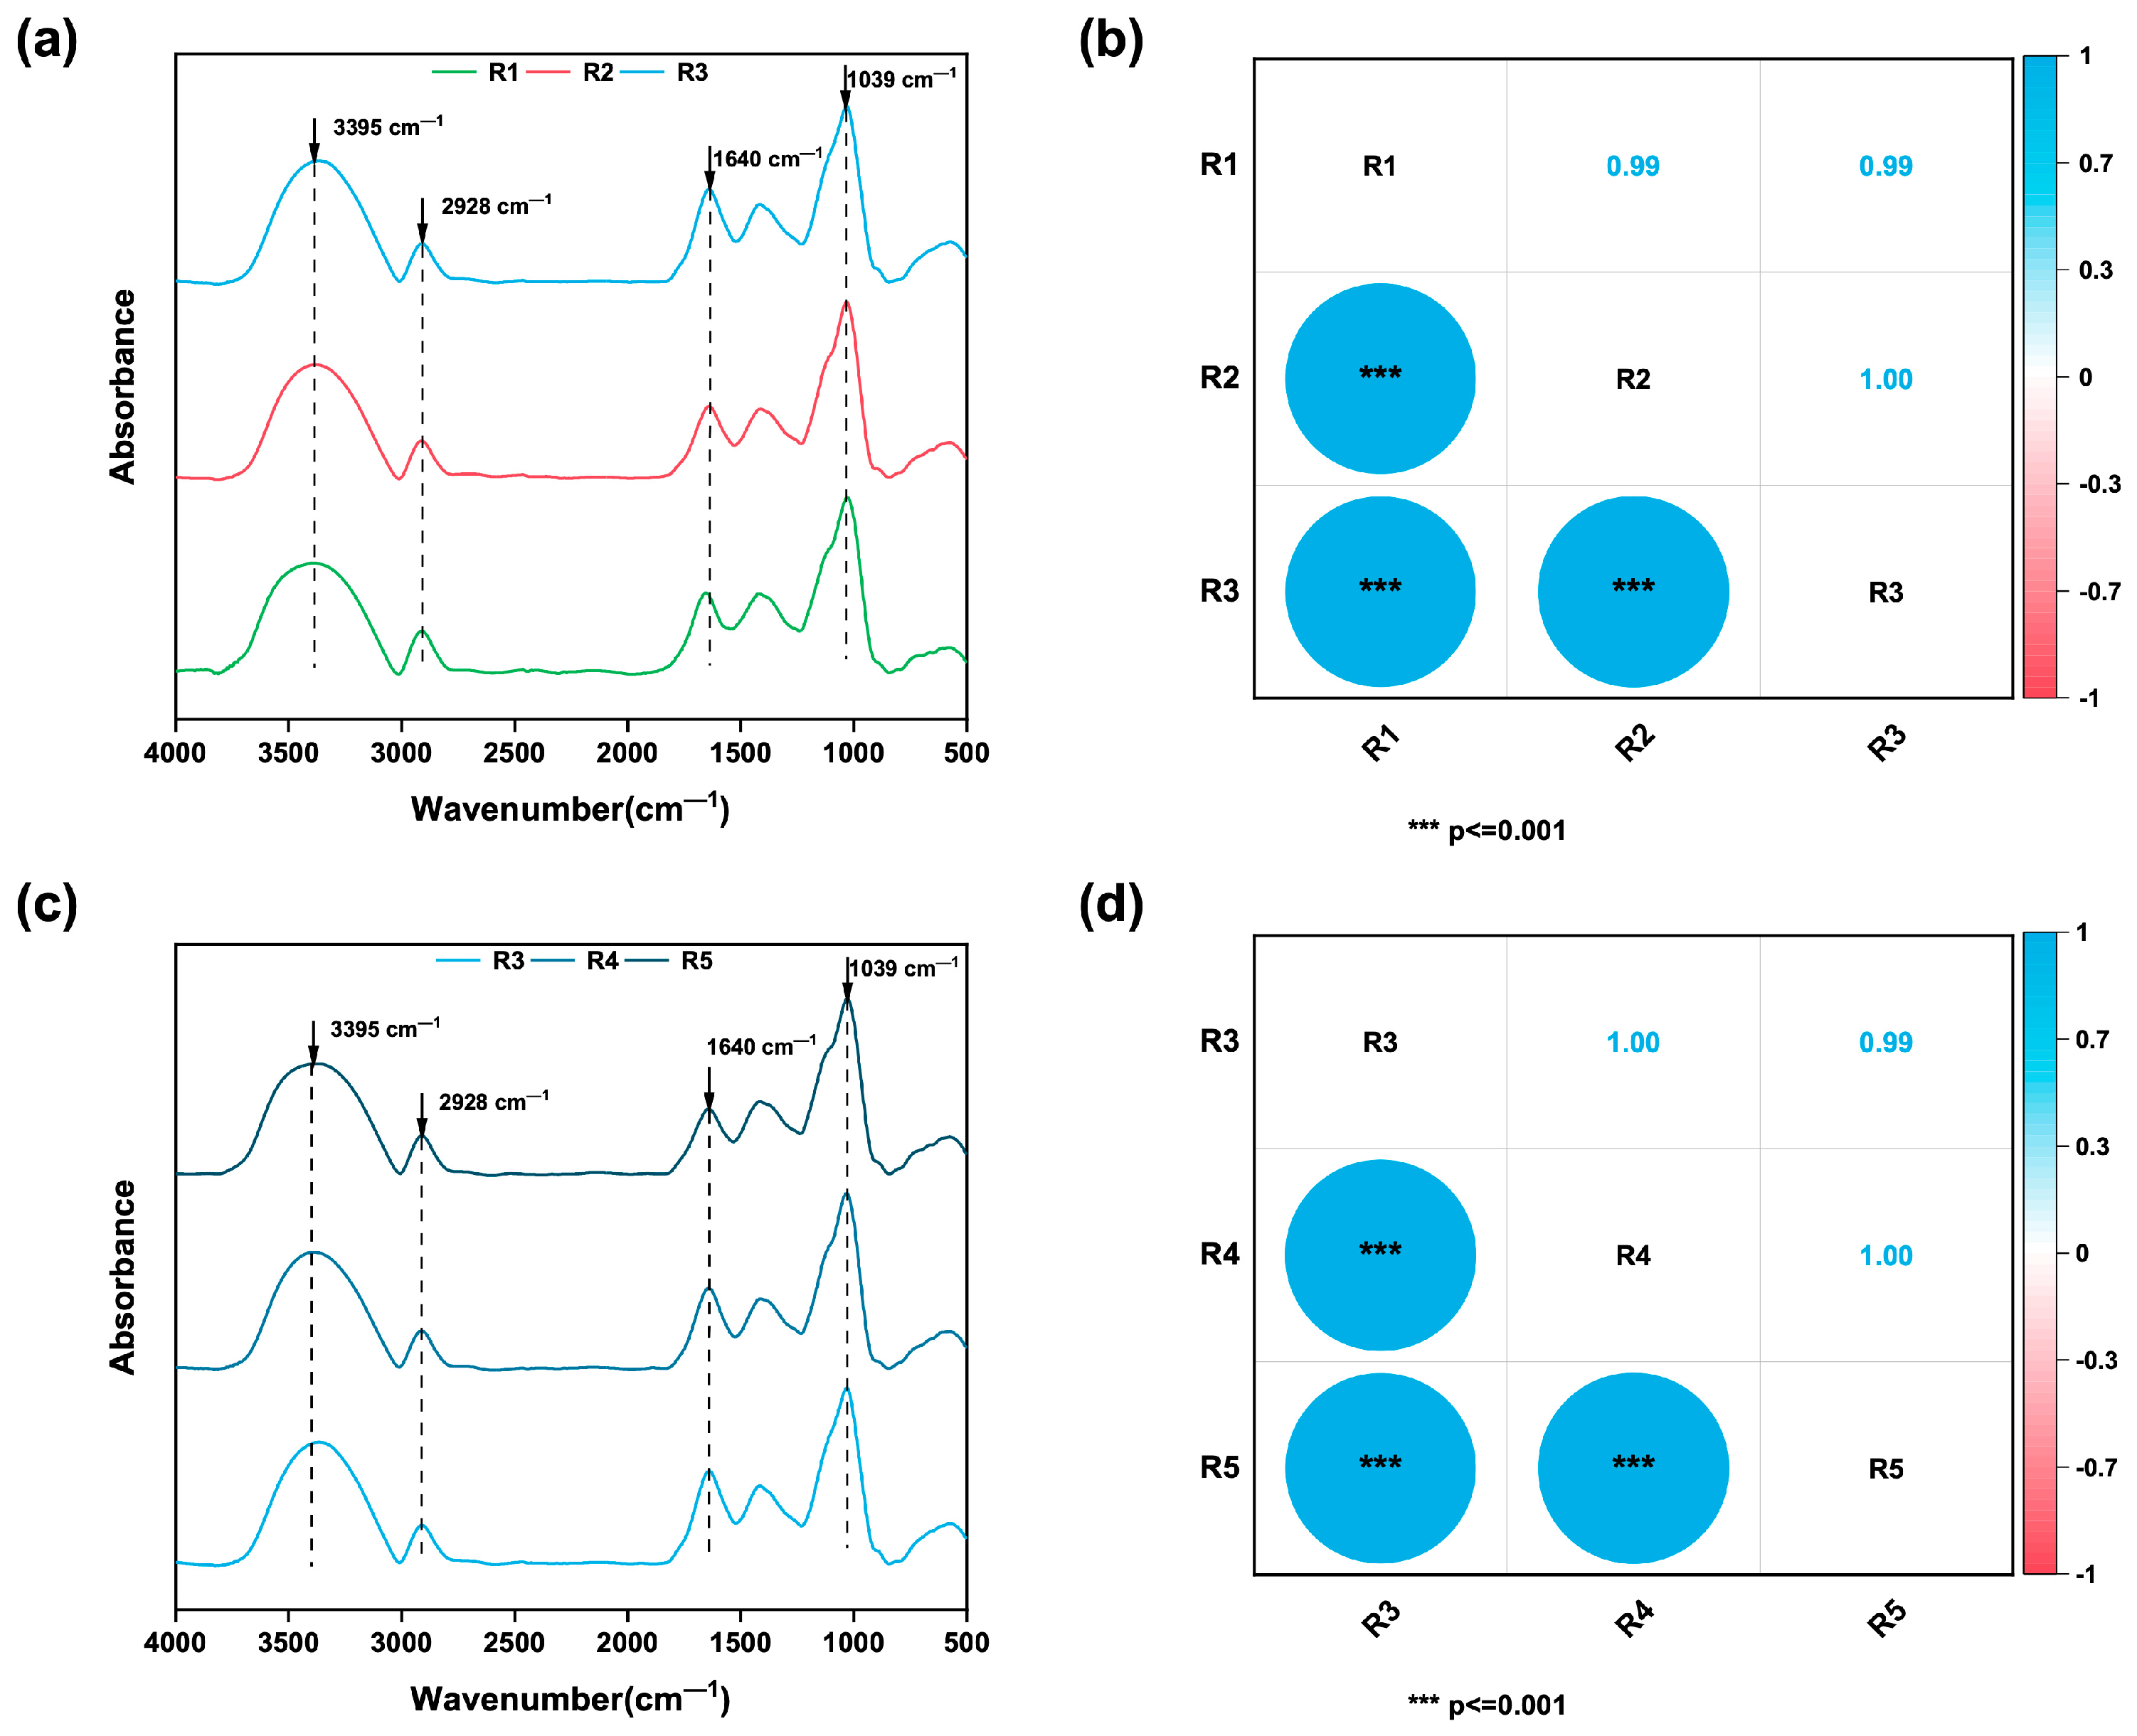
3.1. FTIR Spectra Analsis

The FTIR spectra analysis shows that ginsengs with different geographic traceability and varying years of growth generally have similar peaks. An analysis of the spectrum revealed the presence of numerous common absorption peaks at 3395 cm−1, 2928 cm−1, 1640 cm−1, and 1039 cm−1. Infrared spectral data were processed using three sequential methods: (1) Savitzky–Golay smoothing (38 window points, 2nd-order polynomial) to reduce instrumental noise and enhance the signal-to-noise ratio [23,24]; (2) baseline correction to eliminate instrumental artifacts and optimize the spectral response [25]; and (3) maximum-value normalization to standardize the intensity while preserving the original data distribution, facilitating inter-dataset comparisons [26]. Figure 3a,c illustrate the effects of these preprocessing steps compared to raw spectra. FTIR spectra of ginseng samples from three different geographic traceability sites after spectroscopy data pretreatments are shown in Figure 3a. FTIR spectra of ginseng samples from three different growth years after spectroscopy data pretreatments are shown in Figure 3c. It is believed that the peak at 3395 cm−1 is attributed to O-H stretching and may be influenced by amides in the polysaccharides and proteins of ginseng [27]. Similarly, the peak at 2928 cm−1 is attributed to the formation of asymmetric stretching of the -CH2- group, which may be influenced by the fatty acids and triterpenoids present in ginseng [28]; the peak at 1640 cm−1 is attributed to the bending vibration of N-H, a process that may be influenced by the amide in ginseng [29], and the peak at 1039 cm−1 is attributed to the vibrational stretching of C-C-O or C-C-OH bonds, which is indicative of the presence of alcohols in ginseng [30]. The intensity of the characteristic peaks of ginseng samples with different geographic traceability sites exhibited variation. In contrast, the intensity of the characteristic peaks of ginseng with varying years of growth from the same geographic traceability site remained constant. This may be because the samples from different growth years originate from the same geographic traceability site, and the growth years of each ginseng sample were not widely spaced, at 5, 8, and 10 years. The disparities in absorption peaks are not evidently discernible in Figure 3c. Further analysis of the infrared spectral data is required. Spearman correlation analysis revealed the significant variations in infrared spectral acquisition data for ginseng samples with varying geographic traceability and growth years [17]. The results of the Spearman correlation analysis are demonstrated in Figure 3b,d. The results of the Spearman correlation coefficient analysis of three ginseng samples from different geographic traceability sites are shown in Figure 3b. The results of the Spearman correlation coefficient analysis of three ginseng samples with different growth years are shown in Figure 3d. Ginseng samples with different geographic traceability and growth years were found to vary significantly in terms of FTIR spectral analyses (*** p < 0.001).

3.2. E-Nose Singal Analysis

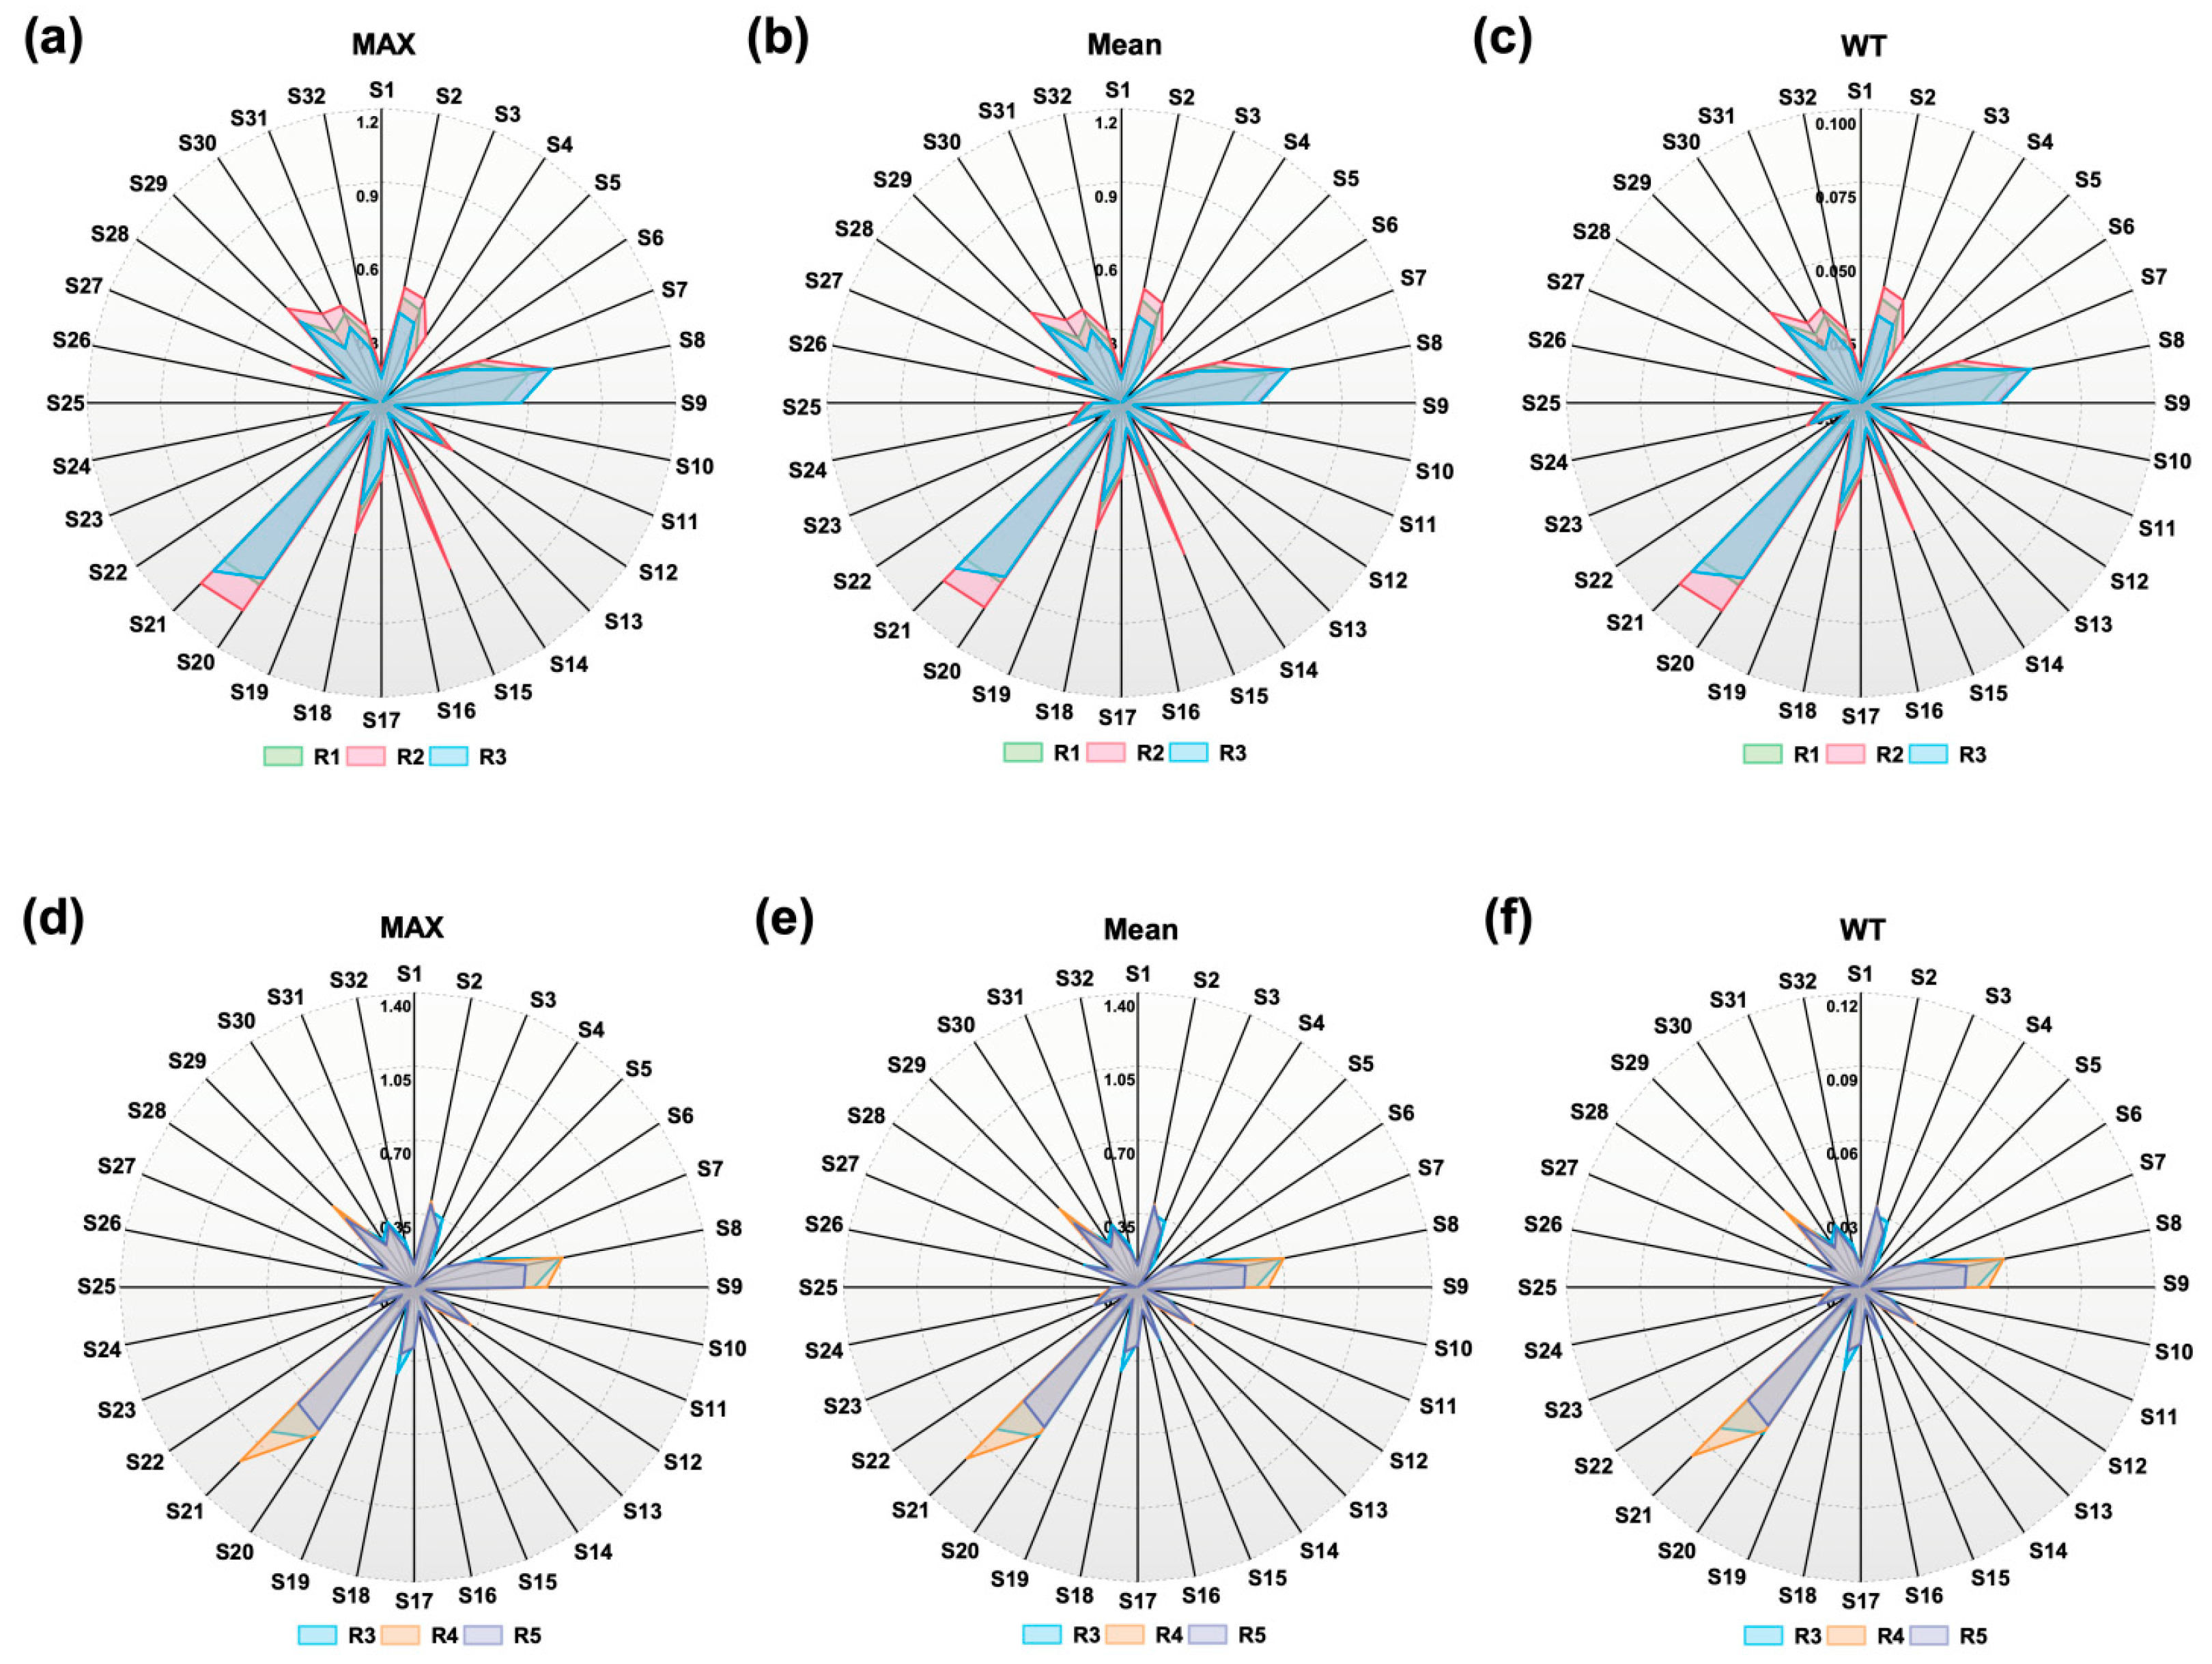
3.2.1. E-Nose Response Data Analysis

The radar maps of the E-nose response data processed using three different feature extraction methods are shown in Figure 4. The radar maps of ginseng samples with different geographic traceability are shown in Figure 4a–c, and the radar maps of ginseng samples with different growth years are shown in Figure 4d–f. According to the interaction principle of the MOS sensors in the E-nose system, the higher the concentration, the greater the intensity of the sensor’s response [31]. It can be concluded that different ginseng samples may contain different concentrations of certain aromatic volatile components.
In view of the radar map analysis, it is necessary to analyze the behavior of different types of sensors for the purpose of identifying the aroma of ginseng. As is illustrated in Figure 4, the response of the 32 MOS sensors is observed to undergo a change within 60 s of the ginseng odor being sampled and introduced into the E-nose. The 32 MOS sensors are described in detail in Table 3. While the behavior of the sensors appears to be analogous in general, notable disparities emerge in the curves and intensity levels exhibited by specific sensors, e.g., S2, S6, S10, S14, S17, S22, S30, S31, and S32. Both differences and similarities in the volatile compounds of different ginseng samples indicate that they possess similar compounds, such as sesquiterpenoids, aromatic compounds, and organic acids, albeit in various concentrations [32]. As is illustrated in Figure 4a–c, a clear distinction in the responses of sensors S2, S30, S31, and S32 is evident, with the ginseng sample R2 exhibiting the most pronounced intensity of response. It has been demonstrated that S2 exhibits heightened sensitivity to hydrocarbons; S30 and S32 demonstrate increased sensitivity to aromatic hydrocarbon compounds; and S31 demonstrates heightened sensitivity to organic solvents. As is illustrated in Figure 4d–f, the sensor response value of S6, S10, S14, S17, and S22 increased with the age of the sample growth. The response values are shown in Table 4. It has been demonstrated that S6, S14, and S22 exhibit a heightened sensitivity to aromatic hydrocarbon compounds; conversely, S10 and S17 demonstrate a heightened sensitivity to organic solvents. It is noteworthy that all of the aforementioned sensors demonstrate sensitivity to organic compounds. Therefore, an explanation can be posited for the variation in sensors performance from two perspectives. Firstly, the concentration of organic compounds, especially aromatic hydrocarbon compounds, increased with the number of years of ginseng growth. This suggests that the ginseng samples have relatively the lowest levels of R3. Secondly, it can be hypothesized that older-aged ginseng samples may contain elevated levels of terpene compounds. The utilization of sensor detection ranges as a methodology for the determination of the geographic traceability and growth age of ginseng is feasible by predicting the alterations in the concentration and class of aromatic hydrocarbon compounds.

3.2.2. Pattern Recognition Analysis

The analysis of E-nose response values for various ginseng samples indicates the potential for the E-nose sensors to predict the concentrations of certain key terpene constituents. This study proposes and develops an optimal model for predicting geographic traceability and the growth ages of ginseng by comparing the combination of three pattern recognition and three feature extraction methods: support vector machine (SVM), k-nearest neighbor (KNN), and artificial neural network (ANN). Three pattern recognition methods were employed for electronic nose data analysis:
  • Support vector machine (SVM): constructs optimal separation of hyperplanes by maximizing inter-class margins [33]
  • K-nearest neighbor (KNN): classifies samples based on majority voting among K most similar training instances (Euclidean distance metric) [34]
  • Artificial neural network (ANN): nonlinear statistical model mimicking biological neural networks to capture complex input–output relationships [35]
The results of each model used to predict different ginseng samples with geographic traceability are shown in Table 5. The Mean-KNN is the optimal model with 100% and 96% for the training and test sets, respectively. The findings of each model utilized to predict ginseng samples from diverse growth years are presented in Table 6, with Max-KNN emerging as the optimal model with 100% and 82% for the training and test sets, respectively. The results of each model used simultaneously for predicting ginseng samples with different geographic traceability and different growth ages are shown in Table 7, with the Mean-SVM as the optimal model, with 100% and 82% for the training set and test set, respectively. The matrix plot of the optimal model used for prediction is shown in Figure 5. The Mean-KNN model matrix for predicting different traceability is shown in Figure 5a. The Max-KNN model matrix for predicting different growth years is shown in Figure 5b. The Mean-SVM model matrix diagram used to predict different traceability and growth years is shown in Figure 5c. With regard to the E-nose pattern recognition results, the ginseng samples with different geographic traceability levels are the best predicted, with a correctness rate of close to 100%. The prediction of ginseng samples from different growth years in the same geographic traceability site is 82%. This phenomenon may be attributed to the observation that ginseng samples with different geographic traceability levels exhibit significantly divergent aroma concentrations. However, ginseng from different growth years, originating from the same traceability site, exhibited analogous volatile gases and a negligible variation in concentration, despite the presence of divergent concentrations of volatile odors. Nonetheless, following the findings of the analyses conducted, the hypothesis proposing the utilization of an E-nose to predict various geographic traceability and growth years is corroborated. The presence of discrepancies in volatile terpenoids among ginseng samples exhibiting differing geographic traceability and growth years indicates that terpenoids are the primary factor contributing to the differentiation of these samples.

4. Conclusions

A new method has been proposed and developed for the classification of ginsengs from various geographic traceability sites and with various growth ages by combining an E-nose system and machine learning with FTIR spectroscopy as a calibration technology.
It has been found that the volatile organic compounds of ginseng are primarily terpenes, alcohols, esters, and aromatic hydrocarbon compounds. The analysis reveals that terpenoid concentrations could serve as a means of differentiating and predicting different geographic traceability and growth ages through the sensitive gases corresponding to the sensors.
The experimental results demonstrate the following:
(1)
FTIR spectroscopic analysis revealed significant differences in secondary metabolites among ginseng samples from different geographic origins and growth years, validating our sample selection rationale;
(2)
E-nose radar plots visually distinguished sensor response patterns across ginseng varieties;
(3)
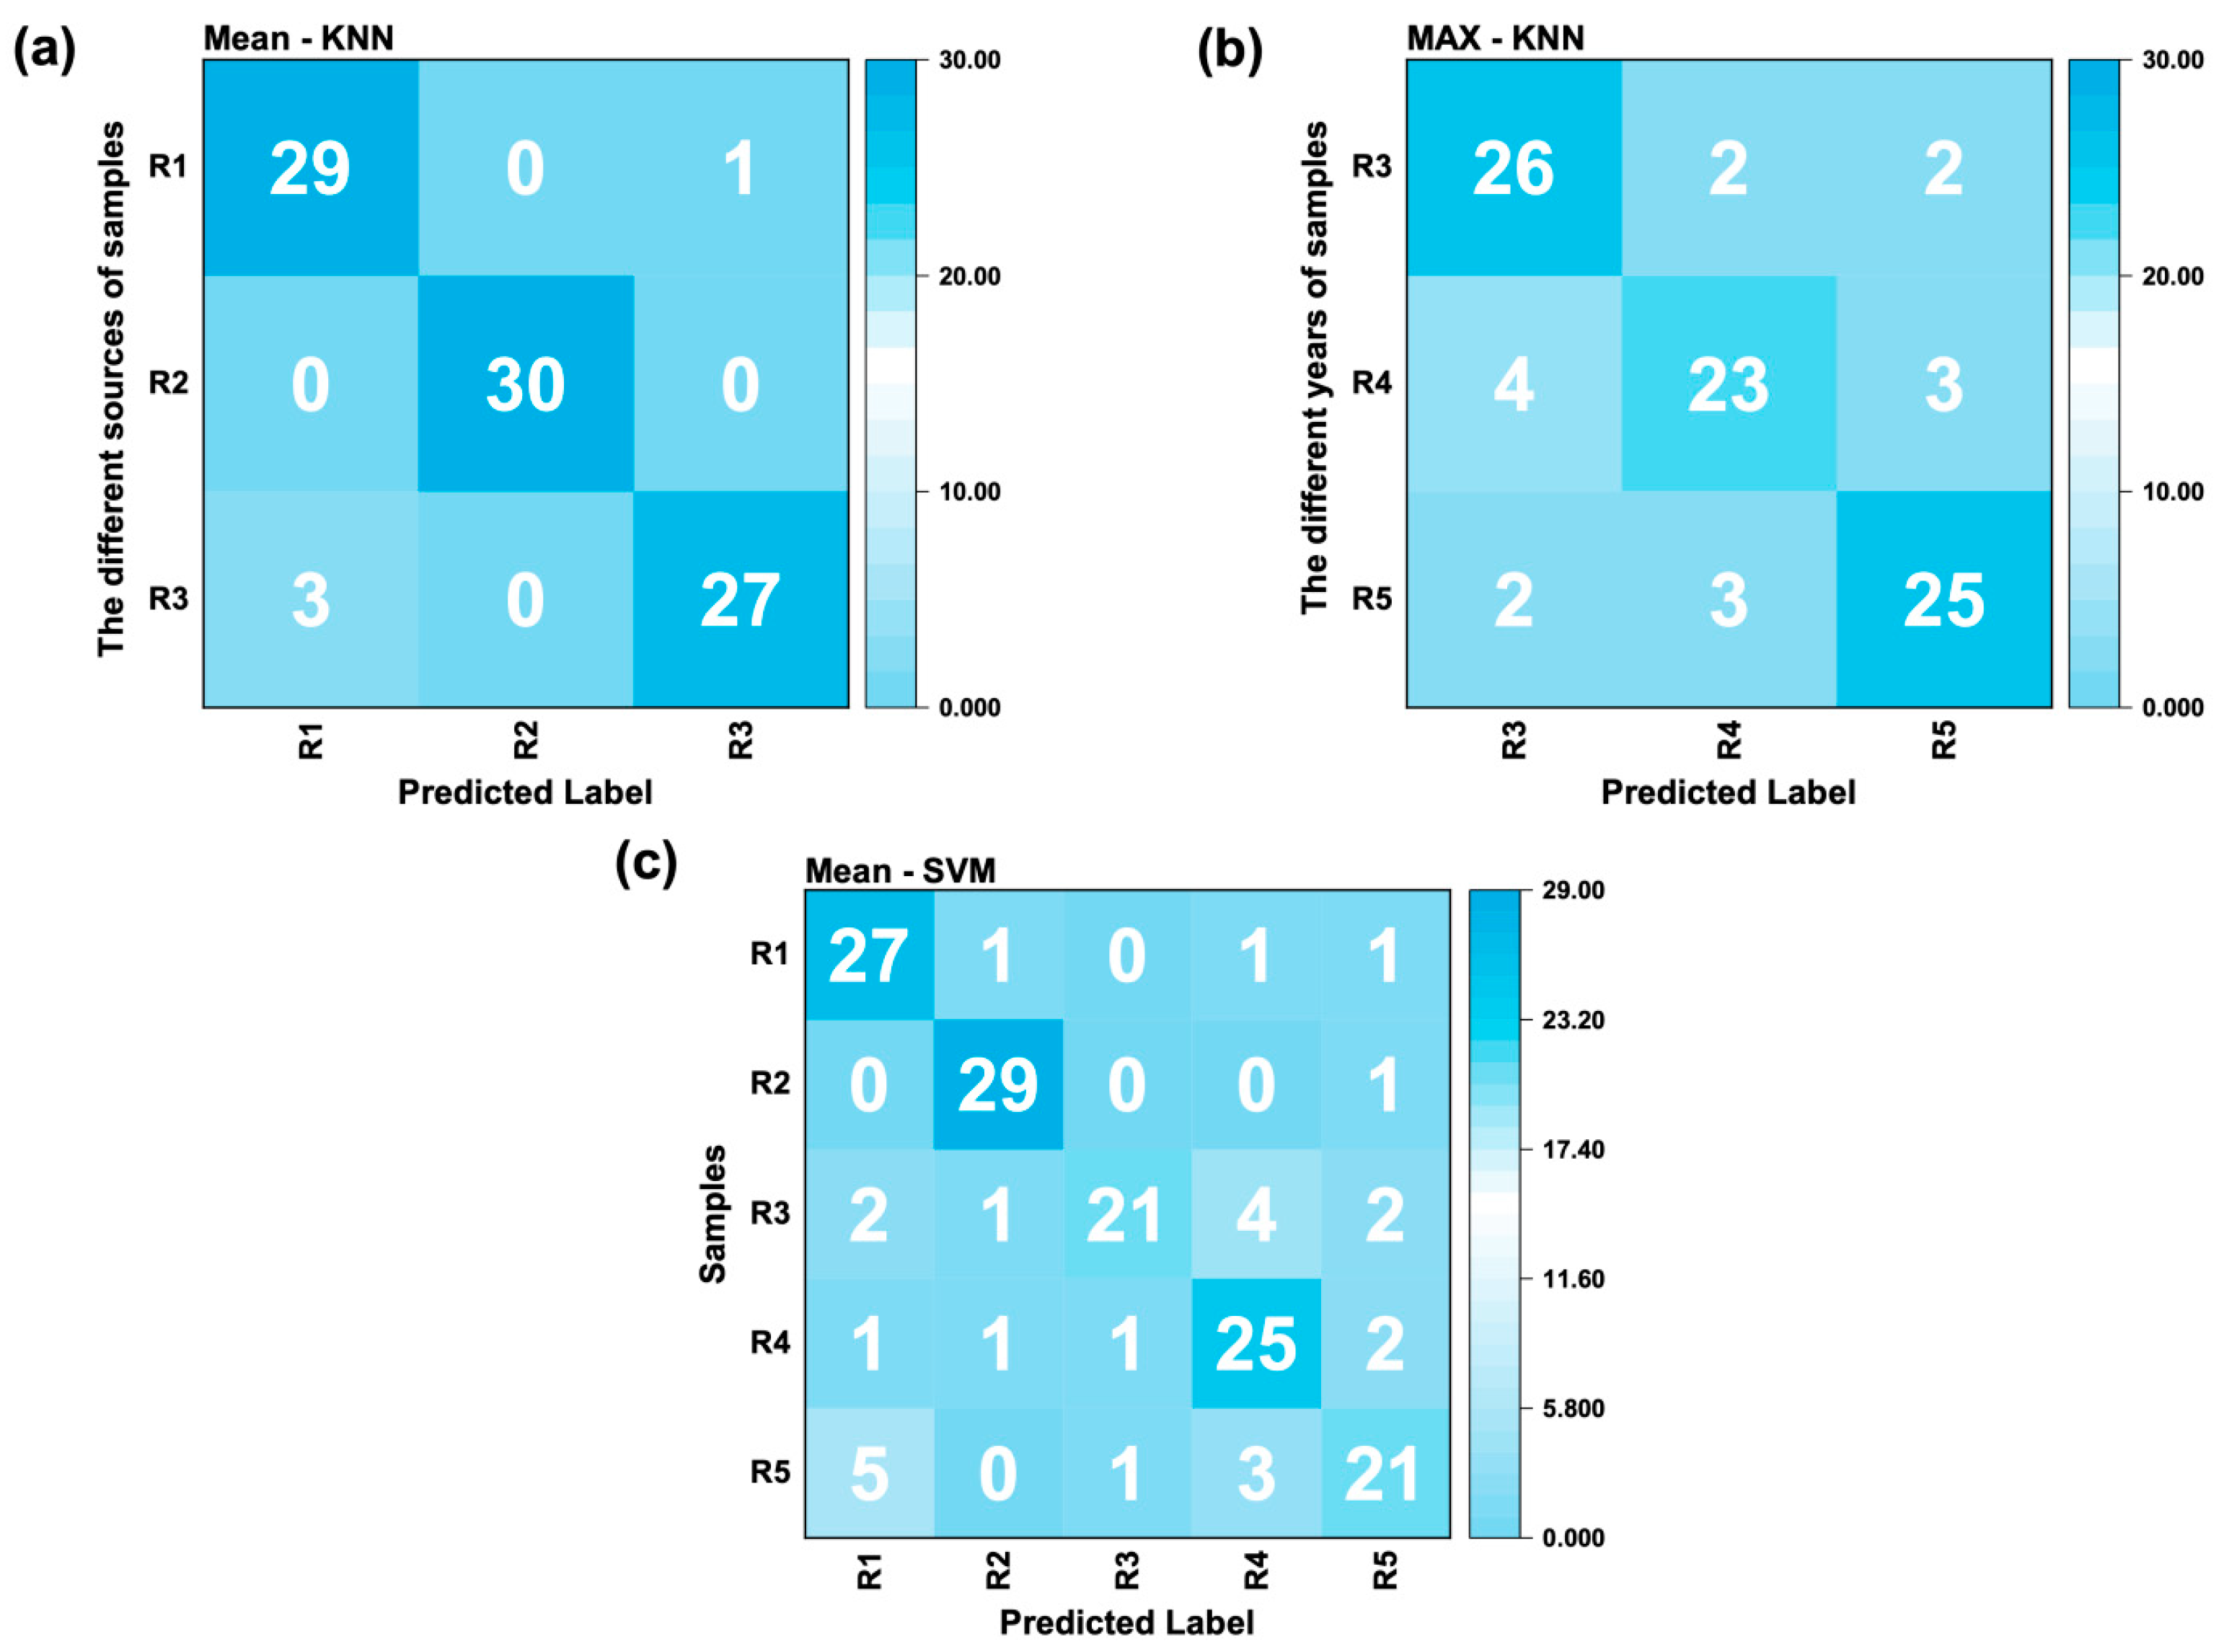
Classification models achieved optimal performance with the following:
  • Mean-KNN (96% accuracy) for geographic origin differentiation
  • Max-KNN (82% accuracy) for growth year discrimination
  • Mean-SVM (82% accuracy) for combined geographic traceability/year analysis
In conclusion, the integration of Mean-SVM with an E-nose constitutes a methodology that can be employed for the classification prediction of the presence of different geographic traceability and different growth years in ginseng samples. Given the complexity of traditional testing, the cost of testing, and the accuracy of the results, it is believed that the use of an E-nose is a viable method for determining the different geographic traceability and different growth years of ginseng.

Author Contributions

Conceptualization, J.L., S.Z. and X.W.; methodology, C.L. and X.W.; validation, X.W., J.Q. and Z.Z.; formal analysis, C.K. and Z.Z.; investigation, J.Q. and Z.C.; resources, Z.C.; data curation, C.K.; writing—original draft preparation, J.L. and X.W.; writing—review and editing, J.L., X.W. and S.Z.; visualization, C.L.; supervision, Z.C.; project administration, S.Z.; funding acquisition, S.Z. All authors have read and agreed to the published version of the manuscript.

Funding

This research was funded by the National Natural Science Foundation of China, grant number U22A20184, and the Science-Technology Development Plan Project of Jilin Province, grant number YDZJ202101ZYTS003.

Institutional Review Board Statement

Not applicable.

Informed Consent Statement

Not applicable.

Data Availability Statement

Data are within the article.

Conflicts of Interest

The authors declare no conflict of interest.

References

  1. Tao, R.; Lu, K.; Zong, G.; Xia, Y.; Han, H.; Zhao, Y.; Wei, Z.; Lu, Y. Ginseng polysaccharides: Potential antitumor agents. J. Ginseng Res. 2023, 47, 9–22. [Google Scholar] [CrossRef]
  2. Siegel, R.K. Ginseng Abuse Syndrome: Problems with the Panacea. JAMA 1979, 241, 1614–1615. [Google Scholar] [CrossRef] [PubMed]
  3. Hou, J.P. The chemical constituents of ginseng plants. Comp. Med. East. West. 1977, 5, 123–145. [Google Scholar] [CrossRef]
  4. Kang, K.S.; Ham, J.; Kim, Y.J.; Park, J.H.; Cho, E.J.; Yamabe, N. Heat-processed Panax ginseng and diabetic renal damage: Active components and action mechanism. J. Ginseng Res. 2013, 37, 379–388. [Google Scholar] [CrossRef] [PubMed]
  5. Lee, C.H.; Kim, J.H. A review on the medicinal potentials of ginseng and ginsenosides on cardiovascular diseases. J. Ginseng Res. 2014, 38, 161–166. [Google Scholar] [CrossRef] [PubMed]
  6. Im, D.S. Pro-Resolving Effect of Ginsenosides as an Anti-Inflammatory Mechanism of Panax ginseng. Biomolecules 2020, 10, 444. [Google Scholar] [CrossRef]
  7. Alinaghi, M.; Mokarram, P.; Ahmadi, M.; Bozorg-Ghalati, F. Biosynthesis of palladium, platinum, and their bimetallic nanoparticles using rosemary and ginseng herbal plants: Evaluation of anticancer activity. Sci. Rep. 2024, 14, 5798. [Google Scholar] [CrossRef]
  8. Ming, H.L.; Ming, H.L.; Rui, Y.H.; Shan, T.; Ke, K.L.; Xiao, J.G.; Yin, S.S.; Ying, P.W.; Zi, W.; Wei, L. Exploring the mechanism of active components from ginseng to manage diabetes mellitus based on network pharmacology and molecular docking. Sci. Rep. 2023, 13, 793. [Google Scholar]
  9. Sathya, S.; Zhang, J.; Feng, H.; Jing, P.; Lan, Y.; Cao, X.; Liu, Q. Comparison of chemical components and quality evaluation of Panax ginseng and its processed products from different habitats in Northeastern China. Biocatal. Agric. Biotechnol. 2024, 61, 103375. [Google Scholar] [CrossRef]
  10. Dai, Y.L.; Qiao, M.D.; Yu, P.; Zheng, F.; Yue, H.; Liu, S.Y. Comparing eight types of ginsenosides in ginseng of different plant ages and regions using RRLC-Q-TOF MS/MS. J. Ginseng Res. 2020, 44, 205–214. [Google Scholar] [CrossRef]
  11. Chen, W.; Balan, P.; Popovich, D.G. Analysis of Ginsenoside Content (Panax ginseng) from Different Regions. Molecules 2019, 24, 3491. [Google Scholar] [CrossRef] [PubMed]
  12. Qu, W.; Song, X.; Li, G.; Hou, J.; Han, Y.; Ye, P.; Zhang, H.; Chen, C.; Chen, Y.; Wang, E. Profiling and discovery of volatile marker compounds for Ginseng berries with different growth years by HS-SPME-GC-MS. Chin. J. Anal. Chem. 2022, 51, 100208. [Google Scholar] [CrossRef]
  13. Jeong, H.; Lim, C.; Cha, B.; Choi, S.H.; Kwon, K. Component analysis of cultivated ginseng, cultivated wild ginseng, and wild ginseng and the change of ginsenoside components in the process of red ginseng. J. Pharmacopunct. 2010, 13, 63–77. [Google Scholar] [CrossRef]
  14. Ge, S.; Liu, J.; Liu, Y.; Song, J.; Wu, H.; Li, L.; Zhu, H.; Feng, B. Chemical Profiling, Quantitation, and Bioactivities of Ginseng Residue. Molecules 2023, 28, 7854. [Google Scholar] [CrossRef]
  15. Ma, F.; Huang, A.; Zhang, S.; Zhou, Q.; Zhang, Q. Identification of three Diospysros species using FT-IR and 2DCOS-IR. J. Mol. Struct. 2020, 1220, 128709. [Google Scholar] [CrossRef]
  16. Zhang, Y.; Chen, J.; Lei, Y.; Zhou, Q.; Sun, S.; Noda, I. Evaluation of different grades of ginseng using Fourier-transform infrared and two-dimensional infrared correlation spectroscopy. J. Mol. Struct. 2010, 974, 94–102. [Google Scholar] [CrossRef]
  17. Han, H.; Zhang, H.; Wang, Z.; Song, Y.; Zhou, H.; Qu, X. Rapidly Identification of Ginseng from Different Origins Using Three-step Infrared Macro-Fingerprinting Technique. J. Mol. Struct. 2024, 1310, 138332. [Google Scholar] [CrossRef]
  18. Cheng, L.; Meng, Q.; Lilienthal, A.J.; Qi, P. Development of compact electronic noses: A review. Meas. Sci. Technol. 2021, 32, 062002. [Google Scholar] [CrossRef]
  19. Aunsa-Ard, W.; Kerdcharoen, T. Electronic Nose for Analysis of Coffee Beans Obtained from Different Altitudes and Origin. In Proceedings of the KST 2022—2022 14th International Conference on Knowledge and Smart Technology, Chon buri, Thailand, 26–29 January 2022; pp. 147–151. [Google Scholar]
  20. Li, D.; Lei, T.; Zhang, S.; Shao, X.; Xie, C. A novel headspace integrated E-nose and its application in discrimination of Chinese medical herbs. Sens. Actuators B-Chem. 2015, 221, 556–563. [Google Scholar] [CrossRef]
  21. Choong, Y.K.; Sun, S.; Zhou, Q.; Lan, J.; Lee, H.L.; Chen, X. Verification of Ganoderma (lingzhi) commercial products by Fourier Transform infrared spectroscopy and two-dimensional IR correlation spectroscopy. J. Mol. Struct. 2014, 1069, 60–72. [Google Scholar] [CrossRef]
  22. Cui, S.; Wang, J.; Yang, L.; Wu, J.; Wang, X. Qualitative and quantitative analysis on aroma characteristics of ginseng at different ages using E-nose and GC-MS combined with chemometrics. J. Pharm. Biomed. Anal. 2015, 102, 64–77. [Google Scholar] [CrossRef] [PubMed]
  23. Luo, J.; Ying, K.; Bai, J. Savitzky-golay smoothing and differentiation filter for even number data. Signal Process. 2005, 85, 1429–1434. [Google Scholar] [CrossRef]
  24. Bertie, J.E.; Keefe, C.D.; Jones, R.N. Infrared intensities of liquids viii. accurate baseline correction of transmission spectra of liquids for computation of absolute intensities, and the 1036 cm−1 band of benzene as a potential intensity standard. Can. J. Chem. 1991, 69, 1609–1618. [Google Scholar] [CrossRef]
  25. Chen, X.; Liu, X.; Sheng, D.; Huang, D.; Li, W.; Wang, X. Distinction of broken cellular wall ganoderma lucidum spores and g. lucidum spores using ftir microspectroscopy. Spectrochim. Acta Part A Mol. Biomol. Spectrosc. 2012, 97, 667–672. [Google Scholar] [CrossRef] [PubMed]
  26. Aranganathan, L.; Rajasree, S.R.R.; Suman, T.Y.; Remya, R.R.; Gobalakrishnan, M. Comparison of molecular characteristics of type a humic acids derived from fish waste and sugarcane bagasse co-compost influenced by various alkaline extraction protocols. Microchem. J. 2019, 149, 104038. [Google Scholar] [CrossRef]
  27. Wang, C.Y.; Tang, L.; Li, L.; Zhou, Q.; Li, Y.J.; Li, J.; Wang, Y.Z. Geographic Authentication of Eucommia ulmoides Leaves Using Multivariate Analysis and Preliminary Study on the Compositional Response to Environment. Front. Plant Sci. 2020, 11, 79. [Google Scholar] [CrossRef]
  28. Liu, Y.; Cao, D.; Liang, Y.; Zhou, H.; Wang, Y. Infrared spectral analysis and antioxidant activity of Dictamnus dasycarpus Turcz with different growth years. J. Mol. Struct. 2021, 1229, 129780. [Google Scholar] [CrossRef]
  29. Chen, J.; Guo, B.; Yan, R.; Sun, S.; Zhou, Q. Rapid and automatic chemical identification of the medicinal flower buds of Lonicera plants by the benchtop and hand-held Fourier transform infrared spectroscopy. Spectrochimica acta. Part A Mol. Biomol. Spectrosc. 2017, 182, 81–86. [Google Scholar] [CrossRef]
  30. Li, Y.; Zhang, J.Y.; Wang, Y.Z. FT-MIR and NIR spectral data fusion: A synergetic strategy for the geographical traceability of Panax notoginseng. Anal. Bioanal. Chem. 2018, 410, 91–103. [Google Scholar] [CrossRef]
  31. Ou, L.X.; Liu, M.Y.; Zhu, L.Y.; Zhang, D.W.; Lu, H.L. Recent Progress on Flexible Room-Temperature Gas Sensors Based on Metal Oxide Semiconductor. Nanomic. Lett. 2022, 14, 206. [Google Scholar] [CrossRef]
  32. Xiang, Y.; Zou, M.; Ou, F.; Zhu, L.; Xu, Y.; Zhou, Q.; Lei, C. A Comparison of the Impacts of Different Drying Methods on the Volatile Organic Compounds in Ginseng. Molecules 2024, 29, 5235. [Google Scholar] [CrossRef] [PubMed]
  33. Qingxia, L.; Tong, L.; Yunlong, C.; Xin, W.; DaWen, S. Predicting wheat gluten concentrations in potato starch using GPR and SVM models built by terahertz time-domain spectroscopy. Food Chem. 2024, 432, 137235. [Google Scholar]
  34. Madson, M.F.S.D.; Rodrigues, J.B.; Marry, E.M.S.D.; Helena, L.N.S.D.; Fabricio, F.S.D.; Lúcia, L.H.F.D.; Natácia, S.E.S.D. KNN algorithm and multivariate analysis to select and classify starch films. Food Packag. Shelf Life 2022, 34, 100976. [Google Scholar]
  35. Bhagya Raj, G.V.S.; Dash Kshirod, K. Comprehensive study on applications of artificial neural network in food process modeling. Crit. Rev. Food Sci. Nutr. 2020, 62, 21–28. [Google Scholar] [CrossRef]
Figure 1. The ginseng samples used in this study.
Chemosensors 13 00176 g001
Figure 2. The process of sampling by the E-nose.
Chemosensors 13 00176 g002
Figure 3. FTIR spectral analysis and Spearman correlation of ginseng samples: (a) processed FTIR spectra of geographically distinct samples; (b) Spearman correlation matrix of geographic variants; (c) processed FTIR spectra of different growth-year samples; (d) Spearman correlation matrix of growth-year variants.
Chemosensors 13 00176 g003
Figure 4. The radar maps of the E-nose response data subsequent to processing by three different feature extraction methods: (ac) the radar maps of ginseng samples with different geographic traceability; (df) the radar maps of ginseng samples with different growth years.
Chemosensors 13 00176 g004
Figure 5. Confusion matrix of the optimal model for the classification of different ginseng grades: (a) Mean-KNN model matrix for predicting different geographic traceability; (b) Max-KNN model matrix for predicting different growth years; (c) Mean-SVM model matrix diagram used to predict different geographic traceability and growth years.
Chemosensors 13 00176 g005
Table 1. The basic environmental information of the three production areas.
TypesYunnanFu’songJi’an
Longitude and latitude97°31′–106°11′ E
21°8′–29°15′ N
127°01′–128°06′ E
41°42′–42°49′ N
125°34′–126°32′ E
40°52′–41°35′ N
Soil (pH values)Yellow–red soil
(pH 4.2–5.7)
Dark-brown forest soil
(pH 5.5–6.5)
Dark-brown forest soil
(pH 5.5–6.5)
Soil organic matter55.40 g/Kg34.79–93.00 g/Kg26.33–58.17 g/Kg
Available phosphorus (AP)41.69 mg/Kg15.08–112.47 mg/Kg54.55–204.59 mg/Kg
ClimateSubtropical MonsoonWarm temperate continental monsoonWarm temperate continental monsoon
Annual sunshine duration1000–2800 h2021–2833 h2021–2833 h
Annual precipitation1085 mm800 mm800–1000 mm
Annual average temperature18.5 °C4.0 °C6.5 °C
Table 2. The parameters of the five types of ginseng samples.
Serial NumberNameGeographic TraceabilityGrowth YearsNumber of ServingsServings per
R1Panaxnotoginseng(Burkill)F.H. Chen ex C. H. ChowYunnan5 years3020 g
R2Panax quinquefolius L.Fu’song5 years3020 g
R3Panax ginseng C. A. Mey.Ji’an5 years3020 g
R4Panax ginseng C. A. Mey.Ji’an8 years3020 g
R5Panax ginseng C. A. Mey.Ji’an10 years3020 g
Table 3. Detailed description of 32 sensors.
Serial NumberSensor ModelMain Detection ObjectSensitivityMarker
S1TGS2612Alkanes, propane, n-Butane400–1000 ppmFigaro, Japan
S2TGS2611Alkanes500–10,000 ppmFigaro, Japan
S3TGS2620Alkanols, organic solvent50–5000 ppmFigaro, Japan
S4TGS2603Food odor (amines and sulfur-containing)1–10 ppmFigaro, Japan
S5TGS2602VOCs, ammonia, hydrogen sulfide, etc.1–30 ppmFigaro, Japan
S6TGS2610Propane, n-Butane500–10,000 ppmFigaro, Japan
S7TGS2600Hydrogen, alcohol, etc.1–30 ppmFigaro, Japan
S8GSBT11VOCs, HC, organic compounds0.1–10 ppmOgam, Korea
S9MS1100VOCs, aldehydes, benzene compound5–1000 ppmOgam, Korea
S10MP135Hydrogen, alcohol, carbon monoxide10–500 ppmWinsen, China
S11MP901Alcohol, aldehydes, benzene compound, etc.10–1000 ppmWinsen, China
S12MP-9Carbon monoxide, alkanes50–1000 ppmWinsen, China
S13MP-3BAlcohol0–500 ppmWinsen, China
S14MP-4Alkanes, biogas300–10,000 ppmWinsen, China
S15MP-5Combustible gas300–10,000 ppmWinsen, China
S16MP-2Propane200–10,000 ppmWinsen, China
S17MP503Alcohol, aldehydes, benzene compound, etc.1–1000 ppmWinsen, China
S18MP801Aldehydes, benzene compound, etc.0.5–1000 ppmWinsen, China
S19MP905Aldehydes, benzene compound, etc.0.5–1000 ppmWinsen, China
S20MP402Alkanes300–1000 ppmWinsen, China
S21WSP1110NO20.1–10 ppmWinsen, China
S22WSP2110Alcohol, aldehydes, benzene compound, etc.1–50 ppmWinsen, China
S23WSP7110Hydrogen sulfide0–50 ppmWinsen, China
S24MP-7Carbon monoxide50–1000 ppmWinsen, China
S25TGS2612Alkanes, propane, n-Butane400–1000 ppmFigaro, Japan
S26TGS2611Alkanes500–10,000 ppmFigaro, Japan
S27TGS2620Alkanols, organic solvent50–5000 ppmFigaro, Japan
S28MP-3BAlcohol0–500 ppmWinsen, China
S29MP702Ammonia gas0–100 ppmWinsen, China
S30TGS2610Propane, n-Butane500–10,000 ppmFigaro, Japan
S31TGS2600Hydrogen, alcohol, etc.1–30 ppmFigaro, Japan
S32TGS2618Propane, n-Butane500–10,000 ppmFigaro, Japan
Table 4. The sensor response values.
FeatureSamplesS6S10S14S17S22
MaxR30.165100.055240.050350.267640.06683
R40.174870.055850.054630.282300.06775
R50.176390.057680.054930.286870.06805
MeanR30.158150.496860.044830.258990.06202
R40.168320.050610.047770.274700.06268
R50.169960.052450.048430.276770.06308
WTR30.013340.004140.003760.021660.00514
R40.014250.004230.004120.022870.00529
R50.014270.004410.004300.023150.00530
Table 5. The results of each model used to predict the ginseng samples of different geographic traceability.
FeatureModelTrain (ACC %)Test (ACC %)
MaxSVM10093
KNN9997
ANN5856
MeanSVM9891
KNN10096
ANN8679
WTSVM10088
KNN10092
ANN9484
Table 6. The results of each model used to predict the ginseng samples of different growth ages.
FeatureModelTrain (ACC %)Test (ACC %)
MaxSVM9878
KNN10082
ANN3633
MeanSVM9880
KNN9182
ANN8471
WTSVM8571
KNN10078
ANN8076
Table 7. The results of each model used to predict the ginseng samples of different geographic traceability and different growth years.
FeatureModelTrain (ACC %)Test (ACC %)
MaxSVM10081
KNN9386
ANN9676
MeanSVM10082
KNN9184
ANN9880
WTSVM10075
KNN10078
ANN6961
Disclaimer/Publisher’s Note: The statements, opinions and data contained in all publications are solely those of the individual author(s) and contributor(s) and not of MDPI and/or the editor(s). MDPI and/or the editor(s) disclaim responsibility for any injury to people or property resulting from any ideas, methods, instructions or products referred to in the content.

