Article

Heterostructures of CdSe Quantum Dots and g-C3N4 Applied as Electrochemiluminescent Probes for the Detection of Hydrogen Peroxide in Human Serum

by
Roodney Alberto Carrillo Palomino
1,
Aylén Di Tocco
2,
Gastón Darío Pierini
1,
Gabriela Valeria Porcal
3,* and
Fernando Javier Arévalo
1,*
1
Electroanalytical Group (GEANA), Department of Chemistry, Faculty of Exact, Physicochemistry, and Natural Sciences, National University of Río Cuarto (UNRC), Institute for Agroindustrial and Health Development (IDAS-UNRC, CONICET), Río Cuarto, X5804BYA, Agencia Postal N° 3, Argentina
2
Electroanalytical Group (GEANA), Department of Basic Sciences, Faculty of Engineering, UNRC, IDAS-UNRC, CONICET, Río Cuarto X5804BYA, Argentina
3
Photochemistry Group, Department of Chemistry, Faculty of Exact, Physicochemistry, and Natural Sciences, National University of Río Cuarto (UNRC), Institute for Research in Energy Technologies and Advanced Materials, (IITEMA-UNRC), Río Cuarto X5804BYA, Argentina
*
Authors to whom correspondence should be addressed.
Chemosensors 2025, 13(5), 171; https://doi.org/10.3390/chemosensors13050171
Submission received: 21 March 2025 / Revised: 24 April 2025 / Accepted: 30 April 2025 / Published: 7 May 2025

Abstract

:
In this work, we developed a highly sensitive and reproducible electrochemiluminescent sensor based on a heterostructure of cadmium selenide quantum dots capped with 3-mercaptopropionic acid (MPA) + 3-morpholinoethanesulfonic acid (MES) (QDs CdSe) and carbon nitride nanosheets (g-C3N4) for the detection of H2O2 in lyophilized serum samples. To enhance the sensor sensitivity, g-C3N4 nanosheets were utilized as a platform to immobilize the QDs CdSe. An exhaustive characterization of the heterostructure was conducted, elucidating the interaction mechanism between QDs CdSe and g-C3N4. It was revealed that g-C3N4 acts as a hole (h+) donor, while QDs CdSe act as energy acceptors in a resonance energy transfer process, with the electrochemiluminescence emission originating from the QDs CdSe. The electrochemiluminescence intensity decreases in the presence of H2O2 due to the deactivation of the excited states of the QDs CdSe. This electrochemiluminescent sensor demonstrates exceptional performance for detecting H2O2 in aqueous systems, achieving a remarkably low limit of detection (LOD) of 1.81 nM, which is more sensitive than most reported sensors to detect H2O2. The applicability of the sensor was successfully tested where sub-µM levels of H2O2 were accurately quantified. These results highlight the potential of this electrochemiluminescent sensor as a reliable and pre-treatment-free tool for H2O2 detection in biochemical studies and human health applications.

Graphical Abstract

1. Introduction

Hydrogen peroxide (H2O2) is a compound that remains a topic of interest across a wide variety of scientific disciplines. H2O2 is a critical biomarker for multiple pathological conditions, including cardiovascular diseases, cancer, diabetes, Parkinson’s disease, and neurodegenerative disorders [1]. Its detection and quantification are therefore essential for diagnostic and therapeutic applications in human health. At the molecular level, H2O2 decomposes into hydroxyl radicals (OH·), highly reactive species that induce oxidative damage to cellular components, leading to cell death. When present at supraphysiological concentrations, H2O2 drives excessive generation of reactive oxygen species (ROS), resulting in systemic oxidative stress. This stress exhibits a dual role in cellular pathophysiology: while it can trigger apoptosis (a regulated cell death process), it paradoxically promotes disease progression through mechanisms such as aberrant cell proliferation, angiogenesis, and metastasis [2]. The concentration-dependent effects of H2O2 underscore its complex role as both a signalling molecule and a cytotoxic agent in human health and disease. Therefore, the development of new methods for detecting H2O2 at both micromolar (µM)- and nanomolar (nM)-level concentrations in human serum sample is of considerable importance. Consequently, a wide variety of methods for the detection of H2O2 are currently being developed [3]. The majority of methodologies developed for the detection of H2O2 are based on the use of enzymes, such as horseradish peroxidase [4]; nevertheless, their enzymatic activity is dependent upon environmental factors, including the medium (pH, ionic strength, solvent polarity, etc.), the temperature and the concentration of the enzyme substrate. Today, new enzyme-free methodologies are currently being developed with the goal of replacing biosensors for the quantification of H2O2, where the most prevalent of these are based on colorimetric sensors [5,6], as well as electrochemical sensors [7,8]. In recent years, the use of systems based on nanostructured materials, including semiconductors [9,10,11,12] and quantum dots [13,14,15], has facilitated the advancement of novel sensor technologies for the detection and quantification of H2O2. In this context, the use of nanomaterials with well-defined optical and electrochemical properties has enabled the development of electrochemiluminescent sensors. Electrochemiluminescence (ECL) has gained interest in diverse fields of analytical chemistry. The key advantage of ECL lies in its synergistic integration of electrochemical and photoluminescent methodologies. The ECL mechanism generates excited states through electrochemically produced radical intermediates, eliminating the requirement for external optical excitation. This unique feature (i) minimizes background interference from scattered light, (ii) enhances signal-to-noise ratios, and (iii) provides superior spatial control compared to conventional luminescence techniques. Also, ECL includes low background emission, high temporal resolution and high sensitivity [16].
The introduction of probes composed of nanomaterials with electrochemiluminescent properties has emerged as a highly valuable alternative for H2O2 detection. This is due to the ability to tune the optical and electrochemical properties of these probes during their synthesis, enabling optimized performance in sensing applications [17].
Graphitic carbon nitride (g-C3N4) is a metal-free semiconductor polymeric material with a two-dimensional structure [18]. It exhibits high chemical stability, biocompatibility and structural defects that facilitate functionalization. These properties make g-C3N4 an ideal material for use in the development of sensors and biosensors [19,20]. Due to its appropriate bandgap (Eg), between 2.6 and 2.8 eV, g-C3N4 can be used as a platform for electrochemiluminescent sensors in the presence of co-reactants [21,22,23,24,25]. The planar structure of g-C3N4 allows for the loading of nanoparticles, facilitating the formation of stable heterostructures, with both photocatalytic and electrocatalytic properties. These characteristics make g-C3N4 an effective and versatile probe for a wide variety of applications [26,27]. With respect to the semiconductor material, one of the main challenges is the limited ability to separate generated electron–hole pairs (excitons) when they are excited electrochemically and/or by light, where a rapid recombination between electrons and holes is produced due to the electrostatic attraction between them, decreasing the material’s lifetime and, therefore, the efficiency of the system [28,29]. In the case of g-C3N4, one effective strategy to overcome this limitation is the formation of heterojunctions by coupling g-C3N4 with nanoparticles such as quantum dots of semiconducting metals [30]. These heterostructures are presented as excellent electrochemiluminescent probes. In some cases, there is often a coupling between the valence and conduction bands of g-C3N4 and nanomaterials, characterized by the overlap of the emission band of g-C3N4 with the absorption band of the quantum dots. In this case, if the distance between them is very close (<10 nm), it is possible for a resonance energy transfer (RET) to be successfully established, enhancing the electrogenerated light emission processes [31,32,33,34,35,36]. This strategy allows the synthesis of hybrid nanomaterials, which can be employed in the development of more sensitive sensors based on ECL. In this respect, QDs CdSe are a valuable alternative to coupling with g-C3N4 due to their fluorescent and electrochemical properties [37]. QDs CdSe also exhibit a high rate of recombination of photogenerated electrons and holes. Nevertheless, heterostructures comprising g-C3N4 and QDs CdSe have the potential to generate new charge separation dynamics. The incorporation of an electric field at the heterojunction interface facilitates the spatial separation of hole–electron pairs, thereby reducing their recombination rate and enhancing the efficiency of the ECL [38]. One of the great advantages of using QDs CdSe is that they can be obtained in a simple way, with a controlled size [39]. The Eg can be adjusted and their optical properties are tunable according to the need for their application. Furthermore, the appropriate selection of capping molecules for QDs CdSe provides protection and enhances their optical properties, facilitating the ECL process, as previously reported [39].
In this work, we report the development of a new electrochemiluminescent sensor for the detection and quantification of H2O2 in lyophilized serum samples, without any pre-treatment, based on a heterostructure formed by g-C3N4 and QDs CdSe (QDs CdSe@g-C3N4). The electrochemiluminescent sensor demonstrated a high level of sensitivity and selectivity for detecting H2O2 in reconstituted serum samples.

2. Materials and Methods

2.1. Reagents and Materials

All reagents used in this work were of analytical grade and were used as received. For more details, they are described in Supplementary Materials (Section S1).

2.2. Instrumentation

Absorption spectra were obtained by using a Hewlett-Packard 8452A diode array spectrophotometer (Agilent, LA, USA). Fluorescence emission measurements were performed by using a FluoromaxTM spectrofluorometer (Spex Industries Inc., Edison, NY, USA) and a FluoroMax4® (Horiba Scientific, Kyoto, Japan). The Fourier transform infrared (FT-IR) spectra were obtained using a Bruker Tensor 27 FT-IR (Bruker Optics, Ettlingen, Germany). The FT-IR spectra were acquired by transmission on a KBr cell containing a drop of the solution, where the solvent was previously evaporated by using a sodium lamp. The analysis of the luminescence decay of the nanomaterials was performed with an Edinburgh Instruments OB 900 Time Correlated Single-Photon Counting (TCSPC) fluorometer (Edinburgh Instruments Ltd., Livingston, Scotland).
Electrochemical measurements were performed using a PS4 No. 10 potentiostat (PalmSens, Houten, The Netherlands), coupled to a PC with incorporated software (PSTrace 5.9, Houten, The Netherlands). The electrochemiluminescence measurements were conducted by coupling the spectrofluorometer with the potentiostat as described in the Supplementary Materials (Section S2. Equipment for ECL Measurement). The working electrode used was an unpolished float glass, 7 × 50 × 0.7 mm, SiO2 passivate/indium tin oxide-coated, with a resistance of 8–12 Ω. Prior to use, the electrodes were cleaned in an ultrasonic bath with 99.8% ethanol, HPLC-grade (Sintorgan, Provincia de Buenos Aires, Argentina), then dried in an oven at 40 °C. A platinum wire and a Ag/AgCl reference electrode (3 mol L−1 NaCl) (CHI Instruments, Austin, TX, USA) were used as auxiliary (CE) and reference (RE) electrodes, respectively.

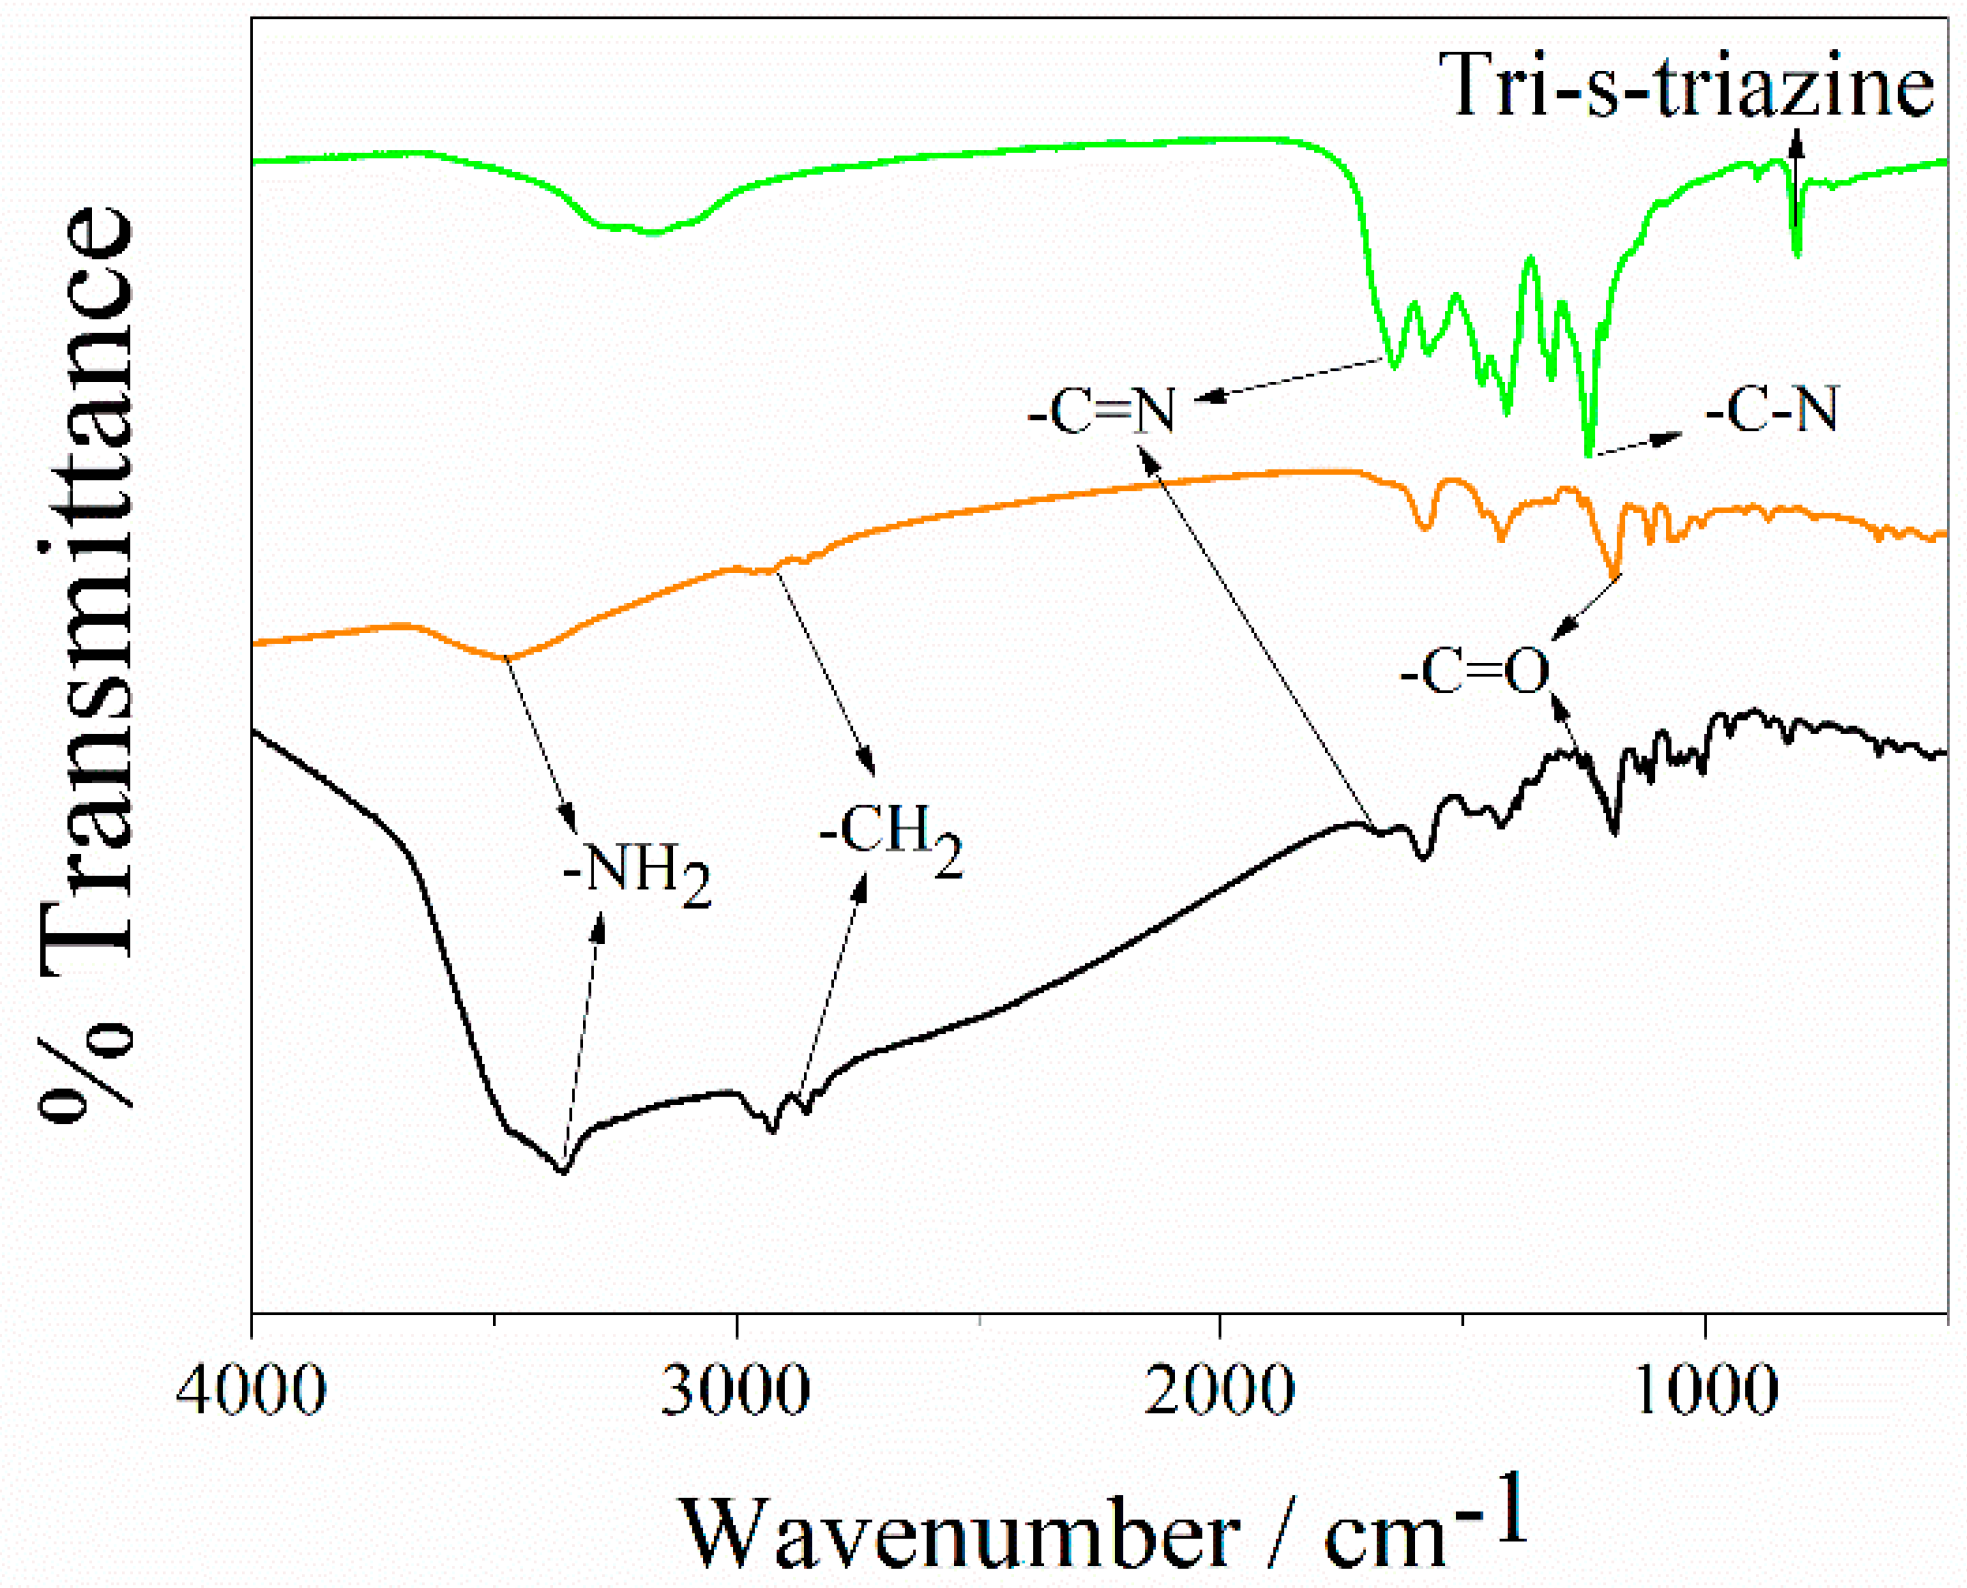
2.3. Synthesis of g-C3N4

Synthesis of bulk g-C3N4 was carried out in accordance with well-established literature protocols [40]. Briefly, 7.5 g of urea was placed in a covered porcelain chamber and calcined in an oven. A temperature ramp was applied at a rate of increase of 10 °C min−1, reaching a maximum of 550 °C, and this temperature was maintained constant for 2 h. Then, the oven was switched off and allowed to cool to room temperature. In this process, the structural units of tri-S-triazine/heptazine heterocyclic compounds were formed [41].
Then, to separate the g-C3N4 sheets, 10 mL of H2SO4 concentrate was added to 500 mg of bulk g-C3N4 and mixed at 1500 rpm for 60 min [42]. Next, 20 mL of H2O was added and sonicated for 2 h at 40 °C, and the solution changed colour from yellow to white. This process resulted in the formation of smaller and separated sheets (see Section 3). The purification of exfoliated g-C3N4 was carried out through centrifugation and water washing steps until a pH-neutral solution of g-C3N4 was achieved. Then, the g-C3N4 was dried in an oven at 60 °C for 12 h, resulting in exfoliated g-C3N4 powder.

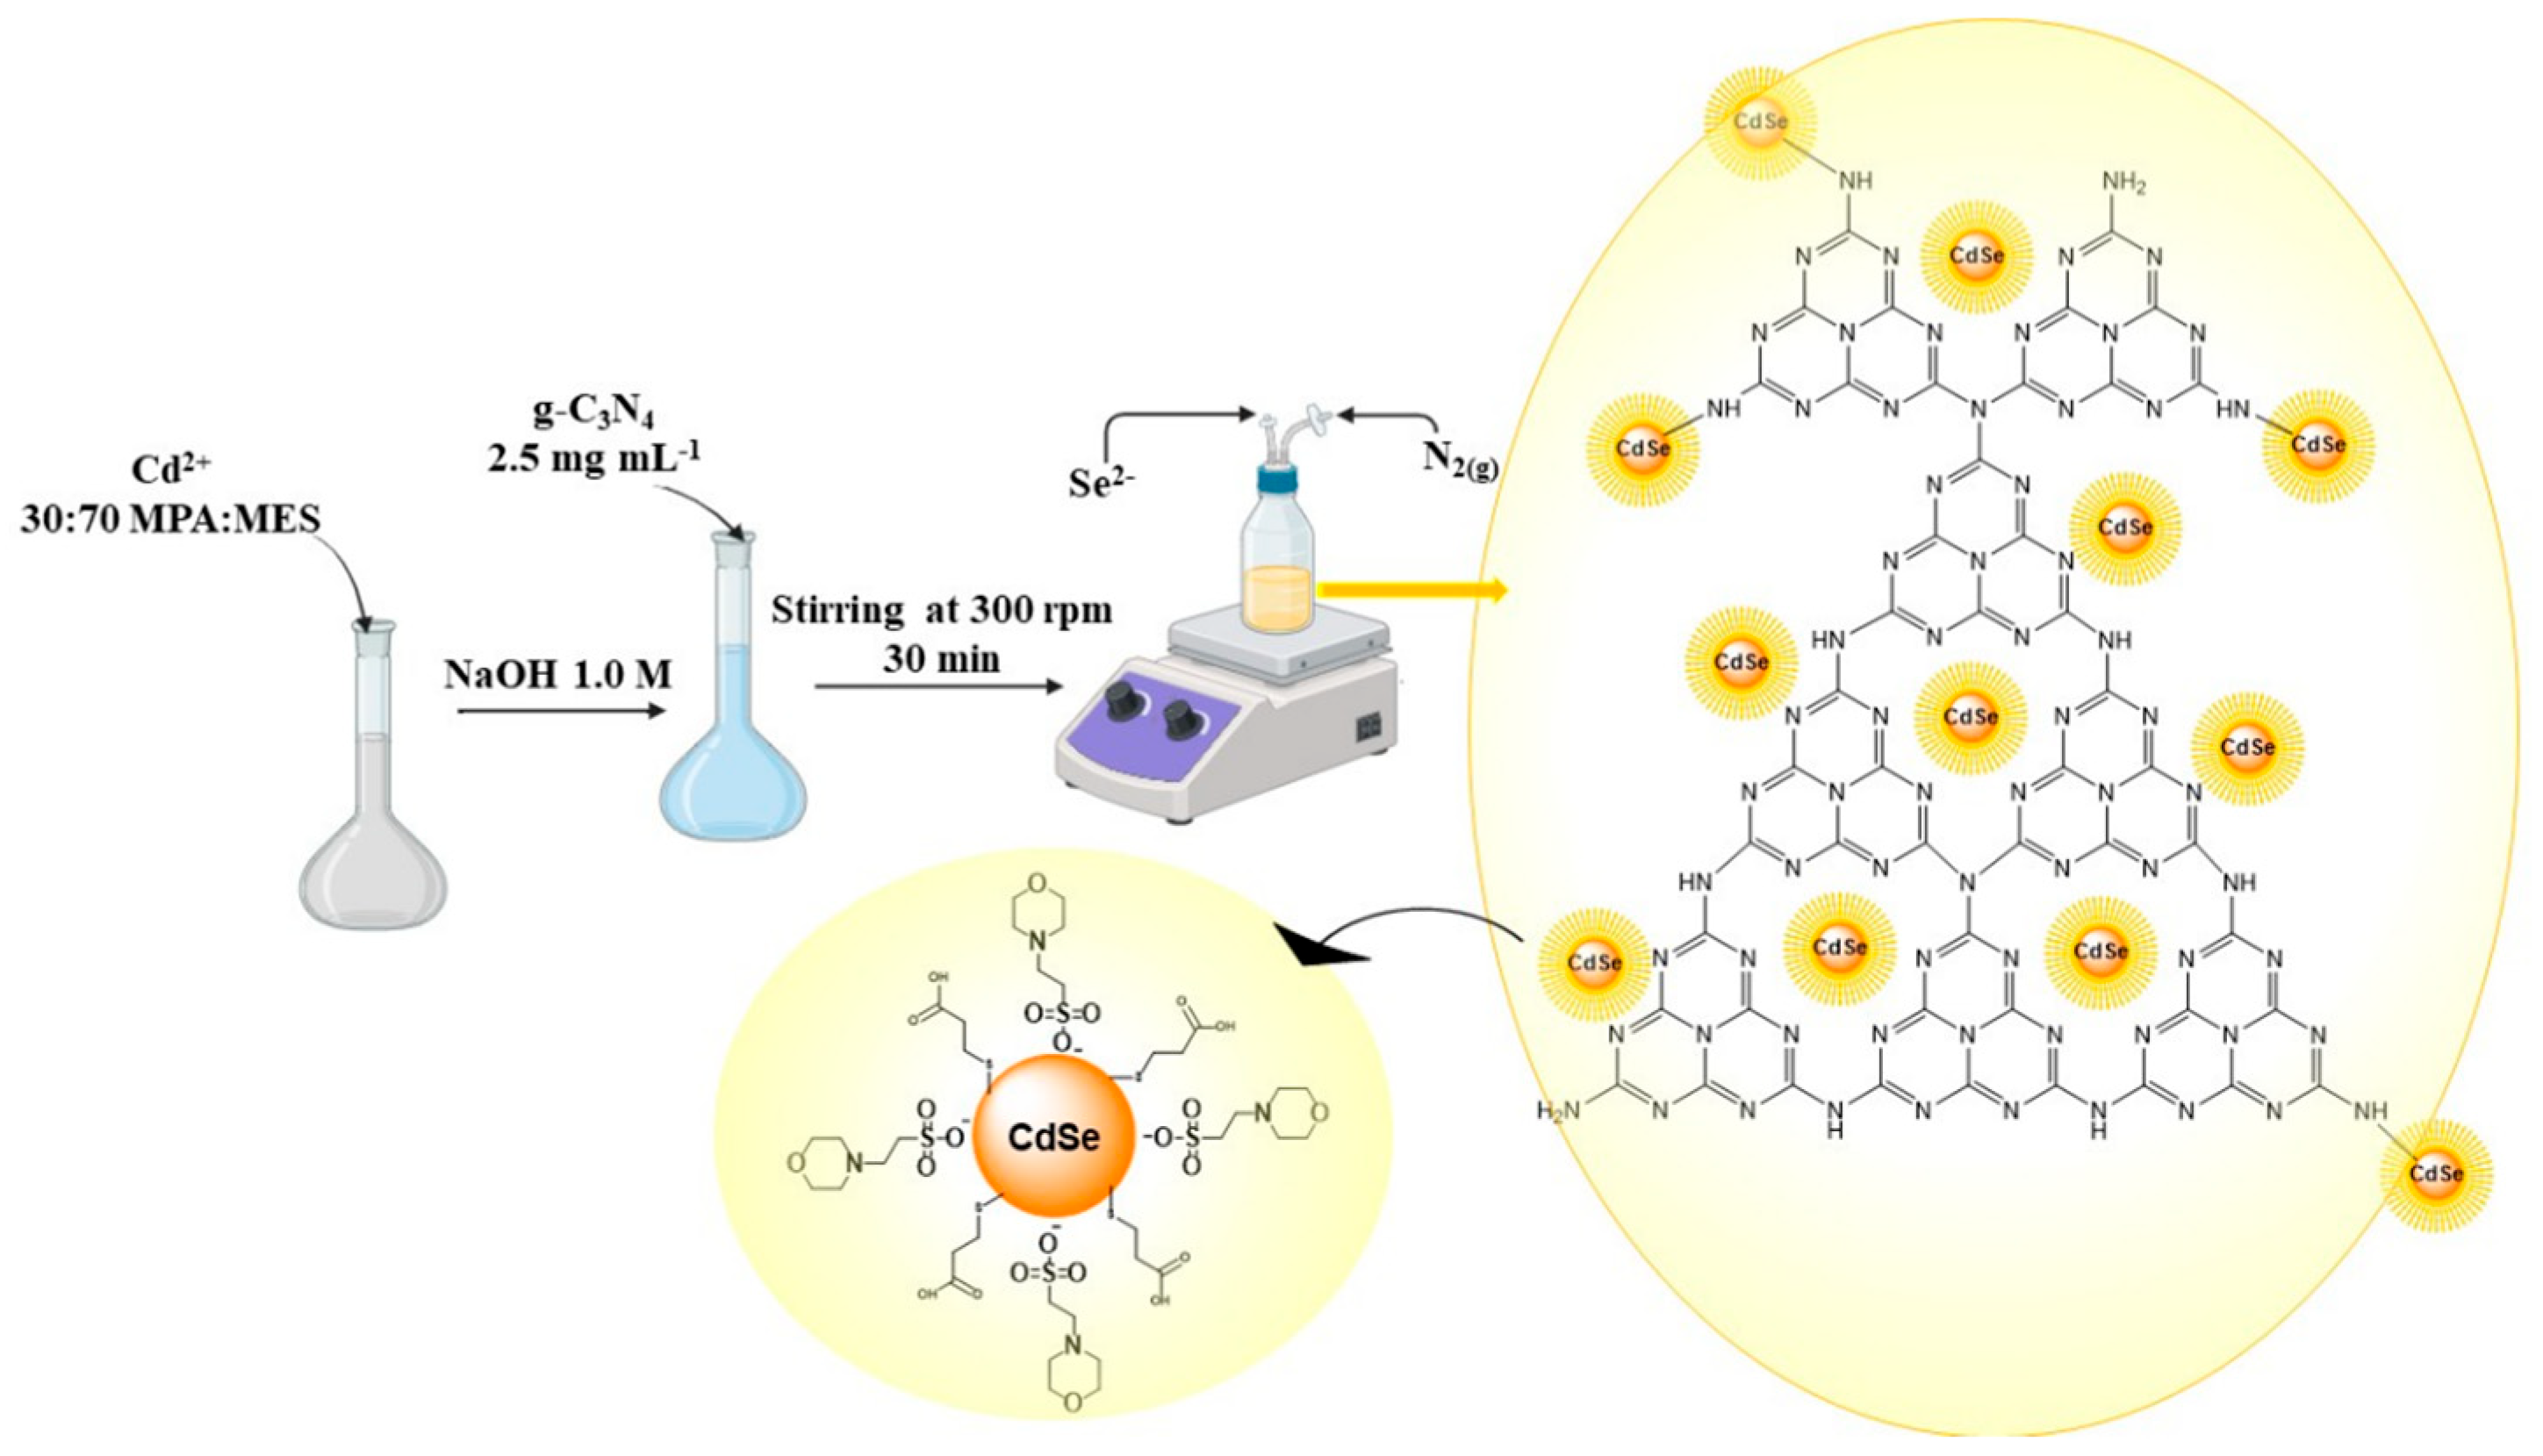
2.4. Synthesis of Heterostructures of g-C3N4 and QDs CdSe

The synthesis of heterostructures of QDs CdSe and g-C3N4 (QDs CdSe@g-C3N4) was carried out by an in situ growth process of QDs CdSe on g-C3N4 sheets, as illustrated in Scheme 1. To 5 mL of an aqueous Cd2+ solution (7 mmol L−1), MPA and MES were added simultaneously as stabilizers, maintaining a Cd2+/stabilizer molar ratio of 1:10. The pH was adjusted to 10 using NaOH, and the solution was degassed for 30 min under argon bubbling with constant stirring at 300 rpm. The dual role of MPA and MES was to stabilize the quantum dots and control their growth. Next, 200 µL of 2.5 mg mL−1 of aqueous dispersion of exfoliated g-C3N4 was added. Subsequently, a Se2− aqueous solution was rapidly introduced, producing a change of colour to yellow/orange. As previously reported, to maximize the electrochemiluminescence of QDs CdSe, a molar ratio of Cd2+ to Se2− of 2:1 was used. The MPA:MES molar ratio (30:70) was selected based on our prior work, which demonstrated its superior enhancement of ECL intensity [39]. The product obtained was purified through several steps of precipitation by changing the polarity of the solvent (using ethanol), centrifugation and washing. Finally, QDs CdSe@g-C3N4 were dispersed in water.

3. Results

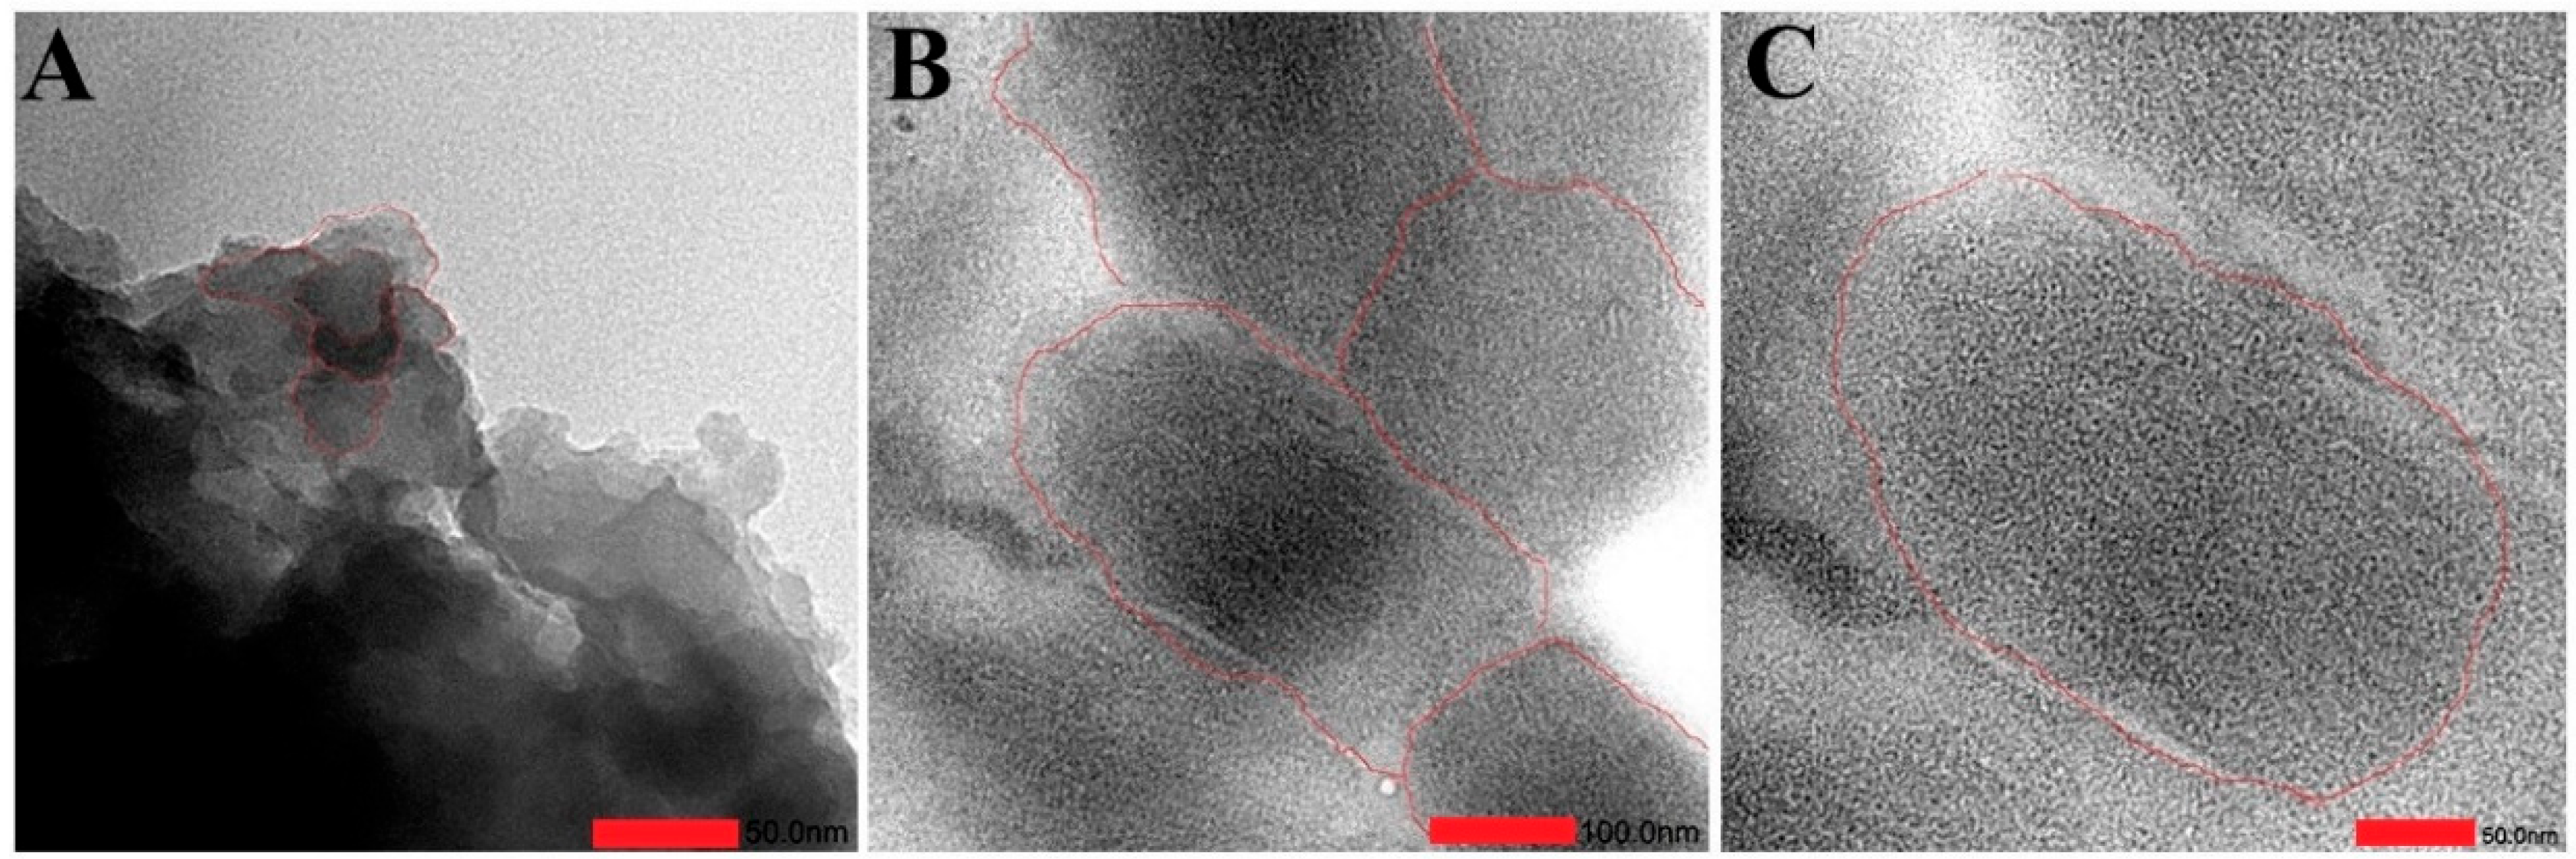
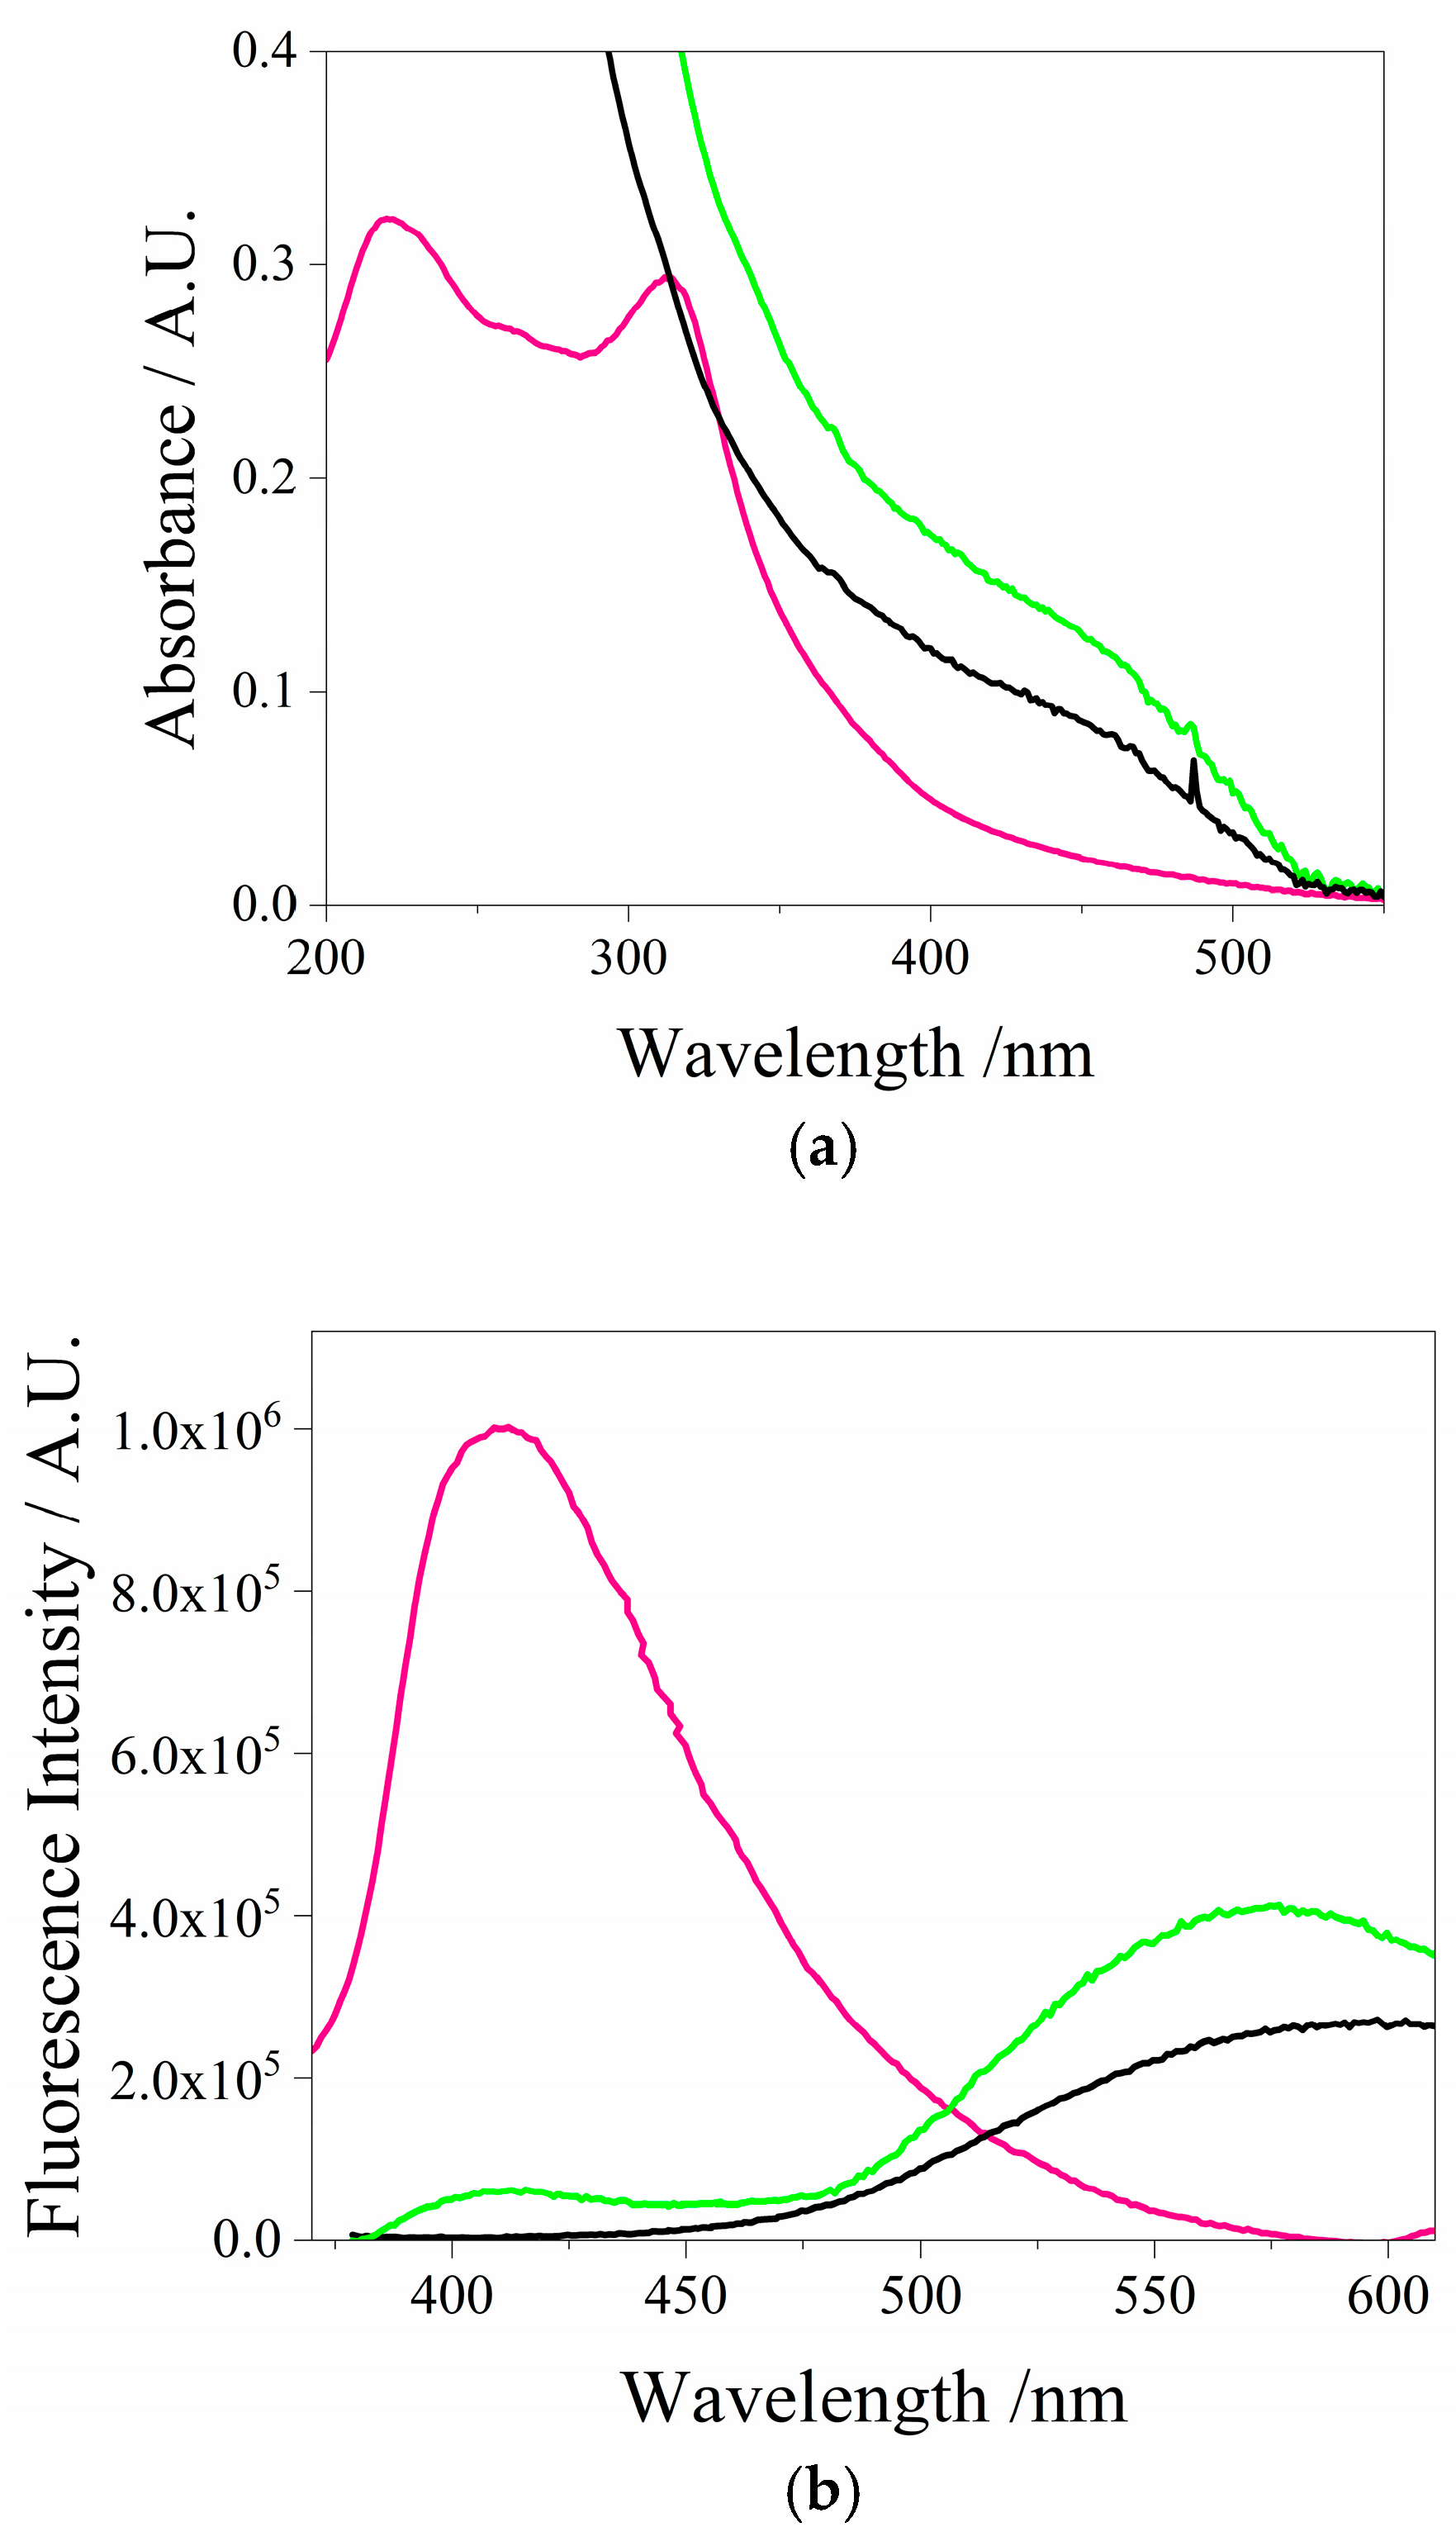
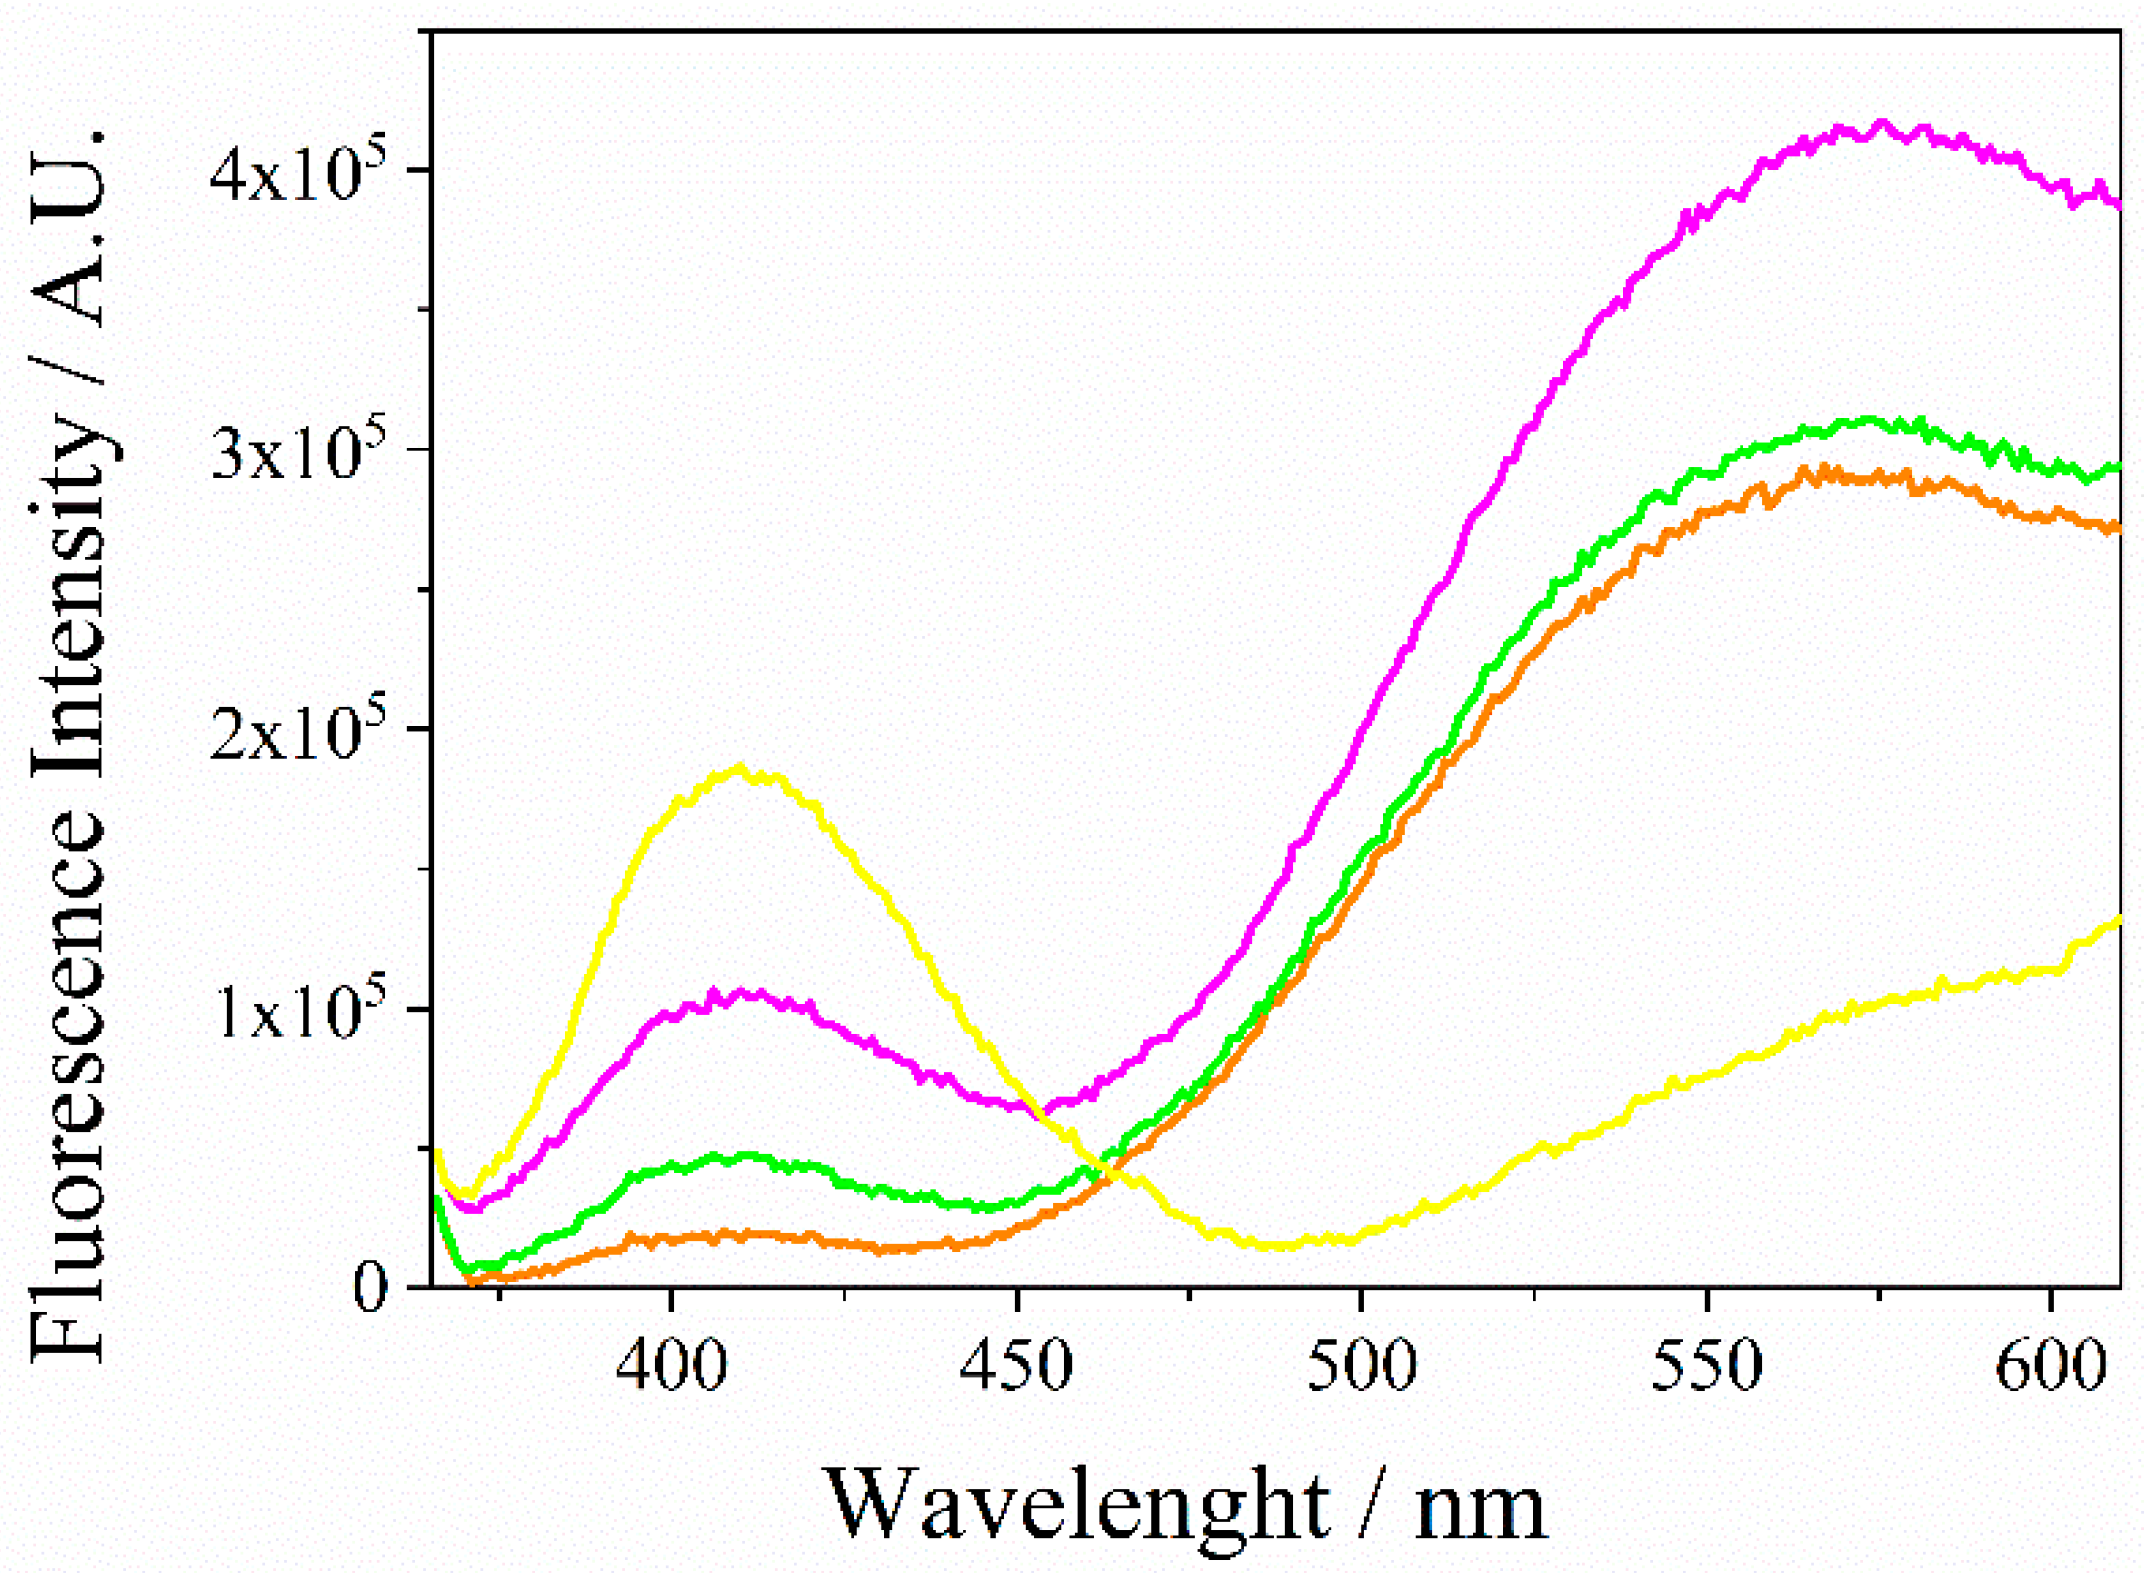
3.1. Spectroscopic Characterization of QDs CdSe@g-C3N4

FTIR was performed on g-C3N4, QDs CdSe, and QDs CdSe@g-C3N4, as shown in Figure 1. Exfoliated g-C3N4 (green line) shows typical FTIR spectra as reported in the literature, with a peak at 809 cm−1 due to the presence of triazine rings. Bands at 1572 cm−1 and 1632 cm−1 were attributed to C=N stretching, while the bands at 1235 cm−1, 1327 cm−1, and 1405 cm−1 corresponded to aromatic C-N stretching [43]. Peaks between 3000 cm−1 and 3600 cm−1 were due to N-H groups and adsorbed O-H groups, respectively. The FTIR of QDs CdSe stabilized with MPA:MES (orange line) showed peaks in the range of 770 cm−1 to 796 cm−1 attributed to the stretching vibrational mode of the Cd-Se bond [44], and peaks at 1492 cm−1 and 1525 cm−1 corresponded to C=O and C-O, respectively, due to MPA [39]. In the case of QDs CdSe@g-C3N4 (black line), the characteristic bands of g-C3N4 were smaller in comparison to bands of QDs CdSe. However, peaks located between 1572 cm−1 and 1632 cm−1 were attributed to the stretching of the C=N bonds. In addition, principal peaks of QDs CdSe were also observed, demonstrating the presence of both nanomaterials.
The morphology of g-C3N4 and QDs CdSe@g-C3N4 was analyzed by TEM. Figure 2A corresponds to bulk g-C3N4, in which overlapping sheets, characteristic of bulk graphitic nitride structures, were clearly observable. Figure 2B,C correspond to the heterostructure of QDs CdSe@g-C3N4, in which the QDs CdSe are uniformly distributed on sheets of g-C3N4. These findings are consistent with the growing of quantum dots on the surface of the g-C3N4 sheet during the in situ synthesis of the heterostructure.
Figure 3a shows absorption spectra of g-C3N4, QDs CdSe, and QDs CdSe@g-C3N4. The absorption spectrum of exfoliated g-C3N4 (magenta line) shows a broad band with two peaks centred at 218 nm and 313 nm, respectively. The first peak was attributed to a π → π* transition of the C-N double bond, and this peak did not appear in a solution of the bulk nitride. However, it is sharply defined when the nitride sheets are separated, e.g., by exfoliation. The second absorption peak corresponds to a transition of n → π* [45].
Absorption spectra of QDs CdSe and QDs CdSe@g-C3N4 (black and green lines) shown a band close to 435 nm, due to the electronic transition between valence and conduction bands of nanocrystals. However, in the heterostructure, the absorption band of g-C3N4 was not observed due to its low concentration compared to the concentration of the QDs CdSe.
On the other hand, when solutions were excited to 320 nm, fluorescence emission spectra were obtained (Figure 3b). The spectra of g-C3N4 (magenta line) presented a symmetric band centred at 414 nm. The fluorescence emission spectrum of QDs CdSe showed a band centred around 598 nm (black line). For QDs CdSe@g-C3N4, two bands centred at 414 nm and 598 nm were observed, corresponding to g-C3N4 and QDs CdSe (green line). However, a decrease of 94% in the intensity of fluorescence was observed for the g-C3N4 band, and an increase of 54% corresponding to QDs CdSe band was observed. These effects are due to RET, where the g-C3N4 acts as a donor and QDs CdSe act as acceptors of energy. This result is consistent with an overlap between the emission band of g-C3N4 and the absorption band of QDs CdSe (see Figure S2) [46]. The presence of g-C3N4 in the conjugated heterostructure facilitates the effective movement of charge carriers towards the QDs CdSe, thereby enhancing the emission of QDs CdSe (fluorescence or electrochemiluminescence). Time-resolved fluorescence decay spectra were gathered to investigate the charge carrier transfer dynamics (see Figure S2 in Supplementary Materials). Each sample showed two distinct radiative lifetimes (τ), whose relative percentages were calculated by fitting the decay spectra by means of a bi-exponential equation (see Supplementary Materials). Results are shown in Table 1. The lifetimes of the conjugated heterostructure were similar to those of the unconjugated QDs CdSe, but a slight increase in τ2 was observed for the heterostructure, suggesting that g-C3N4 may reduce non-radiative recombination.
When the synthesis of the heterostructure is carried out using twofold concentrations of the precursor of QDs CdSe, the fluorescence of the heterostructure at 598 nm decreases sharply. This effect is due to agglomerations of QDs CdSe on g-C3N4 sheets that produce non-radiative deactivations of the exited state of quantum dots.
Bandgap energies (Eg) of g-C3N4, QDs CdSe and QDs CdSe@g-C3N4 were determined by analyzing the absorption edge in the UV–visible spectra using the Tauc model [47] and are shown in Table 2. The detailed procedure for determining the Eg is described in the Supplementary Materials (Section S4). The Eg of g-C3N4 was higher than those obtained for QDs CdSe and QDs CdSe@g-C3N4. These results allow us to infer that the Eg of heterostructure is governed by QDs CdSe on g-C3N4 sheets.

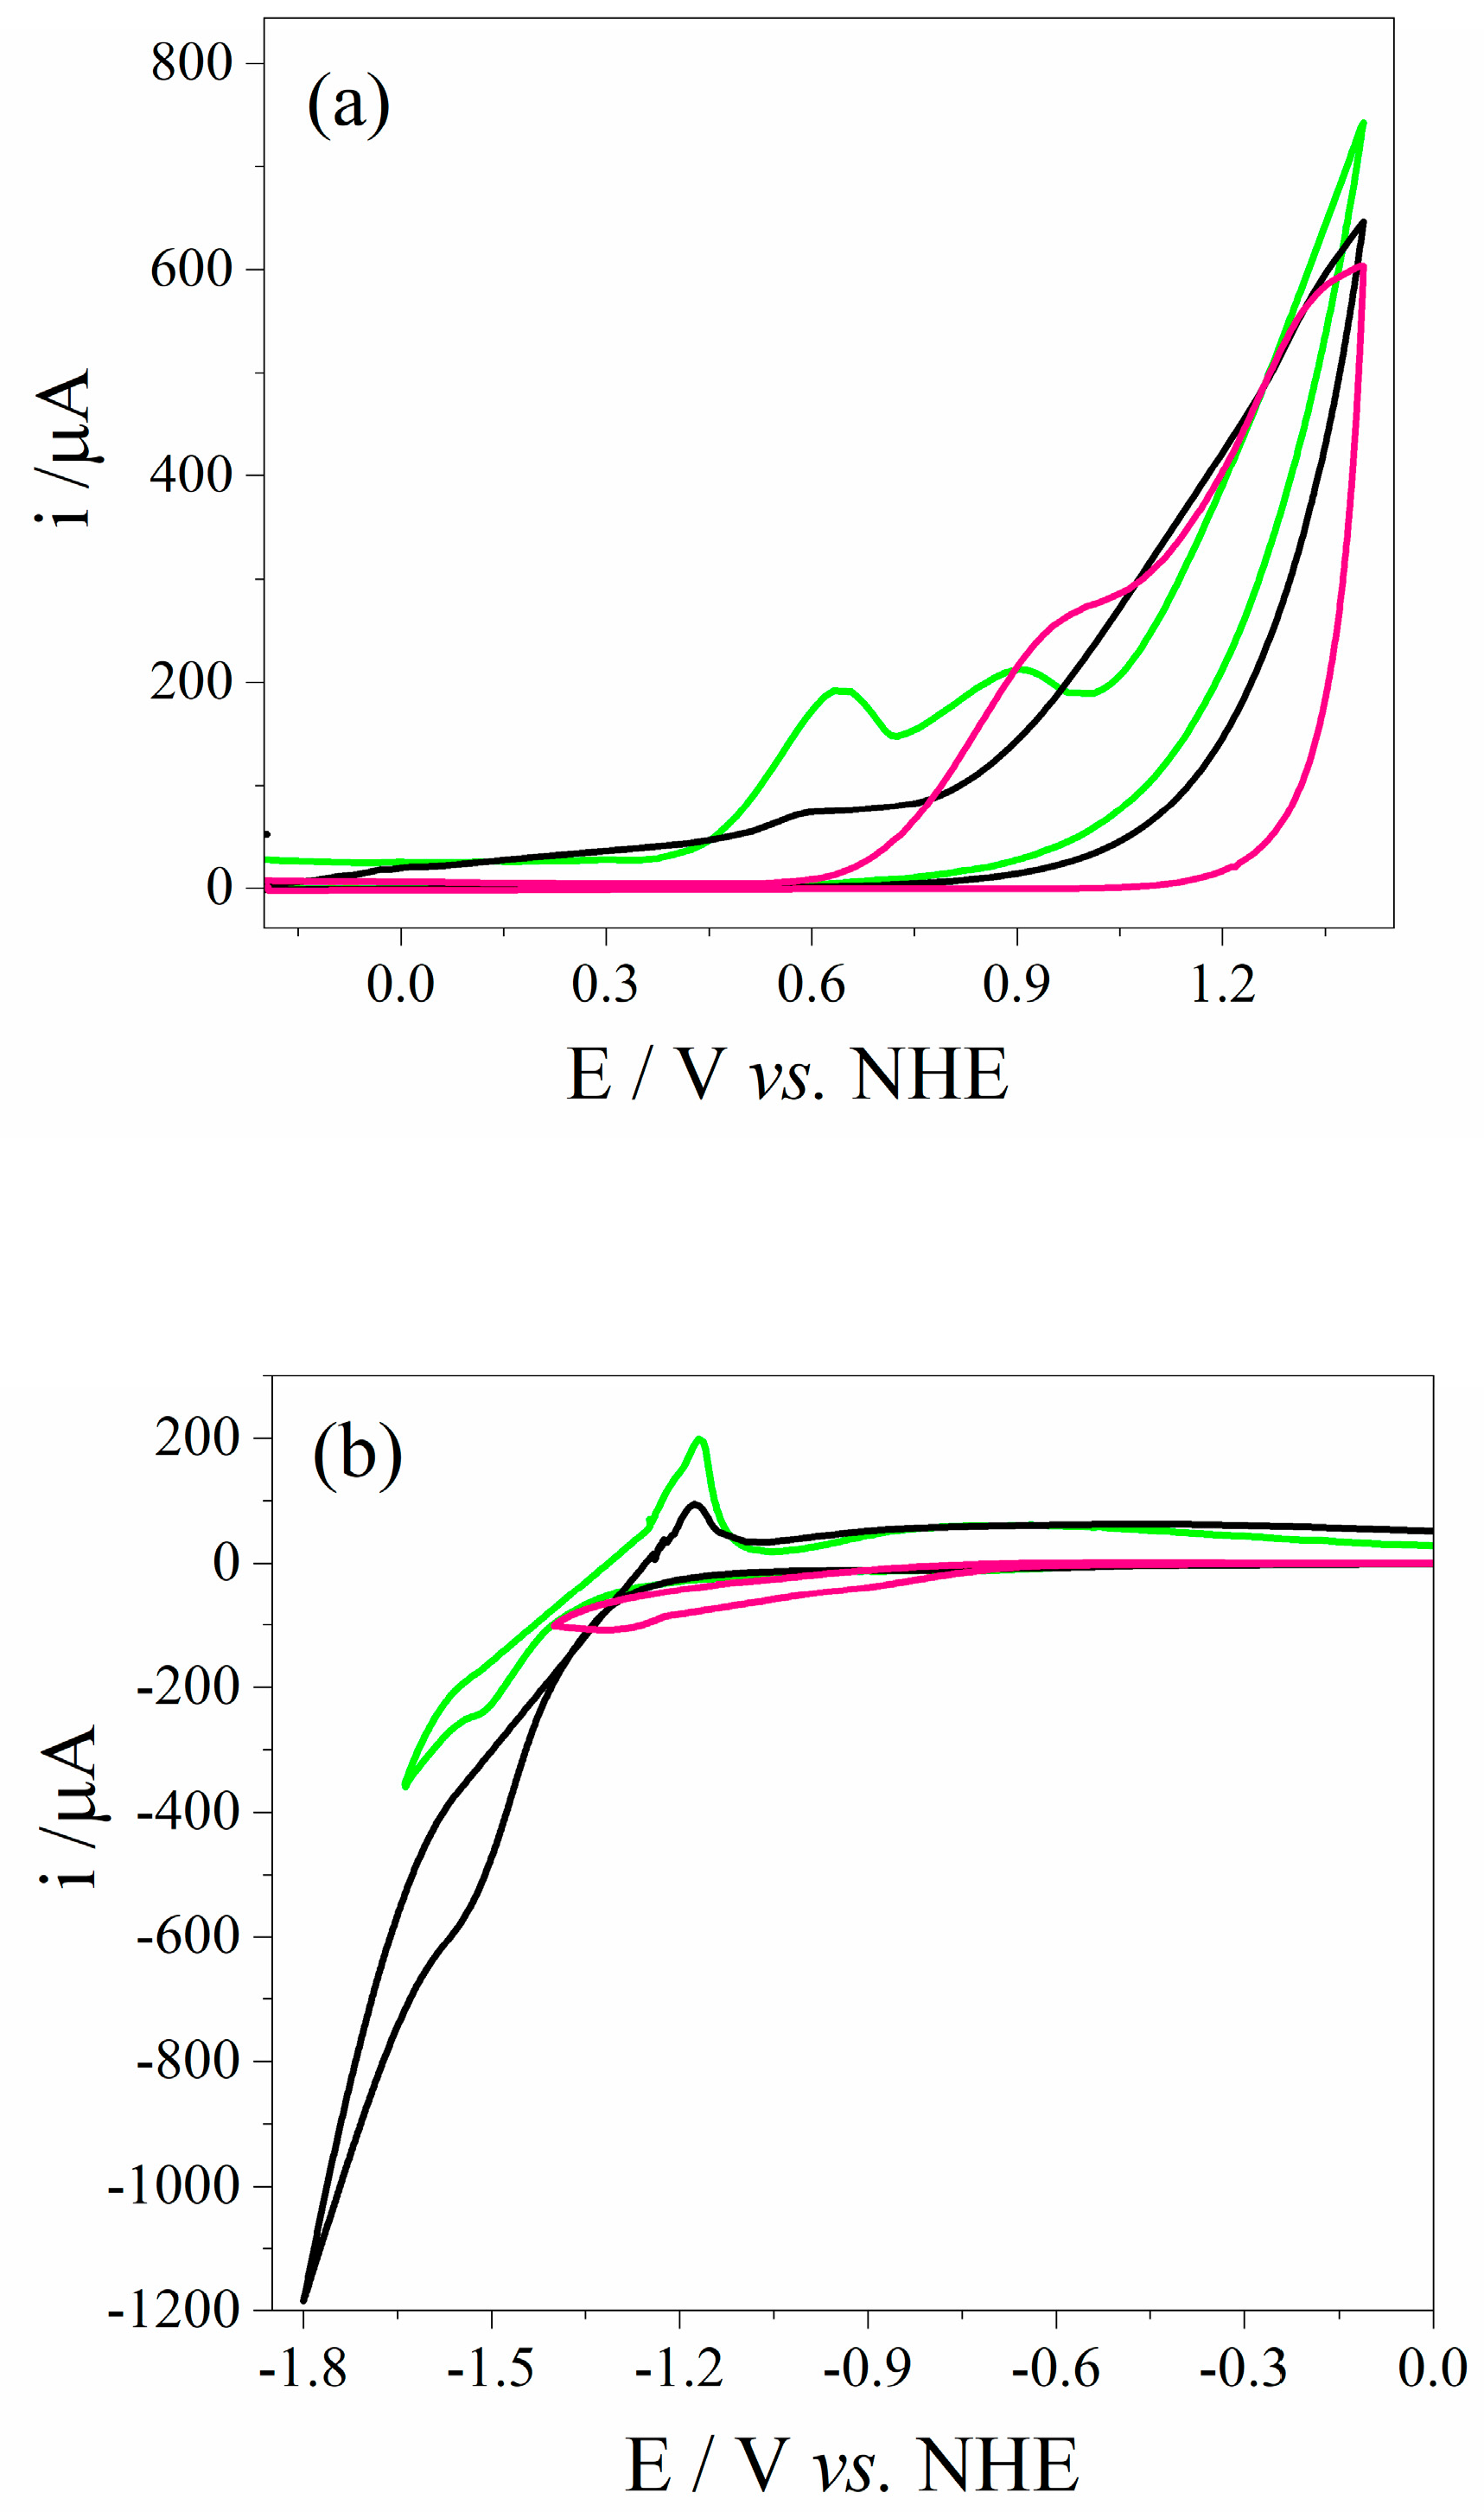
3.2. Electrochemical Characterization of QD CdSe@g-C3N4

Electrochemical studies of g-C3N4, QDs CdSe and QDs CdSe@g-C3N4 were carried out to determine their reduction and oxidation potentials, aiming to identify possible mechanisms of electron and hole transfer between the two nanostructures. Thus, cyclic voltammograms were performed in 1000 µL of acetonitrile containing 0.1 M of tetrabutylammonium hexafluorophosphate as a supporting electrolyte + 50 µL of each sample, under an oxygen-free atmosphere, applying a scan rate (v) of 50 mV s−1. As shown in Figure 4a, the cyclic voltammograms of g-C3N4 and QDs CdSe (represented by the magenta and black lines, respectively) exhibit an irreversible single peak in the anodic scan, corresponding to hole injection into the valence band (VB). When the cathodic scan was performed, g-C3N4 showed an irreversible single peak corresponding to electron injection into the conduction band (CB) (Figure 4b, magenta line). QDs CdSe showed a reduction peak during the forward potential scan due to reduction of Cd+2 to Cd0 and an oxidation peak corresponding to oxidation of Cd0 when the potential scan is reversed (Figure 4b, black line). Anodic peak (Ea,p) and cathodic peak (Ec,p) potentials determined for QDs CdSe, g-C3N4 and QDs CdSe@g-C3N4 are listed in Table 2. As shown in Table 2, g-C3N4 is oxidized at a higher potential than QDs CdSe and reduced at a lower potential than QDs CdSe. The anodic voltammograms of QDs CdSe@g-C3N4 exhibit two distinct peaks, corresponding to QDs CdSe and g-C3N4, respectively, as these peaks appear close to the Ea,p of the individual nanostructures. When the cathodic scan was carried out, a single peak was observed in the direct scan at −1.51 V, with its corresponding anodic peak appearing when the scan direction was inverted due to Cd2+/Cd0.
The difference between Ea,p and Ec,pEp) is the Eg determined electrochemically by Equation (1).
ΔEp = Ea,pEc,p = Eg
The values determined are listed in Table 2. These values were very close to Eg determined by the Tauc method (see Table 2).
For the case of the QDs CdSe@g-C3N4, the Ea,p used to determine the ΔEp corresponds to the first peak at 0.630 V vs. HNE. The difference in the Eg values calculated by the optical and electrochemical methods arises from the fact that the photophysical process occurs within the core of each nanomaterial, whereas the ΔEp (potential difference) results from the injection of electrons or holes from the electrode into the nanomaterial, which is a surface-related process [39]. As shown in Figure 4a (green line), QDs CdSe on the heterostructure are oxidized at lower potential that g-C3N4, which allows us to infer, along with the spectral overlap, a possible RET mechanism. When a potential higher than 1 V is applied, QDs CdSe act as hole acceptors, thereby acting as light emitters.

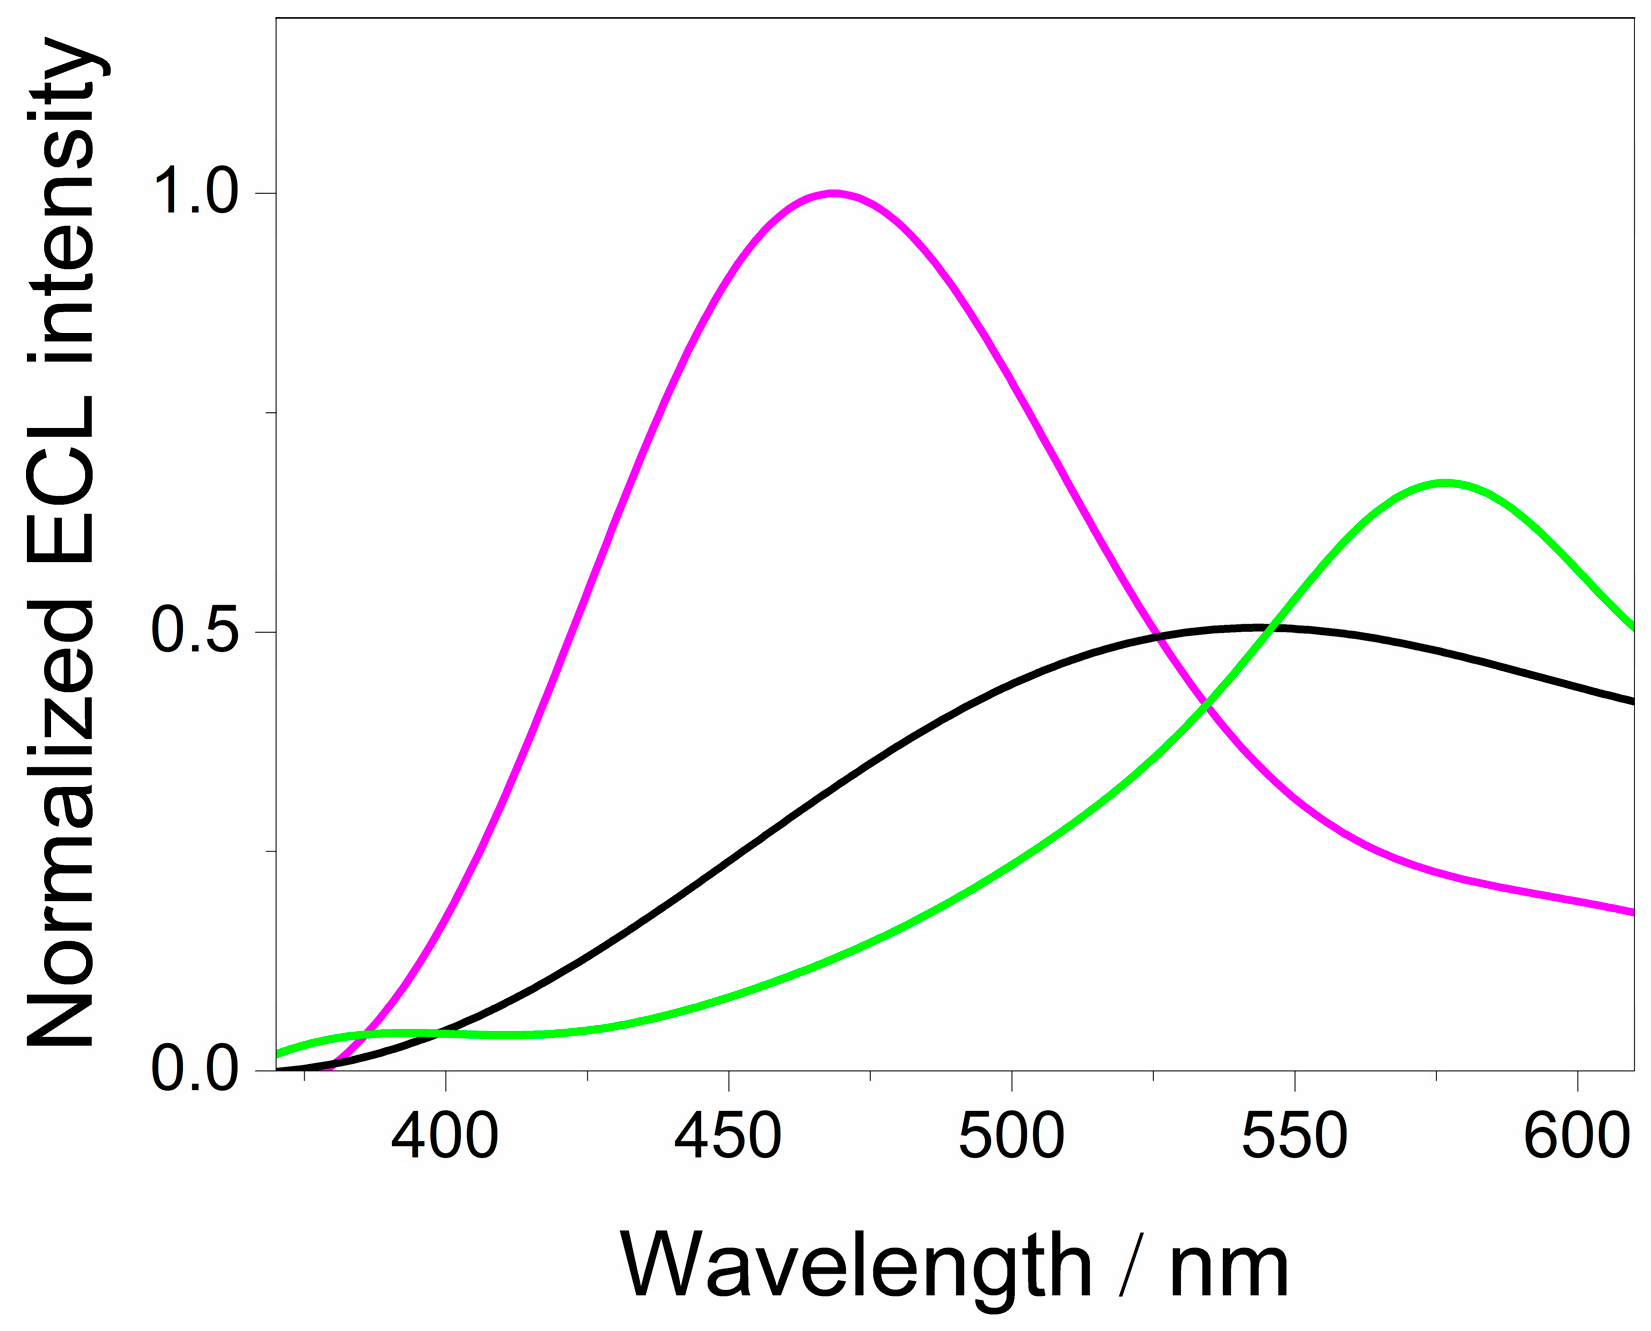
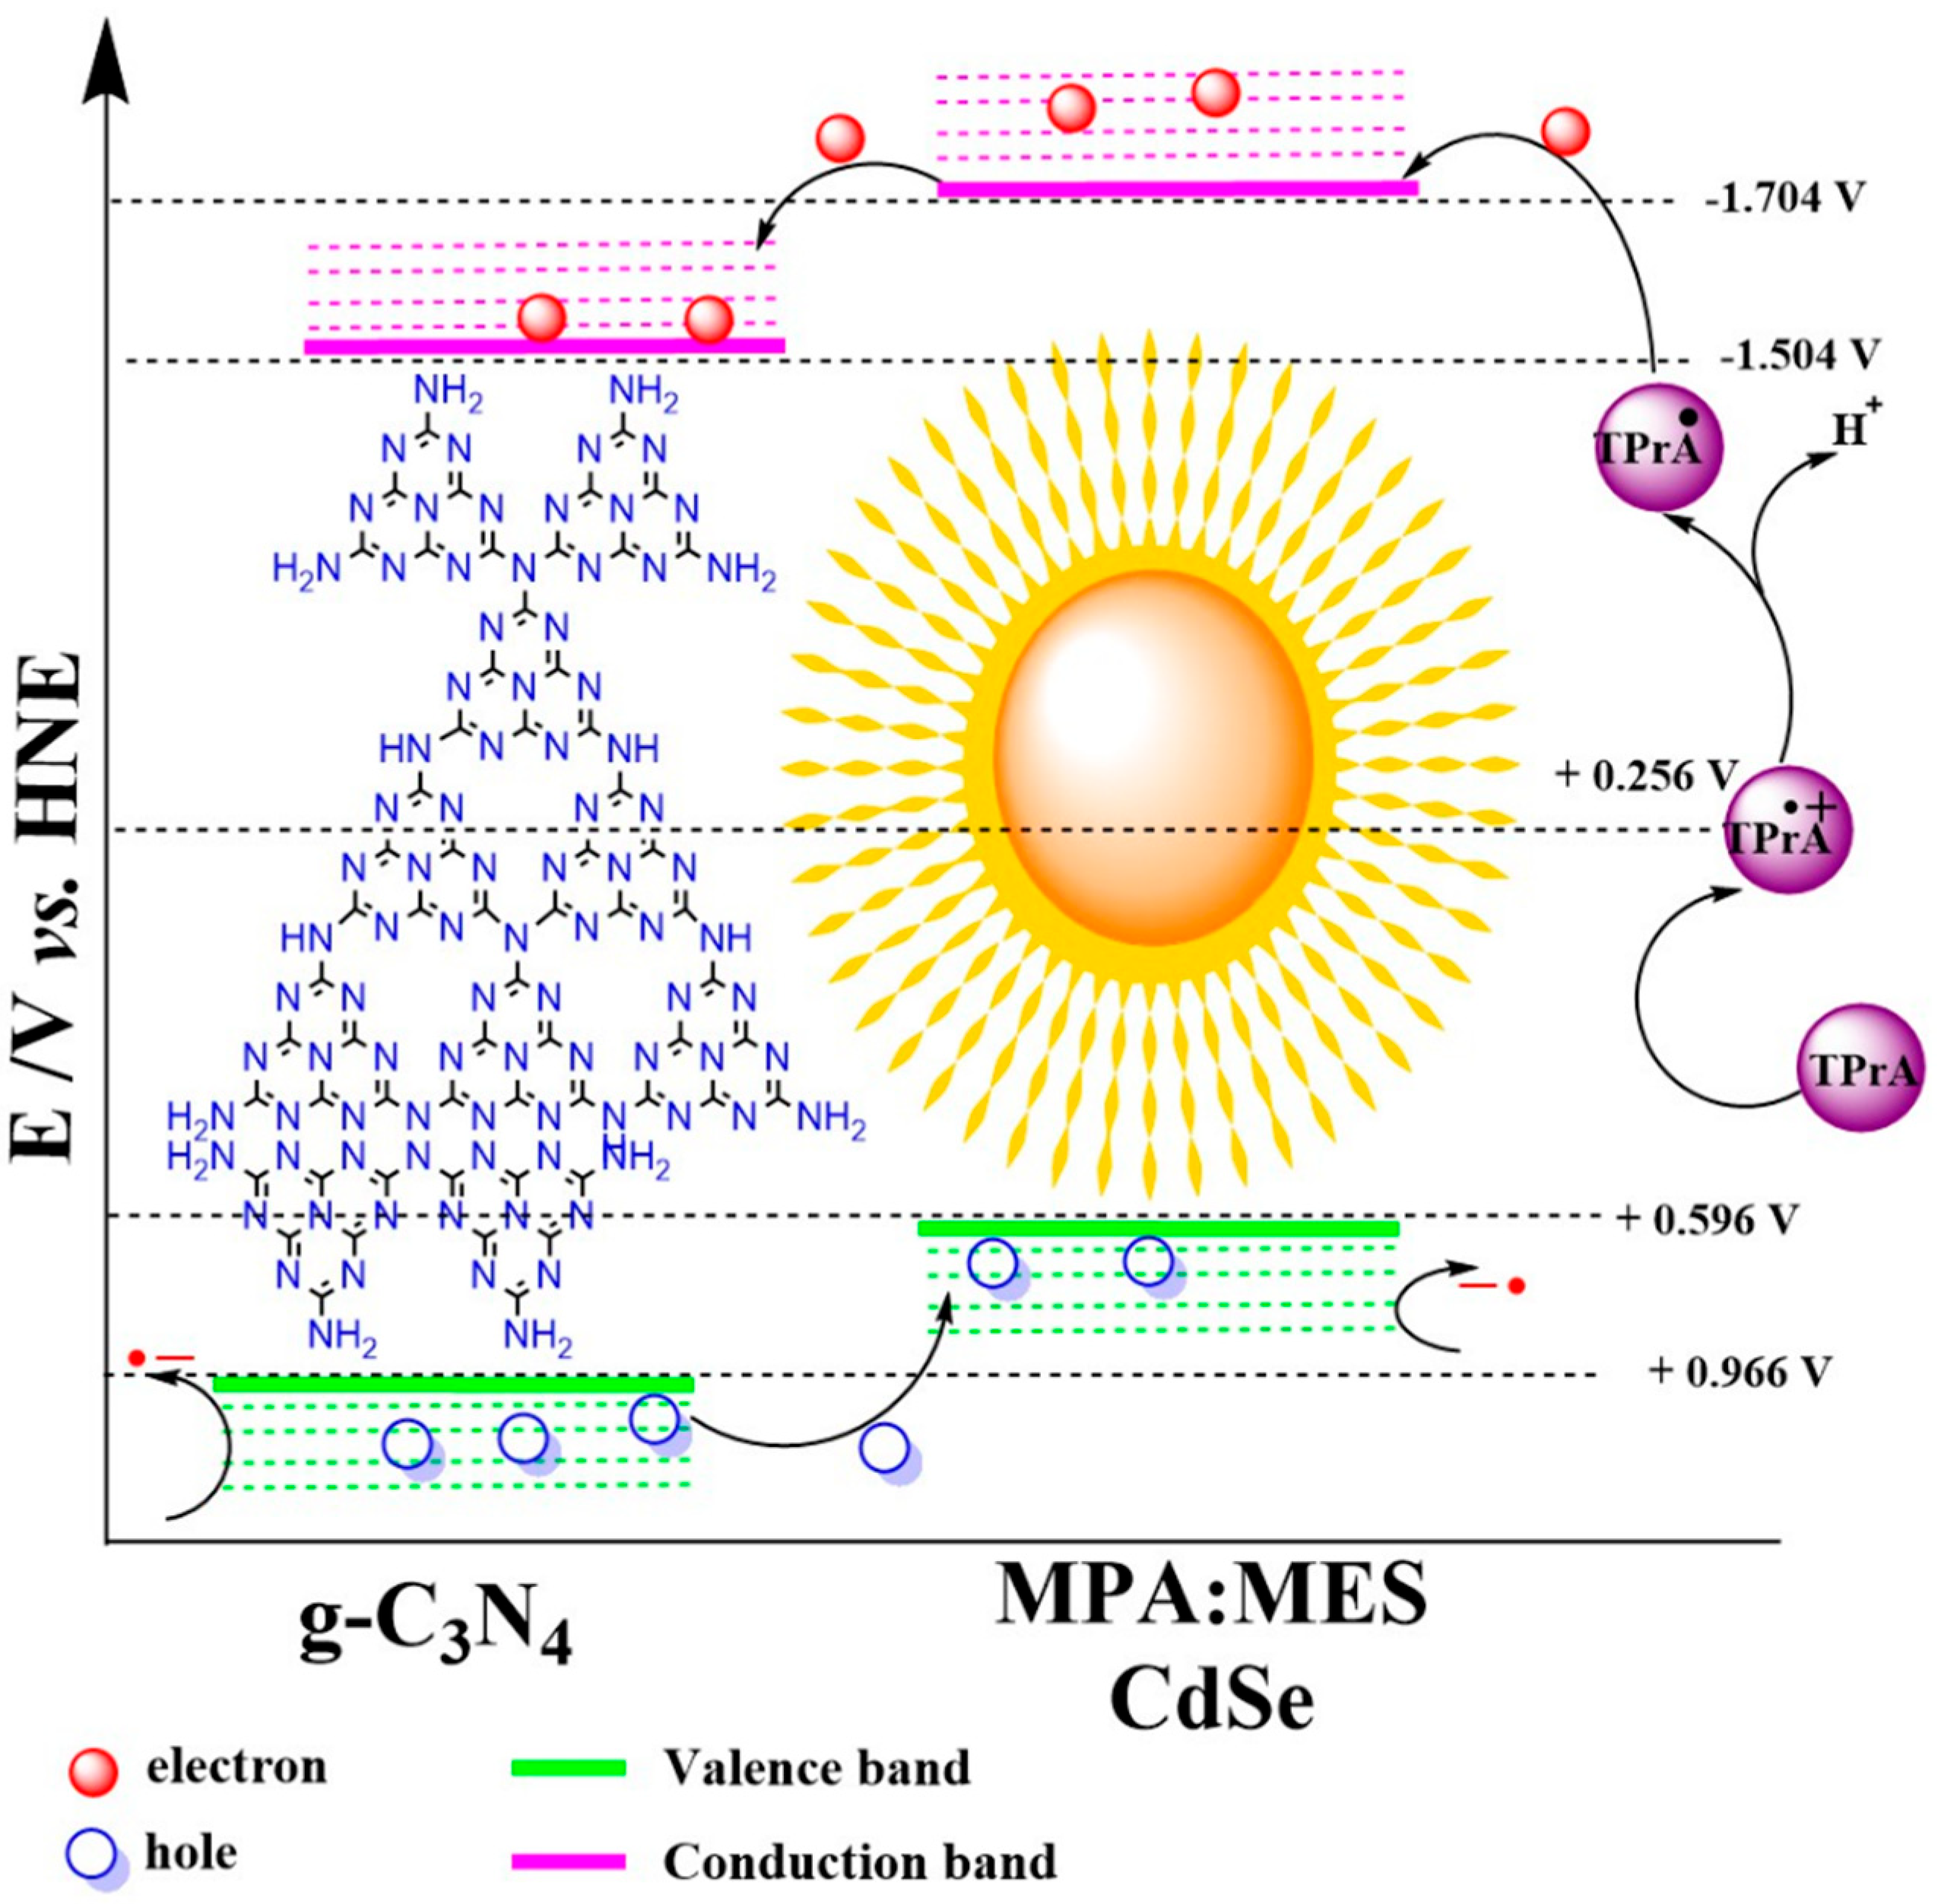
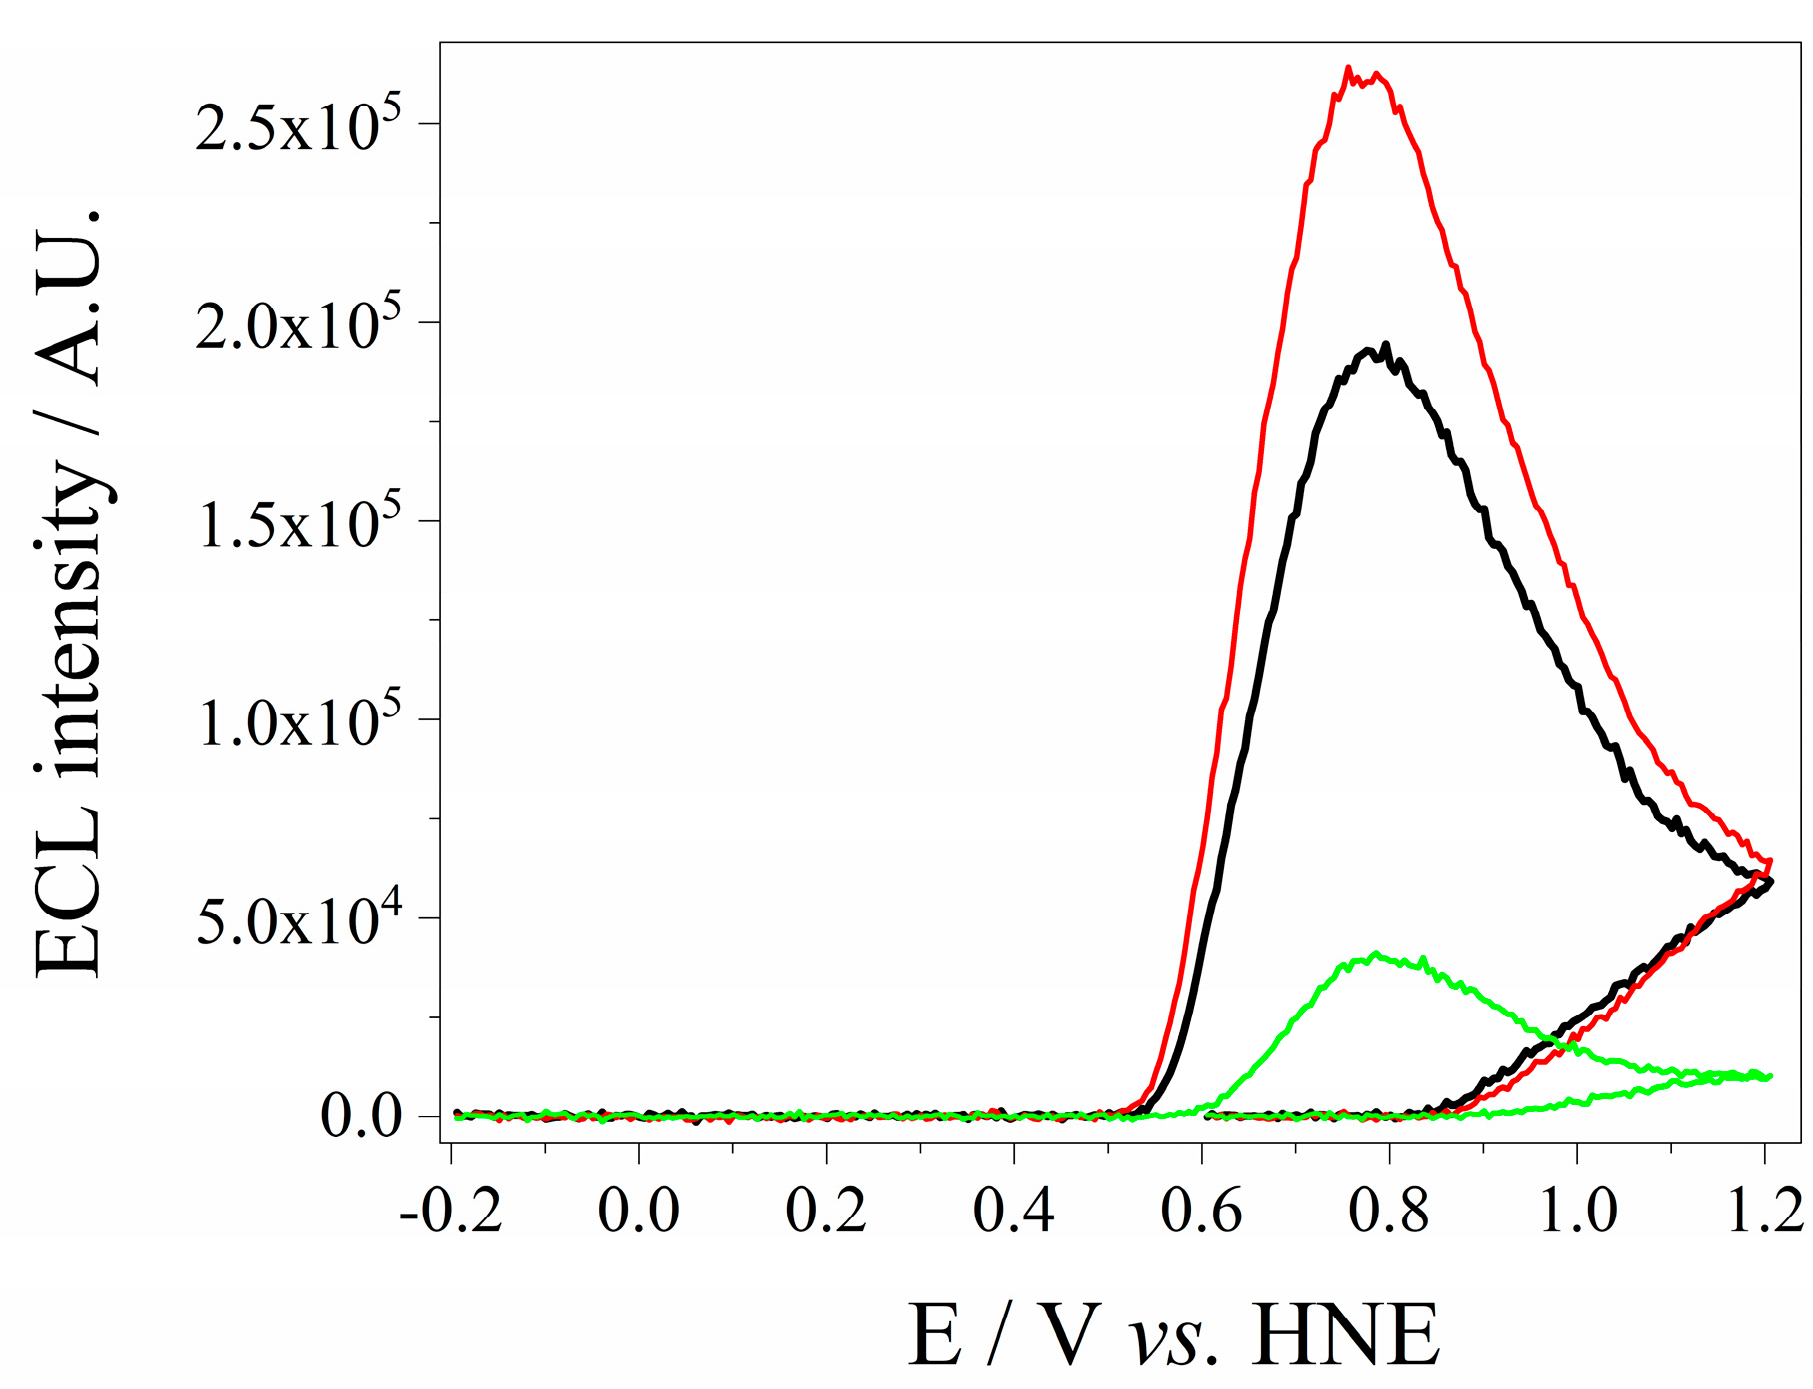
3.3. Electrochemiluminescence Analysis of QDs CdSe@g-C3N4

To perform ECL measurements, 60 μL of the dispersion of either QDs CdSe, g-C3N4, or QDs CdSe@g-C3N4 was added to a 0.1 M Tris-HCl buffer solution, pH 7.5, + 100 μL of TPrA at a concentration of 5.25 M. TPrA was used as a co-reactant in the mechanism of light generation by electrochemiluminescence. ECL measurements were carried out as described in the Supplementary Materials (Section S2).
Figure 5 shows the ECL spectra of g-C3N4, QDs CdSe, and QDs CdSe@g-C3N4 when a potential of 1.1 V is applied. In comparison with the fluorescence spectrum (Figure 2B), the ECL spectrum of g-C3N4 shows a bathochromic shift close to 50 nm, which is common in electrochemical processes [48]. However, QDs CdSe exhibit a hypsochromic shift of approximately 55 nm in their ECL emission.
The ECL spectrum of QDs CdSe@g-C3N4 shows a predominant peak with a maximum at 578 nm corresponding to the emission of QDs CdSe in the heterostructure, as well as a small band close to 390 nm attributed to g-C3N4. The spectral shifts observed in the absorption band of QDs CdSe within the heterostructure, when compared to QDs CdSe solution, result from different synthesis conditions. Specifically, the first ones were grown directly on g-C3N4 nanosheets, whereas the second ones were synthesized in colloidal solution. From the ECL spectrum of QDs CdSe@g-C3N4, it is possible to infer that there is a charge transfer from nitride to the QDs CdSe, where g-C3N4 acts as a hole donor to QDs CdSe, and QDs CdSe are the light-emitting species. This process is explained by the Ea,p of both nanostructures, as shown in Figure 6.
When the anodic potential exceeds 1.10 V, g-C3N4, QDs CdSe and TPrA are oxidized on the electrode. TPrA forms its radical cation (TPrA•+), which is deprotonated to generate a highly reducing radical (TPrA). TPrA reduces the heterostructure, thereby increasing the population of electrons in the conduction band (CB). In addition, g-C3N4 is oxidized at a higher anodic potential than QDs CdSe, and a hole transfer occurs from g-C3N4 to the QDs CdSe, resulting in a higher population of holes in the valence band (VB) of the QDs CdSe, and favouring the recombination of electron–hole pairs. This process enhances the radiative recombination [49].

3.4. ECL Measurements of QDs CdSe@g-C3N4 Solution

Figure 7 shows ECL voltammograms of a QDs CdSe@g-C3N4 solution. An increase in ECL intensity was observed for higher potential of 0.520 V, reaching its maximum around 0.8 V (black line). This behaviour is in accordance with the electrochemical oxidation of both QDs CdSe and g-C3N4 within the heterostructure. When a low concentration of H2O2 is added into the cell (4 × 10⁻⁶ M), an increase in ECL intensity is observed (red line). This enhancement was attributed to the oxidative capacity of H2O2, where its reduction or decomposition generated highly reactive intermediates that participate in the redox cycle of the QDs CdSe@g-C3N4, promoting the formation of excited states that enhance the ECL signal. However, when higher concentrations of H2O2 were added, a decrease in ECL intensity was observed, as depicted in Figure 7 (green line). An overproduction of reactive oxygen species can be produced, which could lead to the oxidative degradation of the heterostructure, reducing its emissive properties.
On the basis of the data obtained, and from previous reports, at pH = 7.4, a probable ECL mechanism is proposed [50]:
TPrA + Tris + TPrAH + + Tris
TPrA e TPrA +
TPrA + + Tris TPrA + Tris +
QDs   CdSe @ g- C 3 N 4 n e n QDs   CdSe @ g- C 3 N 4 +
QDs   CdSe @ g C 3 N 4 + + TPrA QD   CdSe @ g C 3 N 4 + TPrA +
QDs   CdSe @ g C 3 N 4 + + TPrA QD   CdSe @ g C 3 N 4 * + Im +
QDs   CdSe @ g C 3 N 4 * QD   CdSe @ g C 3 N 4 + h ν
QDs   CdSe @ g - C 3 N 4 + TPrA + H 2 O 2 QD   CdSe @ g C 3 N 4 oxidized + TPrA ( oxidized ) + H 2 O
At pH 7.4, Tris+ protonates TPrA via an acid–base reaction (Equation (2)) [51]. Then, when a potential of 0.60 V is applied, TPrA is oxidized to form the radical cation TPrA+• (Equation (3)), which diffuses and is deprotonated by Tris (Equation (4)) [52]. When the potential reaches 1.10 V, CdSe QDs@g-C3N4 is oxidized through n-electron transfer, generating CdSe QDs@g-C3N4+• (Equation (5)). Both g-C3N4 and QDs CdSe undergo an oxidation, initiating a resonance energy transfer (RET) process where n-holes from the valence band of g-C3N4 migrate to the valence band of CdSe QDs (Figure 6) [33]. Subsequently, CdSe QDs@g-C3N4+• can react with TPrA or TPrA to produce TPrA+• and a high-energy species (CdSe QDs@g-C3N4*) along with an imidazole cation (Im+) (Equations (6) and (7), respectively). CdSe QDs@g-C3N4* then returns to its ground state by emitting radiation (Equation (8)). However, in the presence of H2O2, both CdSe QDs@g-C3N4 and TPrA can be oxidized by H2O2 (Equation (9)), quenching the ECL process.

3.5. Determination of Optimal Ratio of QDs CdSe and g-C3N4

In order to determine the optimum ratio between QDs CdSe and g-C3N4 to maximize the RET effect, different syntheses were performed with varying concentrations of nitride while keeping the concentration of QDs CdSe constant. As shown Figure 8, an increase in fluorescence intensity at 570 nm was observed with increasing g-C3N4 concentration until reaching 0.1 mg mL−1. However, a decrease in emission intensity was obtained for g-C3N4 concentrations higher than 0.1 mg mL−1. Therefore, 0.1 mg mL−1 of g-C3N4 was used for all measurements.

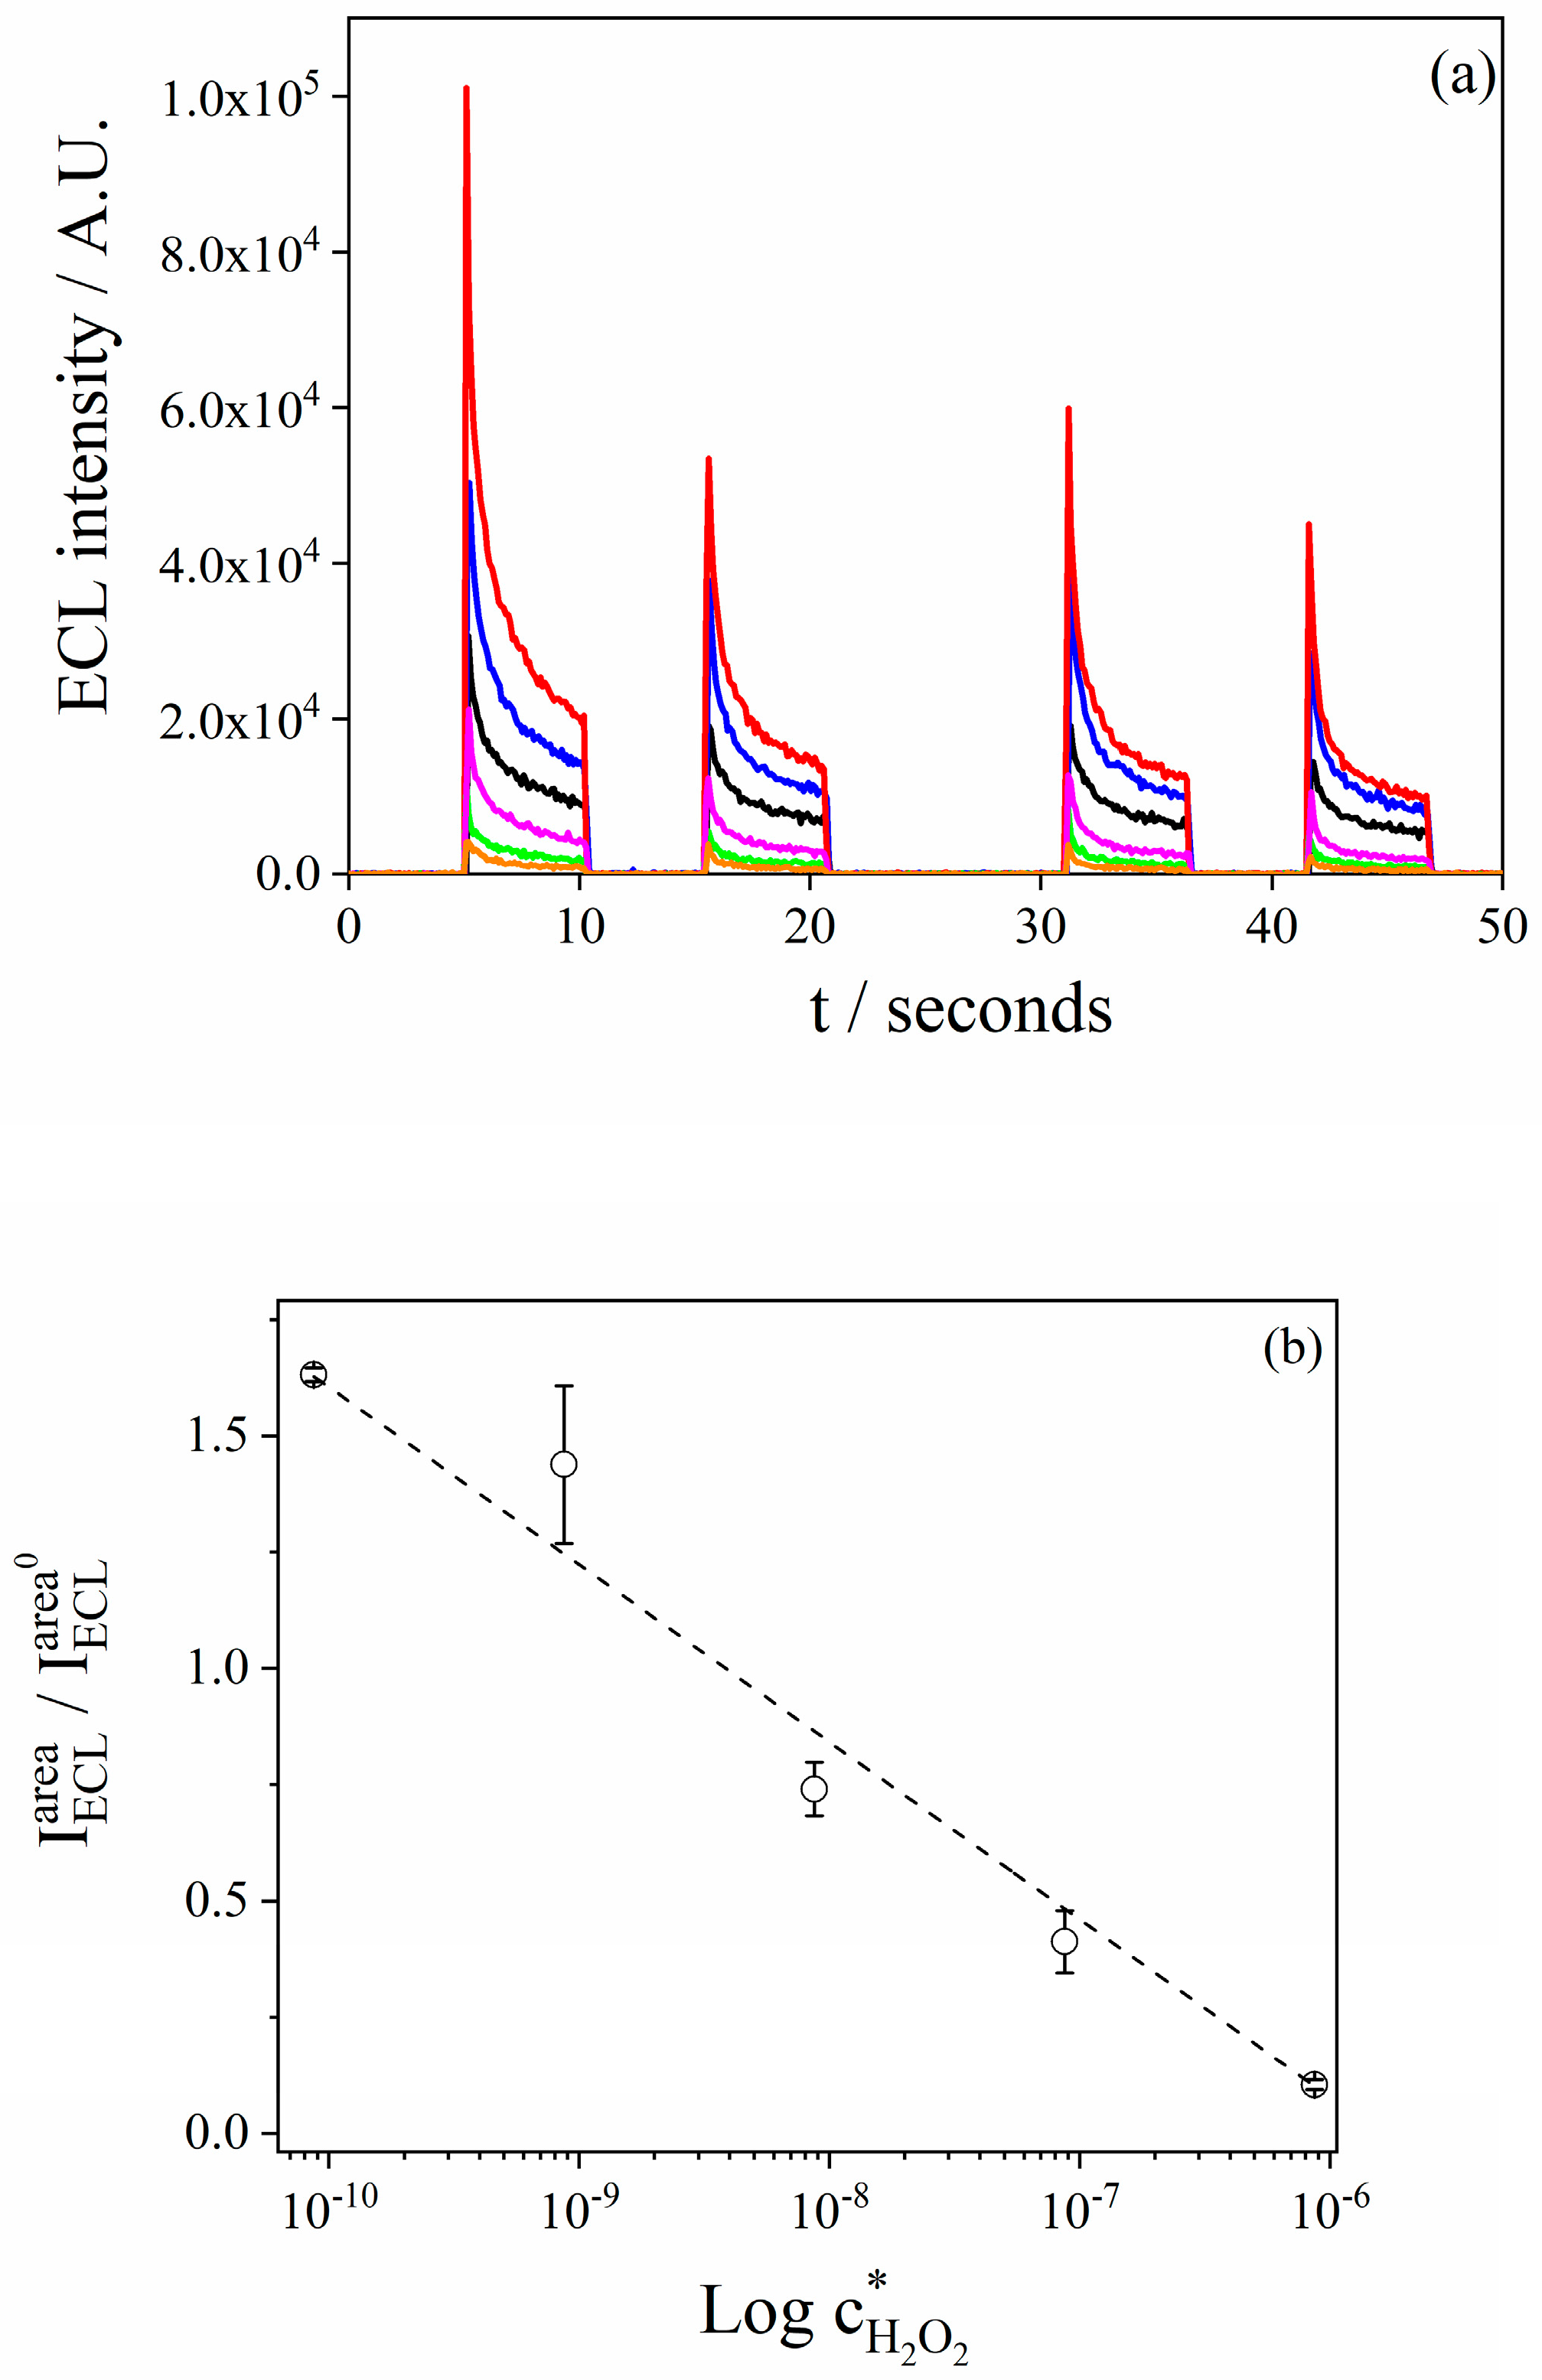
3.6. Analytical Performance of the Electrochemiluminiscence Sensor for H2O2

H2O2 was added at different concentrations to the solution composed of 60 µL of QDs CdSe@g-C3N4 + 100 µL of 5.25 M TPrA in 0.1 M Tris-HCl solution, pH = 7.4 (final volume of 2500 μL). The ECL measurements were performed by applying four cycles of potential pulses between −0.2 V and 1.2 V, where each pulse was applied for 5 s in a measurement known as the on–off response [53]. ECL emission was monitored at 570 nm using a fixed monochromator setting. Figure 9a shows the ECL transients where, as previously observed, the ECL intensity decreases with increasing H2O2 concentrations. In addition, high reproducibility of ECL responses was observed for all H2O2 concentrations. For each H2O2 concentration, the energy intensity values of ECL ( I ECL area ) were determined by calculating the area under each emission transient using the following equation:
I ECL area = t n t n + 5   s ECL   int . × dt
where tn corresponds to the start time of each potential step, and ECL int. is the electrochemiluminescence value for each time. A calibration curve (Figure 9b) was constructed, represented as I ECL area / I ECL area 0 vs. Log c H 2 O 2 * , where I ECL area 0 corresponds to the energy intensity value in the absence of H2O2.
From the calibration curve, the analysis of the figures of merit was carried out [54]. The limit of detection (LOD), limit of quatification (LOQ), and sensitivity were 1.81 × 10⁻⁹ M, 5.37 × 10⁻⁹ M, and 1.52 × 10⁸ M−1, respectively, with a linear range from 5.37 × 10⁻⁹ to 1 × 10⁻⁶ M. These results allow us to infer the excellent LOQ of the ECL sensor for detecting H2O2 in buffer Tris-HCl, pH = 7.4.

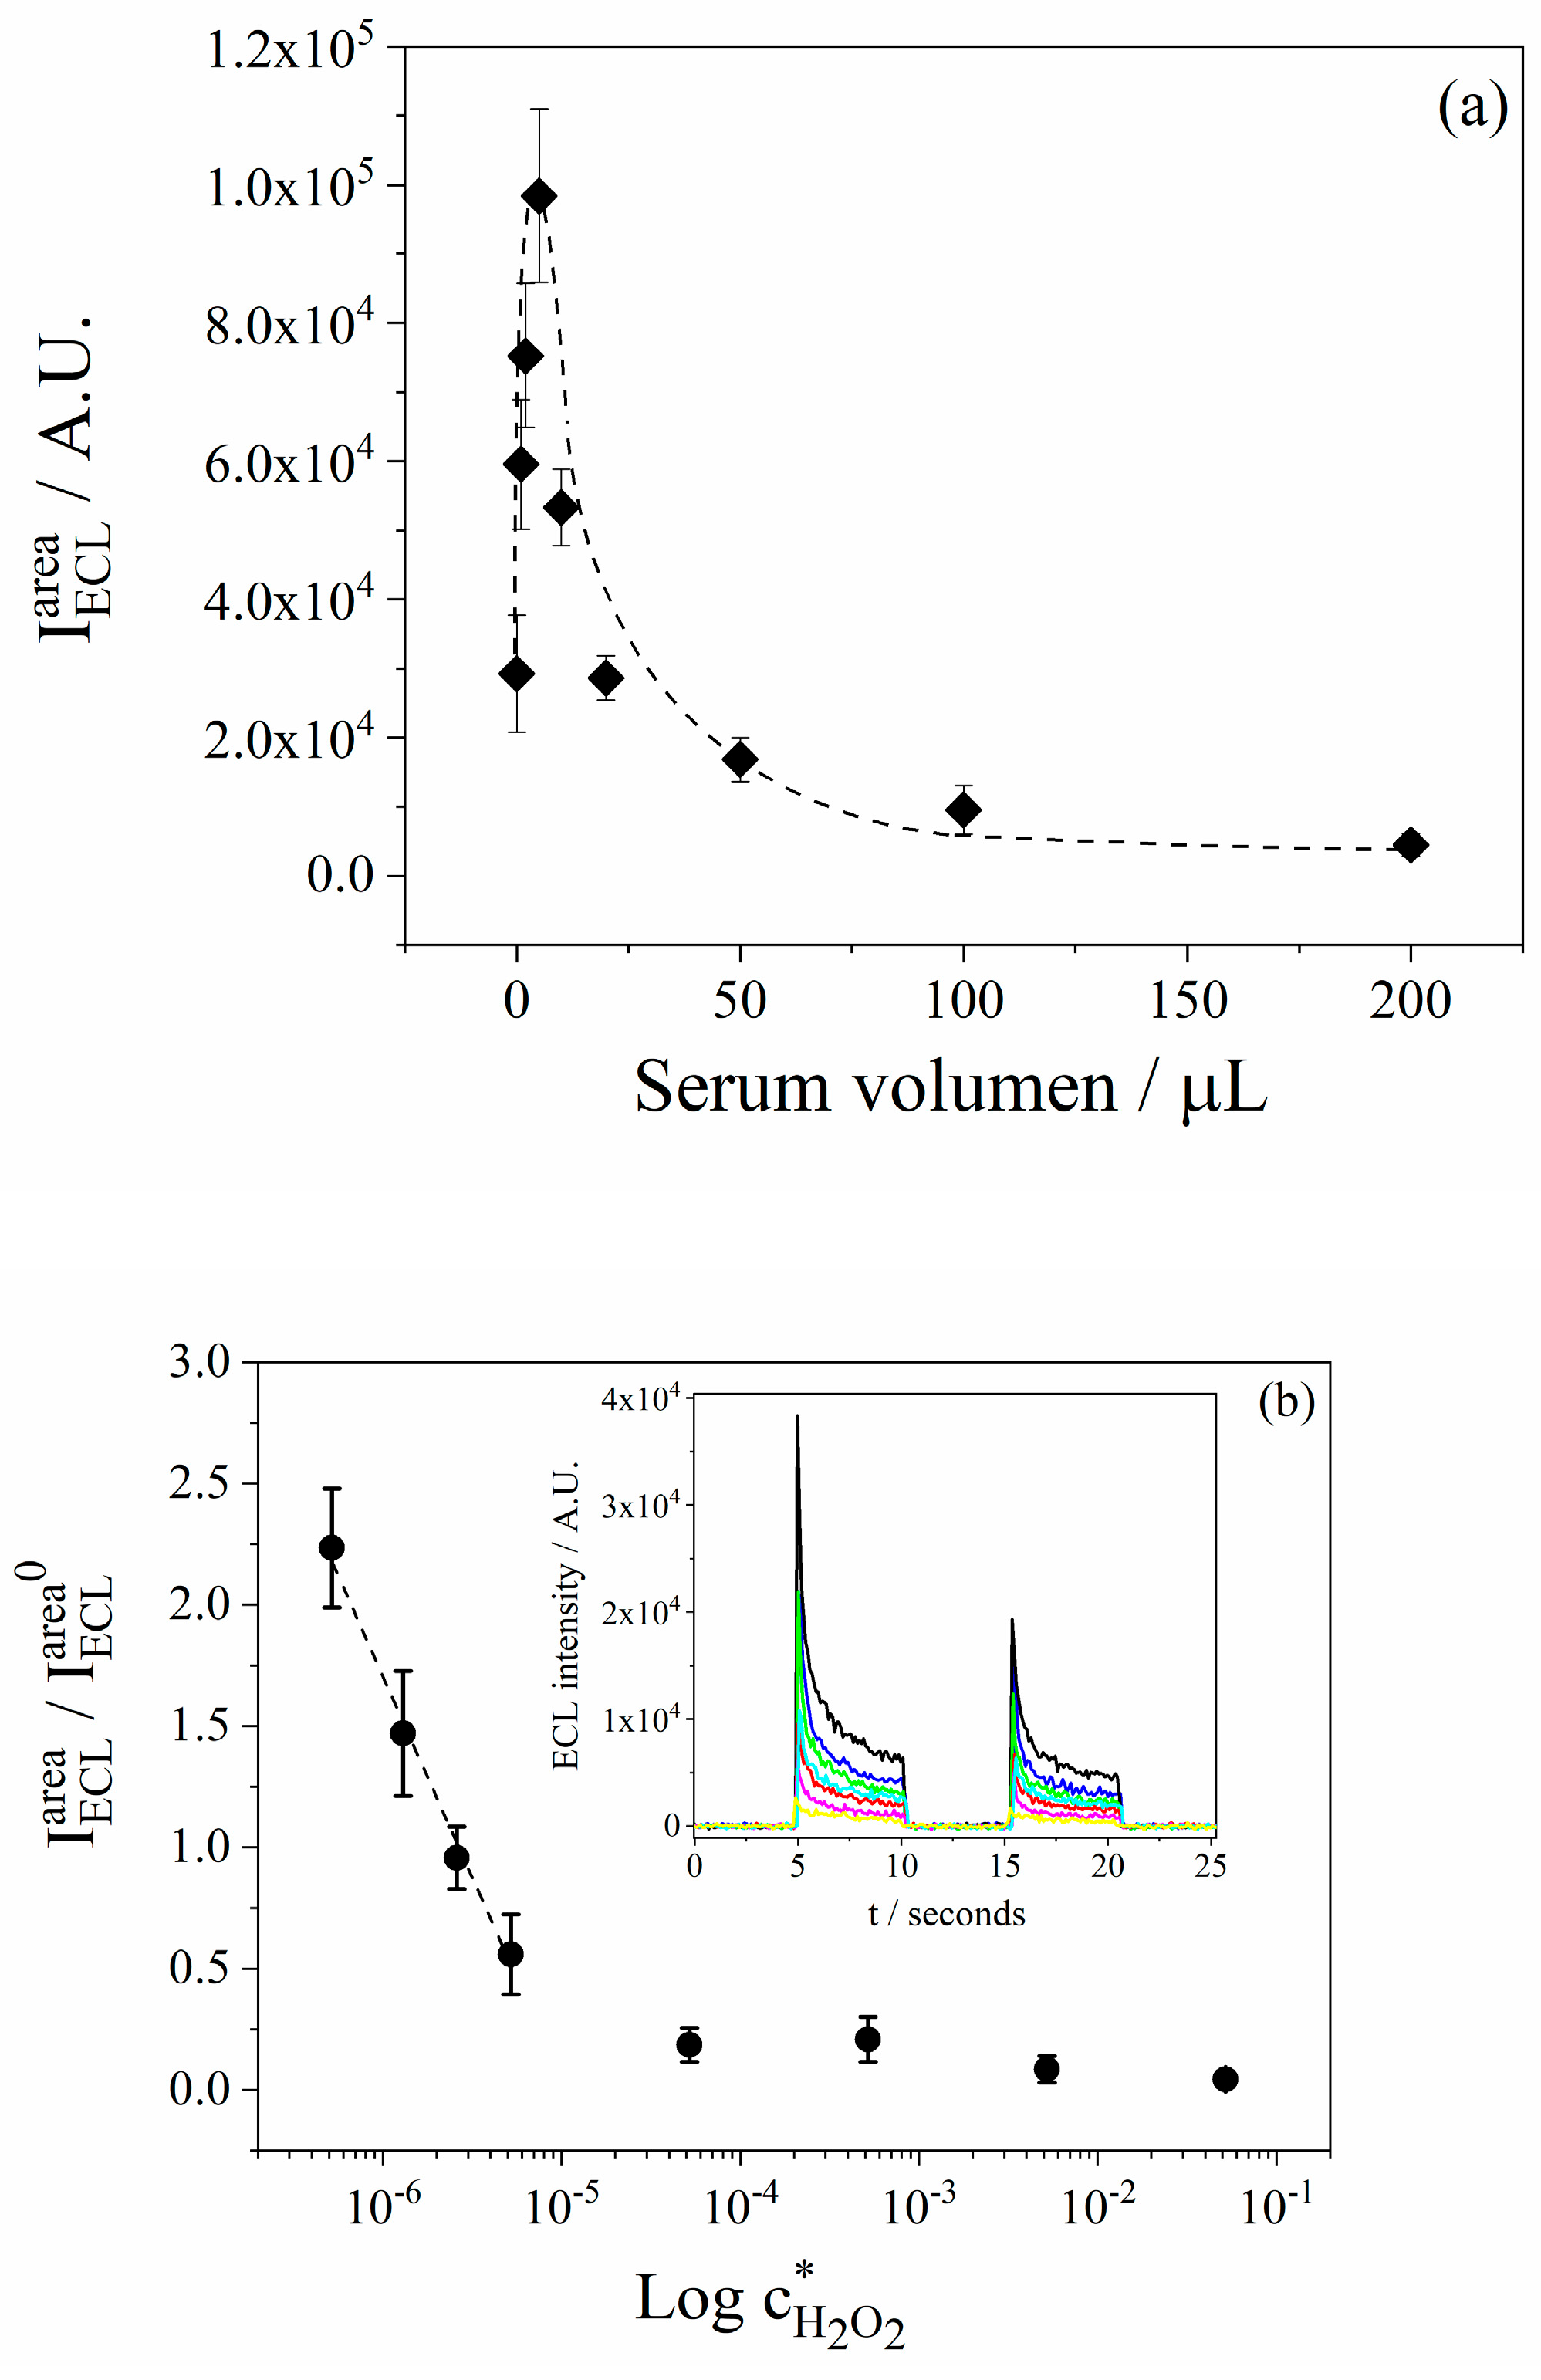
3.7. Quantification of H2O2 in Lyophilized Serum Samples

The detection of H2O2 was carried out, as a proof of concept, in reconstituted lyophilized serum samples because this is a complex matrix with known levels of specific analytes such as electrolytes, enzymes, metabolites, and proteins. Then, the effect of amount of serum added to the cell on ECL responses was determined. Therefore, different volumes of serum were added into the cell containing 60 µL of QDs CdSe@g-C3N4 in 2500 µL of Tris-HCl buffer, pH = 7.4, in the presence of the co-reactant. As shown in Figure 10a, an increase in ECL intensity was observed with increasing serum volume, reaching a maximum value of ECL intensity at 5 µL. For higher serum volumes, a significant decrease in ECL intensity was observed, indicating a clear matrix effect. Therefore, 5 µL of serum sample was chosen for the detection of H2O2. A calibration curve represented as I ECL area / I ECL area 0 vs. Log c H 2 O 2 * using serum samples as the matrix was performed for a H2O2 concentration range from 5.2 × 10⁻⁷ to 1 × 10⁻² M (see Figure 10b). A linear relationship between I ECL area / I ECL area 0 and Log c H 2 O 2 * was obtained in the concentration range from 5.2 × 10⁻⁷ to 5.2 × 10⁻⁶ M. Due to the matrix, the ECL intensity decays by approximately four times compared to the ECL intensity obtained in buffer solution. Due to this matrix effect, the I ECL area / I ECL area 0 ratio tends toward zero for H2O2 concentrations (in lyophilized serum) higher than 5 × 10⁻⁶ M. The lowest H2O2 concentration detected was 5.2 × 10⁻⁷ M.
The reproducibility of the electrochemiluminescent sensor in the linear concentration range was good. Since the calibration curve was created using the sample matrix, these results allow us to infer that the electrochemiluminescent sensor is a reliable tool for determining H2O2 in serum samples. Percentage coefficient variation values for H2O2 concentrations of 5.20 × 10⁻⁷ M, 1.30 × 10⁻⁶ M and 2.60 × 10⁻⁶ M were determined. The values obtained were 11%, 17% and 13%, respectively. These values are very good, even more so considering that they were obtained from serum samples without pre-treatment. The lyophilized serum contains glucose, urea, uric acid and cholesterol at concentrations higher than 2 × 10⁻⁴ M. These components are likely responsible for the observed matrix effects. Since ascorbic acid and dopamine are not present in the lyophilized serum, we conducted separate interference studies for both compounds at concentrations of 1 × 10⁻⁴ M. At this concentration (threefold higher than physiological serum levels), ascorbic acid produces a decrease in the ECL signal of 18%. However, the interfering effect diminishes substantially when the ascorbic acid concentration is reduced to the normal physiological range (close to 8%). Dopamine showed interference at 1 × 10⁻⁴ M by the reaction with H2O2, and the ECL intensity increased by 20%. However, this is irrelevant at the physiological concentration of dopamine because it is at sub-pM levels.

3.8. Comparison of the Performance of the ECL Sensor with Other Sensors for the Detection of H2O2

The performance of the ECL sensor was compared with other relevant sensors used for the detection of H2O2, as shown in Table 3. The ECL sensor demonstrated advantages such as high sensitivity, a wide linear range, and very low detection limits to detect H2O2 in Tris-HCl buffer. Additionally, its ability to operate in complex matrices, such as serum, without significant interference highlights its potential for practical applications. The ECL sensor’s reproducibility and reliability further support its suitability for accurate H2O2 quantification in biological samples.

4. Conclusions

In this work, we have developed an electrochemiluminescent sensor based on a novel probe composed of CdSe quantum dots and g-C3N4 nanosheets. The QDs CdSe@g-C3N4 heterostructure exhibits remarkable reproducibility and excellent sensitivity for the detection of H2O2 by electrochemiluminescence, demonstrating compatibility with both aqueous systems and complex biological matrices (e.g., serum). This performance demonstrates its potential for biochemical studies and human health applications. The high performance of the electrochemiluminescent probe is based on the effective energy transfer process between the two nanostructures. Two aspects are important to highlight. First, the electrochemiluminescence methodology developed is remarkably simple, requiring only the addition of the probe to the sample solution for analysis; second, the sensor allowed the detection of H2O2 in untreated reconstituted lyophilized serum samples, where, despite the matrix effect, sub-µM levels of H2O2 were successfully quantified. In this way, the electrochemiluminescent sensor has proven to be a reliable and simple analytical tool for detecting H2O2 in complex samples without the need for pre-treatment.

Supplementary Materials

The following supporting information can be downloaded at https://www.mdpi.com/article/10.3390/chemosensors13050171/s1: S1. Reagents and materials; S2. Equipment for ECL measurement; S3. Overlapping spectral and time-resolved fluorescence lifetime; S4. Determination of Eg of g-C3N4, CdSe QDs and CdSe QDs@g-C3N4; S5. Statistics used in the limit of detection calculation. Captions: Figure S1. (a) Diagram of the coupling between the potentiostat and the fluorometer for ECL measurements. (b) Cell holder that adjustment the variation of the cell angle relative to the emission monochromator. Figure S2. Overlapping spectral between—) g-C3N4 and—) QDs CdSe. Figure S3. Fluorescence lifetime intensity decay for) g-C3N4 and) CdSe QDs, and) CdSe QDs@g-C3N4. Figure S4. Determination of the Eg using the Tauc/Davis-Mott model for:) g-C3N4,) CdSe QDs, and) CdSe QDs@g-C3N4. References [54,64,65,66,67] are cited in the supplementary materials.

Author Contributions

Investigation, R.A.C.P., A.D.T. and G.D.P.; methodology, R.A.C.P., G.V.P. and F.J.A.; formal analysis, R.A.C.P., A.D.T., G.D.P., G.V.P. and F.J.A.; writing—original draft preparation, R.A.C.P., G.V.P. and F.J.A.; resources, G.V.P. and F.J.A.; writing—review and editing, G.V.P. and F.J.A.; supervision, G.V.P. and F.J.A.; funding acquisition, G.V.P. and F.J.A. All authors have read and agreed to the published version of the manuscript.

Funding

This research was funded by Agencia Nacional de Promoción Científica y Tecnológica ANPCYT (FONCYT) 2018–2021, 1580/18, Res. no. 419/19; Ministerio de Ciencia y Tecnología de la Provincia de Córdoba (MINCyT), Res. no. 000109/18; and Secretaría de Ciencia y Téecnica (SECyT) (PPI, Res. no. 0577/24) from Universidad Nacional de Río Cuarto.

Institutional Review Board Statement

Not applicable.

Informed Consent Statement

All authors declare their agreement with the data published in this paper.

Data Availability Statement

The original contributions presented in this study are included in the article/Supplementary Materials. Further inquiries can be directed to the corresponding authors.

Acknowledgments

Roodney Carrillo Palomino thanks CONICET for a doctoral research fellowship.

Conflicts of Interest

The authors declare no conflicts of interest.

Abbreviations

The following abbreviations are used in this manuscript:
QDs CdSecadmium selenide quantum dots
g-C3N4graphitic carbon nitride
ECLelectrochemiluminescence
RETresonance energy transfer
LODlimit of detection
LOQlimit of quantification
Ea,panodic potential peak
Ec,pcathodic potential peak
Egbandgap
MPAmercaptopropionic acid
MES3-morpholinoethanesulfonic acid
TPrAtripropylamine

References

  1. Pravda, J. Hydrogen peroxide and disease: Towards a unified system of pathogenesis and therapeutics. Mol. Med. 2020, 26, 41. [Google Scholar] [CrossRef] [PubMed]
  2. Dong, H.; Zheng, L.; Wang, Z.; Xu, K.; Chen, W.; Liu, Z.; Chang, Z.; Zhou, Y.; Zhu, X.; Zhang, Y.; et al. Dual-mode ratiometric electrochemical and turn-on fluorescent probe for reliably detecting H2O2 in Parkinson’s disease serum. Sens. Actuators Rep. 2025, 9, 100305. [Google Scholar] [CrossRef]
  3. Wei, S.; Chang, S.; Li, H.; Fang, Z.; Zhu, L.; Xu, Y. Polymer photocatalysts for photocatalytic hydrogen peroxide production. Green Chem. 2024, 26, 6382–6403. [Google Scholar] [CrossRef]
  4. Karunakaran, C.; Madasamy, T.; Sethy, N.K. Chapter 3—Enzymatic Biosensors. Biosens. Bioelectron. 2015, 133–204. [Google Scholar] [CrossRef]
  5. He, Q.; Zang, S.; Zeng, Y.; Wang, B.; Song, X. A bifunctional fluorescent probe for dual-channel detection of H2O2 and HOCl in living cells. Spectrochim. Acta Part A Mol. Biomol. Spectrosc. 2025, 328, 125464. [Google Scholar] [CrossRef]
  6. Hong, C.; Wu, S.; Chen, S.; Lin, Z.; Chen, Q. Highly sensitive colorimetric method for the detection of organophosphorus pesticides based on H2O2 etching of silver-coated gold nanostars. Sens. Actuators B Chem. 2025, 425, 137004. [Google Scholar] [CrossRef]
  7. Ahmad, T.; Iqbal, A.; Halim, S.A.; Uddin, J.; Khan, A.; El Deeb, S.; Al-Harrasi, A. Recent Advances in Electrochemical Sensing of Hydrogen Peroxide (H2O2) Released from Cancer Cells. Nanomaterials 2022, 12, 1475. [Google Scholar] [CrossRef]
  8. Ghaedamini, H.; Kim, D.-S. A non-enzymatic hydrogen peroxide biosensor based on cerium metal-organic frameworks, hemin, and graphene oxide composite. Bioelectrochemistry 2025, 161, 108823. [Google Scholar] [CrossRef]
  9. Xie, Z.; Liu, X.; Wang, W.; Wang, X.; Liu, C.; Xie, Q.; Li, Z.; Zhang, Z. Enhanced photoelectrochemical and photocatalytic performance of TiO2 nanorod arrays/CdS quantum dots by coating TiO2 through atomic layer deposition. Nano Energy 2015, 11, 400–408. [Google Scholar] [CrossRef]
  10. Wang, P.; Cao, L.; Chen, Y.; Wu, Y.; Di, J. Photoelectrochemical Biosensor Based on Co3O4 Nanoenzyme Coupled with PbS Quantum Dots for Hydrogen Peroxide Detection. ACS Appl. Nano Mater. 2019, 2, 2204–2211. [Google Scholar] [CrossRef]
  11. Quyen, T.T.B.; My, N.N.T.; Tran, N.T.Q.; Khang, T.M.; Thanh, L.H.V.; Le Anh Tuan, B.; Pham, D.T.; Le Thanh Huynh, N. Rapidly synthesis of AuM (M = Pt, Pd) hexagonals/graphene quantum dots nanostructures and their application for non-enzyme hydrogen peroxide detection. J. Mater. Res. 2024, 39, 2947–2961. [Google Scholar] [CrossRef]
  12. Kaplan, S.; Suna Karatekin, R.; Avci, G.; Kahya Düdükcü, M. A highly efficient catalyst consisting of Ni and S double-doped reduced graphene modified with ZnO nanoparticles for hydrogen peroxide electroreduction. Mater. Sci. Eng. B 2024, 308, 117581. [Google Scholar] [CrossRef]
  13. Ahmed, S.R.; Cirone, J.; Chen, A. Fluorescent Fe3O4 Quantum Dots for H2O2 Detection. ACS Appl. Nano Mater. 2019, 2, 2076–2085. [Google Scholar] [CrossRef]
  14. Ruiyi, L.; Qingqing, X.; Zaijun, L.; Ruiling, Z.; Yongqiang, Y.; Xiaohao, L. Synthesis of histidine, serine and folic acid-functionalized and boron and iron-doped graphene quantum dot with excellent optical behavior and peroxidase-like activity for colorimetric and fluorescence detection of H2O2 in food. Spectrochim. Acta Part A Mol. Biomol. Spectrosc. 2025, 324, 124950. [Google Scholar] [CrossRef]
  15. Asif, S.; Das, D.; Basu, S.; Morgan, D.; Datta, A.; Sen, K. Generating luminescent Graphene quantum Dots from Tryptophan: Fluorosensors for hydrogen peroxide in cancer cells. Spectrochim. Acta Part A Mol. Biomol. Spectrosc. 2024, 323, 124887. [Google Scholar] [CrossRef]
  16. Li, S.; Wang, P.; Ma, Q. Recent progress and challenges in ECL biosensors for the identification of small extracellular vesicle and clinical diagnosis. TrAC Trends Anal. Chem. 2025, 189, 118253. [Google Scholar] [CrossRef]
  17. Atacan, K.; Özacar, M. Construction of a non-enzymatic electrochemical sensor based on CuO/g-C3N4 composite for selective detection of hydrogen peroxide. Mater. Chem. Phys. 2021, 266, 124527. [Google Scholar] [CrossRef]
  18. Majdoub, M.; Sengottuvelu, D.; Nouranian, S.; Al-Ostaz, A. Graphitic Carbon Nitride Quantum Dots (g-C3N4 QDs): From Chemistry to Applications. ChemSusChem 2024, 17, e202301462. [Google Scholar] [CrossRef]
  19. Low, S.S.; Chen, Z.; Li, Y.; Lu, Y.; Liu, Q. Design principle in biosensing: Critical analysis based on graphitic carbon nitride (g-C3N4) photoelectrochemical biosensor. TrAC Trends Anal. Chem. 2021, 145, 116454. [Google Scholar] [CrossRef]
  20. Roy, R.; Chacko, A.R.; Abraham, T.; Korah, B.K.; John, B.K.; Punnoose, M.S.; Mohan, C.; Mathew, B. Recent Advances in Graphitic Carbon Nitrides (g-C3N4) as Photoluminescence Sensing Probe: A Review. ChemistrySelect 2022, 7, e202200876. [Google Scholar] [CrossRef]
  21. Chen, L.; Zhu, M.; Zheng, X.; Zhong, Y.; Zhu, X. Strategies to improve the electrochemiluminescence performance of graphitic carbon nitride nanomaterials. J. Electroanal. Chem. 2023, 947, 117784. [Google Scholar] [CrossRef]
  22. Liu, J.-W.; Luo, Y.; Wang, Y.-M.; Duan, L.-Y.; Jiang, J.-H.; Yu, R.-Q. Graphitic Carbon Nitride Nanosheets-Based Ratiometric Fluorescent Probe for Highly Sensitive Detection of H2O2 and Glucose. ACS Appl. Mater. Interfaces 2016, 8, 33439–33445. [Google Scholar] [CrossRef] [PubMed]
  23. Ju, P.; He, Y.; Wang, M.; Han, X.; Jiang, F.; Sun, C.; Wu, C. Enhanced Peroxidase-Like Activity of MoS2 Quantum Dots Functionalized g-C3N4 Nanosheets towards Colorimetric Detection of H2O2. Nanomaterials 2018, 8, 976. [Google Scholar] [CrossRef]
  24. Liu, D.; Zhang, X.; Zhao, J.; Chen, S.; Yuan, R. An ultrasensitive sensing platform for microRNA-155 based on H2O2 quenched hydroxide-dependent ECL emission of PFO Pdots. Biosens. Bioelectron. 2020, 150, 111872. [Google Scholar] [CrossRef]
  25. Ramesh, A.; Ajith, A.; Gudipati, N.S.; Vanjari, S.R.; John, S.A.; Biju, V.; Subrahmanyam, C. Hybridization of Co3S4 and Graphitic Carbon Nitride Nanosheets for High-performance Nonenzymatic Sensing of H2O2. Biosensors 2023, 13, 108. [Google Scholar] [CrossRef]
  26. Chen, Y.; Bai, X. A Review on Quantum Dots Modified g-C3N4-Based Photocatalysts with Improved Photocatalytic Activity. Catalysts 2020, 10, 142. [Google Scholar] [CrossRef]
  27. Xian, J.; Weng, Y.; Guo, H.; Li, Y.; Yao, B.; Weng, W. One-pot fabrication of Fe-doped carbon nitride nanoparticles as peroxidase mimetics for H2O2 and glucose detection. Spectrochim. Acta Part A Mol. Biomol. Spectrosc. 2019, 215, 218–224. [Google Scholar] [CrossRef]
  28. Kang, Y.; Yang, Y.; Yin, L.C.; Kang, X.; Wang, L.; Liu, G.; Cheng, H.M. Selective Breaking of Hydrogen Bonds of Layered Carbon Nitride for Visible Light Photocatalysis. Adv. Mater. (Deerfield Beach Fla.) 2016, 28, 6471–6477. [Google Scholar] [CrossRef]
  29. Li, J.; Zhang, B.; Lu, J.; Guo, Z.; Zhang, M.; Li, D.; Zhao, Z.; Song, S.; Liu, Y.; Qin, L. A CQD/CdS/g-C3N4 photocatalyst for dye and antibiotic degradation: Dual carrier driving force and tunable electron transfer pathway. Sep. Purif. Technol. 2023, 305, 122333. [Google Scholar] [CrossRef]
  30. Salazar-Marín, D.; Oza, G.; Real, J.A.D.; Cervantes-Uribe, A.; Pérez-Vidal, H.; Kesarla, M.K.; Torres, J.G.T.; Godavarthi, S. Distinguishing between type II and S-scheme heterojunction materials: A comprehensive review. Appl. Surf. Sci. Adv. 2024, 19, 100536. [Google Scholar] [CrossRef]
  31. Wang, Y.; Zhang, Y.; Sha, H.; Xiong, X.; Jia, N. Design and Biosensing of a Ratiometric Electrochemiluminescence Resonance Energy Transfer Aptasensor between a g-C3N4 Nanosheet and Ru@MOF for Amyloid-β Protein. ACS Appl. Mater. Interfaces 2019, 11, 36299–36306. [Google Scholar] [CrossRef] [PubMed]
  32. Xiang, S.; Li, J.; Wang, F.; Yang, H.; Jiang, Y.; Zhang, P.; Cai, R.; Tan, W. Novel Ultralow-Potential Electrochemiluminescence Aptasensor for the Highly Sensitive Detection of Zearalenone Using a Resonance Energy Transfer System. Anal. Chem. 2023, 95, 15125–15132. [Google Scholar] [CrossRef] [PubMed]
  33. Gao, H.; Zhang, Z.; Zhang, Y.; Yu, H.; Rong, S.; Meng, L.; Song, S.; Mei, Y.; Pan, H.; Chang, D. Electrochemiluminescence immunosensor for cancer antigen 125 detection based on novel resonance energy transfer between graphitic carbon nitride and NIR CdTe/CdS QDs. J. Electroanal. Chem. 2021, 886, 115104. [Google Scholar] [CrossRef]
  34. Hu, L.; Shi, T.; Chen, J.; Cui, Q.; Yu, H.; Wu, D.; Ma, H.; Wei, Q.; Ju, H. Dual-quenching electrochemiluminescence resonance energy transfer system from CoPd nanoparticles enhanced porous g-C3N4 to FeMOFs-sCuO for neuron-specific enolase immunosensing. Biosens. Bioelectron. 2023, 226, 115132. [Google Scholar] [CrossRef]
  35. Shi, T.; Hu, L.; Chen, J.; Cui, Q.; Yu, H.; Li, Y.; Wu, D.; Ma, H.; Wei, Q.; Ju, H. Dual-quenching electrochemiluminescence system based on resonance energy transfer from gold dendrite@polypyrrole core–shell nanoparticles enhanced g-C3N4 to ZnONFs@PDA-sCuO for procalcitonin immunosensing. Sens. Actuators B Chem. 2022, 371, 132591. [Google Scholar] [CrossRef]
  36. Feng, Q.-M.; Shen, Y.-Z.; Li, M.-X.; Zhang, Z.-L.; Zhao, W.; Xu, J.-J.; Chen, H.-Y. Dual-Wavelength Electrochemiluminescence Ratiometry Based on Resonance Energy Transfer between Au Nanoparticles Functionalized g-C3N4 Nanosheet and Ru(bpy)32+ for microRNA Detection. Anal. Chem. 2016, 88, 937–944. [Google Scholar] [CrossRef]
  37. Surana, K.; Singh, P.K.; Rhee, H.-W.; Bhattacharya, B. Synthesis, characterization and application of CdSe quantum dots. J. Ind. Eng. Chem. 2014, 20, 4188–4193. [Google Scholar] [CrossRef]
  38. Cheng, J.-l.; Liu, X.-P.; Chen, J.-S.; Mao, C.-j.; Jin, B.-K. Highly sensitive electrochemiluminescence biosensor for VEGF165 detection based on a g-C3N4/PDDA/CdSe nanocomposite. Anal. Bioanal. Chem. 2020, 412, 3073–3081. [Google Scholar] [CrossRef]
  39. Palomino, R.A.C.; Zon, M.A.; Fernández, H.; Porcal, G.V.; Arévalo, F.J. Influence of a dual-stabiliser formed by 3-morpholinoethanesulfonic and 3-mercaptopropionic acids on the photophysical, electrochemical and electrochemiluminescent properties of aqueous soluble CdSe quantum dots. J. Electroanal. Chem. 2024, 958, 118156. [Google Scholar] [CrossRef]
  40. Dong, F.; Wu, L.; Sun, Y.; Fu, M.; Wu, Z.; Lee, S.C. Efficient synthesis of polymeric g-C3N4 layered materials as novel efficient visible light driven photocatalysts. J. Mater. Chem. 2011, 21, 15171–15174. [Google Scholar] [CrossRef]
  41. Guru, S.; Rao, G.R. Review—Strategic Design of Layered Double Hydroxides and Graphitic Carbon Nitride Heterostructures for Photoelectrocatalytic Water Splitting Applications. J. Electrochem. Soc. 2022, 169, 046515. [Google Scholar] [CrossRef]
  42. Tong, J.; Zhang, L.; Li, F.; Wang, K.; Han, L.; Cao, S. Rapid and high-yield production of g-C3N4 nanosheets via chemical exfoliation for photocatalytic H2 evolution. RSC Adv. 2015, 5, 88149–88153. [Google Scholar] [CrossRef]
  43. She, X.; Xu, H.; Xu, Y.; Yan, J.; Xia, J.; Xu, L.; Song, Y.; Jiang, Y.; Zhang, Q.; Li, H. Exfoliated graphene-like carbon nitride in organic solvents: Enhanced photocatalytic activity and highly selective and sensitive sensor for the detection of trace amounts of Cu2+. J. Mater. Chem. A 2014, 2, 2563–2570. [Google Scholar] [CrossRef]
  44. Huo, Y.; Zhang, J.; Dai, K.; Liang, C. Amine-Modified S-Scheme Porous g-C3N4/CdSe–Diethylenetriamine Composite with Enhanced Photocatalytic CO2 Reduction Activity. ACS Appl. Energy Mater. 2021, 4, 956–968. [Google Scholar] [CrossRef]
  45. Sharma, A.; Varshney, M.; Chae, K.H.; Won, S.O. Mechanistic investigations on emission characteristics from g-C3N4, g-C3N4@Pt and g-C3N4@Ag nanostructures using X-ray absorption spectroscopy. Curr. Appl. Phys. 2018, 18, 1458–1464. [Google Scholar] [CrossRef]
  46. Jones, G.A.; Bradshaw, D.S. Resonance Energy Transfer: From Fundamental Theory to Recent Applications. Front. Phys. 2019, 7, 100. [Google Scholar] [CrossRef]
  47. Tauc, J. Optical properties and electronic structure of amorphous Ge and Si. Mater. Res. Bull. 1968, 3, 37–46. [Google Scholar] [CrossRef]
  48. Gupta, N.; Todi, K.; Narayan, T.; Malhotra, B.D. Graphitic carbon nitride-based nanoplatforms for biosensors: Design strategies and applications. Mater. Today Chem. 2022, 24, 100770. [Google Scholar] [CrossRef]
  49. Li, C.; Zou, X.; Lin, W.; Mourad, H.; Meng, J.; Liu, Y.; Abdellah, M.; Guo, M.; Zheng, K.; Nordlander, E. Graphitic Carbon Nitride/CdSe Quantum Dot/Iron Carbonyl Cluster Composite for Enhanced Photocatalytic Hydrogen Evolution. ACS Appl. Nano Mater. 2021, 4, 6280–6289. [Google Scholar] [CrossRef]
  50. Zhang, L.; Zou, X.; Ying, E.; Dong, S. Quantum Dot Electrochemiluminescence in Aqueous Solution at Lower Potential and Its Sensing Application. J. Phys. Chem. C 2008, 112, 4451–4454. [Google Scholar] [CrossRef]
  51. Daviddi, E.; Oleinick, A.; Svir, I.; Valenti, G.; Paolucci, F.; Amatore, C. Theory and Simulation for Optimising Electrogenerated Chemiluminescence from Tris(2,2′-bipyridine)-ruthenium(II)-Doped Silica Nanoparticles and Tripropylamine. ChemElectroChem 2017, 4, 1719–1730. [Google Scholar] [CrossRef]
  52. Miao, W.; Choi, J.P.; Bard, A.J. Electrogenerated chemiluminescence 69: The tris(2,2′-bipyridine)ruthenium(II), (Ru(bpy)3)2+/tri-n-propylamine (TPrA) system revisited-a new route involving TPrA*+ cation radicals. J. Am. Chem. Soc. 2002, 124, 14478–14485. [Google Scholar] [CrossRef] [PubMed]
  53. Dai, C.; Gan, Y.; Qin, J.; Ma, L.; Liu, Q.; Huang, L.; Yang, Z.; Zang, G.; Zhu, S. An ultrasensitive solid-state ECL biosensor based on synergistic effect between Zn-NGQDs and porphyrin-based MOF as “on-off-on” platform. Colloids Surf. B Biointerfaces 2023, 226, 113322. [Google Scholar] [CrossRef]
  54. Olivieri, A.C. Practical guidelines for reporting results in single- and multi-component analytical calibration: A tutorial. Anal. Chim. Acta 2015, 868, 10–22. [Google Scholar] [CrossRef]
  55. Liu, Y.; Sun, G.; Jiang, C.; Zheng, X.T.; Zheng, L.; Li, C.M. Highly sensitive detection of hydrogen peroxide at a carbon nanotube fiber microelectrode coated with palladium nanoparticles. Microchim. Acta 2014, 181, 63–70. [Google Scholar] [CrossRef]
  56. Wang, J.; Sun, H.-b.; Pan, H.-y.; Ding, Y.-y.; Wan, J.-g.; Wang, G.-h.; Han, M. Detection of hydrogen peroxide at a palladium nanoparticle-bilayer graphene hybrid-modified electrode. Sens. Actuators B Chem. 2016, 230, 690–696. [Google Scholar] [CrossRef]
  57. Zhou, T.; Yao, Q.; Zhao, T.; Chen, X. One-pot synthesis of fluorescent DHLA-stabilized Cu nanoclusters for the determination of H2O2. Talanta 2015, 141, 80–85. [Google Scholar] [CrossRef]
  58. Chang, H.-C.; Ho, J.-a.A. Gold Nanocluster-Assisted Fluorescent Detection for Hydrogen Peroxide and Cholesterol Based on the Inner Filter Effect of Gold Nanoparticles. Anal. Chem. 2015, 87, 10362–10367. [Google Scholar] [CrossRef]
  59. Hu, X.; Liu, X.; Zhang, X.; Chai, H.; Huang, Y. One-pot synthesis of the CuNCs/ZIF-8 nanocomposites for sensitively detecting H2O2 and screening of oxidase activity. Biosens. Bioelectron. 2018, 105, 65–70. [Google Scholar] [CrossRef]
  60. Chen, H.; Fang, A.; He, L.; Zhang, Y.; Yao, S. Sensitive fluorescent detection of H2O2 and glucose in human serum based on inner filter effect of squaric acid-iron(III) on the fluorescence of upconversion nanoparticle. Talanta 2017, 164, 580–587. [Google Scholar] [CrossRef]
  61. Wang, Y.; Yang, M.; Ren, Y.; Fan, J. Ratiometric determination of hydrogen peroxide based on the size-dependent green and red fluorescence of CdTe quantum dots capped with 3-mercaptopropionic acid. Microchim. Acta 2019, 186, 277. [Google Scholar] [CrossRef] [PubMed]
  62. Zhou, Z.; Yang, L.; Huang, L.; Liao, Y.; Liu, Y.; Xiao, Q. A novel fluorescent probe for H2O2 detection based on CdSe@ZnS quantum dots/Ag nanocluster hybrid. Anal. Chim. Acta 2020, 1106, 176–182. [Google Scholar] [CrossRef] [PubMed]
  63. Zhang, D.; Zhao, H.; Fan, Z.; Li, M.; Du, P.; Liu, C.; Li, Y.; Li, H.; Cao, H. A Highly Sensitive and Selective Hydrogen Peroxide Biosensor Based on Gold Nanoparticles and Three-Dimensional Porous Carbonized Chicken Eggshell Membrane. PLoS ONE 2015, 10, e0130156. [Google Scholar] [CrossRef] [PubMed]
  64. Tian, N.; Zhang, Y.; Li, X.; Xiao, K.; Du, X.; Dong, F.; Huang, H. Precursor-reforming protocol to 3D mesoporous g-C3N4 established by ultrathin self-doped nanosheets for superior hydrogen evolution. Nano Energy 2017, 38, 72–81. [Google Scholar] [CrossRef]
  65. Zhang, J.; Wang, Y.; Jin, J.; Zhang, J.; Lin, Z.; Huang, F.; Yu, J. Efficient visible-light photocatalytic hydrogen evolution and enhanced photostability of core/shell CdS/g-C3N4 nanowires. ACS Appl. Mater. Interfaces 2013, 5, 10317–10324. [Google Scholar] [CrossRef]
  66. Currie, L.A. Nomenclature in evaluation of analytical methods including detection and quantification capabilities (IUPAC Recommendations 1995). Pure Appl. Chem. 1995, 67, 1699–1723. [Google Scholar] [CrossRef]
  67. Danzer, K.; Currie, L.A. Guidelines for calibration in analytical chemistry. Part I. Fundamentals and single component calibration (IUPAC Recommendations 1998). Pure Appl. Chem. 1998, 70, 993–1014. [Google Scholar] [CrossRef]
Scheme 1. Steps for the synthesis of the heterostructure of QDs CdSe@g-C3N4.
Chemosensors 13 00171 sch001
Figure 1. FTIR spectra of () exfoliated g-C3N4, () QDs CdSe, and (—) QDs CdSe@g-C3N4.
Chemosensors 13 00171 g001
Figure 2. TEM images of (A) bulk g-C3N4, with (B) and (C) showing QDs CdSe@g-C3N4. The red scale bars in (A) and (C) represent 50.0 nm, while the scale bar in (B) corresponds to 100.0 nm.
Chemosensors 13 00171 g002
Figure 3. Absorption (a) and fluorescence (b) spectra of () g-C3N4, (—) QDs CdSe, and () QDs CdSe@g-C3N4. λexc= 320 nm. Fluorescence spectra were corrected at the same absorbance values at λexc.
Chemosensors 13 00171 g003
Figure 4. (a) Anodic and (b) cathodic cyclic voltammograms of () g-C3N4, (—) QDs CdSe, and () QDs CdSe@g-C3N4 performed in acetonitrile + 0.1 M of tetrabutylammonium hexafluorophosphate. v = 50 mV s−1.
Chemosensors 13 00171 g004
Figure 5. Normalized ECL spectra of () g-C3N4, (—) QDs CdSe, and () QD CdSe@g-C3N4. Eapplied = 1.1 V vs. HNE.
Chemosensors 13 00171 g005
Figure 6. Energy level diagram of QDs CdSe@g-C3N4. Description of the electron transfer mechanism in the presence of TPrA.
Chemosensors 13 00171 g006
Figure 7. ECL voltammograms of solution of 60 µL of QDs CdSe@g-C3N4 in the absence of H2O2 (—), and for H2O2 concentrations of () 4 µM and () 56 µM. v = 50 mV s−1.
Chemosensors 13 00171 g007
Figure 8. Fluorescence spectra of QDs CdSe@g-C3N4 as a function of g-C3N4 concentrations of () 0.025, () 0.05, () 0.1 and () 0.2 mg mL−1. λexc = 320 nm.
Chemosensors 13 00171 g008
Figure 9. (a) ECL responses of QDs CdSe@g-C3N4 in Tris-HCl solution + 25 mM TPrA for concentration ranges of H2O2 of () 8.71 × 10⁻¹⁰ M, () 8.71 × 10⁻⁹ M, () 8.71 × 10⁻⁸ M, () 8.71 × 10⁻⁷ M, and () 8.71 × 10⁻⁶ M. (b) Calibration curve for H2O2 quantification performed in 0.1 M Tris-HCl solution, pH = 7.4. Each point is the average of ten replicated measurements. The experimental points were fitted using a linear equation, where R2 = 0.9986 was determined.
Chemosensors 13 00171 g009
Figure 10. (a) Effect of serum volume on ECL energy intensity values in the absence of H2O2. Serum volumes were added to 2500 µL of 0.1 M Tris-HCl solution, pH = 7.4. (b) Calibration curve for H2O2 quantification performed by adding 5 µL of serum sample to 2500 µL of 0.1 M Tris-HCl solution, pH = 7.4. Each point is the average of ten replicated measurements. The experimental points were fitted using a linear equation. R2 = 0.9927. Inset: ECL response at concentrations of H2O2 in serum samples of (—) 5.20 × 10⁻⁷ M, () 1.30 × 10⁻⁶ M, () 2.60 × 10⁻⁶ M, () 5.20 × 10⁻⁵ M, () 5.20 × 10⁻⁴ M, () 5.20 × 10⁻³ M, and () 5.20 × 10⁻² M.
Chemosensors 13 00171 g010
Table 1. Kinetic parameters of emission decay for g-C3N4, QDs CdSe, and QDs CdSe@g-C3N4.
SampleLifetime/ns% PopulationLifetime/ns% Population
τ1β1τ2β2
g-C3N40.4112.622.8487.38
QD CdSe1.6110.7213.4089.27
QD CdSe@g-C3N41.398.9814.0791.02
Table 2. Eg determined by UV–visible spectra and ΔEp determined by cyclic voltammetry for g-C3N4, QDs CdSe, and QDs CdSe@g-C3N4.
SampleaEg/eVEa,p/V vs. HNEEc,p/V vs. HNEΔEp/V
g-C3N42.550.966−1.5042.47
QD CdSe2.230.594−1.7242.32
QD CdSe@g-C3N42.280.630−1.7042.34
aEg determined by UV–visible spectroscopy.
Table 3. Different methods proposed in the literature to quantify H2O2.
Materials/ProbeTechniqueSampleLinear Range
/μM
LOD
/μM
Ref.
PdNP/CNT fibreAmperometryPBS, pH 7.42–13002[55]
Pd-NPs/BGFs/GCEAmperometryPBS, pH 7.44–13,5001.5[56]
DHLA-CuNCsFluorescence
sensing methods
Aqueous solution1–100.3[57]
AuNPs-AuNCsPBS, pH 81–1000.8[58]
CuNCs/ZIF-8Acetate buffer, pH 70.5–300.5[59]
Upconversion nanoparticlesPBS, pH 6.52.5–700.8[60]
QDs CdTePBS, pH 710–1250.3[61]
CdSe@ZnS/AgNCsTris-HCl buffer0.5–600.3[62]
CuO/g-C3N4/GCEDPVPBS, pH 70.5–500.31[17]
HRP/AuNPs/CESMAmperometricPBS, pH 710–27003[63]
QDs CdSe@g-C3N4ECLTris-HCl, pH 7.41 × 10⁻⁴–11.81 × 10⁻³This sensor
DPV: differential pulse voltammetry.
Disclaimer/Publisher’s Note: The statements, opinions and data contained in all publications are solely those of the individual author(s) and contributor(s) and not of MDPI and/or the editor(s). MDPI and/or the editor(s) disclaim responsibility for any injury to people or property resulting from any ideas, methods, instructions or products referred to in the content.

