Chlorpyrifos Detection Based on 9-Fluorenone Oxime


Abstract
1. Introduction

| Substrate | Reaction Time (min) | LOD (µg/L) | Linear Range (μg/L) | Reference |
|---|---|---|---|---|
| Eu (III)-TAN-1,10 phenanthroline naphthyl)-1,3-butanedione) | / | 164 | 578–7713 | [15] |
| Immunoassay-Rhodamine AuNPs | 10 | 61 | 121–1250 | [17] |
| Monoclonal antibody | 10 | 15 | 15–64,000 | [18] |
| CdS NPs–Eosin Y dye | 20 | 10 | 10–100 | [19] |
| QD–MIP flow cytometry | 90 | 10 | 20–200 | [20] |
| Tb3+ MOF–PDDA AuNPs | 6 | 1.33 | 1.75–210 | [21] |
| Polymer membrane with acryloyl-β-cyclodextrin | 0.33 | 0.15 | 0.5–2.5 | [27] |
| TEF-CDs | 5 | 2.1 | 17–35,000 | [28] |
| Nitrogen dots | 5 | 2 | 10–500 | [29] |
| Mn (II)-doped ZnS QD coated with MIP | 10 | 6 | 105–21,000 | [30] |
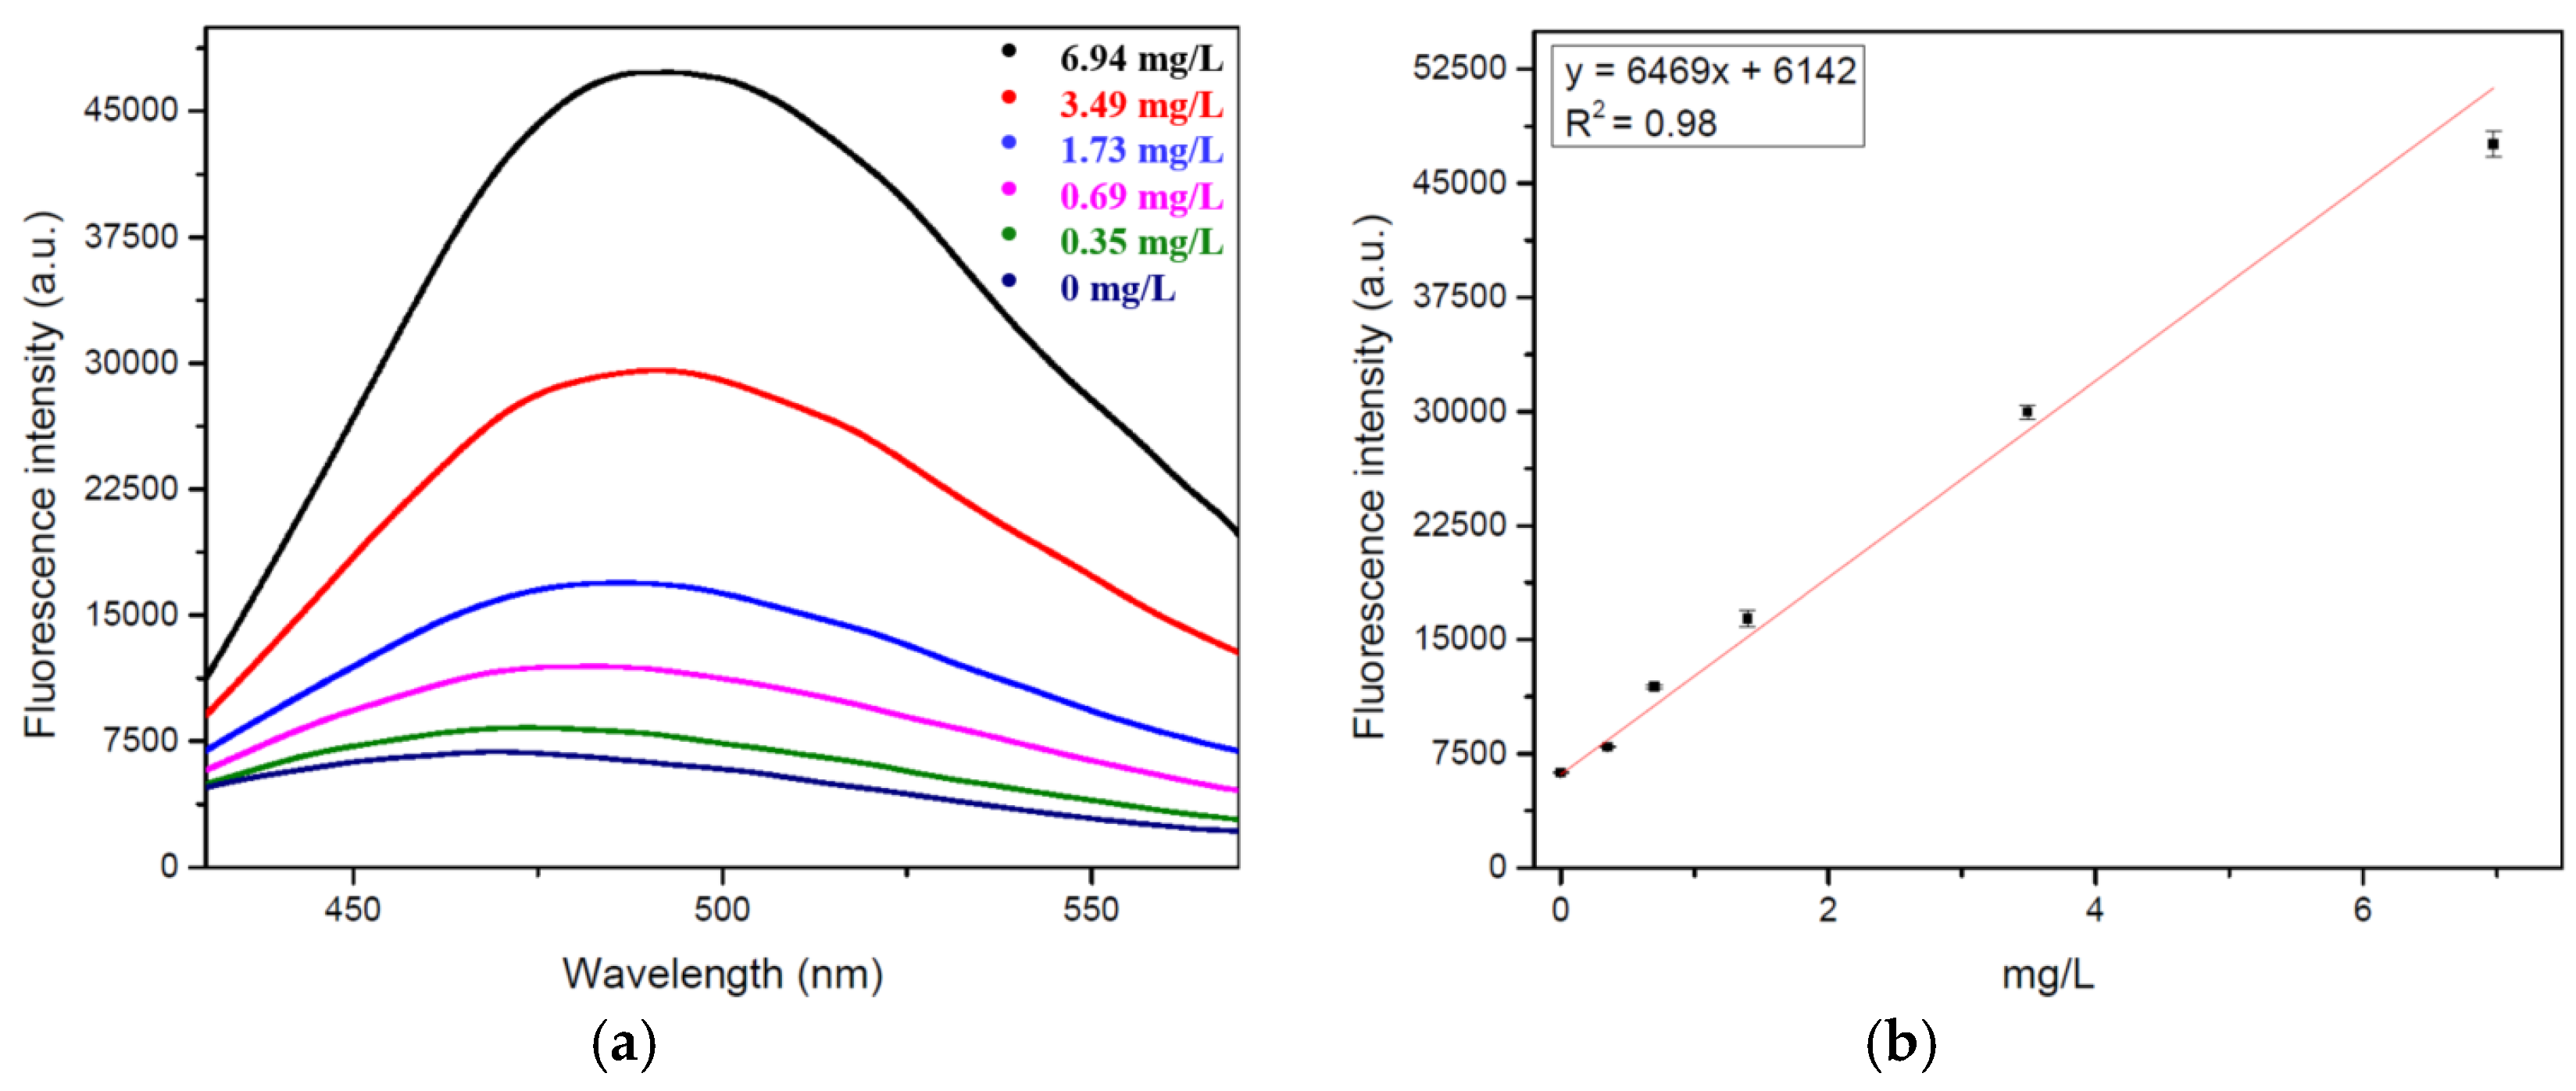
| Fluorenone oxime dye | 20 | 15.5 | 350–6970 | This work |
2. Results
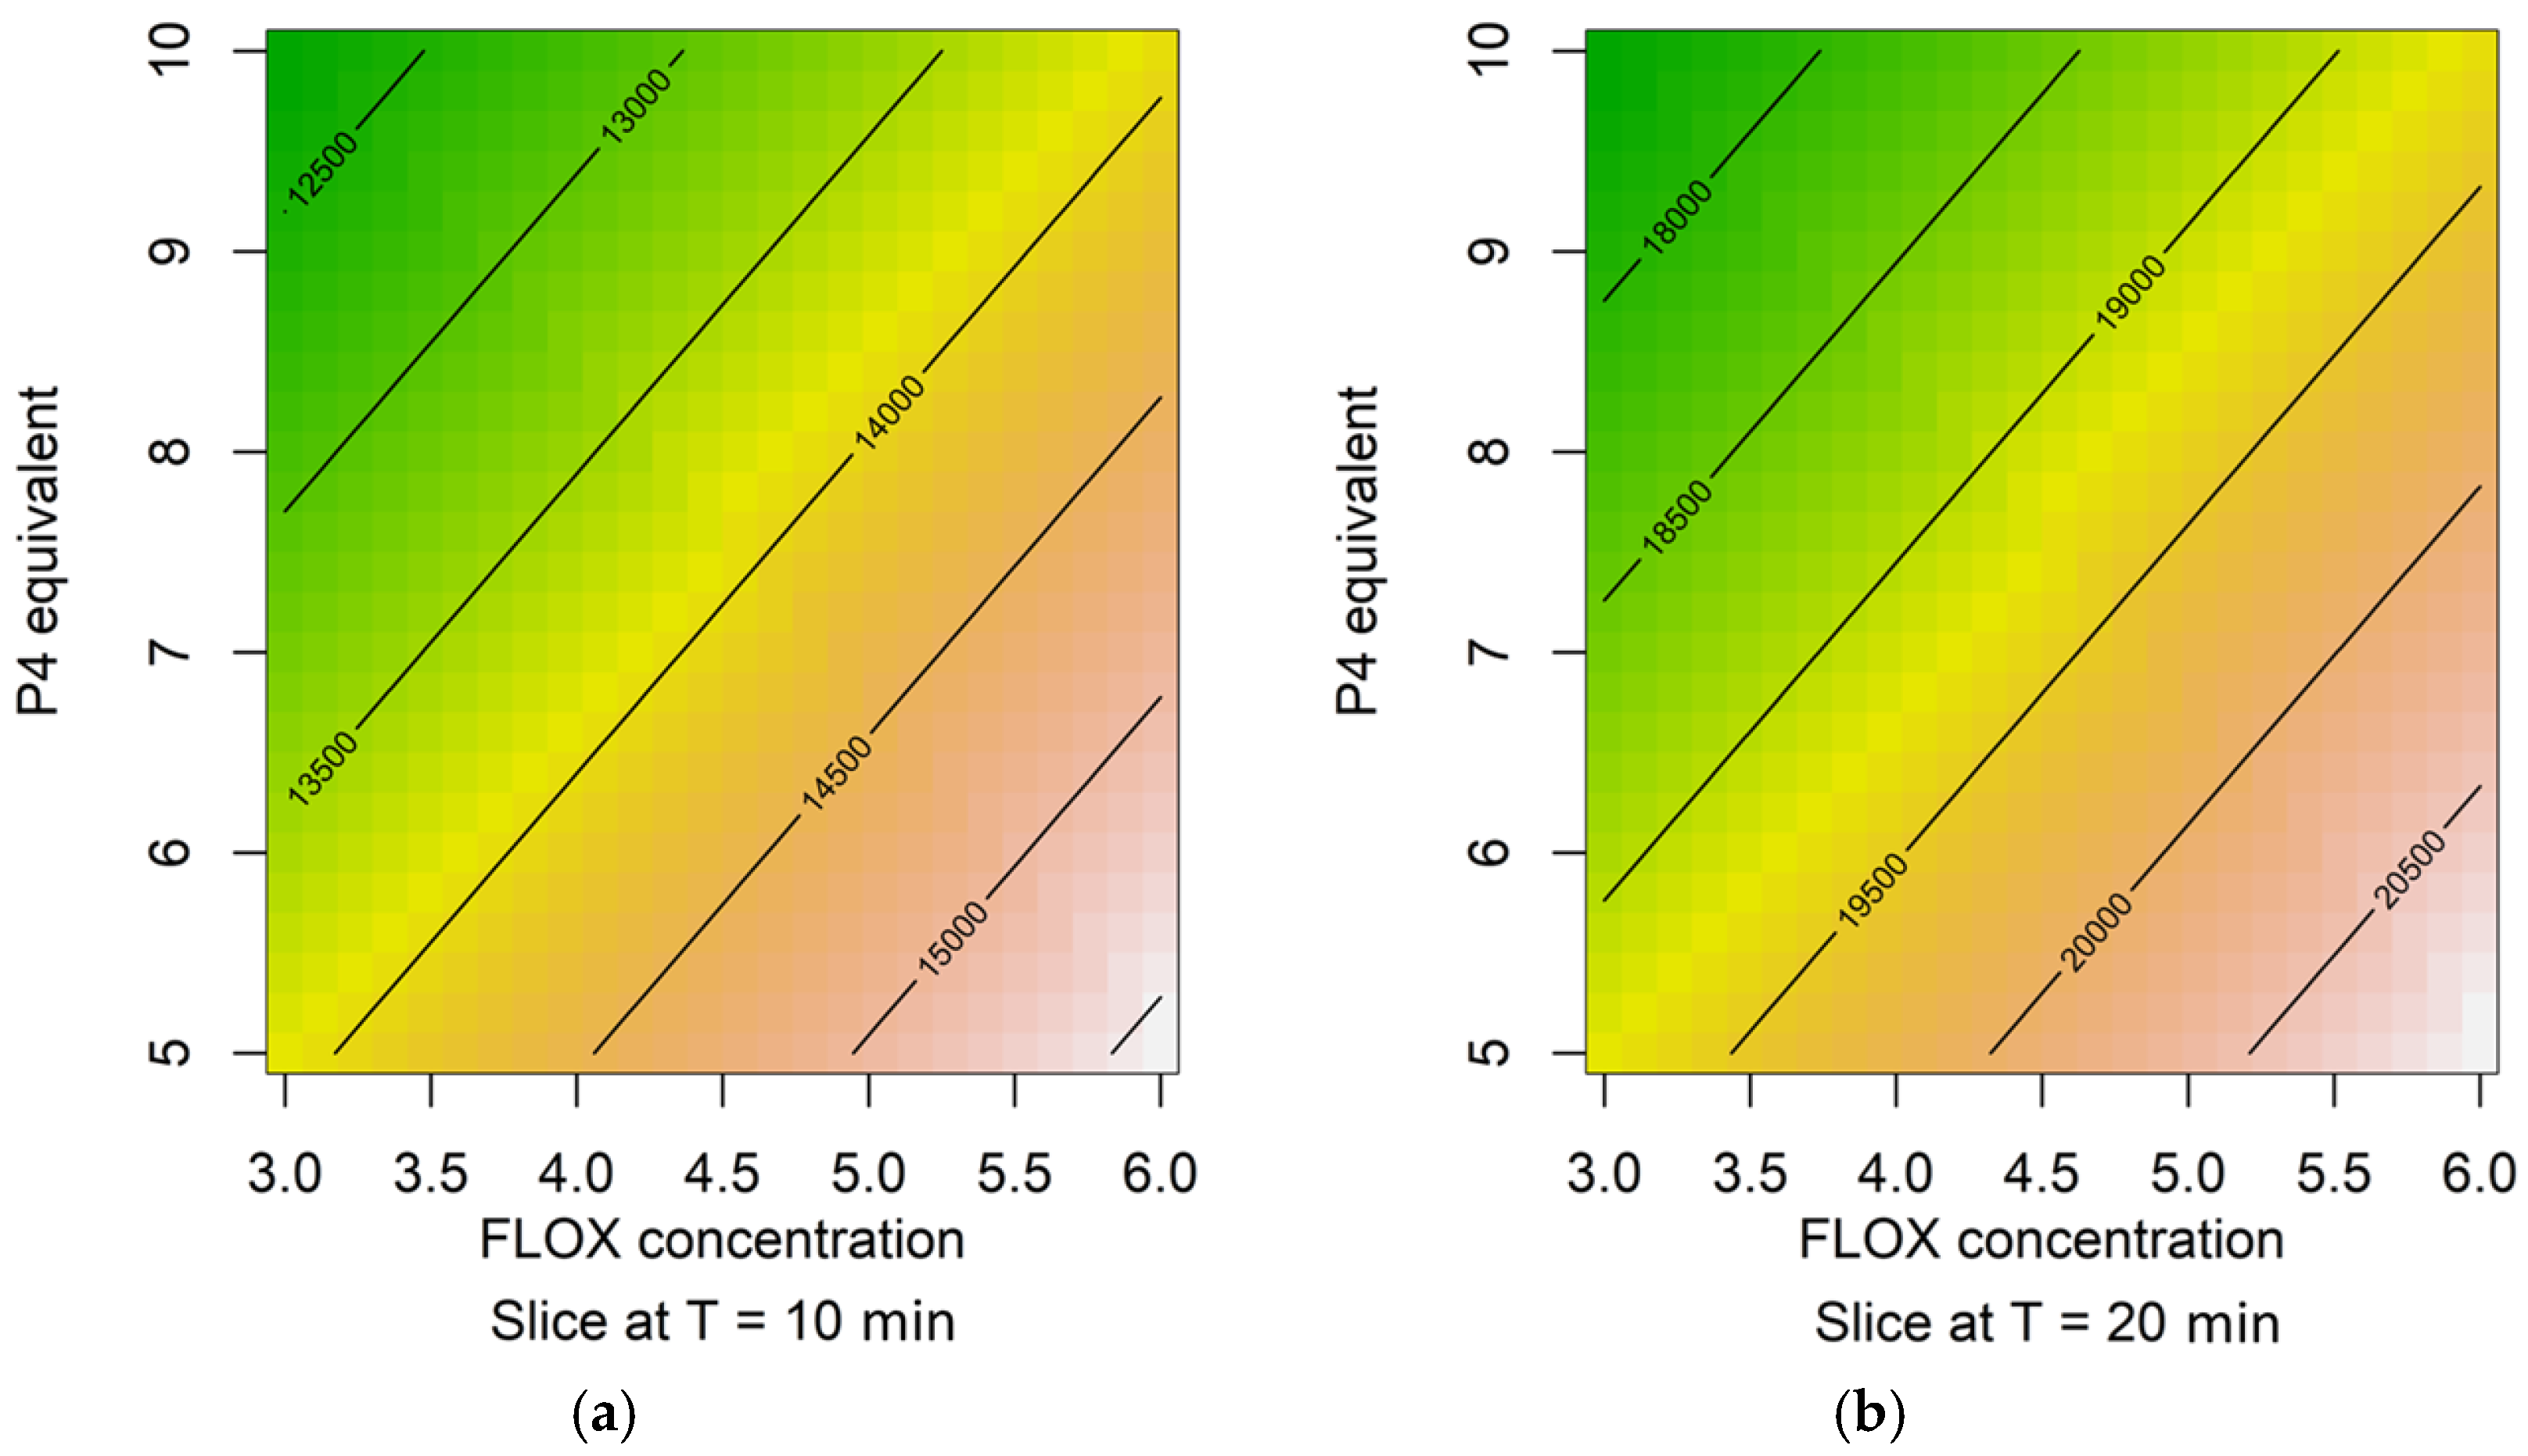
2.1. Response Surfaces
2.2. Calibration Curve
2.3. Water Test
3. Discussion
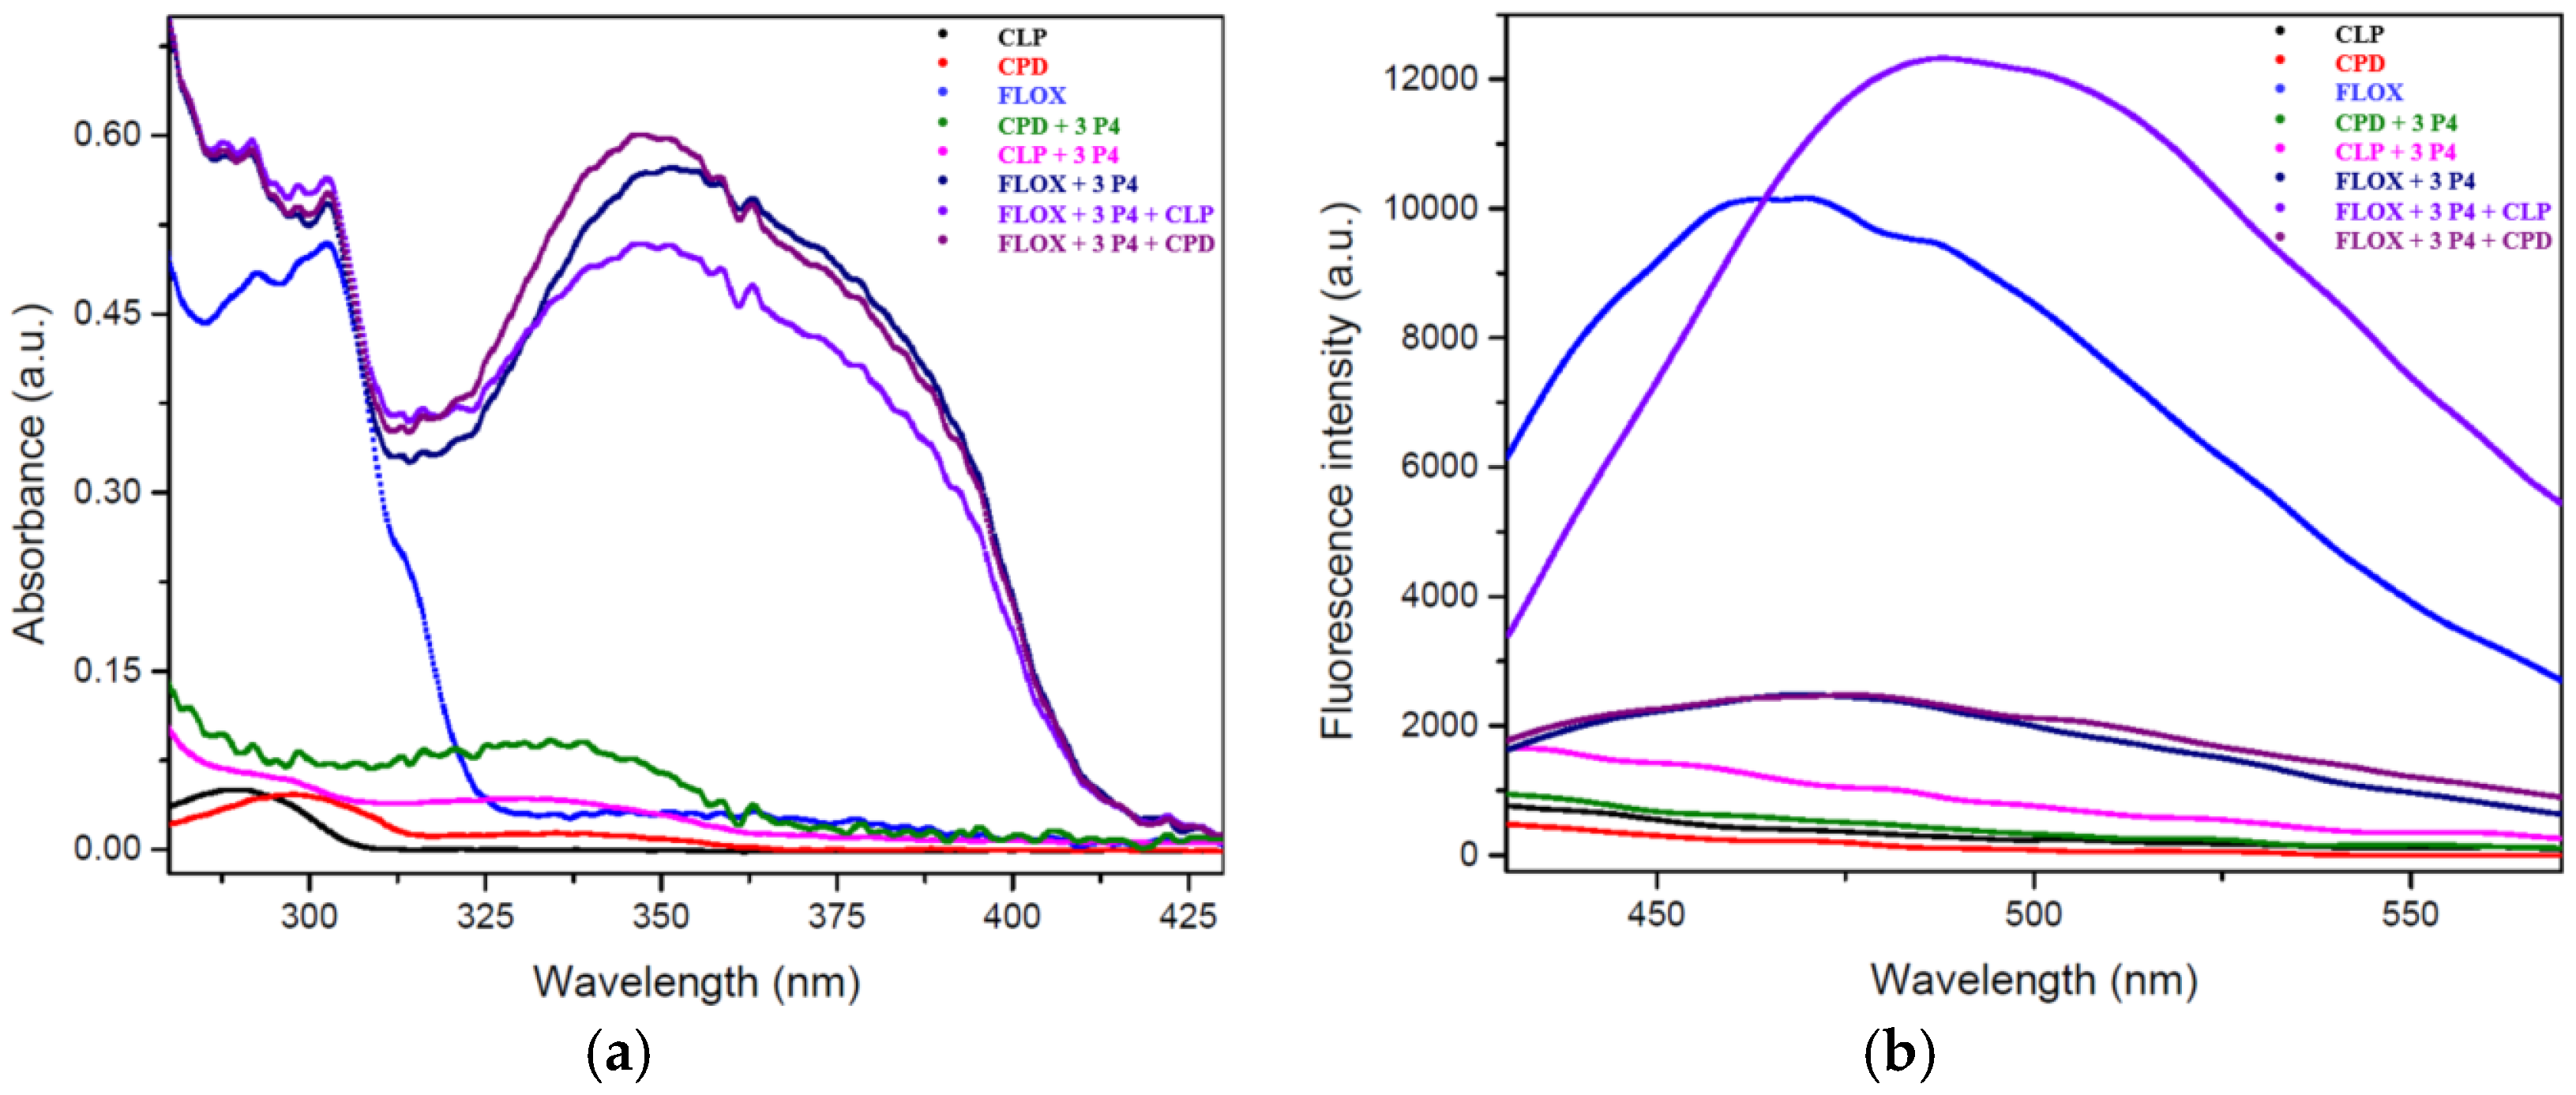
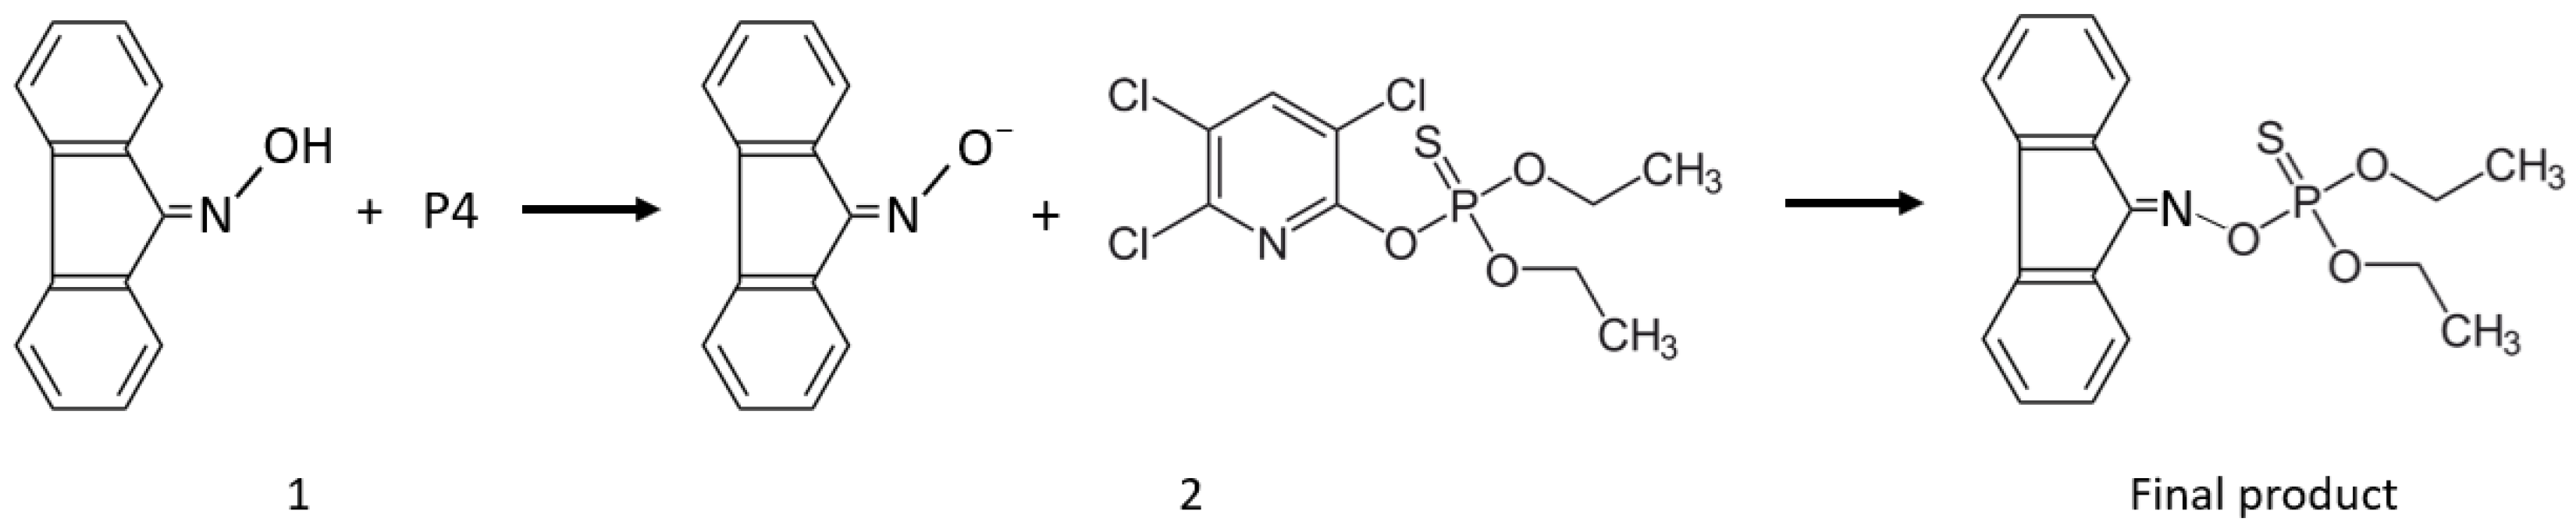
3.1. Sensing Mechanism
- 1H-NMR analysis confirmed the deprotonation of FLOX, a crucial step for its nucleophilic attack on CLP;
- 31P-NMR revealed the disappearance of the CLP peak and the emergence of new phosphorus environments, supporting the occurrence of a reaction;
- The appearance of singlets at higher ppm values in 31P-NMR suggests the formation of a P-O-N bond, consistent with the expected deshielding effect compared to the P-O-C bonds in CLP;
- Additional confirmation was provided by UV-Vis and fluorescence spectroscopy, further supporting the interaction between FLOX and the organophosphate;
- The known reactivity of deprotonated oximes with organophosphates further substantiates the proposed reaction mechanism.
3.2. Kinetic and Interferences
4. Materials and Methods
4.1. Reagents
4.2. Sensing Measurements
- Preparation of FLOX solution at 60 μM in CH3CN;
- Addition of P4 to a final concentration of 180 μM;
- Addition of CLP;
- Measurement of the fluorescence after 20 min at λexc = 329 nm (λem = 490 nm).
4.3. NMR Spectra
4.4. Water Extraction Procedure
- 35 g of tap water is measured into a 50 mL PTFE tube, and a concentrated solution of CLP is added to achieve the concentration specified in the calibration curve. This procedure is repeated for each concentration reported, with no CLP added to the blank.
- 8.75 mL of CH3CN containing 1% v/v of acetic acid is added.
- 3.5 g of NaCl and 14 g of MgSO4, are added, and the mixture is shaken for 1 min.
- The mixture is centrifuged for 5 min at 4500 rpm.
- 6.5 mL of the supernatant is extracted and transferred to another 50 mL PTFE tube.
- 2.2 g of anhydrous MgSO4 is added, and the mixture is shaken for 1 min.
- The mixture is centrifuged for 2 min at 4500 rpm.
- 4 mL of the solution is extracted and used as a solvent for the calibration curve.
4.5. Statistical Analysis
4.5.1. Design of Experiments Methodology
- Time (T): 10 and 20 min;
- P4 concentration: 5 or 10 times the dye’s concentration;
- FLOX concentration 30 or 60 µM;
- Imaginary parameter (W): levels 0 and 1.
4.5.2. Calibration Curve Calculation
5. Conclusions
Supplementary Materials
Author Contributions
Funding
Institutional Review Board Statement
Informed Consent Statement
Data Availability Statement
Conflicts of Interest
Abbreviations
| AChE | Acetylcholinesterase enzyme |
| ACPH | Acephate |
| AMT | Azamethiphos |
| AZOS | Azinphos methyl |
| CLP | Chlorpyrifos |
| CPD | 3,5,6–trichloro-2-pyridinol |
| DEME | Demeton-S-methyl sulfone |
| DIA | Diazinon |
| DIME | Dimethoate |
| EU | European union |
| ETHI | Ethion |
| FLOX | 9-Fluorenone oxime |
| GC | Gas chromatography |
| HPLC | High performance liquid chromatography |
| LOD | Limit of detection |
| MALA | Malathion |
| MIP | Molecular imprinted polymers |
| MOF | Metal organic frameworks |
| MDPI | Multidisciplinary Digital Publishing Institute |
| MS | Mass spectrometry |
| OP | Organophosphate |
| P4 | Phosphazene base P4-t-Bu |
| PARA | Parathion |
| PCL | Picloram |
| PDDA | Poly (diallyl-dimethylammonium chloride) |
| PHAE | Phorate |
| PHET | Phosmet |
| SERS | Surface enhance Raman scattering |
| SPR | Surface plasmon resonance |
| QD | Quantum dots |
| TCL | Trichlorfon |
References
- Itsoponpan, T.; Thanachayanont, C.; Hasin, P. Sponge-like CuInS2 microspheres on reduced graphene oxide as an electrocatalyst to construct an immobilized acetylcholinesterase electrochemical biosensor for chlorpyrifos detection in vegetables. Sens. Actuators B Chem. 2021, 337, 129775. [Google Scholar] [CrossRef]
- Yuan, S.; Yang, F.; Yu, H.; Xie, Y.; Guo, Y.; Yao, W. Degradation mechanism and toxicity assessment of chlorpyrifos in milk by combined ultrasound and ultraviolet treatment. Food Chem. 2022, 383, 132550. [Google Scholar] [CrossRef] [PubMed]
- Fournier, D.; Mutero, A. Modification of acetylcholinesterase as a mechanism of resistance to insecticides. Comp. Biochem. Physiol. C Pharmacol. Toxicol. Endocrinol. 1994, 108, 19–31. [Google Scholar] [CrossRef]
- Colovic, M.B.; Krstic, D.Z.; Lazarevic-Pasti, T.D.; Bondzic, A.M.; Vasic, V.M. Acetylcholinesterase Inhibitors: Pharmacology and Toxicology. Curr. Neuropharmacol. 2013, 11, 315–335. [Google Scholar] [CrossRef]
- Masson, P.; Lockridge, O. Butyrylcholinesterase for protection from organophosphorus poisons: Catalytic complexities and hysteretic behavior. Arch. Biochem. Biophys. 2010, 494, 107–120. [Google Scholar] [CrossRef]
- Raveh, L.; Grunwald, J.; Marcus, D.; Papier, Y.; Cohen, E.; Ashani, Y. Human butyrylcholinesterase as a general prophylactic antidote for nerve agent toxicity. Biochem. Pharmacol. 1993, 45, 2465–2474. [Google Scholar] [CrossRef]
- Wołejko, E.; Łozowicka, B.; Jabłońska-Trypuć, A.; Pietruszyńska, M.; Wydro, U. Chlorpyrifos Occurrence and Toxicological Risk Assessment: A Review. Int. J. Environ. Res. Public Health 2022, 19, 12209. [Google Scholar] [CrossRef]
- Li, W.; Chen, J.; Linli, F.; Chen, X.; Huang, Y.; Yang, X. Organophosphorus pesticide contaminants in fruits and vegetables: A meta-analysis. Food Chem. X 2023, 20, 101014. [Google Scholar] [CrossRef]
- John, E.M.; Shaike, J.M. Chlorpyrifos: Pollution and remediation. Environ. Chem. Lett. 2015, 13, 269–291. [Google Scholar] [CrossRef]
- Directorate-General for Agriculture and Rural Development, “EU Agri-Food Exports Keep Growing Steadily in the First Quarter”. Available online: https://agriculture.ec.europa.eu/news/eu-agri-food-exports-keep-growing-steadily-first-quarter-2024-06-25_en (accessed on 8 October 2024).
- Xu, Q.; Guo, X.; Xu, L.; Ying, Y.; Wu, Y.; Wen, Y.; Yang, H. Template-free synthesis of SERS-active gold nanopopcorn for rapid detection of chlorpyrifos residues. Sens. Actuators B Chem. 2017, 241, 1008–1013. [Google Scholar] [CrossRef]
- Li, Q.; Dou, X.; Zhang, L.; Zhao, X.; Luo, J.; Yang, M. Oriented assembly of surface plasmon resonance biosensor through staphylococcal protein A for the chlorpyrifos detection. Anal. Bioanal. Chem. 2019, 411, 6057–6066. [Google Scholar] [CrossRef] [PubMed]
- Tao, X.; Mao, Y.; Alam, S.; Wang, A.; Qi, X.; Zheng, S.; Jiang, C.; Chen, S.-Y.; Lu, H. Sensitive fluorescence detection of glyphosate and glufosinate ammonium pesticides by purine-hydrazone-Cu2+ complex. Spectrochim. Acta A Mol. Biomol. Spectrosc. 2024, 314, 124226. [Google Scholar] [CrossRef]
- Carullo, P.; Cetrangolo, G.; Mandrich, L.; Manco, G.; Febbraio, F. Fluorescence Spectroscopy Approaches for the Development of a Real-Time Organophosphate Detection System Using an Enzymatic Sensor. Sensors 2015, 15, 3932–3951. [Google Scholar] [CrossRef]
- Azab, H.A.; Khairy, G.M.; Kamel, R.M. Time-resolved fluorescence sensing of pesticides chlorpyrifos, crotoxyphos and endosulfan by the luminescent Eu(III)–8-allyl-3-carboxycoumarin probe. Spectrochim. Acta A Mol. Biomol. Spectrosc. 2015, 148, 114–124. [Google Scholar] [CrossRef]
- Zhang, M.; Chen, Z.; Liu, X.; Song, C.; Zeng, C.; Lv, T.; Xu, Z.; Chen, X.; Wang, L.; Liu, B.; et al. Dual-mode supramolecular fluorescent probe for rapid and on-site detection of chlorpyrifos in the environment. J. Hazard. Mater. 2023, 452, 131177. [Google Scholar] [CrossRef]
- Dou, X.; Zhang, L.; Liu, C.; Li, Q.; Luo, J.; Yang, M. Fluorometric competitive immunoassay for chlorpyrifos using rhodamine-modified gold nanoparticles as a label. Microchim. Acta 2018, 185, 41. [Google Scholar] [CrossRef]
- Xu, Z.-H.; Liu, J.; Li, B.; Wang, J.-K.; Zeng, X.; Chen, Z.-J.; Hongsibsong, S.; Huang, W.; Lei, H.-T.; Sun, Y.-M.; et al. The Simultaneous Determination of Chlorpyrifos–Ethyl and –Methyl with a New Format of Fluorescence-Based Immunochromatographic Assay. Biosensors 2022, 12, 1006. [Google Scholar] [CrossRef] [PubMed]
- Dey, P.C.; Das, R. Ligand free surface of CdS nanoparticles enhances the energy transfer efficiency on interacting with Eosin Y dye – Helping in the sensing of very low level of chlorpyrifos in water. Spectrochim. Acta A Mol. Biomol. Spectrosc. 2019, 207, 156–163. [Google Scholar] [CrossRef]
- Zhang, H.; Wang, P.; Zhou, Q.; Wang, Y. A Novel Method for the Detection of Chlorpyrifos by Combining Quantum Dot-labeled Molecularly Imprinted Polymer with Flow Cytometry. Anal. Lett. 2018, 51, 921–934. [Google Scholar] [CrossRef]
- Liu, Q.; Wang, H.; Han, P.; Feng, X. Fluorescent aptasensing of chlorpyrifos based on the assembly of cationic conjugated polymer-aggregated gold nanoparticles and luminescent metal–organic frameworks. Analyst 2019, 144, 6025–6032. [Google Scholar] [CrossRef]
- Kuznetsova, D.A.; Gaynanova, G.A.; Vasilieva, E.A.; Pavlov, R.V.; Zueva, I.V.; Babaev, V.M.; Kuznetsov, D.M.; Voloshina, A.D.; Petrov, K.A.; Zakharova, L.Y.; et al. Oxime Therapy for Brain AChE Reactivation and Neuroprotection after Organophosphate Poisoning. Pharmaceutics 2022, 14, 1950. [Google Scholar] [CrossRef] [PubMed]
- Maynard, R.L.; Chilcott, R.P. Toxicology of Chemical Warfare Agents. In General, Applied and Systems Toxicology; Wiley: Hoboken, NJ, USA, 2009. [Google Scholar] [CrossRef]
- Walton, I.; Davis, M.; Munro, L.; Catalano, V.J.; Cragg, P.J.; Huggins, M.T.; Wallace, K.J. A Fluorescent Dipyrrinone Oxime for the Detection of Pesticides and Other Organophosphates. Org. Lett. 2012, 14, 2686–2689. [Google Scholar] [CrossRef] [PubMed]
- Lee, J.Y.; Lee, Y.H.; Byun, Y.G. Detection of Chemical Warfare Nerve Agents via a Beckmann Fragmentation of Aldoxime. Phosphorus Sulfur. Silicon Relat. Elem. 2012, 187, 641–649. [Google Scholar] [CrossRef]
- Cai, Y.-C.; Li, C.; Song, Q.-H. Selective and visual detection of a nerve agent mimic by phosphorylation and protonation of quinolin oximes. J. Mater. Chem. C Mater. 2017, 5, 7337–7343. [Google Scholar] [CrossRef]
- Çubuk, S.; Yetimoğlu, E.K.; Çalışkan, A.; Kahraman, M.V. A novel polymer based fluorimetric sensor for fast and selective determination of chlorpyrifos. Microchem. J. 2021, 165, 106098. [Google Scholar] [CrossRef]
- Ghosh, S.; Gul, A.R.; Park, C.Y.; Kim, M.W.; Xu, P.; Baek, S.H.; Bhamore, J.R.; Kailasa, S.K.; Park, T.J. Facile synthesis of carbon dots from Tagetes erecta as a precursor for determination of chlorpyrifos via fluorescence turn-off and quinalphos via fluorescence turn-on mechanisms. Chemosphere 2021, 279, 130515. [Google Scholar] [CrossRef]
- Tang, Z.; Chen, Z.; Li, G.; Hu, Y. Multicolor nitrogen dots for rapid detection of thiram and chlorpyrifos in fruit and vegetable samples. Anal. Chim. Acta 2020, 1136, 72–81. [Google Scholar] [CrossRef]
- Ren, X.; Liu, H.; Chen, L. Fluorescent detection of chlorpyrifos using Mn(II)-doped ZnS quantum dots coated with a molecularly imprinted polymer. Microchim. Acta 2015, 182, 193–200. [Google Scholar] [CrossRef]
- Liu, B.; McConnell, L.L.; Torrents, A. Hydrolysis of chlorpyrifos in natural waters of the Chesapeake Bay. Chemosphere 2001, 44, 1315–1323. [Google Scholar] [CrossRef]
- Kalinke, N.; Stopper, P.; Völkl, L.; Diehl, F.; Huhn, C. SWIEET—A salt-free alternative to QuEChERS. Anal. Bioanal. Chem. 2024, 416, 6387–6403. [Google Scholar] [CrossRef]
- Yoshihara, K.; Kearns, D.R. Spectroscopic Properties of the Lower-Lying Excited States of Fluorenone. J. Chem. Phys. 1966, 45, 1991–1999. [Google Scholar] [CrossRef]
- Hewage, H.S.; Wallace, K.J.; Anslyn, E.V. Novel chemiluminescent detection of chemical warfare simulant. Chem. Commun. 2007, 3909–3911. [Google Scholar] [CrossRef] [PubMed]
- Wallace, K.J.; Fagbemi, R.I.; Folmer-Andersen, F.J.; Morey, J.; Lynth, V.M.; Anslyn, E.V. Detection of chemical warfare simulants by phosphorylation of a coumarin oximate. Chem. Commun. 2006, 3886–3888. [Google Scholar] [CrossRef]
- Qin, T.; Huang, Y.; Zhu, K.; Wang, J.; Pan, C.; Liu, B.; Wang, L. A flavonoid-based fluorescent test strip for sensitive and selective detection of a gaseous nerve agent simulant. Anal. Chim. Acta 2019, 1076, 125–130. [Google Scholar] [CrossRef]
- Jang, Y.J.; Tsay, O.G.; Murale, D.P.; Jeong, J.A.; Segev, A.; Churchill, D.G. Novel and selective detection of Tabun mimics. Chem. Commun. 2014, 50, 7531–7534. [Google Scholar] [CrossRef]
- Dale, T.J.; Rebek, J. Hydroxy Oximes as Organophosphorus Nerve Agent Sensors. Angew. Chem. Int. Ed. 2009, 48, 7850–7852. [Google Scholar] [CrossRef]
- Donà, E.; Mohr, G.J.; Lobnik, A. Dimethoate detection through a fluorescent coumarin dye. Microchem. J. 2024, 207, 112205. [Google Scholar] [CrossRef]
- Niu, H.; Liu, J.; O’Connor, H.M.; Gunnlaugsson, T.; James, T.D.; Zhang, H. Photoinduced electron transfer (PeT) based fluorescent probes for cellular imaging and disease therapy. Chem. Soc. Rev. 2023, 52, 2322–2357. [Google Scholar] [CrossRef]
- Yu, J.; Lu, M. Copper(II)-promoted direct conversion of methylarenes into aromatic oximes. Org. Biomol. Chem. 2015, 13, 7397–7401. [Google Scholar] [CrossRef]
- Schwesinger, R.; Kondo, Y. Phosphazene Base P4-t-Bu. In Encyclopedia of Reagents for Organic Synthesis; John Wiley & Sons, Ltd.: Chichester, UK, 2010. [Google Scholar] [CrossRef]
- Shamsipur, M.; Sarkouhi, M.; Hassan, J. Selective Monitoring of Organophosphorus Pesticides by 31P-NMR Spectroscopy: Application to Purity Assay of Technical Products and Concentration Determination of Formulated Samples. Appl. Magn. Reson. 2012, 42, 227–237. [Google Scholar] [CrossRef]
- Dahiya, V.; Chaubey, B.; Dhaharwal, A.K.; Pal, S. Solvent-dependent binding interactions of the organophosphate pesticide, chlorpyrifos (CPF), and its metabolite, 3,5,6-trichloro-2-pyridinol (TCPy), with Bovine Serum Albumin (BSA): A comparative fluorescence quenching analysis. Pestic. Biochem. Physiol. 2017, 139, 92–100. [Google Scholar] [CrossRef] [PubMed]
- Žabar, R.; Sarakha, M.; Lebedev, A.T.; Polyakova, O.V.; Trebše, P. Photochemical fate and photocatalysis of 3,5,6-trichloro-2-pyridinol, degradation product of chlorpyrifos. Chemosphere 2016, 144, 615–620. [Google Scholar] [CrossRef] [PubMed]
- Gentili, P.L.; Ortica, F.; Romani, A.; Favaro, G. Effects of Proximity on the Relaxation Dynamics of Flindersine and 6(5 H.)-Phenanthridinone. J. Phys. Chem. A 2007, 111, 193–200. [Google Scholar] [CrossRef] [PubMed]
- Ghani, S.B.A.; Hanafi, A.H. QuEChERS method combined with GC-MS for pesticide residues determination in water. J. Anal. Chem. 2016, 71, 508–512. [Google Scholar] [CrossRef]
- Condra, L.W. DoE in product design. In Reliability Improvement with Design of Experiments; CRC Press: Boca Raton, FL, USA, 2018; pp. 105–120. [Google Scholar] [CrossRef]
Disclaimer/Publisher’s Note: The statements, opinions and data contained in all publications are solely those of the individual author(s) and contributor(s) and not of MDPI and/or the editor(s). MDPI and/or the editor(s) disclaim responsibility for any injury to people or property resulting from any ideas, methods, instructions or products referred to in the content. |
© 2025 by the authors. Licensee MDPI, Basel, Switzerland. This article is an open access article distributed under the terms and conditions of the Creative Commons Attribution (CC BY) license (https://creativecommons.org/licenses/by/4.0/).
Share and Cite
Donà, E.; Lobnik, A. Chlorpyrifos Detection Based on 9-Fluorenone Oxime. Chemosensors 2025, 13, 170. https://doi.org/10.3390/chemosensors13050170
Donà E, Lobnik A. Chlorpyrifos Detection Based on 9-Fluorenone Oxime. Chemosensors. 2025; 13(5):170. https://doi.org/10.3390/chemosensors13050170
Chicago/Turabian StyleDonà, Edoardo, and Aleksandra Lobnik. 2025. "Chlorpyrifos Detection Based on 9-Fluorenone Oxime" Chemosensors 13, no. 5: 170. https://doi.org/10.3390/chemosensors13050170
APA StyleDonà, E., & Lobnik, A. (2025). Chlorpyrifos Detection Based on 9-Fluorenone Oxime. Chemosensors, 13(5), 170. https://doi.org/10.3390/chemosensors13050170